Cortical Gyrification Morphology in Individuals with ASD and ADHD across the Lifespan: A Systematic Review and Meta-Analysis
←
→
Page content transcription
If your browser does not render page correctly, please read the page content below
Cerebral Cortex, May 2021;31: 2653–2669

                                                                               doi: 10.1093/cercor/bhaa381
                                                                               Advance Access Publication Date: 31 December 2020
                                                                               Original Article

ORIGINAL ARTICLE

Cortical Gyrification Morphology in Individuals
with ASD and ADHD across the Lifespan:

                                                                                                                                                         Downloaded from https://academic.oup.com/cercor/article/31/5/2653/6056290 by guest on 24 April 2021
A Systematic Review and Meta-Analysis
Avideh Gharehgazlou1,2 , Carina Freitas1,2 , Stephanie H. Ameis3,4,5 ,
Margot J. Taylor2,3,7,8 , Jason P. Lerch3,9,10 , Joaquim Radua11,12,13 and
Evdokia Anagnostou1,2,3,6
1 Bloorview  Research Institute, Holland Bloorview Kids Rehabilitation Hospital, Toronto, ON, Canada, 2 Faculty
of Medicine, Institute of Medical Science, University of Toronto, Toronto, ON, Canada, 3 Neuroscience & Mental
Health Program, Hospital for Sick Children Research Institute, Toronto, ON, Canada, 4 The Margaret and
Wallace McCain Centre for Child, Youth, & Family Mental Health, Campbell Family Mental Health Research
Institute, The Centre for Addiction and Mental Health, Toronto, ON, Canada, 5 Department of Psychiatry,
University of Toronto, Toronto, ON, Canada, 6 Department of Pediatrics, University of Toronto, Toronto, ON,
Canada, 7 Diagnostic Imaging, The Hospital for Sick Children, Toronto, ON, Canada, 8 Department of Medical
Imaging, University of Toronto, Toronto, ON, Canada, 9 Department of Medical Biophysics, University of
Toronto, Toronto, ON, Canada, 10 Wellcome Centre for Integrative Neuroimaging, FMRIB, Nuffield Department
of Clinical Neuroscience, University of Oxford, Oxford, UK, 11 Imaging Mood- and Anxiety-Related Disorders
(IMARD) Group, Institut d’Investigacions Biomèdiques August Pi i Sunyer (IDIBAPS), Mental Health Research
Networking Center (CIBERSAM), Barcelona, Spain, 12 Centre for Psychiatric Research and Education,
Department of Clinical Neuroscience, Karolinska Institute, Stockholm, Sweden and 13 Early Psychosis:
Interventions and Clinical-detection (EPIC) Lab, Department of Psychosis Studies, Institute of Psychiatry,
Psychology and Neuroscience, King’s College London, London, UK
Address correspondence to Avideh Gharehgazlou, Faculty of Medicine, Institute of Medical Science, University of Toronto, 1 King’s College Circle,
Toronto, ON M5S 1A8, Canada. Email: avideh.gharehgazlou@mail.utoronto.ca.

Abstract
Autism spectrum disorder (ASD) and attention-deficit hyperactivity disorder (ADHD) are common neurodevelopmental
disorders (NDDs) that may impact brain maturation. A number of studies have examined cortical gyrification morphology
in both NDDs. Here we review and when possible pool their results to better understand the shared and potentially
disorder-specific gyrification features. We searched MEDLINE, PsycINFO, and EMBASE databases, and 24 and 10 studies met
the criteria to be included in the systematic review and meta-analysis portions, respectively. Meta-analysis of local
Gyrification Index (lGI) findings across ASD studies was conducted with SDM software adapted for surface-based
morphometry studies. Meta-regressions were used to explore effects of age, sex, and sample size on gyrification
differences. There were no significant differences in gyrification across groups. Qualitative synthesis of remaining ASD
studies highlighted heterogeneity in findings. Large-scale ADHD studies reported no differences in gyrification between

© The Author(s) 2020. Published by Oxford University Press. All rights reserved. For permissions, please e-mail: journals.permissions@oup.com
This is an Open Access article distributed under the terms of the Creative Commons Attribution-NonCommercial License (http://creativecommons.org/
licenses/by-nc/4.0/), which permits non-commercial re-use, distribution, and reproduction in any medium, provided the original work is properly cited.
For commercial re-use, please contact journals.permissions@oup.com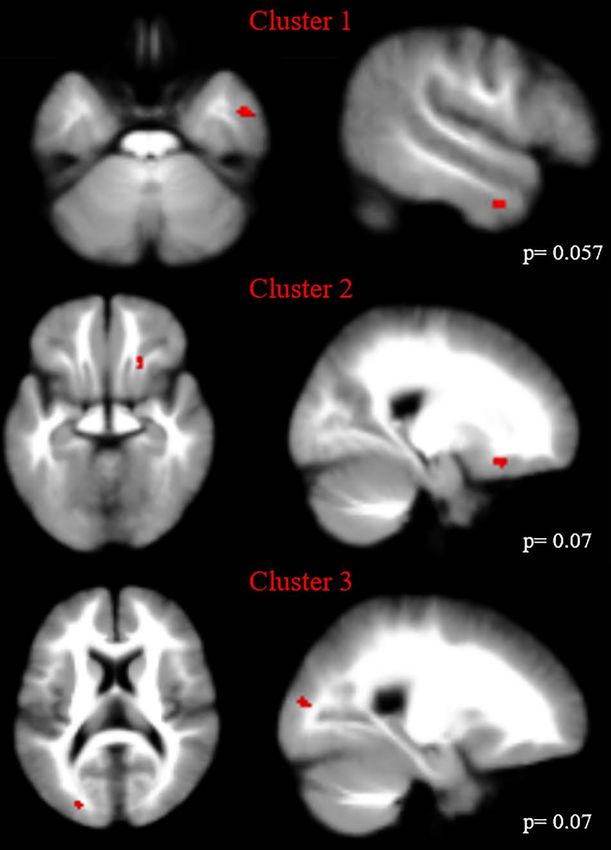
2654      Cerebral Cortex, 2021, Vol. 31, No. 5

cases and controls suggesting that, similar to ASD, there is currently no evidence of differences in gyrification morphology
compared with controls. Larger, longitudinal studies are needed to further clarify the effects of age, sex, and IQ on cortical
gyrification in these NDDs.

Key words: attention-deficit hyperactivity disorder, autism spectrum disorder, cortical gyrification, lGI, structural MRI

Introduction
Autism spectrum disorder (ASD) and attention-deficit hyper-             surface area development and its downstream effects, hence
activity disorder (ADHD) are relatively common neurodevel-              gyrification, in the pathophysiology of ASD and related condi-
opmental disorders (NDDs), with prevalence rates of 1.5% and            tions. Furthermore, surface-based morphometry (SBM) studies
5.3%, respectively (Hoogman et al. 2017; Li et al. 2017). The core      reporting atypicalities in individuals with ASD in gyrification,

                                                                                                                                               Downloaded from https://academic.oup.com/cercor/article/31/5/2653/6056290 by guest on 24 April 2021
symptoms of ASD are social communication impairments and                but not other SBM measures in children (Yang et al. 2016),
repetitive and restricted behaviors and interests, while ADHD           adolescents (Kohli et al. 2018), and middle-aged (Kohli et al. 2019)
is defined by age-inappropriate inattentiveness, impulsivity,           cohorts, suggest that gyrification may be a sensitive measure of
and hyperactivity (American Psychiatric Association 2013). Both         atypicalities in the cortical macrostructure of ASD.
NDDs present with symptoms in early childhood (Lainhart 2015;               Numerous theories regarding the formation of gyrification
Hoogman et al. 2017; Li et al. 2017), are more prevalent among          in brain development have been posed. Earlier theories
males (M:F ratio of 3–4:1 (Willcutt 2012; Ofner et al. 2018), and       postulated that folding of the cortex was due primarily to
are highly heritable (Folstein and Rutter 1977; Steffenburg et al.      external constraints, specifically the limited space of the
1989; Faraone et al. 2005).                                             skull, placed upon the rapidly increasing surface area in early
    A shared etiological pathway in ASD and ADHD has been               brain development (Le Gros Clark 1945). Alternatively, the
suggested given high comorbidity (Lim et al. 2015; Antshel              tension-based hypothesis postulates that tension along axons,
et al. 2016) and phenotypic overlap (Van der Meer et al. 2012).         connecting neighboring neurons, in early development results
Shared genetic susceptibility is suggested as later-born siblings       in strongly interconnected regions being pulled towards one
of children with ASD and ADHD are more likely to have either            another and less interconnected regions being drawn apart,
NDD compared with siblings of non-diagnosed children (Miller            resulting in the emergence of gyri and sulci (Van Essen 1997).
et al. 2019). Shared genetic susceptibility is further supported by     According to other theories, the differential surface expansion
at least some shared risk genes affecting various early neuronal        of the cortex is the primary mechanism driving gyrification
processes (Williams et al. 2012), including neuronal migration          either through radial or tangential non-uniform expansion.
(Lionel et al. 2014), cell division, and response to medications        Specifically, the radial expansion hypothesis postulates that
(Martin et al. 2014), suggesting that early differences in brain        the formation of gyrification may be explained by the increased
development may confer risk for both disorders. In line with            speed of tangential expansion of outer compared with inner
this possibility, neuroimaging studies have focused on charac-          cortical layers during brain development (Richman et al. 1975),
terizing aspects of cortical morphology across conditions. Gray         while a more recent theory, the differential tangential expansion
matter alterations have been found across these disorders               hypothesis, proposes that regional differences in tangential
implicating both cortical thickness and subcortical volumes             surface expansion of the cortex, driven primarily by underlying
(Hoogman et al. 2017; van Rooij et al. 2018).                           cytoarchitecture, results in pattern-specific folding (Ronan et al.
    Possibly as a consequence of the growing surface area, the          2014). Other theories have also been proposed based on variation
cortex begins to fold prenatally (Chi et al. 1977) and transforms       of the themes described above but there is not yet consensus on
from a lissencephalic state into a gyrencephalic structure mainly       which theory best accounts for gyrification in early development
during the third trimester of fetal life, a period of remarkable        (for extensive reviews, please see Bayly et al. 2014; Ronan and
brain growth (White et al. 2010). Specifically, primary and sec-        Fletcher 2015; Striedter et al. 2015; Fernandez et al. 2016; Kroenke
ondary sulci begin to appear at ontogenetic weeks 16 and 32             and Bayly 2018).
respectively, and tertiary sulci first appear from the 36th ontoge-         Cortical gyral and sulcal patterns are affected by both genetic
netic week but are found to mainly occur after birth (Armstrong         and non-genetic factors, compared with cerebral volume which
et al. 1995). Cortical gyrification, which refers to the characteris-   is almost entirely under genetic control (White et al. 2002;
tic folds and grooves (sulci) on the surface of the cortex, reaches     Kremen et al. 2010). In support of the genetic control model,
its peak development during toddlerhood, evident through both           a recent large-scale normative twin study reported high
global and widespread local increases with larger growth rates          heritability in the degree of gyrification, measured through the
in the first year of life compared with the second (Li et al.           Gyrification Index, or GI (Docherty et al. 2015). On the other hand,
2014), and gradually declines thereafter in typically developing        high correlations in brain volume but somewhat more modest
(TD) children (Raznahan et al. 2011). Considering the timing of         correlations in gyral (r = 0.63) and sulcal (r = 0.58) curvature and
onset of ASD and ADHD symptoms in early childhood and peak              surface complexity (r = 0.49) (except for depth r = 0.84) were
gyrification expansion in early development, examination of             reported among monozygotic (MZ) twins, compared with pairs
gyrification in these NDDs may provide important insights into          of unrelated controls by White et al. (2002), Pearson’s correlation
pathophysiology and/or contributing etiopathological factors. A         coefficients for control group: gyral (r = 0.14) and sulcal
recent finding implicating greater surface area expansion in            (r = −0.05) curvature, surface complexity (r = −0.16), and cortical
infants at high risk of developing ASD compared with TD peers           depth (r = 0.21). Interestingly, Lohmann et al. (1999) reported
(Hazlett et al. 2017) highlights the importance of investigating        greater variability in twins in shallow and later-developing sulci
Cortical Gyrification Morphology in ASD and ADHD Across the Lifespan Gharehgazlou et al. 2655
compared with deep and early-developing sulci, suggesting of life compared with the second (Li et al. 2014). Modifications
stronger genetic contributions on deep sulci as opposed to of gyrification continue during adolescence with reports of
shallow folds, in which environmental factors may also play reduced gyrification (Klein et al. 2014). Studies of aging also
an important role. This finding has obvious implications for report age-related decrease in gyrification (Hogstrom et al.
heritability estimates in studies measuring different gyrification 2013). It is worth noting that increases or decreases detected
constructs. Studies exploring environmental factors suggest by either GI or lGI reflect an increase or decrease in the amount
that nutritional status (Bernardoni et al. 2018), other drug expo- of cortex buried within sulci compared with exposed on the
sures (e.g., cannabis in adolescence and early adulthood, Mata gyral surface, rather than suggesting the emergence of new gyri
et al. 2010), and prenatal exposures (e.g., alcohol exposure, Kuhn or the disappearance of existing ones. Interestingly, Brun et al.
et al. 2016) affect gyrification. The impact of genetic and envi- (2016) report a stable number of sulcal pits within deep folds
ronmental factors also seem to be evident in individuals with but an age-related increase in shallow folds, regardless of ASD
ASD, as low concordance rates of gyrification have been found diagnosis, suggesting that age-related increase in gyrification
between MZ twins, in which at least one twin has an ASD diag- observed in TD (Li et al. 2014) may be primarily driven by shallow
nosis (Kates et al. 2009), despite the presence of high rates of con- folds.
Downloaded from https://academic.oup.com/cercor/article/31/5/2653/6056290 by guest on 24 April 2021
cordance in volume within the same cohort (Kates et al. 2004). Gyrification development undergoes a sexually dimorphic
Understanding the differences between gyrification modal- course in TD with reports of greater degrees of gyrification in
ities is important for gaining insight into biological con- males compared with females (Raznahan et al. 2011) in both
structs involved and factors that influence them. As such, children (n = 662) and adults (n = 440; Gregory et al. 2016), as well
Supplementary Table 4 provides brief descriptions of several as greater age-related decrease in lGI in TD males relative to
gyrification modalities to facilitate interpretation. Gyrification females (Mutlu et al. 2013).
can be studied both qualitatively and quantitatively: qualitative In the current review we 1) quantitatively synthesize evi-
visual comparisons of gyral and sulcal patterns allow the detec- dence related to local gyrification (lGI) when it is feasible; 2) qual-
tion of differences in locations and patterns of gyrification, while itatively synthesize findings of gyrification in ASD and ADHD
more recently reported metrics allow for the quantification where quantitative synthesis is not feasible; and 3) quantita-
of the degree of gyrification at global or local scales. Both tively and qualitatively explore the effects of age, sex, and sam-
quantitative and qualitative measures are important as they ple size on gyrification in ASD and ADHD. Given the generally
provide complementary information in that it may be possible small sample sizes in the ASD and ADHD gyrification litera-
to have the same gyral and sulcal patterns but differing degrees ture, we conducted a meta-analysis to address the limitation of
of gyrification, or vice versa. An example of a quantitative insufficient statistical power in the field.
measure is the local Gyrification Index (lGI), an extension of
the 2D GI measure, which quantifies the degree of gyrification
locally, rather than globally, by estimating the amount of cortex
Materials and Methods
hidden within sulci (Schaer et al. 2008, 2012) while taking into Guidelines of Preferred Reporting Items for Systematic Reviews
consideration the 3D nature of the brain; an lGI of 5 indicates and Meta-Analyses (PRISMA) were implemented. The system-
five times more cortex buried within sulci relative to that which atic search for relevant studies was conducted on MEDLINE (Ovid
is exposed in a particular region, while an lGI of 1 represents MEDLINE: Epub Ahead of Print, In-Process & Other Non-Indexed
a smooth cortex. Due to the similarity between these two Citations, Ovid MEDLINE Daily and Ovid MEDLINE), PsycINFO
measures (i.e., lGI and GI), and given the small number of studies and EMBASE (Embase Classic + Embase) databases. The search
that have examined other subtle sulcal characteristics in ASD words used are listed in Supplementary Table 1. The original
(depth: 8; length: 2; pit: 1; curvature: 1) and ADHD (folding index: search was conducted in June 2017, and an additional search was
1; curvature: 1; depth: 1; length: 1), in the current manuscript conducted in March 2019 using the same search words to update
we synthesize the data from studies computing lGI (ASD: 13; our literature search prior to publication. All searches were
ADHD: 2) and GI (ASD: 5; ADHD: 2) measures and provide conducted using OVID technologies, Wolters Kluwer Health.
results of the remaining studies in supplemental materials The inclusion criteria were studies with human participants
(Supplementary Tables 9 and 10, also Supplementary Tables 7 and published in the English language in scientific journals
and 8 for participant demographics of these studies). We also between years 2007 to 2019 with a minimum number of 10
discuss Sulcal Index (SI) findings (n = 2 ASD) as this metric is participants per group. We excluded review papers, disserta-
also an area measurement, thus related to lGI and GI (Auzias tions, conference papers, editorials, commentaries, and letters.
et al. 2014). We focused our meta-analytic efforts on studies that locally
There are well-known sex and age interactions with other quantified the degree of gyrification (lGI), either reported or
metrics of brain structure in individuals with ASD (Sussman provided in response to requests to authors, peak coordinates of
et al. 2015) and ADHD (Onnink et al. 2014; Hoogman et al. clusters for between-group differences, and undertook a whole-
2017). As such, these variables are important to consider when brain approach (for a consistent thresholding across the brain,
studying gyrification as well. eliminating bias towards regions attributed liberal thresholds).
As discussed above, age-related changes in gyrification We set the criteria for performing a quantitative synthesis as
across the lifespan is well documented in TD. Similar to devel- the availability of a minimum of 10 studies computing the lGI
opmental trajectories of other metrics of cortical gray matter measure. As a result, lGI ADHD studies (n = 2) did not meet this
(volume, thickness, and surface area), cortical gyrification inclusion criteria and were thus only qualitatively synthesized.
follows an inverted-U developmental trajectory by reaching However, lGI ASD studies (n = 13) did meet this inclusion cri-
its peak development during toddlerhood and gradually teria and thus were included in the meta-analysis and meta-
decreasing thereafter (Raznahan et al. 2011). There are global, regressions. The remaining ASD studies (computing the GI and
and widespread local, age-related increases in gyrification SI measures) were qualitatively synthesized. The meta-analysis
during toddlerhood, with larger growth rates in the first year does not include results from replicate samples (Kohli et al.2656 Cerebral Cortex, 2021, Vol. 31, No. 5
Downloaded from https://academic.oup.com/cercor/article/31/5/2653/6056290 by guest on 24 April 2021
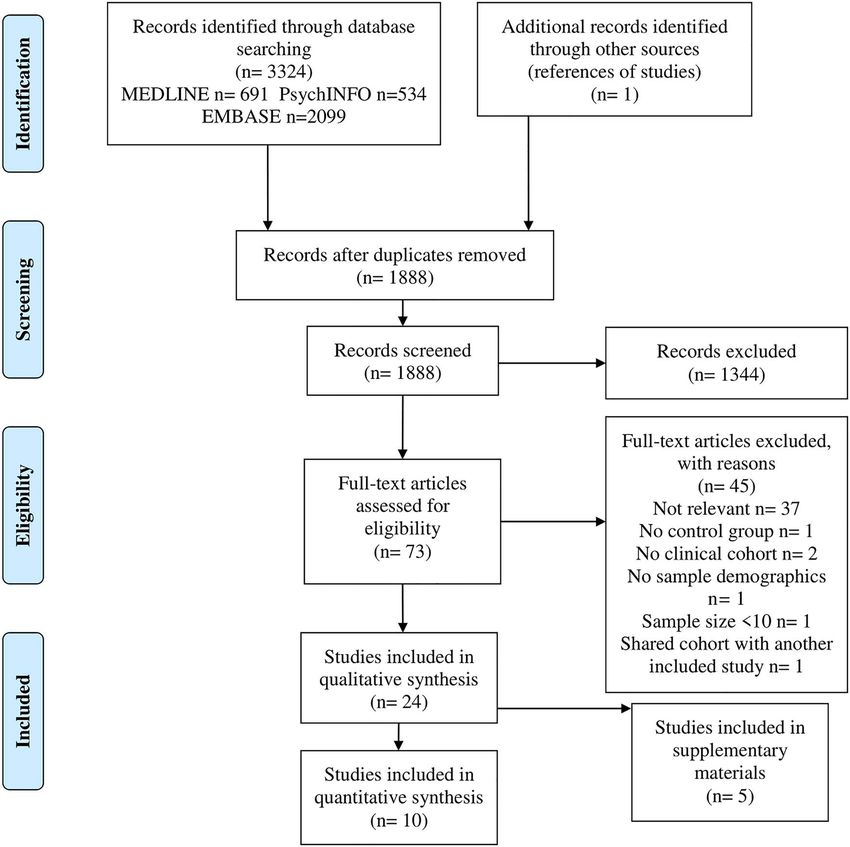
Figure 1. Procedure of screening papers for eligibility based on PRISMA 2009 Flow Diagram (from Moher et al. 2009).
2018) and only includes results from the first time point in (i.e., subcortical and cortical regions; details regarding the
longitudinal data (Libero et al. 2018). creation of this mask are explained in Li et al. 2019). We further
Initially, papers were screened for eligibility based on rationalize the use of SDM with our SBM data by considering that
inclusion criteria. After removing duplicates, two independent meta-analyses utilize information regarding peak coordinates
reviewers (AG and CF) examined titles and abstracts for each in a standard space, regardless of how these coordinates have
paper and any discrepancies for eligibility determination were been obtained in the original manuscripts (i.e., through VBM
resolved by EA. Full papers were reviewed by AG and EA (Fig. 1). or SBM data). The majority of lGI studies in this review (8 out
of 13) reported peak coordinates. Three studies reported no
significant group differences in lGI (Schaer et al. 2015; Hirjak
Meta-Analysis et al. 2016; Koolschijn and Geurts 2016), and 2 studies reported
Seed-based d Mapping with Permutation of Subject Images no coordinates despite finding group differences (Libero et al.
(SDM-PSI: www.sdmproject.com) version 6.12 neuroimaging 2014; Kohli et al. 2019).
software was used. Due to lack of availability of a meta- From clusters of significant between-group differences in lGI
analytic software for use with SBM data, here, we use a voxel- in each study, we extracted peak coordinates (and converted to
based morphometry (VBM) meta-analytic software with the MNI152 space) and P-values (and converted to t-statistics when
incorporation of an appropriate gray matter mask (FreeSurfer none were already reported).
mask) created for meta-analyzing surface-based studies. Unlike SDM methodology has been described previously (Alba-
the gray matter mask in SDM, the FreeSurfer mask restricts the jes-Eizagirre et al. 2019a) and we followed the standard pipeline
meta-analysis to cortical regions as opposed to all gray matter (Albajes-Eizagirre et al. 2019b) with the only exception of the useCortical Gyrification Morphology in ASD and ADHD Across the Lifespan Gharehgazlou et al. 2657
of the FreeSurfer mask. Briefly, pre-processing was performed to
generate lowest and highest possible effect size values for each
study using peak coordinate information. Then, we imputed
multiple maps of the effect size of each study using maximum
likelihood and multiple imputation techniques. A mean analysis
was conducted to estimate the mean difference of lGI between
ASD and TD across studies by computing the meta-analytic
mean of all studies of each imputation set and then applying
Rubin’s rules to obtain a single mean map (note that the mean
map represents both negative and positive differences). The
mean map was corrected by family-wise error (FWE) through
permutation tests, generating a distribution of maximum
statistic and using it to threshold results of the main analysis
(P < 0.05, extent threshold of 10 voxels, as recommended by
Downloaded from https://academic.oup.com/cercor/article/31/5/2653/6056290 by guest on 24 April 2021
Radua et al. 2012). In the event of no statistically significant
group differences, we further explored more liberal thresholds
(P < 0.1) to enhance our understanding of possible trend-level
group differences in lGI as this is the first meta-analysis of ASD
studies focusing on gyrification morphology. The heterogeneity
of significant voxels was explored by extracting I2 statistics
(I2 > 50 is evidence of high heterogeneity).
Meta-Regression
We also explored the potential effects of age, sex, and sample
size of the ASD group on gyrification differences in separate
meta-regressions, to further understand the heterogeneity of
findings. Correction was implemented (FWE) with the same
threshold as the main analysis (P < 0.05). We explored more
liberal thresholds (P < 0.1) if no statistically significant results
were found as this is the first attempt in the ASD literature
to quantitatively explore the potential effects of age, sex, and
Figure 2. Results of the meta-analysis demonstrating greater lGI in ASD relative
sample size on gyrification differences. to TD in three clusters shown in axial and sagittal views. These clusters only
appeared with a liberal threshold (P < 0.1) and on the map of uncorrected
P values.
Results
The current review includes 24 final papers (Fig. 1): 20 ASD
(Table 1) and 4 ADHD (Table 2) studies. Results of ASD studies
not included in the meta-analysis are qualitatively reviewed
(including lGI studies excluded from the meta-analysis due to
not taking a whole-brain approach, Duret et al. 2018, or not
reporting or responding to our request for peak coordinates,
Libero et al. 2014 and Kohli et al. 2019). All ADHD results and
effects of variables of interest are qualitatively presented,
given the small numbers of studies and variable measures.
Results are presented for each NDD in relation to TD and only
significant findings are presented unless stated otherwise.
No single study included both ASD and ADHD participants,
Figure 3. Results of the meta-regression demonstrating a trend-level effect of sex
thus we attempted no direct comparisons between NDD
(P = 0.083) on gyrification in a cluster, on the map of uncorrected P values.
groups.
Quantitative Review of ASD Studies
comparison correction. However, with a more liberal threshold
Ten studies, drawn from the broader sample of the 20 ASD stud- (P < 0.1) and only on the map of uncorrected P-values, trends
ies in Table 1, utilized the lGI measure, reported peak coordinates were observed: specifically greater lGI in ASD relative to TD in
and undertook whole-brain approach and as such are included clusters located in the right temporal (P = 0.06, I2 = 0.56; clus-
in the meta-analysis (please refer to Supplementary Table 2 for ter 1 in Fig. 2), right frontal (P = 0.07, I2 = 25.56; cluster 2 in
imaging parameters of all ASD studies). Three studies reported Fig. 2) and left occipital (P = 0.07; I2 = 3.06; cluster 3 in Fig. 2)
no main effect of group (Schaer et al. 2015; Hirjak et al. 2016; lobes (Supplementary Table 5). Heterogeneity of these voxels, as
Koolschijn and Geurts 2016). The overall sample of the meta- expressed with I2 statistics, represents low to moderate hetero-
analysis consisted of 977 individuals (ASD = 527; TD = 450). The geneity. The meta-regressions (n = 10 studies included) yielded
results of the meta-analysis demonstrate no statistically sig- no statistically significant effects of age, sex, or sample size.
nificant differences between ASD and TD in lGI after multiple With a more liberal threshold (P < 0.1) trends were observed2658 Cerebral Cortex, 2021, Vol. 31, No. 5
Table 1 Participant demographics (ASD studies).
First author (year) ASD [other] Controls
n M/F Age range Mean age n M/F Age range Mean age
(SD) (SD)
Kohli et al. (2019) 20 16/4 41.1–60.6 50.2 (5.9) 21 20/1 40.4–60.9 50.8 (6.9)
Duret et al. (2018) [SOD 28] [SOD 25/3] 14–30 [SOD 20.4 37 32/5 14–30 20.4 (0.68)
[nSOD 27] [nSOD 24/3] (0.78)]
[nSOD
19.8(0.79)]
∗ Kohli et al. (2018) 64 52/12 7–19 13.32 (2.65) 64 55/9 7–19 13.53 (2.95)
[+ 31] [+ 31/0] [+ 7–18] [+ 11.44 [+ 31] [+ 31/0] [+ 7–18] [+ 11.78
(2.84)] (2.57]
∗++ Libero et al. [ASD-N 88] 105/0 2.13–3.67 3.0 (5.28) 49 49/0 2.27–3.67 2.98 (4.77)
Downloaded from https://academic.oup.com/cercor/article/31/5/2653/6056290 by guest on 24 April 2021
(2018) [ASD-M17]
Maier et al. (2018) 30 19/11 21–52 35.4 (9.1) 30 19/11 22–53 35.5 (8.3)
Pappaianni et al. 39 39/0 8–11 10.10 (0.98) 42 42/0 8–11 10.39 (1.08)
(2018)
∗ Pereira et al. (2018) +++ 22 18/4 14–25 17.45 (3.29) 29 19/10 14–25 18.48 (2.82)
∗ Ecker et al. (2016) 51 51/0 18–43 26 (±7) 48 48/0 18–43 28 (±6)
∗ Hirjak et al. (2016) 16 9/7 18–35 23.56 (±4.45) 16 9/7 18–35 23.06 (±4.2)
∗ Koolschijn and 51 35/16 30.04–73.98 51.46 (12.61) 49 32/17 30.62–73.77 50.14 (11.9)
Geurts (2016)
∗ Yang et al. (2016) 60 60/0 4.49–11.99 8.35 (2.07) 41 41/0 4.75–12.16 8.83 (2.30)
Bos et al. (2015) 30 29/1 8–18 12.7 (2.5) 29 28/1 7–18 12.5 (2.8)
[+ 39] [+ 34/5] [+ 9–18] [+ 12.0 (2.6)] [+ 65] [+ 48/17] [+ 8–18] [+ 12.8(2.8]
∗ Schaer et al. (2015) 106 53/53 8.1–46.0 17.2 104 53/51 8.1–46.0 17.1 (±8.2)
(±8.4)(M) (M)
17.1 (±8.3)(F) 17.2 (±7.6)
(F)
Auzias et al. (2014) 59 59/0 1.5–9 57.4 m (19.2) 14 14/0 1.5–9 57 m (19.8)
Libero et al. (2014) 55 49/6 8–40 18.5 (0.89) 60 55/5 8–36 18.2 (0.91)
∗ Schaer et al. (2013) 11 8/3 9.3–17.4 12.9 (±2.7) 11 8/3 8.7–16.8 12.7 (±2.7)
∗ Wallace et al. (2013) 41 41/0 12–24 16.75 (2.84) 39 39/0 12–23 16.95 (2.71)
Shokouhi et al. (2012) 15 15/0 12–20 15.4 (2.2) 16 16/0 12–20 15.5 (1.6)
Casanova et al. (2009) 14 14/0 8–38 22.5 (9.9) 27 28/0 8–38 22.6 (9.9)
Kates et al. (2009) 28 24/4 5.6–13.8 8.8 (2.6) 14 12/2 5.4–13.9 8.6 (2.4)
(MZ) (S)
Note: All ages are reported in years. ASD, autism spectrum disorder; ASD-N, ASD with typical brain range; ASD-M, ASD with disproportionate megalencephaly; F,
females; M, males; MZ, monozygotic twins; nSOD, ASD without speech onset delay; S, singleton; SOD, ASD with speech onset delay; TD, typically developing; + ,
Replication sample from Autism Brain Imaging Data Exchange (ABIDE); ++ , Longitudinal study and information correspond to scan time 1; +++ , Some individuals in
the ASD group used psychoactive medications, but participants were asked not to take medication a day prior to study visit; ∗ , Included in meta-analysis.
Table 2 Participant demographics (ADHD studies).
First author (year) ADHD [other] Controls
n M/F Age range Mean age (SD) n M/F Age range Mean age (SD)
+ Ambrosino et al. 94 78/16 6–28 11.4 (2.9) 94 80/14 6–28 11.2 (4.0)
(2017)
Forde et al. (2017a) 306 208/98 6–18 17.2 (3.4) 164 87/77 6–18 16.8 (3.2)
[Sib [Sib [Sib 6–18] [Sib 17.7 (3.8)]
148] 62/86]
Mous et al. (2014) 19 16/3 12–19 15.4 23 12/11 9–19 14.8
Shaw et al. (2012) 234 151/83 5.1–18.4 ∗ 10.2 (3.3) 231 148/83 4.5–19.0 ∗ 10.6 (3.6)
Note: All ages are reported in years. ADHD, attention-deficit/hyperactivity disorder; SD, standard deviation; Sib, siblings of individuals with ADHD; + , Longitudinal
study and information correspond to scan time 1.
for the interaction of sex and diagnosis, on the map of uncor- differences may be smaller the higher the percentage of males
rected P-values, in a region close to the occipital region in the included in the ASD group.
main analysis (x: −24, y: −80, z: −12; SDM-Z: −1.39; P = 0.083, Although all studies used a whole-brain approach, Pereira
Fig. 3, Supplementary Table 6), suggesting that between-group et al. (2018) computed lGI based on ROIs rather than per vertex.Cortical Gyrification Morphology in ASD and ADHD Across the Lifespan Gharehgazlou et al. 2659
Table 3a Findings of reduced lGI in ASD; Results are significant following correction and presented as ASD versus TD.
Study Contrast Covariates Results (ASD vs. TD) P (correction)
+ Libero et al. (2018) Dx Age, Sample: N.S. differences in age. Lower ++ DQ, P < 0.05 (MCS)
TBV greater brain volume: in ASD groups (combined)
and in ASD-M versus ASD-N
ASD versus TD: Reduced lGI in caudal fusiform
gyrus (bil). ASD-N versus TD: Reduced lGI in
fusiform (bil). ASD-M versus TD: Greater lGI in
dmPFC (R), cingulate cortex (L). ASD-M versus
ASD-N: Greater lGI in paracentral,
parahippocampal (R), precentral gyri (L). N.S.
DQ-lGI relation in regions of sig. Differences in
lGI
Downloaded from https://academic.oup.com/cercor/article/31/5/2653/6056290 by guest on 24 April 2021
Change in lGI from Time 1–3: ASD-N versus
TD: Decrease in/stable lGI in TD in inferior
frontal and inferior temporal cortices, inferior
parietal lobule (R) and lingual gyrus (L) but
increased in ASD-N (except lingual gyrus).
ASD-M versus ASD-N/TD: N.S.
Libero et al. (2014) Dx Age Sample: N.S. differences in age, ¶ IQ P < 0.05 (FDR)
Reduced lGI in supramarginal gyrus (L)
Age Reduced lGI with age in precentral gyri (bil)
AgexDx Reduced lGI with age in supramarginal (L)
AgexDx N.S.
xICV
Duret et al. (2018) Dx Age Sample: Matched on age, ¶ IQ, sex. N.S. P < 0.01 (vertex-wise)
differences in TICV, age, FSIQ, PIQ
ASD-SOD versus TD and ASD-nSOD: Reduced P < 0.05 (cluster-wise)
lGI in fusiform (L). ASD-nSOD versus TD and (MCS)
ASD-SOD: Greater lGI in middle temporal gyrus
(R). N.S. group-by-difference score interaction
on lGI with cognitive strength (ASD-SOD: block
design and AS-nSOD: information) in fusiform
(L)/temporal (R)
Age Reduced lGI with age in precentral,
supramarginal, middle temporal (L), caudal and
rostral middle frontal, superior frontal,
precuneus, superior parietal, paracentral (R)
AgexDx N.S. Exploring lGI maturation in middle
temporal (R) and fusiform (L) clusters:
Interaction in temporal cluster driven by
difference in ASD-nSOD versus other groups
(increase of lGI in TD but decrease in AS-nSOD)
and fusiform area (L) driven by difference in
ASD-SOD and TD (decrease of lGI in TD and
ASD-nSOD only)
§
Kohli et al. (2019) Dx NVIQ, Sample: Matched on age, sex, race, ethnicity. P < 0.01; §§ P < 0.05 (MCS)
TBV Reduced TBV and IQ
Reduced lGI in perisylvian, ACC (bil),
postcentral, middle frontal gyri (L), OFC and
supramarginal (R)
Age Reduced lGI with age in supramarginal (R),
precentral (bil) gyri
AgexDx N.S.
Schaer et al. (2013) Dx Age, sex Sample: N.S. differences in CV. Matched on sex P < 0.05 (MCS)
and age
Reduced lGI in precentral, inferior parietal lobe,
IFG, medial parieto-occipital (R)
Note: Studies are ordered based on sample size from largest to smallest. ACC, anterior cingulate cortex; ASD-M, ASD with megalencephaly; ASD-N, ASD with typical
brain range; ASD-nSOD, ASD without speech onset delay; ASD-SOD, ASD with speech onset delay; Bil, bilateral; CV, cerebral volume; dmPFC, dorsal medial prefrontal
cortex; DQ, developmental quotient; Dx, diagnosis; FDR, false discovery rate; FSIQ, full-scale IQ; IFG, inferior frontal gyrus; L, left hemisphere; MCS, Monte Carlo
simulations; NVIQ, nonverbal IQ; N.S., no(t) significant; OFC, orbitofrontal cortex; PIQ, performance IQ; R, right hemisphere; Sig, significant; TBV, total brain volume;
TICV, total intracranial volume; VIQ, verbal IQ; + , Longitudinal study, results correspond to Time 1; ++ , Measured by Mullen Scales of Early Learning (MSEL); § ,
Cluster-forming threshold; §§ , Cluster-wise significance threshold; ¶ , Full-scale, verbal, and performance IQ.2660 Cerebral Cortex, 2021, Vol. 31, No. 5
Table 3b Findings of greater gyrification in ASD.
Study Contrast Covariates Results (ASD vs. TD) P (Correction)
Kohli et al. (2018) Dx +++ TBV, age Sample: N.S. differences in age, TBV, NVIQ ++ P < 0.01;
(in-house and ABIDE), N.S. differences in VIQ, P < 0.05 (MCS)
FSIQ in former)
In-house: Greater lGI in precentral, STG, SPL(L),
frontal pole, perisylvian/precentral, lateral OFC,
SFG (R), and reduced lGI in lingual (L). Same
results when excluding F. Few clusters not sig.
After correction in analyses without TBV as
covariate. ABIDE: Greater lGI in insula, STG (L)
AgexDx TBV In-house: Greater “-” slope in CS, lateral occipital
cortex, caudal middle frontal gyrus (R). ABIDE:
Greater “-” effect in rostral middle frontal gyri
Downloaded from https://academic.oup.com/cercor/article/31/5/2653/6056290 by guest on 24 April 2021
(bil), precuneus (L), cuneus (R)
Age In-house: Reduced lGI with age in dorsal and
medial frontal, parietal, occipital lobes (bil).
Secondary analyses (permutation testing): Only
detected main effect of age
ABIDE: Reduced lGI with age in superior frontal,
parietal to lateral occipital lobes (L) and most of
frontal, parietal, occipital lobes (R). Secondary
analyses (permutation testing): Only detected
main effect of age
¶
Yang et al. (2016) Dx Age Sample: Matched on TGMV, TWMV, SGMV, ICV, IQ P < 0.05 (MCS)
Greater lGI in inferior parietal, inferior temporal,
lingual (R), isthmus cingulate (L)
AgexDx Increase of lGI in precentral, superior parietal (L),
rostral middle frontal, gyrus, STG, pars
opercularis (R)
¶
Ecker et al. (2016) Dx Age, TSA, center, Sample: N.S. differences in age, FSIQ, TSA, TGMV, P < 0.05 (RFT)
TWMV, TBV
FSIQ, TBV Greater lGI in CS, pre/postcentral, posterior
middle frontal, supramarginal gyri (L)
N.S. differences in depth/curvature in clusters of
sig. lGI difference
Wallace et al. (2013) Dx Sample: N.S. differences in ICV P < 0.01
Greater lGI in occipital (bil), precuneus (L) (MCS)
Greater depth in occipital lobe (L) (in clusters of
sig. lGI difference)
Exploring within clusters of sig. lGI differences:
Greater SA in precuneus, greater depth in lateral
occipital (L) in ASD. Across both groups, sig.
SA-lGI relation in all clusters, but sig. depth-lGI
relation only in lateral occipital cortex (L)
+ vocabulary-lGI relation in TD. Whole-brain
analyses within TD: vocabulary-lGI relation in
inferior parietal (L). In clusters of sig. lGI
differences: vocabulary-lGI relation in occipital
(bil) in TD
N.S. differences in relation between lGI and
FSIQ/Matrix reasoning
AgexDx N.S. [age-group (17 years) by Dx. N.S.
differences in IQ in age groups]
Age “-” relation between lGI and age in frontal,
posterior temporal and parietal cortices (bil)
Pereira et al. (2018) Dx Age, total IQ (TIV in Sample: N.S. differences in age, FSIQ, PIQ, TBV, P < 0.01;
ROI analyses) TSA. Lower VIQ Bonferroni
Vertex-wise: Greater lGI in lingual, precuneus, (ROI analyses)
STS, superior parietal (R), pre/paracentral areas
(L). ROI-based: Greater lGI in pre/postcentral,
superior parietal, supramarginal (bil), frontopolar,
middle frontal (R), paracentral regions (L)
ContinuedCortical Gyrification Morphology in ASD and ADHD Across the Lifespan Gharehgazlou et al. 2661
Table 3b Continued
Study Contrast Covariates Results (ASD vs. TD) P (Correction)
Kates et al. (2009) Dx Age Sample: Sig. different in IQ + P = 0.002; 0.043
ASD and co-twins versus TD: Greater GI in Bonferroni/Dunn
parietal lobe (R) [N.S. differences in twin pairs; statistic
Sig. contribution of age]. Same results when
excluding F (but findings of co-twins not sig.). Sig.
contribution of parietal WMV (R), not GMV, to
parietal GI
“+ ” age-GI relation in cerebral (bil), parietal (L) in
ASD (magnitude not different from TD). Analyses
on subsample of discordant and concordant
co-twins: “+ ” age-GI association in temporal lobe
(R) in discordant & “-” age-GI association in
Downloaded from https://academic.oup.com/cercor/article/31/5/2653/6056290 by guest on 24 April 2021
frontal lobe (R) in concordant co-twins
“+ ” IQ-GI association in TD in cerebrum, parietal,
temporal (bil), occipital (L) lobes. “+ ” IQ-GI
association in frontal (R) lobe in discordant
unaffected co-twins
Note: Results are significant following correction and presented as ASD versus TD. Studies ordered based on sample size from largest to smallest. ASD, autism spectrum
disorder; bil, bilateral; CS, central sulcus; Dx, diagnosis; F, female; FSIQ, full-scale IQ; GI, gyrification index; GMV, gray matter volume; ICV, intracranial volume; lGI,
local gyrification index; L, left hemisphere; MCS, Monte Carlo simulations; NVIQ, nonverbal IQ; N.S., no(t) significant; OFC, orbitofrontal cortex; PIQ, performance IQ;
RFT, random field theory; R, right hemisphere; ROI, region of interest; SA, surface area; SGMV, subcortical gray matter volume; Sig, significant; SFG, superior frontal
gyrus; STG, superior temporal gyrus; STS, superior temporal sulcus; SPL, superior parietal lobule; TBV, total brain volume; TD, typically developing; TGMV, total gray
matter volume; TSA, total surface area; TWMV, total white matter volume; VIQ, verbal IQ; TIV, total intracranial volume; WMV, white matter volume; + , Effect sizes for
children with autism and their co-twins, respectively; ++ , Cluster-forming threshold of P < 0.01 and cluster-wise significance threshold of P < 0.05; +++ , lGI analyses
also performed without TBV as covariate, please refer to the original article for results; ¶ , Two-sided.
To eliminate possible effects on our results, we repeated our of lGI in ASD, but a decrease or no change (depending on the
mean analysis without this study and found similar results. brain region) in TD boys aged 3–5 years old (Libero et al. 2018).
Specifically, with a liberal threshold (P < 0.1) and only on the map Of note, the 9 boys with megalencephaly, showed no differences
of uncorrected P values, the right temporal lobe now reached in the developmental trajectory of lGI compared with TD boys,
significance (P < 0.05, I2 = 0.78), the left occipital lobe cluster although this analysis was underpowered. In children, gyrifi-
remained (P < 0.08, I2 = 4.82) but not the frontal lobe cluster. cation was found to mostly decrease with age in TD (Auzias
Heterogeneity of these voxels was low. et al. 2014; Yang et al. 2016), but either not change (Auzias
et al. 2014) or increase (Yang et al. 2016) in ASD. Discordant
is the study by Kates et al. (2009), which reported an increase
Qualitative Review of ASD Studies
in gyrification with age across both groups, although this is
Group Effects one of the smallest included studies (n = 42). In adolescents,
lGI, GI, and SI. The remaining studies that could not be included gyrification was reported to either not change (Shokouhi et al.
in the meta-analysis (3 lGI, 5 GI, and 2 SI studies), present 2012; Bos et al. 2015) or decrease (Wallace et al. 2013; Libero et al.
contradictory results of greater (Kates et al. 2009; Duret et al. 2014; Kohli et al. 2018) in TD. In all but one study (Shokouhi
2018, Table 3a), reduced (Libero et al. 2014; Duret et al. 2018; Kohli et al. 2012), there was a negative effect of age on gyrification
et al. 2019, Table 3b), or no difference in gyrification (Casanova in ASD (Wallace et al. 2013; Libero et al. 2014; Bos et al. 2015;
et al. 2009; Bos et al. 2015; Maier et al. 2018; Pappaianni et al. 2018, Kohli et al. 2018). In younger adults, studies report no age-by-
Table 3c) in ASD, in parietal (Kates et al. 2009; Libero et al. 2014; diagnosis interaction effects (Duret et al. 2018; Maier et al. 2018),
Kohli et al. 2019), temporal (Duret et al. 2018) and frontal (Kohli but a negative main effect of age (Duret et al. 2018). The same
et al. 2019) lobes. Neither SI study reported group differences pattern continues with older adults with both available studies
(Shokouhi et al. 2012; Auzias et al. 2014, Table 3c). Please note in aging also reporting negative main effects of age with no
that results of the 10 studies included in the meta-analysis are interaction effects (Koolschijn and Geurts 2016; Kohli et al. 2019).
also included in Tables 3a, b and c for the reader’s reference. Of note, in an exploratory analysis, Koolschijn and colleagues
(2016) reported that when each adult group was separated by
Age Effects median ages into younger (n = 26 ASD, mean age: 40.99 and n = 24
lGI, GI, and SI. The age and sex effects presented here repre- TD, mean age: 39.99 years old) and older (n = 25 ASD, mean age:
sent findings of all ASD studies including those in the meta- 62.35 and n = 17 TD, mean age: 59.88 years old) subgroups, there
analysis. All ASD studies, except Libero et al. (2018), included was an interaction effect in the right insular cortex among the
cross-sectional cohorts. All studies except two (Wallace et al. older groups, with an age-related decrease of gyrification in ASD
2013; Koolschijn and Geurts 2016) used age as a continuous (Koolschijn and Geurts 2016).
variable. Results of the effect of age were inconsistent across
studies, although the mean age in these cohorts may be infor- Sex Effects
mative to understand the heterogeneity in findings. Specifically, lGI and GI. Most studies had too few females to explore sex
in toddlers, the only ASD longitudinal study reported an increase effects adequately (only Schaer et al. 2015 had more than 202662 Cerebral Cortex, 2021, Vol. 31, No. 5
Table 3c Findings of no significant differences in gyrification in ASD versus TD.
Study Contrast Covariates Results (ASD vs. TD) P (Correction)
Schaer et al. Dx Age, CV, sex Sample: Matched on age, site. N.S. P < 0.01 (MCS)
(2015) differences in VIQ, PIQ. Greater FSIQ in TD F
versus ASD M. Sig. main effect of sex on
supratentorial and CV (smaller in F)
N.S.
Sex N.S.
Sex x Dx ASD M had the lowest, ASD F the highest, lGI
in vmPFC and OFC (R) versus TD M and F
(same results with site and FSIQ as
covariates). Exploring sex effects within ASD:
lower lGI in this cluster and homologous OFC
Downloaded from https://academic.oup.com/cercor/article/31/5/2653/6056290 by guest on 24 April 2021
(L) in M. Dx effects within the sexes: lower
lGI in vmPFC/OFC in ASD versus TD M (N.S.
differences in F)
¶ §
Koolschijn and Dx Age, ICV, sex Sample: N.S. differences in IQ, age, sex P < 0.05
Geurts (2016)
N.S. differences in lGI (same results when FDR; §§ Holm–Bonferroni
repeating analyses with ++ ADOS-group/M).
N.S. differences in lateralization indices
Age Vertex-wise: N.S. Lobar-based: Decline of lGI
with age in frontal lobe (same results when
repeating analyses with ++ ADOS
group/without ICV covariate)
AgexDx N.S. [decrease of lGI in ASD in insular cortex
(R) in + older group]
Pappaianni et al. Dx Age Sample: Matched on age, sex. N.S. differences P < 0.05 (FWE) (cluster-level)
(2018) in FSIQ, PIQ, TIV. Differences in VIQ
N.S. [but, greater GI in middle frontal gyrus
(R) with VIQ as covariate]. N.S. differences in
depth
Auzias et al. Dx Age Sample: Matched on age, TBTV. N.S. P < 0.0023 (Bonferroni)
(2014) differences in WMV, GMV
N.S. differences in GSI, GSL, GMD. Greater
mean depth in IPS (R), reduced max depth in
medial frontal sulcus (L). Reduced length in
CS, medial frontal sulcus (L)
AgexDx N.S. interaction in GSI, GSL, GMD. “+ ” relationCortical Gyrification Morphology in ASD and ADHD Across the Lifespan Gharehgazlou et al. 2663
Table 3c Continued
Study Contrast Covariates Results (ASD vs. TD) P (Correction)
Casanova et al. Dx +++ Age Sample: Matched on age, sex, cerebral None
(2009) volume
N.S.
Shokouhi et al. Dx Age, hem. Volume Sample: Matched on age, sex, IQ P < 0.05
(2012) Greater length in IPS (R), N.S. differences in (Tukey’s method, 0.95 CI)
depth/GSI
Age N.S. correlation with any measure
AgexDx N.S.
Hirjak et al. (2016) Dx Age, sex Sample: Matched on age, sex, not IQ. N.S. P < 0.0041
differences in cortical area (Bonferroni)
N.S.
Downloaded from https://academic.oup.com/cercor/article/31/5/2653/6056290 by guest on 24 April 2021
Note: Results are significant following correction and presented as ASD versus TD. Studies are ordered based on sample size from largest to smallest. ASD, autism
spectrum disorder; CI, confidence interval; CS, central sulcus; CV, cortical volume; Dx, diagnosis; F, female; FDR, false discovery rate; FWE, family-wise error; GI,
gyrification index; GMD, global mean depth; GMV, gray matter volume; GSL, global sulcal length; GSI, global sulcal index; Hem, hemisphere; IPS, intraparietal sulcus; L,
left hemisphere; M, male; Max, maximum; MCS, Monte Carlo simulations; N.S., no(t) significant; OFC, orbitofrontal cortex; PFC, prefrontal cortex; R, right hemisphere;
SI, sulcal index; Sig, significant; STS, superior temporal sulcus; TBTV, total brain tissue volume; TD, typically developing; TIV, total intracranial volume; VIQ, verbal
IQ; vmPFC, ventromedial prefrontal cortex; WMV, white matter volume; + , When each group divided into “younger” (ASD mean age: 40.99, TD: 39.99 years) and
“older” (ASD: 62.35, TD: 59.88 years) subgroups; ++ , Individuals with ADOS scores > 7; +++ , Logarithm of ages; ¶ , Also added age-squared (and group-by-age-squared
interactions) as covariate; § , Vertex-wise analyses; §§ , Lobar analyses.
female ASD participants). The largest study by Schaer et al. no differences in gyrification between individuals with ADHD,
(2015) (n = 53 ASD males, 53 ASD females, 53 TD males, 51 their siblings, or TD.
TD females) reported lower lGI in ASD males compared with
females (when examining differences within ASD) and lower lGI
Age Effects
in ASD versus TD males (when examining differences within
lGI and GI. Two ADHD studies included longitudinal data (Shaw
the sexes; no differences found in females). They reported no
et al. 2012; Ambrosino et al. 2017) while the rest consisted of
main effect of sex.
cross-sectional cohorts. Among studies that examined the effect
of age, all reported a significant negative effect of age, such that
IQ Effects as age increased lGI decreased. Only Ambrosino et al. (2017)
lGI and GI. Meta-regressions were not conducted on intelli- reported an age-by-diagnosis interaction effect as well, where
gence quotient (IQ) given that only 2 lGI studies in ASD explored a less steep decline of lGI with age was observed in ADHD in left
the role of IQ. However, given known association between IQ cuneus and right pars opercularis (only in local, not total, lGI).
and gyrification in the normative literature (Luders et al. 2008; Mean age of the cohorts did not explain these differences.
Gregory et al. 2016), we qualitatively explored the effect of IQ
on gyrification in ASD. All studies (n = 4) reported no associa-
Sex and Intelligence Effects
tion between gyrification and intelligence level in ASD among
lGI and GI. Forde et al. (2017a), including a relatively large number
toddlers (Libero et al. 2018), children (Kates et al. 2009), and ado-
of female participants, reported no sex-by-diagnosis interaction
lescents (Wallace et al. 2013; Bos et al. 2015). Specifically, Libero
effects, nor an effect of IQ.
et al. (2018) found no relation in either ASD or TD groups, while
Kates et al. (2009) and Wallace et al. (2013) reported positive
associations in their TD groups (and in group of discordant unaf-
Discussion
fected co-twins of individuals with ASD in Kates et al. 2009). The
only hint that IQ may have some impact on gyrification is the Our findings summarize a burgeoning, yet still small, literature
Pappaianni et al. (2018) study in which they repeated their main focused on gyrification in ASD and ADHD. Our quantitative
analysis controlling for verbal IQ and found changed results for synthesis presents findings of no significant differences in lGI
the main effect of group, specifically greater gyrification in ASD, between ASD and TD individuals, although trend-level evidence
whereas no group differences were observed previously in this of possible greater lGI in ASD relative to TD was observed as
study when not using IQ as a covariate. well as trend evidence of possible effects of sex but not age or
sample size on gyrification differences. However, the number
of studies available renders the analyses underpowered. Our
Qualitative Review of ADHD Studies
qualitative synthesis of the remaining ASD studies presents
Group Effects highly heterogeneous findings, with gyrification atypicalities,
lGI and GI. Most ADHD studies (Table 2, please refer to when found, widespread in all lobes and in differing directions
Supplementary Table 3 for imaging parameters of all ADHD of effect. Across ADHD studies no significant between-group
studies) report no between-group differences (Shaw et al. differences in gyrification were reported, despite the availability
2012; Ambrosino et al. 2017; Forde et al. 2017a Table 4), except of two large (n > 200) studies.
the smallest study (Mous et al. 2014) which reported greater The finding of no differences in gyrification between groups
gyrification in ADHD compared with TD in the medial temporal in both the meta-analysis in ASD as well as the majority of
lobe. Forde et al. (2017a), the largest available study, included TD studies in ADHD is interesting and may point to an additional
siblings of individuals with ADHD in their cohort and reported potential shared etiological factor between these two NDDs.2664 Cerebral Cortex, 2021, Vol. 31, No. 5
Table 4 Gyrification findings in ADHD; results are significant following correction and presented as ADHD versus TD.
Study Contrast Covariates Results (ADHD vs. TD) P (correction)
Forde et al. (2017b) Dx TCSA, sex, IQ Sample: Differences in P < 0.05 (alpha level
sex, IQ, not age adjusted to 0.004)
N.S. [N.S. effect of IQ].
Exploring a subset
matched on sex, scanner,
age (those with comorbid
diagnoses excluded): N.S.
Age Decline of lGI, increase of
curvature, with age in
frontal, parietal, temporal,
occipital, cingulate and
insula regions
Downloaded from https://academic.oup.com/cercor/article/31/5/2653/6056290 by guest on 24 April 2021
Sex Greater curvature in F in
frontal region
AgexDx N.S. (lGI or curvature)
Sex x Dx N.S. (lGI or curvature)
Shaw et al. (2012) Dx Age Sample: Matched on sex, P < 0.05
IQ, number of scans (log-rank Mantel–Cox)
N.S. [Similar
developmental
trajectories between
groups]
Ambrosino et al. (2017) Dx Age, sex, average lGI, slice Sample: Matched on sex, P = 0.00008
thickness (1.5 vs 1.2 mm) number of scans. N.S. (Bonferroni)
differences in age, but
differences in total IQ at
baseline
Total: N.S. Local: Reduced
lGI in rostral middle
frontal (L), pars
opercularis (R) (N.S. after
correction or including
average lGI as covariate)
Age Decline of total lGI with
age
AgexDx Total: N.S. Local: Less
steep decline of lGI in
cuneus (L) & pars
opercularis (R)
Mous et al. (2014) Dx Age, sex Greater GI in medial P < 0.05 (Sidak)
temporal lobe (L)
Note: Studies ordered based on sample size from largest to smallest. bil, Bilateral; Dx, Diagnosis; F, Female; M, Male; N.S., No(t) significant; OFC, Orbitofrontal cortex;
Sig, Significant; TCSA, Total cortical surface area; TD, Typically developing.
However, at this point it is challenging to present any con- 2) the degree of individual variability is high and may be larger
clusions regarding the gyrification morphology of these two than between-group differences, or 3) atypicalities may only
NDDs in a cohesive manner given the small number of studies be present in a subgroup of individuals with ASD or ADHD or
available in the ASD and ADHD literature focused on this brain detectable at certain stages of development. To take an example
metric, as well as the lack of any study directly examining from another morphometric characteristic, Libero et al. (2016)
gyrification morphology in ASD and ADHD in the same cohort, reported that only in the subgroup of megalencephalic chil-
using the same scanner and protocol. Thus, as mentioned earlier dren (referring to participants with ratio of total cerebral vol-
and following the style in which the results have been presented ume to height that is 1.5 standard deviations higher than that
(i.e., results for each NDD in relation to TD separately), in the of TD) was there greater cortical volume in ASD compared
discussion section as well we attempt no direct comparisons with TD peers, suggesting that the widely reported findings of
between the NDD groups. greater cortical volume in ASD (Hazlett et al. 2006, 2011, 2017;
The null findings in our meta-analysis and large ADHD stud- Schumann et al. 2010) may be driven by a subgroup of ASD
ies may be explained by both biological and methodological individuals with megalencephaly. Alternatively, there may be
factors. It is possible that no systematic differences actually high heterogeneity across studies due to yet unknown features
exist in gyrification between these NDDs and TD. Other expla- that were not systematically studied. Lack of detecting atyp-
nations may include that 1) atypicalities are present but weak, icalities in these two NDDs may also be due to insufficientCortical Gyrification Morphology in ASD and ADHD Across the Lifespan Gharehgazlou et al. 2665
statistical power resulting from the limited number of studies An understanding of the effect of sex on neural develop-
included. ment, especially given the higher prevalence rates of both NDDs
A factor possibly contributing to heterogeneity of results in among boys, is crucial for understanding the biological under-
this field may be the nature of the gyrification construct itself. pinnings of cortical development in these two NDDs. Gyrifi-
Gyrification is a variable construct as evident by high variability cation development undergoes a sexually dimorphic course in
of this measure across MZ twins in both ASD and TD studies TD (Raznahan et al. 2011; Mutlu et al. 2013), and to this end,
(White et al. 2002; Kates et al. 2009), despite high rates of con- some studies in this review investigated the effect of sex as
cordance in cortical volume. Such findings highlight the impor- well. Our quantitative synthesis suggests trend-level evidence
tance of both genetic and non-genetic factors in gyrification and of the effect of sex on gyrification, specifically, the smaller
suggest that discrepant findings in this review may partially be between-group differences (ASD > TD) in lGI, the higher the
due to the variable nature of gyrification as a construct. percentage of males included in the ASD group. As only one
Although no effect of age was observed in the meta-analysis, study included sufficient number of ASD female participants
our qualitative synthesis of all available data suggests that (Schaer et al. 2015) and thus could examine sex effects, our
gyrification findings in NDDs relative to TD may vary across knowledge regarding the effect of this variable on gyrification
Downloaded from https://academic.oup.com/cercor/article/31/5/2653/6056290 by guest on 24 April 2021
different developmental stages. In the current review, although in ASD literature is very limited. Effect of sex on gyrification in
the rate of gyrification change differed between ASD and TD in ADHD is understudied as only one study (Forde et al. 2017a) ana-
toddlerhood and childhood (and less so in adolescence), devel- lyzed sex. When focusing only on ADHD studies that included
opmental trajectories did not significantly differ among adult or a large number of female participants (n > 30, Shaw et al. 2012;
old age cohorts. This is in line with other morphometric results Ambrosino et al. 2017; Forde et al. 2017a), we found reports
(cortical thickness) of the recent ENIGMA mega-analysis which of no significant group differences in lGI between ADHD and
showed greatest structural differences in ASD in childhood and TD, which suggests a potential effect of sex on lGI atypicalities
adolescence (van Rooij et al. 2018). It is important to note that in ADHD.
very little is actually known about brain changes in aging across It is also important to consider sample demographics across
NDDs (mean age = 50 years old, only two ASD studies available, included studies due to their potential impact on findings. For
Koolschijn and Geurts 2016; Kohli et al. 2019). In ADHD, all instance, the presence of co-occurring intellectual disabilities
studies report a decrease of gyrification with age and most (ID) may have an effect, given known findings of gyrification
studies did not find differences from TD. Although there are atypicalities in individuals with ID (Zhang et al. 2010). Most
fewer ADHD papers, two relatively large studies in ADHD (Shaw participants in the studies included had no ID. The inclusion
et al. 2012; Forde et al. 2017a), including cohorts of 4.5–19 years criteria of many of these studies included only ASD participants
of age, found no differences from typical development, so even with FSIQs above 70. Two studies included individuals with a
though we could not do a meta-analysis, these provide fairly broader range of IQ (i.e., Kates et al. 2009; Schaer et al. 2013),
good preliminary evidence that there is no difference in gyrifi- but neither study examined the effect of ID on gyrification.
cation in ADHD when examining this brain construct in earlier The higher prevalence rate of ASD individuals with average or
developmental years. above average intelligence levels in the studies included in this
Considering that gyrification begins prior to birth (Chi et al. manuscript is common in the field of neuroimaging research,
1977) and peaks during toddlerhood (Raznahan et al. 2011), the partly due to considerations of feasibility, including maintaining
potential effects of environmental factors (Mata et al. 2010; Kuhn scan quality. However, this limits the ability to generalize the
et al. 2016; Bernardoni et al. 2018) and timing of onset of ASD and reported neuroimaging results to those on the autism spec-
ADHD symptoms in early development, it is important to study trum and intellectual disability (and limits knowledge of cortical
gyrification at younger ages. On this point, the study by Libero macrostructure in this group).
et al. (2018), which consists of a very young cohort, is of particular Other important sample demographics to consider across
interest. The age-related increase of gyrification found in tod- studies include comorbidities and medication use. The majority
dlers with ASD compared with TD (Libero et al. 2018) suggests a of ASD studies in this manuscript excluded participants with
greater rate of gyrification increase in ASD during a period when neurologic, genetic, and psychiatric disorders or did not provide
the cortex is at its peak folding level in TD (Raznahan et al. 2011). any information on comorbidity. Of the four that reported
This greater rate of gyrification expansion in ASD may reflect comorbidity, one study included ASD participants with and
the greater surface area expansion found in infants at high risk without speech onset delay (Duret et al. 2018), another included
for ASD that later go on to manifest the disorder (Hazlett et al. ASD participants with and without megalencephaly, another
2017). As surface area may expand more rapidly in a subgroup study (Maier et al. 2018), allowed for presence of anxiety and
of children with ASD, it is plausible that gyrification levels also depression and the Casanova et al. (2009) study included ASD
expand at a greater rate to fit the growing surface area in the participants with comorbid disorders such as OCD, epilepsy,
limited space of the cranium (Le Gros Clark 1945). It is important and bipolar disorder. Given the variability of diagnoses included
for future studies to investigate gyrification at early ages in and the small number of participants disclosed to have
ADHD as well to better understand gyrification morphology comorbid conditions, it is not possible at this stage to explore
in this cohort during toddlerhood also (Raznahan et al. 2011), the effect of specific comorbidities on gyrification. Only a
while further studies on young cohorts in ASD are needed for few studies allowed medication use (Casanova et al. 2009;
replicability of results. Following the discussion earlier regarding Wallace et al. 2013; Bos et al. 2015; Koolschijn and Geurts
only the subgroup of megalencephalic children with ASD pre- 2016; Pereira et al. 2018). Two of these studies specifically
senting differing morphometric characteristics compared with examined the effect of medication on gyrification (Wallace
TD (Libero et al. 2016), it may be important for future studies et al. 2013; Bos et al. 2015), and both reported no significant
to also track subtypes of ASD and ADHD cohorts and include effects of medication use on this construct. Considering the
large sample sizes to better understand gyrification morphology limited number of studies in this review that have examined
in these highly heterogeneous NDDs. medication use effects on gyrification morphology, it wouldYou can also read