Connectivity of the Cingulate Sulcus Visual Area (CSv) in Macaque Monkeys
←
→
Page content transcription
If your browser does not render page correctly, please read the page content below
Cerebral Cortex, February 2021;31: 1347–1364

                                                                             doi: 10.1093/cercor/bhaa301
                                                                             Advance Access Publication Date: 17 October 2020
                                                                             Original Article

ORIGINAL ARTICLE

Connectivity of the Cingulate Sulcus Visual Area (CSv)

                                                                                                                                                         Downloaded from https://academic.oup.com/cercor/article/31/2/1347/5927961 by guest on 03 November 2021
in Macaque Monkeys
V De Castro 1,2 , AT Smith3 , AL Beer4 , C Leguen1,2 , N Vayssière1,2 ,
Y Héjja-Brichard 1,2 , P Audurier1,2 , BR Cottereau1,2 and JB Durand1,2
1 Université
           de Toulouse, Centre de Recherche Cerveau et Cognition, Toulouse, France, 2 Centre National de la
Recherche Scientifique, Toulouse Cedex, France, 3 Department of Psychology, Royal Holloway, University of
London, Egham TW20 0EX, UK and 4 Institut für Psychologie, Universität Regensburg, 93053 Regensburg,
Germany
Address correspondence to Vanessa De Castro, CNRS CERCO UMR 5549, Pavillon Baudot CHU Purpan / BP 25202, 31052 Toulouse Cedex 03, France.
Email: vanessa.decastro@cnrs.fr; Jean-Baptiste Durand, CNRS CERCO UMR 5549, Pavillon Baudot CHU Purpan / BP 25202, 31052 Toulouse Cedex 03,
France. Email: jbdurand@cnrs.fr.

Abstract
In humans, the posterior cingulate cortex contains an area sensitive to visual cues to self-motion. This cingulate sulcus
visual area (CSv) is structurally and functionally connected with several (multi)sensory and (pre)motor areas recruited
during locomotion. In nonhuman primates, electrophysiology has shown that the cingulate cortex is also related to spatial
navigation. Recently, functional MRI in macaque monkeys identified a cingulate area with similar visual properties to
human CSv. In order to bridge the gap between human and nonhuman primate research, we examined the structural and
functional connectivity of putative CSv in three macaque monkeys adopting the same approach as in humans based on
diffusion MRI and resting-state functional MRI. The results showed that putative monkey CSv connects with several
visuo-vestibular areas (e.g., VIP/FEFsem/VPS/MSTd) as well as somatosensory cortex (e.g., dorsal aspects of areas 3/1/2), all
known to process sensory signals that can be triggered by self-motion. Additionally, strong connections are observed with
(pre)motor areas located in the dorsal prefrontal cortex (e.g., F3/F2/F1) and within the anterior cingulate cortex (e.g., area 24).
This connectivity pattern is strikingly reminiscent of that described for human CSv, suggesting that the sensorimotor
control of locomotion relies on similar organizational principles in human and nonhuman primates.

Key words: connectivity, locomotion, MRI, primates, sensorimotor

Introduction                                                                 is, the continuous retinal image change caused by relative
Primates are endowed with a very wide range of locomotor                     motion between the eyes and the visual surroundings. The
behaviors (Stern and Oxnard 1973), and they rely on several                  visual modality playing a central role in primates, optic flow is
sources of sensory feedback to adjust body posture, gait, and                considered a major signal for the control of locomotion (Warren
heading direction during locomotion (Takakusaki 2017). For                   et al. 2001). However, the way this sensorimotor process is
instance, somatosensory signals indicate the kinematics of the               actually implemented in the brain is only partially understood
body parts recruited during self-motion, while the acceleration              (Sherrill et al. 2015). Another open issue is whether the control of
and swaying of the body that they produce are monitored as                   locomotion is implemented similarly in human and nonhuman
head movements by the vestibular system. Another sensory                     primates. By forsaking arboreal locomotion and becoming
consequence of self-motion is optic flow (Gibson 1950), that                 bipedal walkers, humans have developed unique anatomical

© The Author(s) 2020. Published by Oxford University Press. All rights reserved. For permissions, please e-mail: journals.permission@oup.com
This is an Open Access article distributed under the terms of the Creative Commons Attribution Non-Commercial License (http://creativecommons.org/
licenses/by-nc/4.0/), which permits non-commercial re-use, distribution, and reproduction in any medium, provided the original work is properly cited.
For commercial re-use, please contact journals.permissions@oup.com
1348      Cerebral Cortex, 2021, Vol. 31, No. 2

adaptations such as the dual curvature of the vertebral column        similar to that performed in humans (Smith et al. 2018) with
or the disappearance of an opposable hallux (see Schmidt 2011         the 3 macaque monkeys in which pmCSv had been function-
for review). This uniqueness might well extend to the brain           ally identified previously (Cottereau et al. 2017). By combin-
structures supporting the control of locomotion.                      ing diffusion-MRI (structural connectivity) and rs-fMRI (func-
    In recent years, neuroimaging studies have identified a           tional connectivity), we show that pmCSv connects with a set
potential candidate for the online control of locomotion in           of visual and/or vestibular areas, with the dorsal portion of
the human brain. A small region of the posterior cingulate            somatosensory areas and also with (pre)motor areas of the ante-
cortex was first documented with regard to its sensitivity to         rior cingulate and prefrontal cortices. Overall, the connectivity
visual cues to self-motion (Antal et al. 2008; Wall and Smith         pattern we document for pmCSv is strikingly similar to that
2008; Fischer et al. 2012). Although optic flow stimuli evoke         previously described for human CSv with a similar approach.
responses in a large and distributed set of human brain areas,        These results indicate that despite of their distinct locomotor
such as the dorsal medial-superior temporal (MSTd) and ventral        adaptations, human and non-human primates might rely on a
intraparietal (hVIP) areas, this cingulate sulcus visual (CSv) area   highly preserved cortical organization for the online control of

                                                                                                                                            Downloaded from https://academic.oup.com/cercor/article/31/2/1347/5927961 by guest on 03 November 2021
was unique in remaining largely silent when the optic flow            locomotion.
was made inconsistent with locomotion (see Smith et al. 2017
for review). Interestingly, CSv was later shown to respond also
to vestibular cues to self-motion (Smith et al. 2012). Both the
                                                                      Material and Methods
multisensory properties of CSv and the fact that it is located        Animals
in a portion of the brain involved in spatial sensorimotor
                                                                      Three female rhesus macaques: M01, M02, and M03 (age:
processes (Vogt et al. 1992; Kravitz et al. 2011) suggested a
                                                                      15–17 years; weight: 5–8 kg) participated in this experiment.
potential involvement in the control of locomotion. Recently,
                                                                      Animal housing, handling, and all experimental protocols
Smith and collaborators (2018) have brought strong support to
                                                                      (surgery and MRI recordings) followed the guidelines of the
this hypothesis by characterizing the structural and functional
                                                                      European Union legislation (2010/63/UE) and of the French
connectivity of CSv through both diffusion-weighted magnetic
                                                                      Ministry of Agriculture (décret 2013–118). The project was
resonance imaging (DWI) and resting-state functional MRI (rs-
                                                                      approved by a local ethics committee (CNREEA code: C2EA—14)
fMRI). Besides confirming the connectivity of CSv with areas
                                                                      and received authorization from the French Ministry of Research
processing visual and/or vestibular cues to self-motion, they
                                                                      (MP/03/34/10/09). The 3 animals were housed together in a large,
could also document connections with the somatosensory
                                                                      enriched enclosure and could thus develop social and foraging
cortex. Importantly, CSv was also shown to connect with
                                                                      behaviors. They returned to their individual cages to be fed
(pre)motor areas located in the anterior cingulate and prefrontal
                                                                      twice a day, with standard primate biscuits supplemented with
cortices (Smith et al. 2018), suggesting that it might be involved
                                                                      various types of fruits and vegetables. Health inspections were
in the multisensory control of locomotion. In agreement with
                                                                      carried out quarterly on these animals. Details about the ani-
this finding, CSv has recently been shown to respond to active
                                                                      mals’ surgical preparation are provided in Cottereau et al. (2017).
leg movements (Serra et al. 2019).
    In macaque monkeys, electrophysiological studies have
identified neurons integrating visual and vestibular cues to          Localization of pmCSv and Other Self-Motion-Sensitive
self-motion in several areas such as MSTd (Duffy 1998), VIP           Visual Areas
(Colby et al. 1993; Bremmer et al. 2002; Schlack et al. 2002;         These 3 animals are the same as those previously involved in the
Chen et al. 2011a), a portion of the frontal eye field (FEFsem)       functional MRI study (Cottereau et al. 2017) that allowed identi-
involved in smooth eye movements (Gu et al. 2016) and                 fication of the cortical regions sensitive to visual cues to self-
the visual posterior sylvian (VPS) area (Guldin and Grüsser           motion by contrasting the blood-oxygenation-level-dependent
1998; Chen et al. 2011b). For most of these areas, functional         (BOLD) responses evoked by optic flow stimuli that were con-
equivalents were later identified in the human brain (see             sistent or inconsistent with self-motion (Wall and Smith 2008).
Smith et al. 2017 for review). This is notably the case for           With this approach, we could localize the putative monkey CSv
hMSTd (Dukelow et al. 2001) and hVIP (Bremmer et al. 2001).           (pmCSv) in all 3 animals (4/6 hemispheres). We also documented
By contrast, when CSv was first identified in the human brain,        other cortical areas processing visual cues to self-motion: the
no functional equivalent had been previously documented               dorsal medial-superior temporal (MSTd) area (6 hemispheres),
in macaques. This was recently achieved by an fMRI study              the medial superior temporal polysensory (STPm) area (5 hemi-
(Cottereau et al. 2017) that adopted the protocol used to identify    spheres), the ventral intraparietal (VIP) area (6 hemispheres),
CSv in humans, in which brain responses evoked by optic flow          7a/Opt (5 hemispheres), the visual posterior sylvian (VPS) area (5
stimuli that were either consistent or inconsistent with self-        hemispheres) and the portions of the frontal eye field devoted
motion were contrasted (Wall and Smith 2008). With such a             to smooth eye movements (FEFsem; 5 hemispheres) and to
design, a small area responding almost exclusively to visual          saccades (FEFsac; 4 hemispheres). The MNI coordinates of these
cues consistent with self-motion was observed in the posterior        areas are available in Table 1 of Cottereau et al. (2017).
cingulate cortex of macaque monkeys. Currently, we do not
know whether this putative monkey CSv (pmCSv) responds
to vestibular cues to self-motion, nor whether it connects
                                                                      Scanning
to both (multi)sensory and (pre)motor areas as does human
CSv (Smith et al. 2018).                                              Prior to the scanning sessions, the animals were installed in a
    The present study addresses these issues, with the aim of         sphinx position within an MRI-compatible primate chair, their
assessing the degree of similarity between the connectivity           head restrained by the surgically implanted head-post. Whole-
pattern of human CSv and that of its putative counterpart in          brain images were acquired on a 3 Tesla clinical MR scanner
monkey. To that end, we have implemented a connectivity study         (Phillips Achieva) using a custom 8-channel phased array coil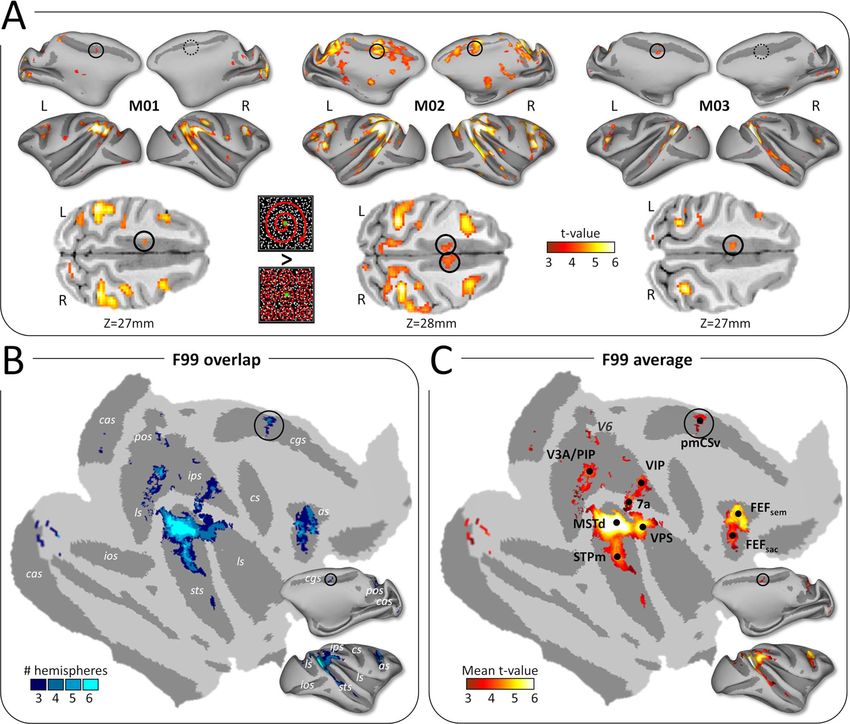
Connectivity of Monkey CSv De Castro et al.                     1349

Table 1 List of template-based areas showing significant structural and functional connectivity with pmCSv, with their MNI coordinates on
the right hemisphere of monkey F99, their structural and functional t-values relative to V1/V2/V3, their normalized strength of connectivity,
the numbers of ipsilateral and contralateral hemispheres above the V1/V2/V3 structural and functional baselines and their main function(s)

Area                       Center of mass XYZ (mm) – MNI         Structural     Functional      Connectivity   Nb hemi.          Function(s)
                                                                 t-value        t-value         strength (%)   (ipsi / contra)

23 (pmCSv)        4.8               6.2               5.6        31.7           6.3             10.4           6/6               Premotor &
                                                                                                                                 visuo-vestibular
F3                4.6               23.3              14.7       23.6           6.4             8.6            6/6               Premotor
1                 12.7              7.1               14.3       9.9            10.5            7.5            6/6               Somatosensory
24d               5.1               23.4              9.8        17.6           5.7             6.9            6/6               Premotor
3                 16.0              11.3              10.7       12.7           7.9             6.9            6/6               Somatosensory
F1                13.1              14.5              14.5       14.5           6.6             6.6            6/6               Motor
7 m/PGm           5.0               -0.5              11.2       11.1           5.7             5.4            6/6               Visuo-vestibular
F2                11.0              22.4              15.9       11.7           5.1             5.2            6/6               Premotor

                                                                                                                                                       Downloaded from https://academic.oup.com/cercor/article/31/2/1347/5927961 by guest on 03 November 2021
7op (VPS)         21.9              4.0               5.3        7.8            6.4             5.0            6/6               Visuo-vestibular
F4                20.4              19.6              10.5       13.4           3.3             4.7            5/5               Premotor
8 m (FEFsem)      15.6              24.7              10.4       12.6           3.5             4.6            5/6               Visuo-vestibular
VIP               12.0              0.1               8.8        11.5           3.7             4.5            5/4               Visuo-vestibular
F6                4.9               31.3              11.8       8.5            3.2             3.6            6/5               Premotor
Tpt               22.1              -1.0              9.2        6.4            3.5             3.2            5/5               Visuo-vestibular
MST               18.5              -4.2              8.3        5.2            4.0             3.2            5/6               Visuo-vestibular
LIP               14.1              -1.9              12.2       4.7            4.1             3.1            5/5               Visuo-vestibular
2                 21.6              8.8               9.2        4.3            3.9             3.0            4/4               Somatosensory
MT                20.2              -6.1              5.3        3.6            4.2             2.9            4/5               Visual
STPc              26.1              -1.4              6.3        2.9            3.4             2.4            4/4               Visuo-somatosensory
V6                6.0               -12.4             3.5        4.2            2.7             2.3            5/4               Visual

Areas are listed in decreasing order of connectivity strength.

(RapidBiomed) specially designed to fit the skull of our animals.             100 × 100 mm). These T1 and EPI volumes were used to construct
Details about the functional MRI study that localized the regions             individual structural and functional templates, respectively.
sensitive to visual cues to self-motion in our 3 animals are
provided in Cottereau et al. (2017). Below, we only describe the              Templates and Cortical Surfaces
5 scanning sessions that each of them underwent under light                   The anatomical template was obtained by realigning and aver-
anesthesia for (1) creating brain and cortical surface templates              aging the four T1-weighted volumes. It was then aligned to
(1 session), (2) assessing the structural connectivity through                the MNI space of the 112RM-SL template (McLaren et al. 2009,
diffusion MRI (1 session) and (3) estimating the functional con-              2010). Cortical surface reconstructions were performed using the
nectivity with resting-state functional MRI (3 sessions). The light           CARET software (Van Essen et al. 2001). The functional template
anesthesia administered to our animals is unlikely to have a                  was obtained by realigning and averaging the 300 functional
detrimental impact on the functional connectivity we measured                 volumes. Affine and non-rigid normalization parameters bring-
from resting state fMRI. It has been shown that functional                    ing the functional template onto the anatomical template were
connectivity can be measured reliably in macaques even with                   estimated from the gray matter maps of both templates, using
ketamine-induced anesthesia causing profound loss of con-                     the normalization tools of the SPM12 software.
sciousness (Vincent et al. 2007). Moreover, by silencing cogni-
tive processes, the anesthesia is expected to provide functional              Cortical Surface Registration
connectivity patterns matching more closely the structural ones               For surface-based group analyses, each of the 6 individual cor-
(Barttfeld et al. 2015).                                                      tical surfaces (left and right hemispheres of the 3 monkeys)
                                                                              was non-rigidly registered to the right cortical surface of the
Brain and Cortical Surface Templates                                          reference monkey F99 available in the CARET software (Van
                                                                              Essen 2002). For this, individual left cortical surfaces were first
Data Acquisition                                                              flipped left–right. All surfaces were then submitted to a non-
Anatomical and functional brain templates were built from                     rigid variant of the iterative closest point algorithm (Amberg
acquisitions made in a single session on lightly anesthetized                 et al. 2007) implemented in Matlab (https://www.github.com/cha
animals (Zoletil 100:10 mg/kg and Medetomidine: 0.04 mg/kg).                  rlienash/nricp). Results of this non-rigid registration are shown
The animals’ constants were monitored during the whole ses-                   in Supplementary Figure 1.
sion (about 1 hour) with an MR compatible oximeter. During
that session, we acquired four T1-weighted anatomical volumes
                                                                              Structural Connectivity (Diffusion MRI)
by a magnetization-prepared rapid-acquisition gradient-echo
sequence (MPRAGE; repetition time [TR]: 10.3 ms; echo time                    Data Acquisition
[TE]: 4.6 ms; flip angle: 8◦ ; voxel size: 0.5 × 0.5 × 0.5 mm; 192            Each animal underwent one session of diffusion-weighted MRI
sagittal slices with no inter-slice gap; field of view [FOV]: 160             recordings under light anesthesia (Medetomidine: 10 μg/kg,
× 160 mm), and 300 T2∗-weighted functional volumes by a                       Ketamine: 10 mg/kg). Data was acquired in each subject by a
gradient-echo sequence with echo-planar read-out (GE-EPI; TR:                 spin-echo sequence with echo-planar read-out (TR: 7132 ms;
2000 ms; TE: 30 ms; flip angle: 90◦ ; SENSE factor: 1.6; voxel size:          TE: 62 ms; flip angle: 90◦ ; voxel size: 1 × 1 × 1 mm; 32 axial slices
1.25 × 1.25 × 1.5 mm; 32 axial slices with no inter-slice gap; FOV:           with no inter-slice gap; FOV: 120 × 120 mm, EPI factor: 55). We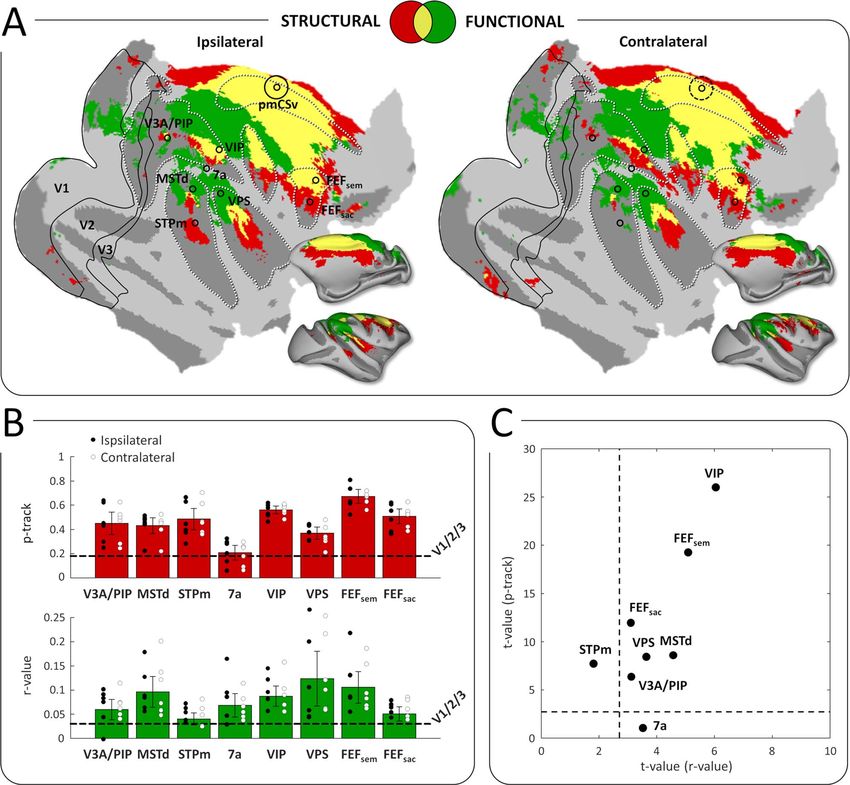
1350      Cerebral Cortex, 2021, Vol. 31, No. 2

had to slightly increase the number of axial slices (34) and the         surfaces for right and left pmCSv, respectively). Group results
TR (7578 ms) for monkey M03. The DWI sequence contained                  were obtained by projecting the ipsilateral and contralateral
a first volume without diffusion weighting (b = 0 s/mm2 )                structural connectivity maps onto the right cortical surface of
followed by diffusion-weighted images isotropically distributed          the reference monkey F99. At the group level, ipsilateral or
along 128 directions with a b-value of 1000 s/mm2 . At the               contralateral track terminations (structural connectivity with
end of the sequence, an additional volume without diffusion              pmCSv) were considered relevant if they exceeded the track
weighting was acquired, but with an inverted polarity of phase           probability threshold (p-track > 0.5) in at least half (3/6) of the
encoding (inverted b-zero) in order to estimate and correct the          hemispheres, as in previous studies (Beer et al. 2011).
susceptibility-induced off-resonance field. This sequence was
repeated three times in order to increase the signal-to-noise            ROI-Based Structural Connectivity of pmCSv
ratio. The total imaging time was about 45 minutes.                      The volumetric masks of each region of interest (ROI), pmCSv,
                                                                         FEFsem, FEFsac, VPS, VIP, 7a, MSTd and STPm, were defined
                                                                         individually, based on the MNI coordinates given by Cottereau
Preprocessing

                                                                                                                                               Downloaded from https://academic.oup.com/cercor/article/31/2/1347/5927961 by guest on 03 November 2021
                                                                         et al. (2017). Using FSL tools, we created a mask for each of these
DICOM images were converted to NIFTI format using dcm2niigui
                                                                         ROIs. More specifically, these masks corresponded to spheres
(distributed by MRIcron), and then processed with the FMRIB
                                                                         of 1.5 mm radius, centered on the ROI’s local maxima, before
software library (FSL, version 6.0.1) (Jenkinson et al. 2012). First,
                                                                         being binarized. Finally, these ROI masks were transformed to
we applied an intra-modal motion correction to finely align
                                                                         diffusion space for subsequent analysis performed by the FDT.
the 128 volumes (one per direction) of the DWI sequence, and
                                                                         The tracking algorithm was seeded in the voxels of pmCSv. Here,
an intermodal affine registration to the inverted b-zero volume
                                                                         the mean track probabilities of the specific target ROIs were
(Jenkinson et al. 2002). Then, images were reoriented and labels
                                                                         analyzed.
corrected (because of the monkeys’ sphinx position within the
bore of the scanner) using FSL tools. Second, the analysis of
DWI was performed by the Diffusion Toolbox (FDT, version 5.0)            Functional Connectivity (Resting-State Functional MRI)
(Behrens et al. 2007). This included corrections for susceptibility-
                                                                         Data Acquisition
induced off-resonance field (Andersson et al. 2003) and eddy
                                                                         Each animal underwent three sessions of rs-fMRI recordings
current distortions (Andersson and Sotiropoulos 2016). Distribu-
                                                                         under slight anesthesia (Medetomidine: 10 μg/kg, Ketamine:
tions of diffusion parameters at each voxel were estimated by
                                                                         10 mg/kg). Each session lasted less than 1 hour, during which
means of Markov Chain Monte Carlo sampling. This modeling
                                                                         two runs of 25 minutes (600 volumes per run) were recorded.
approach detects white matter regions of complex fiber archi-
                                                                         Data were acquired by gradient echo-planar imaging (GE-EPI; TR:
tecture and uses automatic relevance detection to prevent the
                                                                         2000 ms; TE: 30 ms; flip angle: 90◦ ; SENSE factor: 2; voxel size:
modeling of multiple fibers when inappropriate. Moreover, we
                                                                         1.25 × 1.25 × 1.8 mm; 25 axial slices with no inter-slice gap; FOV:
made the registration within FDT to obtain the transformation
                                                                         100 x 100 mm).
matrices between diffusion and structural space.

                                                                         Preprocessing
Whole-Brain Structural Connectivity of pmCSv                             The first 5 volumes of each run were discarded. The remaining
Probabilistic tractography was performed with the FDT toolbox            functional images were first slice-time corrected to compensate
(Behrens et al. 2007) in individual diffusion space as in previous       for the delay caused by the sequential (interleaved) acquisition
studies (Beer et al. 2011; Smith et al. 2018). All trajectories were     of the slices. A mean image was then generated for each run
seeded from each voxel included in the whole brain mask. We              for co-registration with the individual functional template. Co-
examined the probability of streamlines passing through pmCSv            registration parameters were then combined with the normal-
(waypoint mask). For each voxel of the seed mask, 5000 stream-           ization parameters transforming the individual functional tem-
lines were sampled (maximum steps: 2000, step length: 0.5 mm,            plate to the individual anatomical template. Those combined
curvature threshold: 0.2). A loop-check for preventing circular          parameters were then applied to all the functional images of
pathways was applied. Linear registrations (see above section            the run in a single interpolation step, which was also used to
“Preprocessing”) were applied for transforming tracking results          resample the functional volumes to 1 × 1 × 1 mm voxels. No
into structural space. As in our previous work (Smith et al. 2018),      smoothing was applied to the volumetric data. After checking
the accumulated numbers of streamlines, or track frequencies             the absence of temperature-induced drifts during the acqui-
(f-track), were converted into track probabilities (p-track) by divid-   sition of the functional volumes, rigid realignment was also
ing the log-scaled track frequency by the maximum log-scaled             omitted since the animals were anesthetized with their head
track frequency. Then, track probabilities were thresholded (p-          immobilized by the head post. To regress out the signal fluc-
track > 0.5). Equivalent thresholds were used in the previous            tuations caused by physiological and/or environmental noise,
studies (Behrens et al. 2003). Afterwards, track probabilities in        time courses of voxels outside the brain (muscles, eyes, etc.)
volumetric space at the gray matter/white matter border were             were extracted and 10% of the voxels with the highest temporal
projected onto the individual cortical surfaces as follows: for          variance were submitted to a principal component analysis
all the surfaces’ nodes, track probabilities were obtained by            (PCA) after z-score normalization (Héjja-Brichard et al. 2020).
trilinear interpolation from 7 sampling points along the nodes’          The 12 first PCA components were used to regress out all signal
normal vectors (from −1 to +1 mm), to account for cortical               fluctuations correlating with those noise regressors within the
thickness (1.5–2.5 mm in macaques). For each node, the higher            brain voxels. Functional data were then projected from volumet-
track probability value was retained. Individual surface maps of         ric space to surface space by trilinear interpolation along the
structural connectivity were further grouped into 6 ipsilateral          surface nodes (7 sampling points per node along their normal
ones (left and right cortical surfaces for left and right pmCSv,         vector; from −0.75 to +0.75 mm). The 7 functional time courses
respectively) and 6 contralateral ones (left and right cortical          were first converted to percent signal change and then averaged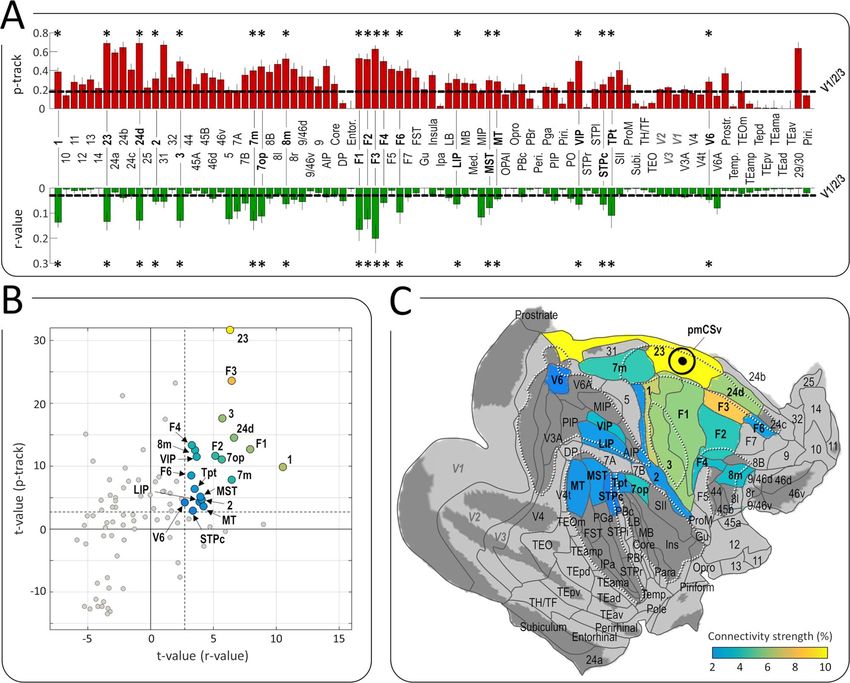
Connectivity of Monkey CSv De Castro et al.                       1351

in a single mean time course attributed to the surface’s node.         average strength of connectivity across 3 areas, which are not
Finally, both surface-based spatial smoothing (Gaussian kernel;        thought to share direct cortico-cortical connection with pmCSv,
FWHM = 2 mm) and temporal band-pass filtering were applied to          that is, the first, second, and third visual areas (V1/V2/V3). Note
                                                                       that these areas and pmCSv might nevertheless hold indirect
the functional data. The RESTplus V1.23 toolbox (Jia et al. 2019)
                                                                       connections, since they all belong to the network of visually
was used for temporal filtering in the range [0.01—0.1 Hz].            responsive areas. Hence, we favored a conservative criterion
                                                                       for evaluating the structural connectivity of pmCSv. Although
Whole-Brain Functional Connectivity of pmCSv                           the functional connectivity measures (partial correlation coef-
We first averaged the time courses from the surface nodes              ficients) do not have the same baseline limitation, we adopted
                                                                       the same strategy so that functional connectivity could also
belonging to a given pmCSv ROI to constitute a seed time
                                                                       be evaluated with respect to the V1/V2/V3 baseline. For each
course. We then computed the (partial) correlation coefficients        area of the atlas, the mean structural connectivity (i.e., mean
(r-values) between this seed time course and the time courses          p-track) and mean functional connectivity (i.e., mean Fisher Z-
attached to all the nodes of both left and right cortical surfaces.    transformed r-value) with pmCSv were computed for each of the
This was done separately for each of the 6 runs collected per          6 ipsilateral and 6 contralateral hemispheres. Based on the high
                                                                       similarity between the ipsilateral and contralateral connectivity

                                                                                                                                                        Downloaded from https://academic.oup.com/cercor/article/31/2/1347/5927961 by guest on 03 November 2021
monkey. Correlation coefficients were first normalized by a
                                                                       strengths, they were grouped for subsequent statistical analyses.
Fisher Z-transformation and then averaged across the 6 runs for
                                                                       Finally, we compared the strength of pmCSv connectivity of
producing individual whole-brain maps of resting-state func-           each target area (M132 atlas) with the baseline connectivity
tional connectivity for pmCSv. For intersubject normalization          strength (based on V1/V2/V3) by one-sample t-tests (two-tailed).
and statistical analyses, these individual maps were shown as          An area was considered to be statistically more connected to
z-value maps (by subtracting from each correlation value the           pmCSv than areas V1/V2/V3 if its t-value > 2.6 (P value < 0.05)
whole-brain mean and dividing it by the whole-brain standard           in both structural and functional domains. For these areas, we
                                                                       derived a normalized measured of combined connectivity with
deviation). We used a mean z-value of 1.96 (P value < 0.05) as a
                                                                       the following formula:
statistical threshold for the individual functional connectivity
maps. Individual maps of functional connectivity were further
                                                                                                      t                   tfunctional
grouped into 6 ipsilateral ones (left and right cortical surfaces      Connectivity Strength % = 0.5 × structural + 0.5 ×                 × 100 (1)
                                                                                                          tstructural         tfunctional
for left and right pmCSv, respectively) and 6 contralateral
ones (left and right cortical surfaces for right and left pmCSv,
respectively). Group results were obtained by projecting the           where the t-values measured in the structural and functional
ipsilateral and contralateral functional connectivity maps onto        domains for a given area (tstructural and tfunctional ) are averaged
the right cortical surface of the reference monkey F99. Ipsilateral    after normalizing by the sum of the t-values across all areas
or contralateral connectivity with pmCSv was considered                showing significant deviation from the V1/V2/V3 reference
relevant at the group level, if it was above our individual            (tstructural and tfunctional ). This approach allows weighting
statistical threshold (z-value > 1.96) in at least half (3/6) of the   structural and functional connectivity equally regardless of their
hemispheres (as in Cottereau et al. 2017). Although cortical           respective overall sensitivity.
sites with significant negative correlations (z-value < −1.96)
were sometimes observed in individual correlation maps
(Supplementary Fig. 2), none was confirmed at the group level          Results
(i.e., in at least half of the hemispheres). For that reason, only
                                                                       Localization of the Putative Monkey CSv
positive correlations are considered here.
                                                                       The putative monkey counterpart of human CSv had been previ-
ROI-Based Functional Connectivity of pmCSv                             ously localized in each of the 3 monkeys involved in the present
The ROIs defined in individual structural volumetric space for         study based on the contrast between the brain responses to con-
FEFsem, FEFsac, VPS, VIP, 7a, MSTd and STPm were first pro-            sistent and inconsistent optic flow stimuli (Cottereau et al. 2017)
jected onto the corresponding individual cortical surfaces. For        and replicating the design used to localize CSv in humans (Wall
each ROI, we determined the surface node corresponding to the          and Smith 2008). The individual statistical parametric maps are
center of mass of the projection and all the nodes less than           shown in Figure 1A, projected on inflated representations of
1 mm away were retained. Functional time courses from all              the animals’ left and right cortical surfaces. Notably, significant
these nodes were then averaged to produce the time course              activations (t-value > 3.1; P value < 0.001 uncorrected) are found
of that ROI, and the average was finally correlated to that of         within the posterior cingulate sulcus in both hemispheres of
pmCSv (defined in the same way). For each ROI, the operation           M02 and in the left hemispheres of M01 and M03 (black circles;
was repeated run per run and the correlation coefficients were         symmetrical locations within the right hemispheres of M01 and
finally averaged across runs after normalization with the Fisher       M03 are also indicated with dotted black circles).
Z-transformation.                                                          When the statistical parametric maps from the 6 hemi-
                                                                       spheres are projected onto the right cortical surface of mon-
                                                                       key F99 (see Methods section), these cingulate activations par-
Atlas-Based Analysis of Structural and Functional                      tially overlap across 4 of the 6 hemispheres (Fig. 1B), defining
Connectivity                                                           a restricted region that we defined as the putative monkey
We performed an atlas-based analysis of the strength of both           CSv (pmCSv). Figure 1C shows the mean t-value map for all the
structural and functional connectivity across the 91 areas of the      regions in which significant activations were observed in at least
M132 atlas (Markov et al. 2014) registered onto the right cortical     3 out of the 6 hemispheres, together with the local statistical
surface of monkey F99. Since structural connectivity measures
                                                                       maxima (MSTd, STPm, VIP, VPS, 7a, FEFsem, FEFsac) documented
(track probabilities) may have a nonzero value even by chance,
the connectivity strength was evaluated relative to a reference        in our previous study (Cottereau et al. 2017). Note that this
baseline. For interspecies comparison purposes, we followed the        new surface-based analysis reveals a supplementary local max-
approach used by Smith et al. (2018) and used as baseline the          imum within the dorsal-most part of the lunate sulcus, lying in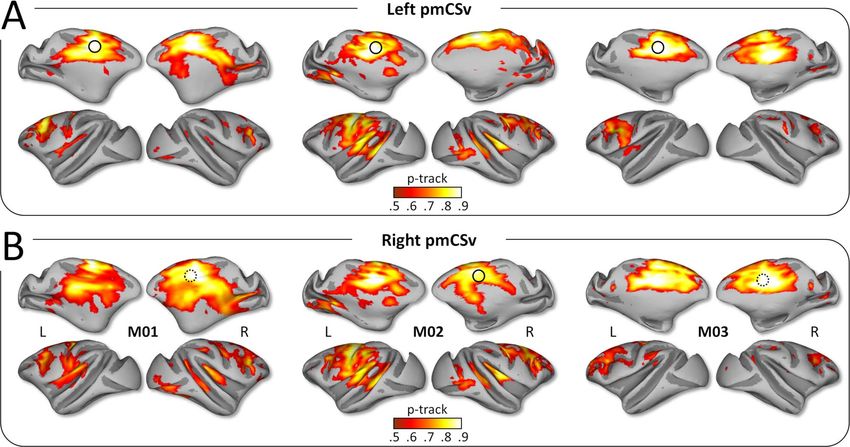
1352         Cerebral Cortex, 2021, Vol. 31, No. 2

                                                                                                                                                                                       Downloaded from https://academic.oup.com/cercor/article/31/2/1347/5927961 by guest on 03 November 2021
Figure 1. Cortical activations for egomotion-consistent optic f low stimuli. (A) Illustration of the egomotion-consistent (EC) and inconsistent (EI) optic f low stimuli
and t-value maps for the contrast EC > EI in monkeys M01, M02 and M03 (from Cottereau et al. 2017). Significant activations (t-value > 3.1, P < 0.001 uncorrected) are
color-coded in red to white and projected onto medial and lateral views of the inf lated left and right cortical surfaces of the individual monkeys. Putative monkey
CSv (pmCSv) was found in 4/6 hemispheres (black circles) and the corresponding location is indicated in the other 2 hemispheres (dotted black circles). Activations of
pmCSv in the left hemisphere of M01, M02, and M3 and in the right hemisphere of M02 are also shown on horizontal slices through the native volumetric space (black
circles in the lower row of the panel). (B) Overlap of the activation maps across the 6 individual cortical surfaces. Individual maps were registered and projected onto
f lattened and inf lated representations of the right cortical hemisphere of monkey F99 (see Methods section). Only activation sites found in at least 3/6 hemispheres
are shown (cas: calcarine sulcus; pos: parieto-occipital sulcus; cis: cingulate sulcus; ips: intraparietal sulcus; ls: lateral sulcus; ios: inferior occipital sulcus; sts: superior
temporal sulcus; cs: central sulcus; as: arcuate sulcus). (C) Average activations (mean t-value) across the sites that were significant in at least 3/6 hemispheres. Black
dots indicate the local maxima of this group analysis (V3A/PIP, MSTd, STPm, VIP, 7a, FEFsem, FEFsac and pmCSv). See Supplementary Figure 4A for area V6 (marked
with dark gray).

between the medial border of area V3A and the latero-posterior                               right pmCSv (Figure 2A and B, respectively). These maps are
border of the posterior intraparietal (PIP) area according to the                            shown on medial and lateral views of the inflated left and
atlas of Markov et al. (2014). The detection of this additional                              right cortical surfaces of the various monkeys M01, M02, and
activation focus is probably due to the improved procedure for                               M03. In all 3 animals, structural connectivity (p-track > 0.5) was
interindividual cortical surface registration used in the present                            observed within a widespread network encompassing the tem-
study (see Supplementary Fig. 1).                                                            poral, parietal and frontal lobes, and including a large portion
                                                                                             of the cingulate cortex. Remarkably, the cortical distribution of
                                                                                             significant structural connectivity is very similar between (1) left
Whole-Brain Structural Connectivity of pmCSv Based                                           and right pmCSv, (2) ipsilateral and contralateral hemispheres,
on Diffusion MRI                                                                             and (3) the 3 monkeys.
First, we used the diffusion MRI data to create individual whole-                               The strong interindividual and interhemispheric similarity
brain probabilistic maps of structural connectivity with left and                            is well illustrated when projecting all the individual structural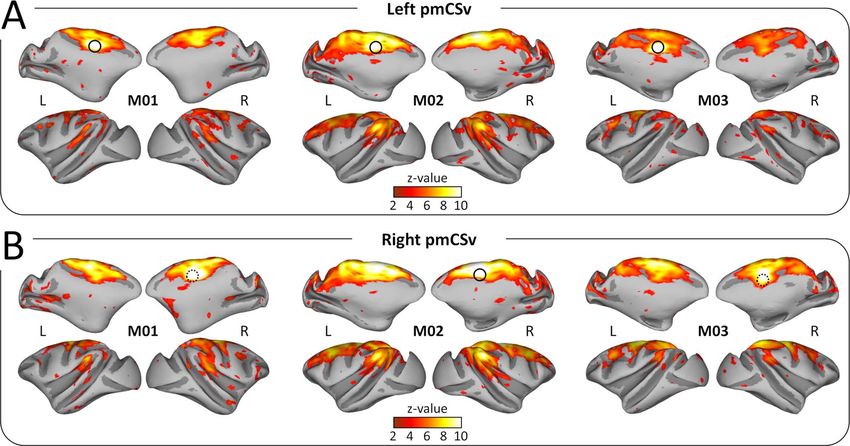
Connectivity of Monkey CSv De Castro et al.                          1353

                                                                                                                                                                             Downloaded from https://academic.oup.com/cercor/article/31/2/1347/5927961 by guest on 03 November 2021
Figure 2. Structural connectivity: individual results. Whole-brain structural connectivity (diffusion MRI) of the left pmCSv (A) and the right pmCSv (B). Individual track
probabilities (p-track) maps are projected onto medial and lateral views of the inf lated left and right cortical surfaces for the 3 monkeys (threshold: p-track > 0.5).

connectivity maps onto flattened and inflated representations                           right pmCSv, (b) ipsi- and contralateral hemispheres and (c) the
of the right cortical surface of the reference monkey F99. By                           3 monkeys. Significant negative correlations (z-value > 1.96; P
focusing on the cortical regions exhibiting supra-threshold con-                        value < 0.05) were sometimes observed in the individual maps
nectivity in at least half (3/6) of the individual hemispheres, we                      (Supplementary Fig. 2), but by contrast with the positive ones,
could confirm that in both ipsilateral (Fig. 3A) and contralateral                      they exhibited neither interhemispheric nor interindividual
(Fig. 3B) hemispheres, pmCSv was connected with a large num-                            consistency. For that reason, we decided to not consider them
ber of cortical areas notably encompassing the cingulate (cis),                         further.
arcuate (as), central (cs), intraparietal (ips), lateral (ls) and supe-                     The strong reproducibility of the results across monkeys
rior temporal (sts) sulci (see Fig. 1B for the localization of these                    and hemispheres is also demonstrated when projecting all the
sulci). Figure 3 shows maps of both the number of hemispheres                           individual functional connectivity maps onto the flattened and
with supra-threshold track probabilities (with 3/6 hemispheres                          inflated representation of the right cortical surface of the ref-
as threshold; left maps with cold color code) and the average                           erence monkey F99. Using the same threshold as for structural
structural connectivity strength (mean p-track with the same                            connectivity (at least 3/6 individual hemispheres with signifi-
threshold; right maps with hot color code). Note that for the very                      cant connectivity), we show that pmCSv connects functionally
large majority of cortical regions found to connect with pmCSv,                         with a large number of cortical areas encompassing the cingu-
the evidence were found in at least 4 hemispheres and thus from                         late, arcuate, central, intraparietal, lateral and superior temporal
all of the individual monkeys. For the few regions with only 3                          sulci, in both ipsilateral (Fig. 5A) and contralateral (Fig. 5B) hemi-
significant hemispheres, we will specify whenever connectivity                          spheres. This is evident in maps plotting the number of hemi-
could be confirmed in only 2 of the 3 animals.                                          spheres with supra-threshold/significant functional connectiv-
                                                                                        ity (left maps with cold color code) and in maps showing the
                                                                                        average functional connectivity strength (mean z-value; right
Whole-Brain Functional Connectivity of pmCSv Based                                      maps with hot color code).
on Resting-State fMRI
In a second step, we used the resting-state fMRI data to
                                                                                        Whole-Brain Convergence of Structural and Functional
create individual whole-brain correlational maps of functional
                                                                                        Connectivity
connectivity with left and right pmCSv (Fig. 4A and B, respec-
tively). As in Figure 2, these individual maps are shown on                             As a third step, we wished to identify the sites of convergence
medial and lateral views of the inflated left and right cortical                        between structural and functional connectivity with pmCSv. To
surfaces of our 3 monkeys. In all of them, significant functional                       that end, Figure 6A shows, in red, the cortical regions with supra-
connectivity (z-value > 1.96; P value < 0.05) again defines a                           threshold structural connectivity at the group level (at least 3/6
wide network encompassing the temporal, parietal and frontal                            hemispheres) and, in green, those with significant functional
lobes, and including a large portion of the cingulate cortex.                           connectivity (at least 3/6 hemispheres), for both ipsilateral (left
As we observed for the structural connectivity, functional                              maps) and contralateral (right maps) hemispheres. The regions
connectivity was found to be very similar between (a) left and                          of structural/functional convergence are shown in yellow.
1354        Cerebral Cortex, 2021, Vol. 31, No. 2

                                                                                                                                                                          Downloaded from https://academic.oup.com/cercor/article/31/2/1347/5927961 by guest on 03 November 2021
Figure 3. Structural connectivity: group results. Whole-brain pmCSv structural connectivity. Cortical sites showing significant structural connectivity (p-track > 0.5)
in at least 3/6 hemispheres (F99 overlap) are shown on the left and the corresponding mean structural connectivity (F99 average) is shown on the right, overlaid in
both cases on an inf lated and f lattened representation of the right cortical hemisphere of monkey F99. (A) Ipsilateral connectivity: tracks of the left pmCSv within
left hemisphere and right pmCSv within right hemisphere. (B) Contralateral connectivity: tracks of the left pmCSv with right hemisphere and right pmCSv with left
hemisphere. Black dots indicate the local maxima of the responses to egomotion-consistent optic f low stimuli (see Figure 1), with the location of pmCSv signaled by
continuous or dotted black circles for the ipsilateral and contralateral pmCSv, respectively. White dotted lines show the delineation of the main sulci.

    It can be observed that convergence is found in portions of                       motor connections. Note, however, that anesthetized states
all the sulci previously identified with both methods separately,                     tend to produce functional connectivity patterns more closely
namely the cingulate (cis), arcuate (as), central (cs), intraparietal                 resembling the structural connectivity (Barttfeld et al. 2015).
(ips), lateral (ls) and superior temporal (sts) sulci (as labeled                     Moreover, resting-state approaches are more prone to show
in Fig. 1B). However, the structural and functional connectivity                      also indirect connections than structural approaches
patterns of pmCSv are not perfectly overlapping (Fig. 6A). In                         (Koch et al. 2002).
the posterior cortex (parietal, occipital), functional connections
were more dominant. This likely reflects intrinsic properties
                                                                                      Structural and Functional Connectivity with Areas
and limitations associated with the two approaches. Functional
                                                                                      Sensitive to Consistent Optic Flow
connectivity based on resting state (unlike structural connec-
tivity based on diffusion MRI) is partially dependent on the                          Interestingly, Figure 6A also reveals that many of the ipsilat-
subject’s state (Zhang et al. 2019). It is possible that the monkey’s                 eral and contralateral sites showing convergence of results
state (anesthetized, eyes closed, head restrained) during the                         between methods closely match with areas previously shown
functional MR examinations accentuated visual more than                               to process visual cues to self-motion in the same animals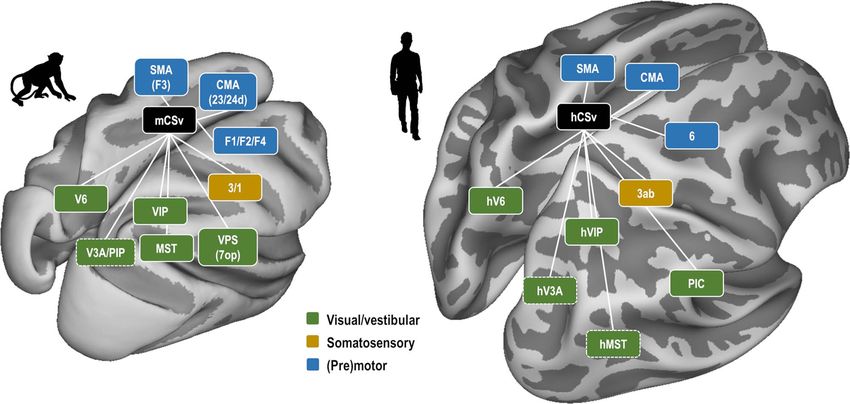
Connectivity of Monkey CSv De Castro et al.                          1355

                                                                                                                                                                             Downloaded from https://academic.oup.com/cercor/article/31/2/1347/5927961 by guest on 03 November 2021
Figure 4. Functional connectivity: individual results. Whole-brain resting-state functional connectivity of the left pmCSv (A) and the right pmCSv (B). Individual z-value
maps are projected onto medial and lateral views of the inf lated left and right cortical surfaces for the 3 monkeys (threshold: z-value > 1.96).

(Cottereau et al. 2017). This is unsurprising for pmCSv, but                            Finally, Figure 6C shows that when translated into t-values
it holds for areas, which are relatively far apart, such as                             (see Methods), the structural and functional connectivity
VIP, FEFsem, and MSTd. To further investigate the structural                            strengths are well correlated, pointing to VIP and FEFsem as the
and functional connectivity of pmCSv with areas sharing its                             areas most strongly connected to pmCSv, followed by MSTd, FEF-
responsiveness to visual cues to self-motion, we performed                              sac, VPS and V3A/PIP. Note that these optic flow sensitive areas
additional ROI-based analyses in the structural and functional                          were systematically identified in all 3 animals (see Table 1 in
domains (see Methods section). Following Smith et al. (2018), the                       Cottereau et al. 2017). Since we could also localize area V6 in 2 of
mean connectivity across the early visual areas V1/V2/V3 was                            the 3 animals, we extended our ROI-based analysis to this area,
used as a baseline, since neither the human CSv nor its putative                        which is one of the more strongly connected with CSv in humans
monkey counterpart are expected to have direct connections                              (Smith et al. 2018). As shown in Supplementary Figure 4, the
with them. In the structural domain, the upper graph (in red) of                        portions of area V6 sensitive to egomotion-consistent optic flow
Figure 6B indicates that most areas previously identified for                           in M01 and M02 (Supplementary Fig. 4A) have no significant
their sensitivity to visual cues to self-motion (MSTd, STPm,                            structural connectivity with pmCSv (Supplementary Fig. 4B)
VIP, VPS, FEFsem and FEFsac) were more connected to pmCSv                               and only moderate functional connectivity, mostly driven by
than to the early visual cortex. This was also the case for the                         M02 (Supplementary Fig. 4C). This analysis confirms a marked
newly identified portion of V3A/PIP. A notable exception is area                        difference between human V6 and its monkey counterpart, since
7a/Opt, whose mean structural connectivity was similar to that                          the latter is neither strongly responsive to egomotion-consistent
of V1/V2/V3 (dashed horizontal line). In the functional domain,                         optic flow patterns, nor clearly connected to pmCSv.
the lower graph (in green) of Figure 6B reveals a very similar
pattern of results, with the majority of ROIs highly connected
to pmCSv compared to V1/V2/V3. Here, however, 7a/Opt was
                                                                                        Structural and Functional Connectivity
found to be functionally connected to pmCSv while STPm was                              with Whole-brain Atlas-Defined Areas
not (relative to V1/V2/V3). Note that for all these ROIs, the                           Our last analysis extended the ROI-based approach described
relative strengths of structural and functional connectivities                          above to an extensive set of atlas-defined areas covering the
were strikingly similar between the ipsilateral (black circles)                         whole cortical surface. We relied on the cortical parcellation
and contralateral (white circles) hemispheres. Note also that                           introduced by Markov and collaborators (2014), based on his-
the analyses were performed in the surface space of the right                           tological (Markov et al. 2011) and atlas-based (Paxinos et al.
cortex of monkey F99, after projection of the individual ROIs                           2000; Saleem and Logothetis 2007) landmarks, which contains
onto it. However, our control analyses showed (1) that the                              91 distinct areas already available on the reference monkey F99
structural connectivity results were similar when running the                           (see Fig. 7C for the parcellation scheme on top of the flattened
ROI-to-ROI analysis in the initial volumetric diffusion MRI space                       right cortical surface of F99). Profiles of structural and func-
(Supplementary Fig. 3A) and (2) that the functional connectivity                        tional connectivity strengths (mean p-tracks and mean Fisher Z-
results were also reproducible when splitting the odd and even                          transformed r-values across the 6 ipsilateral and 6 contralateral
runs acquired with resting-state fMRI (Supplementary Fig. 3B).                          hemispheres) are shown in Figure 7A for all these areas, with
1356 Cerebral Cortex, 2021, Vol. 31, No. 2
Downloaded from https://academic.oup.com/cercor/article/31/2/1347/5927961 by guest on 03 November 2021
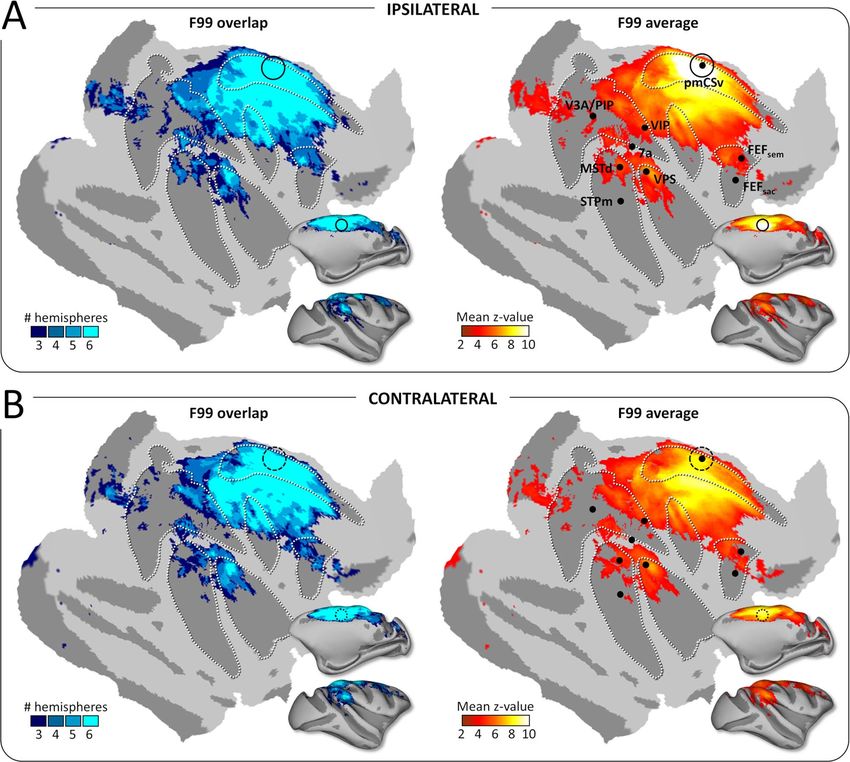
Figure 5. Functional connectivity: group results. Whole-brain pmCSv resting-state functional connectivity. Cortical sites showing significant functional connectivity
(z-value > 1.96) in at least 3/6 hemispheres (F99 overlap) are shown on the left and the corresponding mean functional connectivity (F99 average) is shown on the right,
overlaid in both cases on an inf lated and f lattened representation of the right cortical hemisphere of monkey F99. (A) Ipsilateral connectivity: mean z-values of the left
pmCSv within left hemisphere and right pmCSv within right hemisphere. (B) Contralateral connectivity: mean z-values of the left pmCSv with right hemisphere and
right pmCSv with left hemisphere. Black dots indicate the local maxima of the responses to egomotion-consistent optic f low stimuli (see Figure 1), with the location
of pmCSv signaled by continuous or dotted black circles for the ipsilateral and contralateral pmCSv, respectively. White dotted lines show the delineation of the main
sulci.
the mean connectivity strengths of V1/V2/V3 (horizontal dashed visuo-somatosensory (areas 1, 3 and 2, STPc) and (pre)motor
lines) used as a baseline for statistical evaluation. In total, 20 (23, F3, 24d, F1, F2, F4, F6). In the visual and visuo-vestibular
of these areas exhibited both significantly stronger structural domains, this atlas-based analysis both confirms and extends
connectivity and stronger functional connectivity with pmCSv the results obtained with regions sensitive to visual cues to self-
than that measured for V1/V2/V3 areas, as shown with the motion that were identified in the same 3 animals (Cottereau
t-value statistics of Figure 7B (t-value > 2.6 for both structural et al. 2017). Notably, VIP was found to be strongly connected
and functional connectivity; p-value < 10−4 for combined prob- to pmCSv with both analyses, and the same holds for FEFsem
ability). These 20 areas are color coded from blue to yellow (whose location matches that of 8 m in the atlas), VPS (in close
in Figure 7B and C, depending on the normalized combined correspondence with area 7op in the atlas), and MSTd (matching
connectivity strength (see Methods section). the atlas-defined MST). In addition, the atlas-based analysis
Table 1 provides summary statistics for these 20 areas, reveals strong pmCSv connections with the medial posterior
that can roughly be classified as visual or visuo-vestibular parietal area 7 m (also known as PGm), which has been shown
(7 m, 7op, 8 m, VIP, Tpt, MST, LIP, MT, V6), somatosensory or to be involved in navigation (Passarelli et al. 2018), and residualConnectivity of Monkey CSv De Castro et al. 1357
Downloaded from https://academic.oup.com/cercor/article/31/2/1347/5927961 by guest on 03 November 2021
Figure 6. Conjunction of functional and structural connectivity. (A) Overall maps of pmCSv connectivity, with structural connectivity only (in red), functional
connectivity only (in green), or both types of connectivity (in yellow), projected on f lattened and inf lated representations of the right cortical hemisphere of monkey
F99. Maps of ipsilateral and contralateral connectivity are shown on the left and right sides, respectively. Regions that are specifically activated by egomotion-consistent
optic f low are indicated: V3A/PIP, MSTd, STPm, 7a, VIP, VPS, FEFsem, FEFsac (Figure 1). Borders of the visual areas V1, V2, and V3 are shown as black lines. Black circles
indicate the local maxima of the responses to egomotion-consistent optic f low stimuli (Figure 1), with the location of pmCSv signaled by continuous or dotted black
circles for the ipsilateral and contralateral pmCSv, respectively. White dotted lines show the delineation of the main sulci. (B) Bar graphs of pmCSv mean structural
(track probabilities; in red) and functional (correlation coefficients; in green) connectivity (with 95% confidence intervals) with each of the target areas marked in (A).
The horizontal dashed lines represent the average results of V1/V2/V3 for statistical comparison. Individual results are shown as black and white dots for ipsilateral
and contralateral connectivity respectively. (C) Scatterplot showing the strength of the structural and functional connectivity for all the target areas relative to the
mean connectivity of V1/V2/V3, expressed as t-values. The dotted lines indicate the threshold of statistical significance (t-value>2.6; P < 0.05).
but significant structural and functional connections with areas The scatter plot of t-values in Figure 7B also shows several
MT and V6, both known to play a central role in the processing brain areas with negative t-values (bottom-left corner of the
of visual motion (Passarelli et al. 2011; Fan et al. 2015). Regarding plot), suggesting less connectivity with pmCSv than between
the connections of pmCSv with somatosensory areas on the V1/V2/V3 and pmCSv. On the one hand, this confirms that
one hand, and with (pre)motor areas of the cingulate and dorsal our baseline (V1/V2/V3) is indeed a conservative threshold. A
prefrontal cortex on the other hand, both of them are highly conservative threshold is needed in order to protect our analysis
reminiscent of the connectivity pattern described for human against false positives. Note, however, that this means that
CSv (Smith et al. 2018). the plotted connectivity measures reflect relative rather than1358 Cerebral Cortex, 2021, Vol. 31, No. 2
Downloaded from https://academic.oup.com/cercor/article/31/2/1347/5927961 by guest on 03 November 2021
Figure 7. Whole-brain atlas-based analysis of structural and functional connectivity. (A) Profiles of structural (in red) and functional (in green) connectivity scores
for the areas of the M132 atlas (Markov et al. 2014). The horizontal dashed lines represent the average results of V1/V2/V3. Asterisks indicate the areas for which
the structural and functional connectivity are significantly stronger than that of reference areas V1/V2/V3 (t-value > 2.6; P < 0.05). (B) Scatter plot of structural and
functional t-values for the 20 areas showing significant connectivity (t-value > 2.6 as indicated by dashed lines) with pmCSv. Gray dots represent the t-values of the
remaining areas. Negative values represent areas with lower connectivity strength than the reference areas (V1/V2/V3). (C) The 91 areas of the M132 atlas registered
onto the right cortical surface of monkey F99. The 20 areas color-coded from blue to yellow (according to the normalized average of their t-values for functional and
structural connectivity; i.e., their connectivity strength, see Methods) are those showing statistically stronger structural and functional connectivity with pmCSv than
areas V1/V2/V3. White dotted lines show the delineation of the main sulci. See also Supplementary Table 1.
absolute levels of connectivity. On the other hand, it is possible Discussion
that early visual areas (V1/V2/V3), unlike previously thought,
The major aim of the present study was to investigate the
might be connected to pmCSv either by direct or indirect con-
connectivity of pmCSv, a region that has recently been identified
nections. The whole-brain connectivity maps (Fig. 5) suggest
in macaques (Cottereau et al. 2017), and which might repre-
that at least small portions of V1/V2/V3 are functionally con-
sent the functional equivalent of human CSv (Wall and Smith
nected with pmCSv. Most of the visual input to CSv and related
2008). Recently, the connectivity of human CSv was examined
self-motion-sensitive areas can be assumed to derive in some
in detail using two different strategies, (1) the study of its struc-
way from activity in V1 (principally via its projection to MT)
tural connections based on diffusion-weighted MRI and (2) the
so some degree of connectivity with V1, mediated by indirect
study of its functional connections based on resting-state fMRI
connections, is expected. V2 and V3 both have projections to
(Smith et al. 2018). Here, we have implemented a comparable
MT (Felleman et al. 1997; Gattass et al. 1997) and may also be
procedure in 3 macaques in order to investigate the connectiv-
involved; in humans, global motion direction can be decoded
ity of pmCSv with that of human CSv. First, we analyzed the
in both these areas (Furlan and Smith 2016). Data from the
whole-brain patterns of structural and functional connectivity
structural and functional connectivity strength (mean and SD)
in order to localize the cortical regions connected with pmCSv.
between pmCSv and all the atlas-defined areas are shown in
The two connectivity approaches resulted in broadly converging
Supplementary Table 1.Connectivity of Monkey CSv De Castro et al. 1359
evidence. Secondly, we made ROI to ROI analyses for the purpose In humans, the structural and functional connectivity of CSv
of studying more specifically the connections of pmCSv with points to hV6, hVIP, and PIC as the most important sources of
areas sensitive to self-motion-consistent optic flow. Thirdly, visual and/or vestibular information, with an additional poten-
we conducted an exhaustive atlas-based analysis. Essentially, tial contribution of hMST and V3A (Smith et al. 2018). Assuming
our results show that pmCSv connects structurally and func- a functional equivalence between monkey VPS and human PIC
tionally with several visual and/or vestibular areas, as well as (Chen et al. 2011b; Frank et al. 2014; Wirth et al. 2018), the
with somatosensory areas. Besides those (multi)sensory areas, commonalities between both primate species are significant. A
pmCSv was also found to connect strongly with (pre)motor areas notable difference is area V6. In humans, hV6 was found to be
of the anterior cingulate and dorsal prefrontal cortices. This among the areas most strongly connected to CSv, while in mon-
connectivity pattern presents many commonalities with that keys, the V6/pmCSv connection, is the weakest in our analysis
documented for human CSv, though with some exceptions, and (see Table 1) and it was not confirmed in the ROI-based analysis
it suggests that in both species, this area might play a central (see Supplementary Fig. 4). Importantly, this difference echoes
role in the sensorimotor control of locomotion. In the following that already documented regarding their respective sensitivities
Downloaded from https://academic.oup.com/cercor/article/31/2/1347/5927961 by guest on 03 November 2021
paragraphs we will discuss in more detail the visuo-vestibular, to egomotion-consistent optic flow stimuli, which is strong in
somatosensory and (pre)motor connections of pmCSv. human hV6 (Cardin and Smith 2010) but weak in monkey V6
(Cottereau et al. 2017). The fact that a species difference in rela-
tion to V6 is evident for both visual sensitivity and connectivity
suggests strongly that the difference is real. A comprehensive
Connectivity of pmCSv with Visual and/or Vestibular
cross-species comparison of sensitivity to visual/vestibular cues
Areas
to self-motion in different cortical regions has been provided by
The convergence of structural and functional connectivity Smith et al. (2017).
reveals that pmCSv is connected with most of the regions that
were previously shown to respond to egomotion-consistent
Connectivity of pmCSv with Somatosensory Areas
optic flow (Cottereau et al. 2017). The strongest of these con-
nections were observed for VIP and FEFsem (Fig. 6C). Significant Our whole-brain analysis reveals a convergence of structural
connectivity was also evident for VPS and MSTd. These results and functional connectivity for pmCSv with the anterior and
are largely confirmed by the atlas-based analysis (Fig. 7), where posterior banks of the central sulcus (Fig. 6A), which are involved
FEFsem likely corresponds to area 8 m (Babapoor-Farrokhran in motor and somatosensory functions, respectively. Regarding
et al. 2013) and VPS to 7op (Chen et al. 2011a). All four regions the somatosensory connections, the atlas-based analysis
have been shown to process both visual and vestibular inputs further confirmed strong connectivity with the somatosensory
(Schlack et al. 2002; Gu et al. 2008, 2016; Chen et al. 2011a, 2011b), areas 1 and 3, and to a lesser extent with area 2 (Fig. 7B and
indicating that pmCSv has access to both types of self-motion C). Although the somatosensory cortex handles all sorts of
cue. Note that for VIP and FEFsem/8 m, the t-values of structural somatic signals, it has notably been shown to process those
and functional connectivity were much higher in the ROI-based triggered by locomotion in humans (la Fougère et al. 2010),
than in the atlas-based analysis. This suggests that these atlas- monkeys (Fitzsimmons et al. 2009), and other mammals (Chapin
based areas may not be functionally homogeneous but rather and Woodward 1982; la Fougère et al. 2010; Favorov et al. 2015;
may comprise different zones with different sensitivities, in Karadimas et al. 2020). In addition, pmCSv was also found to
which case the connectivity with pmCSv might target mostly connect structurally and functionally with the caudal portion
those portions that are sensitive to self-motion-consistent of the superior temporal polysensory (cSTP) area, which is
optic flow. also known to process somatosensory and visual information
Besides those connections, the atlas-based analysis reveals (Bruce et al. 1981; Hikosaka et al. 1988). By showing that pmCSv
a strong connection between pmCSv and the medial posterior is linked to visual, vestibular and somatosensory areas, our
area 7 m/PGm (Table 1 and Fig. 7). This observation fits with results reinforce the idea that this posterior cingulate area
previous anatomical studies that documented projections from integrates signals from various sensory modalities recruited
7 m/PGm to area 23, where pmCSv is located (Leichnetz 2001; during self-motion.
Passarelli et al. 2018). Area 7 m/PGm receives strong inputs from
V6A (Passarelli et al. 2011) as well as from other visuomotor areas
Connectivity of pmCSv with Motor and Premotor Areas
such as FEFsem, MST, and LIP, which has led to postulate its
involvement in visuospatial cognition and notably navigation According to the atlas delineation, pmCSv belongs to a subdivi-
(Passarelli et al. 2018). Interestingly, the same group (Passarelli sion of cingulate area 23 (Fig. 7C) called 23c, within the ventral
et al. 2011) has previously shown that area 23 does not connect bank of the cingulate sulcus (Vogt et al. 1987). Area 23c also
to V6A, which is also in agreement with our results. houses a motor area known as the ventral cingulate motor area
Our atlas-based analysis also shows that pmCSv has low- CMAv (Picard and Strick 1996), which might well correspond to
strength connections with LIP, V6 and MT. However, none pmCSv. Alternatively, pmCSv might be posterior to CMAv and
of these areas exhibit clear-cut preference for egomotion- connect to that latter as it does with other premotor areas of the
consistent over inconsistent optic flow stimuli (Cottereau et al. hemispheric medial wall (Matelli et al. 1991), that is, area 24d
2017) nor any special sensitivity to vestibular signals (Colby (also called rostral cingulate motor area, CMAr) and F3 (the sup-
et al. 1993; Fan et al. 2015). Altogether, these observations plementary motor area, SMA). Interestingly, microstimulation
raise the possibility that the underlying connections may be of F3 and 24d evokes both hindlimb and forelimb movements
indirect, through MSTd or VIP for instance (Boussaoud et al. (Luppino et al. 1991). The exact role of these areas is uncertain
1990; Shipp et al. 1998; Galletti et al. 2001) and that the weak but, given their connectivity with pmCSv, it is possible that
connectivity of these areas with pmCSv may be of limited their motor functions are entirely or predominantly locomotion
functional significance. related. Two lateral premotor areas were also found to haveYou can also read