SurgeryCuts: Embedding Additional Information in Maps without Occluding Features - BIB Vis LS Keim
←
→
Page content transcription
If your browser does not render page correctly, please read the page content below
Eurographics Conference on Visualization (EuroVis) 2019                                                                             Volume 38 (2019), Number 3
M. Gleicher, H. Leitte, and I. Viola
(Guest Editors)

             SurgeryCuts: Embedding Additional Information in Maps
                           without Occluding Features

                        M. Angelini1 and Juri Buchmüller2 and Daniel A. Keim2 and Philipp Meschenmoser2 and G. Santucci1

                                         1 Sapienza   University of Rome, Rome, Italy 2 University of Konstanz, Konstanz, Germany

Figure 1: SurgeryCuts allows to create arbitrary cuts on maps for additional canvas area. This example shows two cuts in different size and
orientation. The outlined area is the area affected by distortion. The inset explains the interactive configuration and creation of a cut.
        Abstract
        Visualizing contextual information to a map often comes at the expense of overplotting issues. Especially for use cases with
        relevant map features in the immediate vicinity of an information to add, occlusion of the relevant map context should be avoided.
        We present SurgeryCuts, a map manipulation technique for the creation of additional canvas area for contextual visualizations
        on maps. SurgeryCuts is occlusion-free and does not shift, zoom or alter the map viewport. Instead, relevant parts of the map can
        be cut apart. The affected area is controlledly distorted using a parameterizable warping function fading out the map distortion
        depending on the distance to the cut. We define extended metrics for our approach and compare to related approaches. As well,
        we demonstrate the applicability of our approach at the example of tangible use cases and a comparative user study.
        CCS Concepts
        • Human-centered computing → Geographic Visualization; Visualization Techniques; Information Visualization;

1. Scope of SurgeryCuts                                                                  the same time, anything you add on top of a map also occludes what
                                                                                         lies beneath. As a result, map context and information can get lost.
Geographic maps are representations of spatial contexts, as                              A variety of techniques has been developed to alleviate this problem.
MacEachren explains in “How maps work” [Mac04]. Using maps,                              We have identified three families of approaches that can be applied
information can be tied and connected to single locations or exten-                      to a map in order to add new or substantiate existing information
sive areas. Enriching geographical maps with additional information                      which are relevant to our proposal. We compare them in Figure 2.
is both a common and well-researched task. Yet, this task can also
prove to be challenging: Inherently, information that you want to                        Occlusion-Based First, we regard occlusion-based solutions that
add to a specific location has to be drawn on top of the map or taken                    solely rely on imposing information on the map without alter-
out of the immediate spatial context by putting it next to the map. At                   ing the map structure. Due to the concept’s simplicity, the field

© 2019 The Author(s)
Computer Graphics Forum © 2019 The Eurographics Association and John
Wiley & Sons Ltd. Published by John Wiley & Sons Ltd.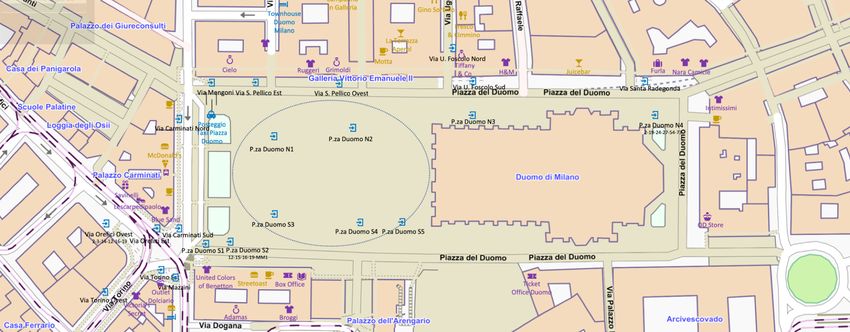
M. Angelini et al. / SurgeryCuts: Embedding Additional Information in Maps without Occluding Features

                   Figure 2: A comparison of techniques related to SurgeryCuts and examples for each kind of approach.

of resulting approaches is vast and cannot be discussed in detail.           is oriented towards interaction with volumes, whereas we focus
MacEachren [Mac04] provides an introduction to the representation            on the creation of the additional canvas area and the implications
of information on maps, and an extensive display of data visualiza-          of the distortion towards the spatial map topology. Finally, a set of
tion techniques for maps can be taken from Dykes et al. [DMK05].             rather recent approaches including the SpaceCuts approach by Buch-
                                                                             müller et al. [BJSK16] and Route-Zooming as presented by Sun et
Distortion-Based Second, distortion-based approaches can allevi-             al. [SLQW17] aims to make use of map structures such as roads or
ate the impact of occlusion by distorting a map, emphasizing areas           railroad tracks. By expanding these structures in a controlled manner,
and presenting more or different information than compared to the            additional canvas areas can be generated without occluding other
undistorted original scale of the map. A recent survey by Tomin-             map features. Haunert et al. [HS11] combine structural dependency
ski et al. [TGK∗ 17] provides an extensive overview on the current           and distortion techniques to highlight certain areas of road networks
approaches. Classical distortion-based techniques such as the graph-         but do not create additional space for visualization. Necklace Maps
ical Fisheye Views introduced by Sarkar and Brown [SB94] mostly              by Speckmann and Verbeek [SV10] arrange additional information
employ a uniform distortion, such as a circle fading out the distor-         around geospatial areas, which requires having enough empty or
tion radially around the center of focus. On the other hand, discrete        unimportant space around the features to be visualized.
lenses can be arbitrarily shaped and do not necessarily follow uni-
                                                                                Further techniques exist to contextualize information with spatial
form distortion patterns. For discrete lenses, it can even happen
                                                                             locations outside of a given map. For example, off-screen visual-
that a non-regular distortion shape causes overplotting again, as
                                                                             izations such as EdgeRadar [GI07] place additional information
examples of the survey of Neumann and Carpendale [NC03] show.
                                                                             around a map location. Since the focus of SurgeryCuts is to create
A specific technique to be mentioned are Bifocal Displays, as in-
                                                                             additional visualization space directly on a map, we intentionally
troduced by Spence and Apperley [SA82] in 1982. Here, a portion
                                                                             do not compare to techniques that pull the visualization context out
of the data space is presented in more detail than another. While
                                                                             of the map. For each of the techniques we take into account, we
retaining continuity across boundaries, the area not in focus is dis-
                                                                             have identified a set of five relevant features that can be employed
torted to adapt to the additional space needs of the detailed view.
                                                                             to characterize its implications for the physical map space and the
The focus+glue+context approach by Takahashi [Tak08] can be con-
                                                                             potential and consequences of adding information to the map. We
sidered as a combination of Fisheye Views and Bifocal Displays.
                                                                             compare the following aspects:
Other techniques exist in the field of volume distortion, such as the
Ray Deflector approach by Kurzion and Yagel [KY95], which share              ACA is an Additional Canvas Area. ACAs indicate whether a tech-
aspects with SurgeryCuts concerning selectivity and locality of in-            nique creates additional room on a map that does not interfere
troduced deformations. While we focus on 2D map manipulation                   with map features and that can be used for applying visualizations.
only, ray deflectors also do not regard the creation of additional           STRUCTURE INDEPENDENCE denotes whether a technique
space on the map or implications for the surrounding elements.                 can be applied to arbitrary parts of a map or it is tied to fixed map
                                                                               structures such as roads or rivers.
Structural The same metaphore of surgical cuts, although in a                VIEWPORT SHIFT occurs if a technique alters the map in a way
much more literal way, is employed by Correa et al. [CSC06], who               that not all parts of the map included in the original viewport will
describe a set of methods for the interactive manipulation of vol-             be displayed after application of the technique.
ume data to create illustrative visualizations. Extending a cut to           CARDINALITY indicates the amount of information a technique
enable observation of underlying tissue in a human body rendering              potentially allows to additionally put on a map.
is one of the prominent examples. Conceptually related, their work           DISTORTION denotes whether the scale of the map is changed

                                                                                                                                                  © 2019 The Author(s)
                                                                                 Computer Graphics Forum © 2019 The Eurographics Association and John Wiley & Sons Ltd.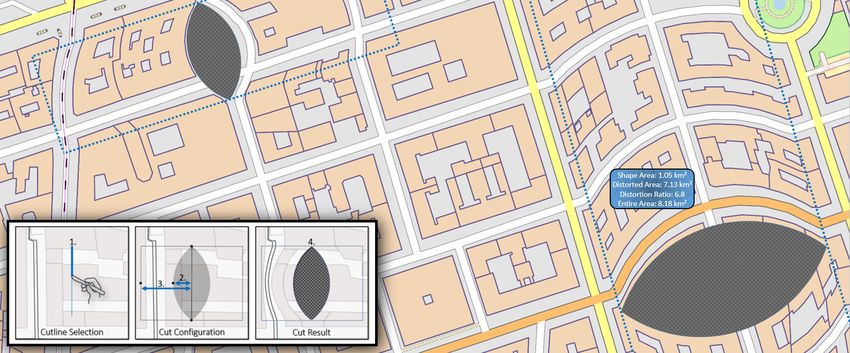
M. Angelini et al. / SurgeryCuts: Embedding Additional Information in Maps without Occluding Features

   by an approach. If so, the intensity denotes how the amount of                           space, and allow for exploring the visualization, e.g., moving a
   distortion introduced is determined. Also, direction explains how                        magnifying lens on the map and zooming to provide more details.
   the distortion is distributed on the map.                                                Illustrative information techniques manipulate volume models
   While each of the presented techniques has individual strengths                          and deal with layered planes of information with the main goal
and suitable use cases, comparing the properties of each approach                           of making evident relative positions among elements of different
reveals a gap that remains to be filled: Occlusion-based solutions                          layers, e.g., human body parts below a cut of the skin.
and lenses do not provide extra space for visualizations on the data                     • To the best of the authors’ knowledge, no lens proposal intro-
space. While occlusion-based approaches just plot over existing map                         duces new space on the map and, as a consequence, using a lens
features, lenses and bifocal displays also add distortion to a map.                         formalism requires to reformulate it in a possibly not straight-
Depending on the distortion technique (e.g., linear distortion vs.                          forward way to take into account the new space that require
distortion based on predefined shapes or map features), a human’s                           additional parameters and maths. SurgeryCuts inherently fea-
perception and cognition of the map can evidently suffer [Gut02],                           tures a clear boundary between added area and map, whereas
while still, map areas have to be occluded to add information. These                        with purely distortion-based approaches, this distinction is not so
issues are discussed extensively by Carpendale et al. [CCF97].                              sharp. Consequently, with conventional approaches, an additional
   In contrast, some structural approaches aim to make use of map                           consideration step concerning overplotted areas is required.
features to create an ACA that allow to put more information on a                        Moreover, SurgeryCuts comes with several quality metrics that
map without occluding surrounding map features. The SpaceCuts ap-                        allow for steering the technique and comparing it with existing
proach by Buchmüller et al. [BJSK16] proposes to cut a map along                         solutions; tangible use cases and a controlled user study demonstrate
continuous map features such as a rivers in two or more pieces, then                     the applicability and the advantages of the technique.
pull the map apart along the created cut axes to create an ACA. Yet,
the amount of created space per distance unit depends on the angle                       Paper structure The details and implications of the construction
towards the axis between the endpoints of the cut - in other words,                      of a SurgeryCut is explained in Section 2. Section 3 lists a set of
depending on the cut shape, sometimes no additional area is created                      metrics derived from the cuts and explains their calculation. These
at all and sometimes even occlusion can happen when the map is                           metrics will later be used for comparison to other techniques in
pulled apart. Further, the cut has to stretch through the whole view-                    Section 4. Section 5 discusses cases that benefit from the usage of
port in order to be able to be pulled apart. Inherently, this technique                  SurgeryCuts and illustrates the applicability thorough two practical
causes map content to be shifted outside of the viewport when a                          use cases from the domains of network security and subway exit
cut is pulled apart. Sun et al. [SLQW17] present another technique                       scenario. Section 6 describe a controlled experiment challenging our
capable of creating an ACA. The Route-Zooming approach is based                          solution against an occlusion based technique and, finally, Section 8
on the application of seam-carving to a map. Using complex shifting                      provides a discussion of SurgeryCuts with regard to the scope of the
and distortion operations, a map feature such as a street can be ex-                     technique and advantages and shortcomings.
panded to create an ACA. The resulting distortion and displacement
is non-linear and aims to retain the topology of the street networks                     2. Technique
used by the authors to demonstrate their approach.                                       In principle, the construction of a SurgeryCut can be summarized in
   The principle of SurgeryCuts is the introduction of cuts in a map at                  three basic steps shown in Figure 1. First, identify a suitable cutline
a position where additional information is to be visualized. Figure 1                    position (1), according to the requirements of a particular use case.
shows an illustration of the process. Much like a surgeon would do,                      Second, the extent of the cut shape (2) and the area of the map
the cut area is extended by pulling the sides of the cut outwards                        influenced by the cut (3) should be set. Lastly, the SurgeryCut is
orthogonally to the cutline. Finally, the distortion introduced to                       applied to the original map, while introducing distortion only to the
the map by this operation will be gradually faded out until the                          influence area (4), and not to the surrounding context. The overall
original map state is re-established. Consequently, a SurgeryCut                         map scope remains the same, while distortion can be controlled.
only introduces local, controlled changes to the map that can be                            In the following, we want to give an in-depth explanation of the
parameterized (e.g., by changing the area influenced by the cut).                        theoretical and practical aspects of this process. First, in Section 2.1
SurgeryCuts Contribution SurgeryCuts introduces the following                            we discuss the implications of the choice of geometric shape applied
key novelties with respect to the discussed available proposals.                         to distort the cut. As well, the distribution of the distortion is im-
                                                                                         portant to consider. Afterwards, we delimit necessary preconditions
• It has the unique feature of visualizing additional information on
                                                                                         and introduce our strategy of vector displacement in Section 2.2.
  any map area without a) occluding map features, b) changing or
  shifting the viewport of the map, or c) relying on map structures
  like roads or rivers. Moreover it allows for explicitly fine tuning                    2.1. Shape Choice and Implications
  the distorted area size and orientation.                                               Before cutting a map area, it is necessary to make a decision on the
• Its intended usage differs from techniques that inspired authors,                      shape to be created by extending the cut. A SurgeryCut follows three
  like Focus plus Context (F+C) or illustrative visualization. The                       principles: First, the creation of a map should not alter the viewport
  purpose of SurgeryCut is to add additional information on the                          of the unchanged map. Consequently, the map area influenced by a
  map, information that refers to elements close to the cut point,                       cut must be contained within the viewport. Second, the distorted area
  making each cut specific to its location, static, and tailored to                      of the map should be generally minimized so that as much area as
  the surrounding by setting distortion orientation and extent. Con-                     possible remains in the original representation. Third, the distortion
  versely, F+C techniques are inherently dynamic, do not create new                      result should retain map feature continuity as much as possible to

© 2019 The Author(s)
Computer Graphics Forum © 2019 The Eurographics Association and John Wiley & Sons Ltd.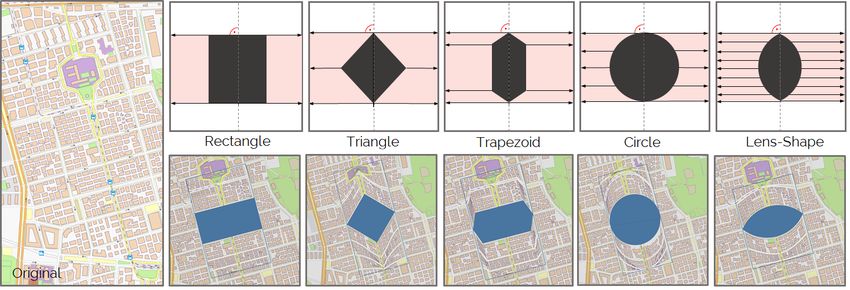
M. Angelini et al. / SurgeryCuts: Embedding Additional Information in Maps without Occluding Features

Figure 3: Five different shapes for the cut expansion. The distortion is orthogonal to the cutline, the length of the arrows indicates the amount
of space available to distribute the amount of distortion. The arrangement of the arrows indicates breaking points in the amount of distortion
introduced. Longer arrows indicate more space to distribute the distortion, thus introducing less intense changes on the map.

avoid losing spatial context. To exemplify different shapes and their         and the supporting function 3. While a rectangular cut shape is
implications, we compare five basic, regular cut shapes in Figure 3.          possibly best suitable as canvas for many different visualizations,
   While theoretically, arbitrary, asymmetric cut shapes could be             the introduced distortion creates a very abrupt change in the visual
implemented, the resulting complex distortion would be very diffi-            map features at the borders of the shape, where everything is shifted
cult to control and interpret, and relations and distances could be           left or right for the width of the rectangle. Perceptually, this would
lost. Thus, we focus on symmetric shapes with the cut as the mirror           cause major disturbances in the map. As a result, in the worst case,
axis. We exemplify five shapes in Figure 3: a rectangular shape, a            an observer could not tell any more whether a map feature next to a
triangle, a trapezoid, a circle and a lenticular shape for the ACA. We        cut is adversely distorted due to a sudden change of the cut shape
identify the number of turning points in the distortion gradient for          or whether it is just the real shape of the map feature. The triangle
each shape: While there are two such points in the rectangular shape,         and trapezoid shapes share this effect, since the change in distortion
the triangle has three and the trapezoid four for each side of the cut.       is quite distinct at the turning points. In comparison, the circular
The circle and the lenticular shape feature have an infinite number           shape distributes the degree of distortion linearly along its outline,
of points where the distortion changes due to the linearity of their          thus alleviating the effects of sudden changes. While this leads to
curvature. Naturally, we could distribute the introduced distortion           a more homogeneous transition between distorted and undistorted
along the vectors of the turning points. For example, in case of the          map parts and within the distortion area, at the bottom and the top of
circle, we could distribute the distortion all around. Yet, it is our         the circle, it can happen that map features parallel to the gradient are
goal to reduce the introduced distortion to a minimum. Thus, we               absorbed. The fifth shape to compare is of lenticular nature, which
choose to only distribute the distortion orthogonally to the cutline          avoids the corner cases of the circular shape, creating no abrupt
as indicated by the red area that denotes the distortion area when            directional distortions to map features along its outline and less
distortion is carried out orthogonal to the cutline. By choosing the          structural issues at the top or bottom areas. A comparison of the
cutline-orthogonal approach over the shape-edge distribution, the             five shapes applied as cuts to the same map excerpt can be seen in
amount of distortion axes is limited to one affected axis of the map.         Figure 3 in the lower half. More details on the construction of a lens
   The application of each shape as cut form has unique implications          shape can be found below in Section 2.2.
to shape, size and configuration of the resulting distorted area. Under
                                                                              Surrounding Area Topology The second factor to consider when
these prerequisites, we discuss three decision factors for the choice
                                                                              choosing an appropriate shape is the topology of the area surround-
of suitable cut shapes in the following paragraphs. First, we consider
                                                                              ing a cut. While conceptually applicably to any kind of map, es-
the amount of distortion as well as the distortion progression along
                                                                              pecially dense urban surroundings pose challenges when a cut is
the cut as the distortion regularity. Second, we compare different
                                                                              introduced: The map displacement corresponds with the shape of
configurations of the map topology around a cut to identify suitable
                                                                              the cut. In other words, while the topology, e.g., the street networks,
cut shapes. Lastly, also the content to be placed in a cut is a decision
                                                                              is not destroyed, it still gets distorted, coming at the cost of interfer-
factor for a shape to choose.
                                                                              ing with an observer’s expectations of a certain area. The choice of
Cut Shape and Distortion Regularity First, we observe the nature              shape determines the perception of the resulting map. For example,
of the space that has to be distorted towards the boundary and                a round cut shape such as the circle or the lenticular cut creates a
the transitions between distortion axes. The distance of each point           more prominent affected area in a regular street grid, e.g. like in
along the shape to the boundary determines the amount of distortion           many US cities, than in less uniform street grids of European cities,
necessary to compress the space taken by the cut. In Figure 3, this           since the cut disturbs the parallel order of the street network.
amount is represented by the length of the exemplary arrows placed               Coming to the question which cut shape is suitable best for which
at pivotal turning points on the shapes in the upper half of the              kind of surrounding area topology, the answer is use-case dependent.
                                                  # »
image. For determining this amount, see also |OO0 | in Figure 4               If the goal is to minimize map disturbance, it is prudent to chose

                                                                                                                                                   © 2019 The Author(s)
                                                                                  Computer Graphics Forum © 2019 The Eurographics Association and John Wiley & Sons Ltd.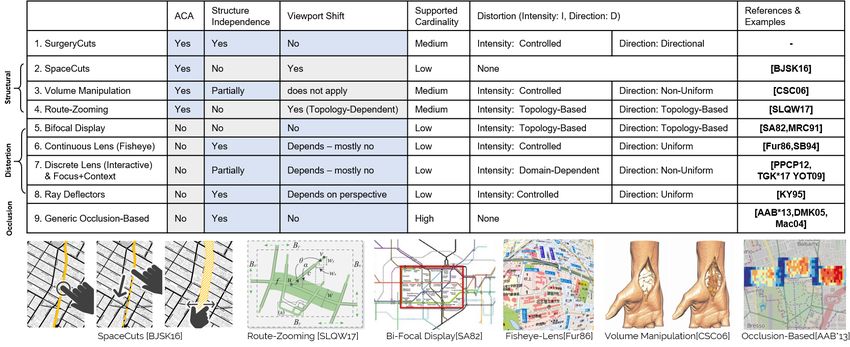
M. Angelini et al. / SurgeryCuts: Embedding Additional Information in Maps without Occluding Features

a shape which corresponds with the alignments of the main map                            4. The lens shape is a familiar distortion curve.
features in the surrounding area. For example, if the surrounding                        5. By restricting the distortion to a single axis orthogonal to a cutline,
features such as streets are mostly aligned orthogonally, choosing                          we are maintaining orthogonality and the mental map as far as
a rectangular cut would fit to the street layout, but only if parallel                      possible, helping users to retain a clear idea of the affected area.
to the other features. On the other hand, the cut would then create                      6. While the cut is not yet animated, we intend to explore this
a transition-free distortion, potentially shifting whole blocks away                        possibility in future work.
from their original context. Consequently, the ability of users to                       Consequently we will explain the construction and application of
navigate the resulting map would suffer if map features are shifted                      SurgeryCuts using the lenticular shape in the remainder of this
without clearly seeing how and by how much. Alternatively, one                           publication, bearing in mind that the construction of other regular
can argue that deliberately choosing a rounded cut shape for an                          shapes follows the same principle.
orthogonally built street network works better since a user is then
able to attribute the rounding of the distorted features to the distor-                  2.2. Lenticular SurgeryCuts: Theoretical Specification
tion and not the original map situation, thus being able to retain the                   In this subsection we provide a theoretical frame for the geome-
right notion of the real map topology when looking at the distorted                      try definition of lenticular SurgeryCuts, i.e., a precise and system-
one. We alleviate such situations by providing visual cues marking                       independent basis for the description of our vector displacement (in
the outlines of the created cut and its area, and by fading out the                      Subsection 2.2.2) and distortion metrics (in Section 3). We initially
distortion outwardly towards the boundaries of the affected area.                        considered to rely on the general magnifying approach proposed by
                                                                                         Carpendale and Montagnese in [CM01] that uses a reference view
Cut Content The third decision factor for the cut shape is the
                                                                                         plane to displace elements in the representation plane to magnify
intended content to be placed in it. Thinking in terms of Data-Ink
                                                                                         the image in the focus and to accommodate distortion; however,
Ratio, a cut should be as small as possible to convey the information
                                                                                         we have decided to not use that proposal because it always implies
needed in order to minimize the map distortion. Thus, the cut shape
                                                                                         the presence of a magnification that does not exist in our approach.
ideally matches the shape of the content placed within the cut. Yet,
                                                                                         Standard radial distortion techniques having an empty center can
not all types of content can be aligned exactly with a cut shape. Icons,
                                                                                         deal in a simpler way with our cut formalization but are not able to
glyphs, labels and visualizations often are not of regular nature.
                                                                                         cope with all the details we need to fine tune our technique and that
   Further, if a related visualization element is to be placed outside                   solution can be considered as a means for a faster implementation.
of the cut, shape and relation of the outer element could be deter-
mined by the cut. Especially, if any outside visualization with spatial
relation would fall within the distortion area of the cut, it would be
subject to the same distortions applied to the map beneath.

Shape Choice The cut shape choice depends on several variables
and requirements,like the placement of the surrounding map features
such as streets and their alignment and parallelism, the size of the
cut, its orientation, and the desired content. Concerning the latter,
the shape optimal for the desired cut content can potentially be a
different one than what would be appropriate concerning the sur-
                                                                                         Figure 4: A lenticular SurgeryCut. The yellow area represents the
rounding area. Consequently, the cut shape choice can only follow
                                                                                         distorted space, the inner white area represents the additional can-
a thorough assessment of requirements and map surroundings. We
                                                                                         vas area, ACA, produced by the cut, while the rest of the space is
aid a user in doing so by providing contextual information about a
                                                                                         unchanged. Distortion is not constant: for β = α is 0 and for β = 0
cut during the creation procedure, such as the area of the generated
                                                                                         it exhibits the maximum value.
ACA against the distorted area created as shown in Figure 1. In
summary, considering the three factors, we come to the conclusion                        2.2.1. Geometry Definition
that the shape choice is very much use-case dependent and must                           The process of generating a SurgeryCut encompasses calcula-
always be the result of careful consideration. In some use cases, it                     tions mainly within one vector space P. Thus, this space yields
is more important to distribute the distortion more evenly, while in                     coordinates for both cut shapes and map geometries. We define
others, retaining the map appearance is preferable.                                      P := [x1 , x2 ] × [y1 , y2 ] with P ⊂ R2 as a Cartesian space, illustrating
   While we do not recommend any shape over another, the lenticu-                        a two-dimensional surface. Additionally, we define that a position
lar shape combines most aspects of other regular shapes in terms of                      vector P ∈ P lies within a canvas’ field of view and P is given in
constructibility and distortion distribution. Thus, the lens shape is                    projected (cartographic) coordinates. For instance at our developed
suitable as a representative for the many other possibilities. As well,                  demonstrator, these coordinates are determined by an UTM projec-
using a lenticular shape, we fulfill the recommendations defined by                      tion and stem originally from (latitude, longitude) tuples. For more
Carpendale et al. [CCF97] when designing distorted views:                                details on our demonstrator, see the introduction of Section 5.
1. We avoid occlusion completely.                                                           The potentially interactive construction of a SurgeryCut starts by
2. By providing control over the affected distortion area, we keep                       defining two distinct position vectors M, M 0 ∈ P, which describe the
   focal points close to their original location.                                        end points of the basic cutline, see Figure 4. Since our approach
3. The continuous distortion function of the lens shape creates a                        allows shapes of arbitrary rotation, the following formalization en-
   smooth integration of the ACA into the map.                                           ables a rotation-invariant and unambiguous geometry definition. We

© 2019 The Author(s)
Computer Graphics Forum © 2019 The Eurographics Association and John Wiley & Sons Ltd.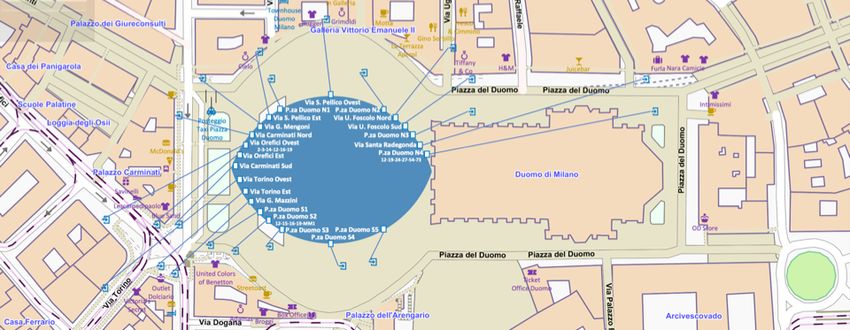
M. Angelini et al. / SurgeryCuts: Embedding Additional Information in Maps without Occluding Features
assume M to be positioned more on the right. If M and M 0 share the Finally, the integer-valued function s : P → [−1, 1] determines a
same x-coordinates, we focus the vectors’ y-coordinates: So, it holds translation scalar’s sign. The sign depends on which side of the
either Mx > Mx0 or My > My0 , the latter namely in case of Mx = Mx0 . cutline a P is located in unchanged space. This function is definable
Subsequently, a rectangular area is centered around the cutline through multiple strategies: for instance, one could (a) consider the
# » # »
which will absorb the distortion, implied by the SurgeryCut. We sign of the cross product MM 0 × MP or (b) split (A, A0 , B0 , B) and
focus the cutline’s normal to calculate this area’s boundary vectors check for point containment. Clearly, our rotation-invariant formal-
A, A0 , B and B0 in Figure 4. With X ∈ {M, M 0 } and a fixed l ∈ R>0 , ization in Subsection 2.2.1 can support any strategies. Note that a
we can define these position vectors by special case needs to be handled: point vectors directly located on
# » ! the cutline. To avoid unclear translation directions, we recommend
−(MM 0 )y tiny translations by ε · ||~n|| as part of map feature preprocessing. The
X ± l · ||~n|| with ~n = # » (1)
(MM 0 )x visual impact is minimal, but in particular the mentioned case is very
unlikely to even occur at real-valued spaces, common geographic
Finally, for the ACA construction we can think of two r-sized circles
data models (e.g. DIME,TIGER) and (interactive) cut construction.
centered at C,C0 with C 6= C0 . Now let the circle boundaries touch
the position vectors M and M 0 : then, the actual ACA is given by the
circles’ intersection area, implying a symmetry around the cutline. 3. Quality Metrics
At ACA construction we require particular properties: with K being In line with the general idea of Visual Quality Metrics (see, e.g.,
0
the cutline center M+M 2 , it needs to hold
Bertini et al. [BS06]) we provide a set of metrics for evaluating or
# » steering our proposal. This section introduces the metrics referring
1. |KQ| ∈ (0, r], where Q is one of the two position vectors on the
to the lenticular cut shape (see, Figure 3) but it is straightforward to
ACA outline which maximize the cutline distance. That is, the
extend them to other shapes. To simplify the comparison with other
ACA has non-zero extent and could theoretically represent at
techniques, metrics are formulated using points (instead of vectors),
most a full circle. Note that this first property can be seen as an
length of lines, and angles between them. Essential cut parameters
implication of mentioned cutline and circle geometry settings.
# » are the circles radius r = CQ, the compressed area length MA0 (i.e.,
2. 2|KQ| ≤ l. That is, the ACA does not exceed the rectangle
l), and the angle α (see Figure 4). The introduced metrics have the
(A, A0 , B0 , B) and there is enough space to absorb distortion. The
main goal of supporting three main activities:
factor 2 is essential for position vectors which are originally
located in the ACA. • Characterize the image quality after the cut;
• Compare SurgeryCuts with other techniques;
2.2.2. Vector Displacement • Steer optimization strategies.
Like in Figure 4, we assume a P ∈ P in the unchanged space, and According to these objectives we designed the following metrics:
we want to determine the position vector P0 in changed space. For ACA. Additional Canvas Area made available on the image. This
this we apply a scaled version of the cutline’s normal to P. In the metric calculates how much room a cut makes. Referring to Fig-
following we contour the three relevant scaling functions below, ure 4, the additional canvas area is:
while using notations from Figure 4.
ACA(r, α) = 2 · [r2 α − h ·CK] = 2r2 · [α − sin(α) · cos(α)] (5)
0
P = P + t(P) · w(P) · s(P) · ||~n|| (2) where h = r · sin(α) and CK = r · cos(α).
# » Area affected by distortion. This metric computes the area that
First, we define t : P → [0, |KQ|] for initial translation scalars:
( is bearing distortion to accommodate the ACA.
0 if P is outside (A, A0 , B0 , B)
t(P) := # 0 » DistortedArea(r, α, MA0 ) = 2 · MA0 · 2h − ACA(r, α) (6)
|K O| = r · [cos(β ) − cos(α)] else
(3) Ratio between distorted area and ACA (the lower the better).
Obviously, each position vector outside (A, A0 , B0 , B) remains en- This metric calculates the penalty we have to pay for the ACA:
tirely untouched. Note that we can derive case 2 of function t via
# » # » DistortedArea(r, α, MA0 )
|KQ| − |K 00 Q| = [r − r · cos(α)] − [r − r · cos(β )] DistortedAreaACARatio(r, α, MA0 ) =
ACA(r, α)
Next, we linearly weight the obtained translation scalars by w : P → (7)
[0, 1]. This function is responsible for a decreased scalar, as a posi- The above metrics provide for an overall judgment of the
tion vector is more distant from the cutline. performance of SurgeryCuts, the introduced distortion, and trade-off
Thus, a smooth integration of the changed space into its surround- between ACA and distorted area. In the following we provide
ing context gets ensured. In addition, w avoids that a P inside means for measuring the point-wise impact of a cut, measuring how
(A, A0 , B0 , B) gets shifted outside this region, which could lead to a specific point or a specific area is affected by the technique.
occlusion or other side effects in the surrounding space. So, by this
property and the first case of function t, we ensure the basis for one Linear distortion, LD. We characterize the intensity of the lin-
contribution of our paper: original viewport preservation. ear distortion that varies according to β (no distortion for β =α,
1 maximum distortion for β =0) as:
if P is inside or touches the ACA
w(P) := l−|K# 0»P| (4) K0O r · [cos(β ) − cos(α)]
# 0 » else LD(r, α, β , MA0 ) = = (8)
l−|K O| MA0 MA0
© 2019 The Author(s)
Computer Graphics Forum © 2019 The Eurographics Association and John Wiley & Sons Ltd.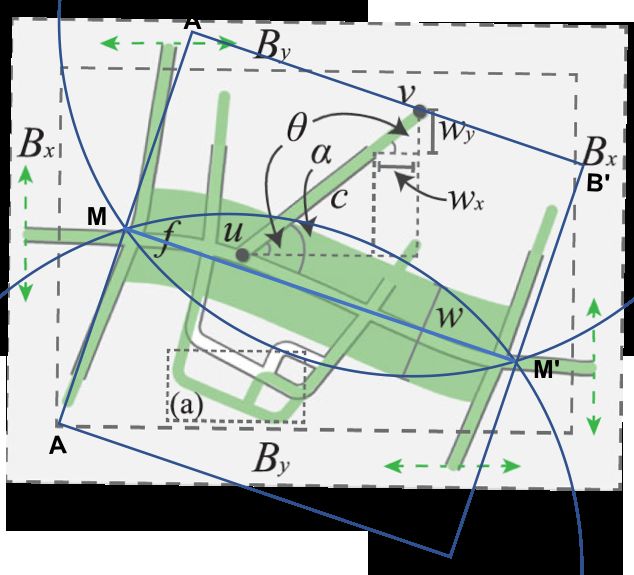
M. Angelini et al. / SurgeryCuts: Embedding Additional Information in Maps without Occluding Features

The formula provides the distortion for a single point P; if we want
to compute the overall distortion along an arbitrary interval (β1 , β2 )
of the distorted area we use the following formula:

                                                  r · [cos(β ) − cos(α)]
                                             Z β2
  Distortion(r, α, MA0 , β1 , β2 ) =                                           δ β (9)
                                              β1              MA0                                  Figure 5: Comparing SurgeryCuts with SpaceCuts.
   Displacement, DSP. When considering a single point P in the
distorted area (outside the distorted area the displacement is zero,
see Function 3) we characterize its displacement (PP0 ) as follows:                        share the distinctive feature of creating an ACA that does not inter-
                                                                                           fere with map features; however, Route-Zooming only deals with
                                                                         K0P               routes, disregarding any other map feature and both SpaceCuts and
    DSP(r, α, β , MA0 , K 0 P) = r · [cos(β ) − cos(α)][1 −                  ]      (10)   Route-Zooming rely on the presence of a feature that, in the case of
                                                                         MA0
                                                                                           SpaceCuts, must traverse the whole map.
   Bearing Deviation, BD. This metric calculates the bearing devi-                            SurgeryCuts - SpaceCuts In Figure 5 (left), we abstract the be-
ation, for a single point P, (β 0 − β 00 ) with respect to the center of                   havior of SpaceCuts using as feature a vertical line (that represents
the cut, as follows :                                                                      the optimal case for SpaceCuts, maximizing the ACA) that is en-
                                                                                           larged of d, creating an ACA of size 2h · d. That requires to displace
   BD(r, α, β , K 0 P) =
                                                                                           the whole areas on the left and right of the feature and extending the
                                        r · sin(β )             r · sin(β )                viewport of h · d areas on the left and on the right.
                              arcsin(               ) − arcsin(             )       (11)
                                           CK p                    CK p0                   In the right image of Figure 5 the result of this activity is displayed:
                                                                                           the dark area in the middle is the ACA produced by SpaceCuts, the
   where PK p = P0 K p0 = OK 00 = r · sin(β ).
                                                                                           green areas represent the displacement of d/2 and the light blue area
                                                                                           represents the part of the image that is outside the original canvas.
   SurgeryCuts can be used in two different modalities (see Sec-
                                                                                           To compare such results with SurgeryCuts, we have used a cut of
tion 5): automatic or manual. The automatic mode is intended for
                                                                                           height 2h centered in the middle of the SpaceCut with a maximum
users or applications that want to add some information on a map
                                                                                           displacement of d/2, see Figure 5, right image. It opens an ACA that
and leaves to the system the burden of opening the cut able to accom-
                                                                                           is comparable to SpaceCuts (≈ 20% less) and produces a distorted
modate the new information; manual mode leaves to the user the full
                                                                                           area of 2h · AA0 − ACA(r, α), contained in the rectangle (A, A0 , B0 , B)
control of the cut parameters. One straightforward application of the
                                                                                           with a maximal point displacement of d/2. The DistortedAreaACA-
above metrics in such context is to steer/automate the cut process: in
                                                                                           Ratio (the lower the better) for SurgeryCuts is about 1.6, i.e. 15
manual mode the user can design the cut observing the actual values
                                                                                           times less than SpaceCuts, and 22 times less if we consider the
of the metrics, thus supporting his or her decisions on cut parame-
                                                                                           extended canvas.
ters (e.g. the compressed area length MA0 ); in automatic mode, the
user can set some quality thresholds (e.g., maximumDisplacement,
maximumLinearDistortion, etc.), having the system automatically
computing the cut parameters that accommodate the object to be
placed in the map respecting the thresholds. It is worth noting that
this complements the general choice of the cut orientation: having
numerical measures on the distortion and bearing allows for de-
signing automated techniques able to select the cut orientation that,
using the same quality thresholds, minimize the distortion of rele-
vant areas (e.g., buildings, streets, etc.), distributing the distortion
on less relevant areas (e.g., lakes, forests, etc.)
   Another application is using the metrics to maintain spatial rela-
tionships between the object inserted in the cut and the surrounding                       Figure 6: Comparing SurgeryCuts with Route-Zooming. The back-
context. For example, assume we put tabular information on a metro                         ground image has been taken from [SLQW17].
station and want to show the 5, 10 or 15 minutes walking distance                             SurgeryCuts - Route-Zooming Figure 6 shows a comparison
to places around that station, distances that are represented by a                         between SurgeryCuts and Route-Zooming. Route-Zooming creates
polyline centered on the station. After the cut, the polyline requires                     an ACA of size MM 0 · w on the context road f , while displacing
to be adapted to point displacement to preserve its original meaning.                      surrounding roads within the bounding box Bx , By . We assume the
                                                                                           optimal case for Route-Zooming in which the actual context road
4. Comparison                                                                              does not intersect other context roads, and that all displacements
This section presents evaluation activities that have been carried                         happen within the bounding box. In this case we have selected a cut
out on SurgeryCuts. In particular, SurgeryCuts we compared to                              with direction and length equal to those of the contextual road and,
related techniques, benchmarking their performance using the met-                          because Route-Zooming does not propagate w displacement across
rics introduced in Section 3. Techniques closest to SurgeryCuts                            the whole image, we have set the cut maximumDisplacement greater
are SpaceCuts [BJSK16] and Route-Zooming [SLQW17]: both                                    than w to produce an ACA with the same size of Route-Zooming

© 2019 The Author(s)
Computer Graphics Forum © 2019 The Eurographics Association and John Wiley & Sons Ltd.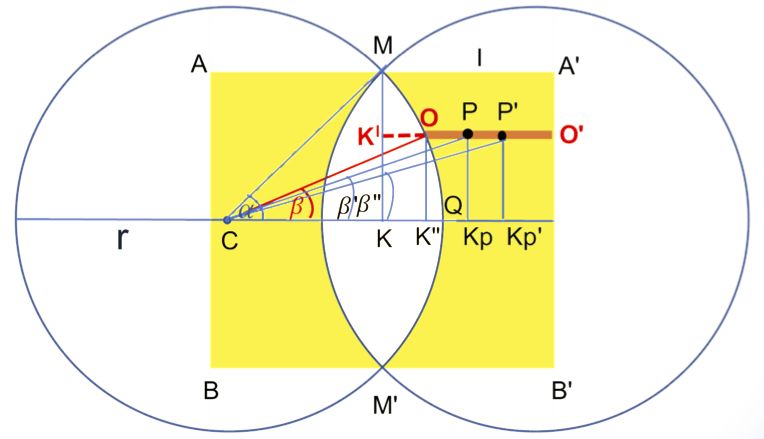
M. Angelini et al. / SurgeryCuts: Embedding Additional Information in Maps without Occluding Features
one. As well, we set MA to about 2w: this smoothly accommodates support is the representation of the network topology and compo-
all road displacements (until the furthest displaced point V ), still pre- nents, for most of them requiring to elicit their relation with respect
senting a DistortedAreaACARatio 7% lower than Route-Zooming. to their geographical position and controlled SCADA devices. The
Moreover, SurgeryCuts provide means for preserving also features rationale behind it is that most of these components remotely gov-
close to the roads while Route-Zooming completely neglects them. ern a power distribution cabin present in a particular area (e.g., a
As a conclusion, we can say that SurgeryCuts is able to provide power generator) and the eventual impairment of one of them has
comparable ACA with respect to SpaceCuts and Route-Zooming, consequences on the related geographical area. It is common to
without shifting the image viewport and with a better or comparable prioritize the monitor and intervention activities depending on the
trade-off DistortedAreaACARatio. Moreover SurgeryCuts is totally particular served area, and to analyze the network status from both
independent from map features (with respect to SpaceCuts) or roads geographical and logical perspectives. Problems arise when a com-
(with respect to Route-Zooming) and deals with the whole map. puter sub-network must be geo-localized (many computers share the
same geographical position, e.g., a building containing a data-center
composed of many appliances) and network connections could be
5. Application Scenarios lost due to use of visual abstraction for representing the network or
In the following, we describe the two main classes of use cases that contextual information could get lost due to superimposition of this
benefit most from the application of SurgeyCuts. information on the map. At the same time is possible to represent the
1. The first class addresses the goal of adding details to an element network topology using common node-link diagram representation,
of the map, details that are somehow connected to other map losing at that point lots of information about geographical positions.
locations: in this case the cut contains an enriched representation Existing solutions, see, e.g. [AS17], rely on multi-coordinated vi-
of the original object and optional links allow for connecting the sualizations, one representing the network topology and another its
enriched element to other map locations. Examples are expanding geographical spread, forcing a security operator to reason on one
a 3G/4G telecommunication antenna making evident its internal perspective at a time. Additionally, even considering coordination
characteristics and showing the orientation of its radio signal, between views, the difference in layout between the geographical
or expanding an element of a broadband fiber optic network, and topological obstacles the analysis, asking for frequent disrup-
showing its communication capability and linking it to its terminal tion in the analysis process due to switching between the different
points and to the backbone. layouts. To overcome these drawbacks we applied SurgeryCuts, see
2. The second class of applications is the situation in which the cut
designer wants to add some additional information that refers to a
group of elements placed in a map area. Instead of labeling each
element with additional text, a central cut in the area of interest
allows to collect the needed information without occluding the
map. Additional links can be added on the map, connecting the
new information to the elements it refers to. Typical tasks include
searching and comparing elements based on the added informa-
tion like, e.g., adding temporal information about the red/green
state of traffic lights in a high traffic area, or collecting aggre-
gated information about the characteristics of the restaurants in a
specific neighborhood to support a user’s dining decision.
The next two subsections exemplify the aforementioned classes with
two applications of SurgeryCuts: one belonging to the first class,
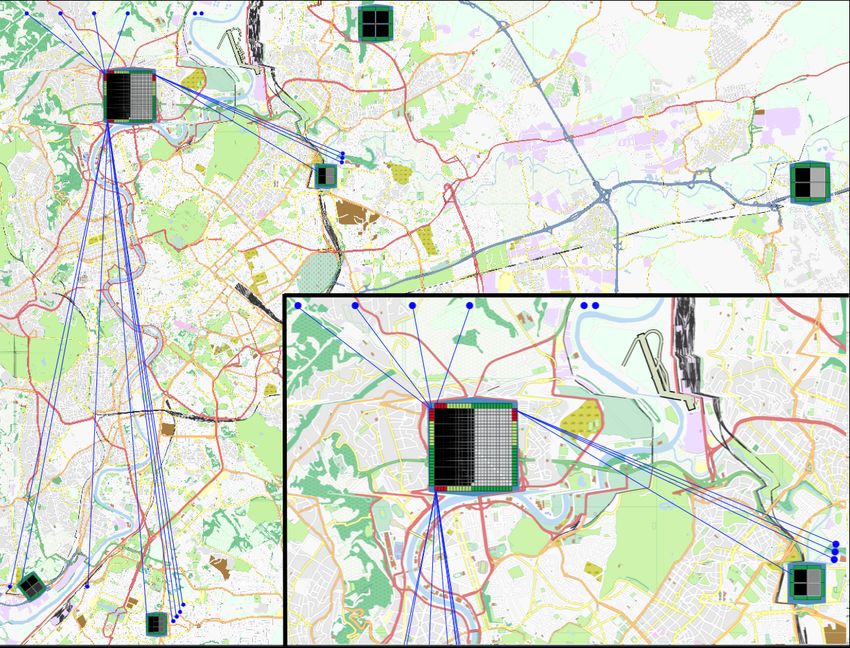
detailing sub-networks nodes with internal connectivity (see Sub- Figure 7: Applying SurgeryCuts to a power distribution network: all
section 5.1), and another one adding contextual information to a the multi-node glyphs of sub-networks are accommodated in specific
set of subway exits (see Subsection 5.2). Both scenarios are built cuts, keeping both the whole network and contextual information
using our SurgeryCuts demonstrator program: after a user-steered visible. A detail of one of the glyph is magnified in the bottom-right
import of arbitrary, XML-based OpenStreetMap vector data, the corner. Being the inserted information a square matrix we used a
demonstrator enables interactive cut sketching and the map trans- trapezoid-shape cut that better fits w.r.t. the lenticular-shape
formation relies on the identification of intersecting features and
internal map modifications (e.g., line segmentation for smooth tran- Figure 7, creating different cuts on the map, each of them accom-
sitions, feature displacement as in Subsection 2.2.2). We can render modating a matrix-like glyph representing the sub-network nodes
and export transformed maps along with annotated cut coordinates, connectivity. It allows the security operator to get the complete
and subsequently handle SurgeryCuts in arbitrary environments. overview of the network topology and reachability, and the relations
between logical nodes and connected physical SCADA appliances
in the same view, without relying on any additional interaction or
5.1. Critical Infrastructure Cyber-Protection introducing any occlusions. Moreover, preserving both the proxim-
The first application scenario regards the monitoring, analysis and ity information (e.g., geographical position, surrounding areas) due
cyber-defense of a critical infrastructure SCADA network for power to avoiding occlusion, and the faraway contextual information (e.g.,
distribution from cyber threats, based on what was developed in the connections to other nodes in the network or to SCADA appliances
European project “Panoptesec” [Pan16]. One of the main tasks to near or far the controlling nodes), the security operator is able to
© 2019 The Author(s)
Computer Graphics Forum © 2019 The Eurographics Association and John Wiley & Sons Ltd.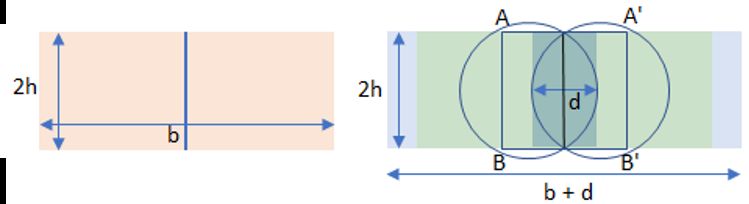
M. Angelini et al. / SurgeryCuts: Embedding Additional Information in Maps without Occluding Features

monitor the whole network status from both logical and geographi-
cal perspective integrated in the same view. The versatility of this
approach allows to weight the importance of the geographical and
topological information to the desired degree by choosing the right
cut parameters, with the possibility at any time to re-obtain only the
geographical view or the logical view filtering unnecessary details.

5.2. Subway Exits Scenario
One of the main profitable situations for using SurgeryCuts is the
case in which it is needed to insert textual information on a map that
                                                                                         Figure 10: Effectiveness, completion time, and efficiency of the
refers to several locations close to the cut center, like labeling the
                                                                                         participants. The box-plot on the left shows the distribution of the
exits of a large central subway station. Displaying such data directly
                                                                                         average scores obtained by counting participants’ correct answers
on the map may result in visual occlusion with other labels, making
                                                                                         and normalizing that value to 10. The box-plot on the middle depicts
hard to read street names or shops. The user is underground at her
                                                                                         the distribution of the average time spent to complete the experiment
arrival station and she needs to make a decision on the exit to get the
                                                                                         (in minutes). The box-plot on the right illustrates the ratio score/time.
right bus stop or the shop she is looking for. The greedy approach
"let’s go out and look where I am" can produce disappointing results,
                                                                                         6. User Study
exiting very far from the intended location. Supporting this task
requires to have each exit icon on the map labeled with a) the exit                      We have conducted a controlled experimentvto compare the
name, useful to get direction while moving underground, and b) the                       SurgeryCuts Effectiveness and Efficiency against an occlusion-based
list of buses stops close to it, information that is very useful when                    labeling technique. We did not compare with other state of the art
traveling by subway and buses. As an example, Figure 8 shows a                           space warping techniques because they do not provide means for
SurgeryCut on the Milano Duomo subway station that encompasses                           adding new data on the map, nor with Routezoom [SLQW17] and
22 exits on a huge square and adjacent streets. The cut bears all                        SpaceCut [BJSK16] because they are not general enough, needing
needed exit/buses needed information. Conversely, Figure 9, shows                        the mandatory presence of a map structure, like a road or a river.
the same information over-imposed on the map using a font of the                         To the best of the authors’ knowledge, the unique technique able
same size of surrounding labels, producing some clutter.                                 to introduce new data on a map without using map features is la-
                                                                                         belling with occlusion, technique that we have applied minimizing
                                                                                         the overlapping with labels used in the study questions. The exper-
                                                                                         iment involved 44 people (31 males, 13 females) with no specific
                                                                                         skills and used the subway exits scenario described in Section 5.2,
                                                                                         providing one interface for the map with a SurgeryCut (see Figure 8)
                                                                                         and one in which the 22 exit names have been overplotted on the
                                                                                         map, close to the icons of the exits (see Figure 9). To correctly
                                                                                         guide the user along the experiment execution steps, i.e., reading
                                                                                         questions, interacting with the maps, and reporting responses on a
                                                                                         questionnaire, we have used STEIN [ABLS18], an environment that
Figure 8: The Milan Duomo subway exits labeled within a cut,                             allows for quickly integrating the system under evaluation with the
together with additional information about adjacent bus stops. The                       user study questions, tracing her or his activities.
textual information is linked to exits locations through blue lines,                        Methodology To compare the two strategies, people were au-
making easy to locate shops and other facilities.                                        tomatically split in two groups: Group 1, performing tasks on the
                                                                                         overplotted map, and Group 2, performing the same tasks on the
                                                                                         map with the SurgeryCut. Participants have been asked to answer
                                                                                         10 questions (detailed in the additional material) about the 22 ex-
                                                                                         its names, bus lines, and facilities displayed on the map (shops,
                                                                                         restaurant, etc.). The first question was associated with the expla-
                                                                                         nation of the environment: participants were asked to inspect the
                                                                                         map associated with their group, to get familiar with symbols, and
                                                                                         to answer a simple question to assess their understanding. After
                                                                                         that, participants answered the remaining 9 questions that have been
                                                                                         used for assessing their performances. However, users not correctly
                                                                                         answering the first question (or not answering it at all) have been
Figure 9: The Milan subway exits labeled with names and list of the                      excluded: either they did not understand the explanation or they
buses they are close to (using the same font size of the map labels                      were answering the questionnaire in a rush or sloppy fashion. That
and minimizing occlusion). The resulting clutter makes hard to read                      reduced the number of questionnaires to 35.
exit names and buses information (see the bottom left part of the                           Results From traces and answers we have collected three de-
image). A dashed ellipse shows the cut location and size; displaying                     pendent variables: Effectiveness (score), Time, and Efficiency
the textual information on that area will hide 5 subway exits.                           (score/time), whose values are reported as box plots on Figure 10.

© 2019 The Author(s)
Computer Graphics Forum © 2019 The Eurographics Association and John Wiley & Sons Ltd.
M. Angelini et al. / SurgeryCuts: Embedding Additional Information in Maps without Occluding Features
In order to validate the statistical significance of these figures we it easier for observers to identify distorted areas even without focus-
have performed a between subjects one-way ANOVA that confirmed ing at the actual cut. For the same reason, we expect that with the
a significant effect of the independent variable "user interface" on lenticular shape, mistaking the distortion for real structures can be
Score, at the p < 0.05 level, (F(1,33)=4.85, p=0.034); concerning minimized. When zooming out, our current solution is to consider
Time and Efficiency we concluded that the user interface has not the ACA equal to other map elements. Hence, a cut will shrink or
a significant effect on them (at the p < 0.05 level, (F(1,33)=0.54, enlarge in accordance with the selected zoom level. However, for
p=0.47 and F(1,33)=0.18, p=0.68, respectively). According to that practical applications, other approaches can make sense. We rec-
we can conclude that the Effectiveness of Group 2 interacting with ommend considering the importance of the visualized element in
a cut (score mean 8.54, median 8.89) is better than Group 1 dealing context of the zoom level and the importance of the surrounding
with an overplotted map(score mean 7.37, median 7.78); on the map features to determine whether a cut should resize with changing
other hand, we cannot make any assumptions on differences be- zoom levels. Further, changing the granularity of the information vi-
tween Group 1 and Group 2 for what concerns Time and Efficiency. sualized in the cut with changing zoom levels is conceivable as well.
We believe that completion time and, as a consequence, efficiency A possible perceptual complication can arise when a user seeing a
have been affected by two external factors common to both groups: cut intersecting an element, e.g. a street, is led to think that the cut
UNUSUAL ICONS: We received several comments about this issue, is occluding part of the element. Especially for untrained users, this
which we attribute to differences on between the explicit depiction impression might occur for larger cuts. These perceptual effects are
of subway exits by OpenStreetMap versus a more familiar represen- related to the Gestalt Laws of continuation, closure and similarity,
tation by Google Maps without subway exits. which can, in turn, be used to alleviate said effects, which we intend
UNINTENDED TASKS: judging from the comments we discovered to elaborate on in future work. Promising methods include the intro-
that several participants used the map for spotting bus stops (poorly duction of visual cues around the cut shape to imply continuity of
depicted on OpenStreetMap) instead of using the textual informa- the post-cut features. As well, continuing important map features
tion below the exit names. Moreover, we see that the highest score like roads into the edge of the cut and fading them out has potential
differences come from the two tasks asking a) to list exits connected to generate a sense of continuity.
to the 12 bus line, and b) to count the subway exits; people using Cut Determination and Generation We have not focused on
the SurgeryCuts map answered with an efficacy almost three times how to determine size and bearing of a cut on a given location and
higher than people using the overplotted map (4.4 against 1.6, and our demonstrator lets the user determine these parameters fully on
9.4 against 3.2, respectively), confirming the cluttering issue. his own. However, the choice especially of the bearing of a cut in a
specific location can produce considerable visual differences in the
7. Discussion result, as Figure 3 shows. Again, the method of choice is dependent
The introduction of cuts to maps opens new perspectives on data on the use case and should be decided accordingly. We envision
visualization in spatial contexts. Yet, introducing cuts and distortion different approaches to determine the cut: First, all parameters could
into maps also raises challenges and questions we want to discuss be decided automatically by the system on request, for example by
in the following together with further research perspectives. a click on a composed node in the Panoptesec scenario. Second, a
Implications of Distortion When creating a cut, three factors semi-automatic approach could help a user by suggesting parameters
have to be balanced: The size of the ACA to create in two dimen- according to a location and cut size chosen by the user. Third, the
sions, and the extent of the area affected by the cut. In other words, manual generation of the cut is the most viable option to make use
there is a trade-off between generated ACA area and the amount of of an analysts context knowledge or specific information needs.
distortion introduced. The more space created, the more local dis- 8. Conclusion
tortion is introduced. Of course, this can be alleviated by increasing
The paper introduced SurgeryCuts, a novel map alteration tech-
the size of the affected area in total, yet increasing the amount of
nique creating additional space for visualizations on maps without
distorted map space. So far, we expect there to be no optimal solu-
occluding map features. In comparison to related approaches, the
tion to this trade-off, and the selection of these parameters depends
additional canvas area is structure-independent and does not shift
on use case and type of the desired visualization to be put in a cut.
the viewport of the map. The applied distortion is limited to a single
Another concern for distortion areas is the handling of conflicting axis and designed to distribute the amount of distortion introduced
cuts in multi-cut scenarios. At the moment, as a straightforward as evenly as possible to limit the perceptional implications of the
solution, our prototype does not allow the creation of conflicting cut. We discussed the reasoning for a lenticular cut shape and pro-
cuts. Yet, Mizutani et al. [MYT13] provide the water drop technique, vided a detailed description for the construction of SurgeryCuts. To
emulating surface tension conditions to disperse conflicting distor- measure the impact of our technique, we contribute quantitative met-
tions at focus+glue+context lenses. As a baseline approach, they rics. We compared our approach to the two most related techniques
also propose a force-directed lens repulsion. Such strategies could and exemplified the application of SurgeryCuts in two practical
be integrated with the way SurgeryCuts are created. In future work, use cases. A controlled user study provided additional insights on
we aim to explore this possibility in more detail. the SurgeryCuts potentialities. Since this publication solely intro-
Cut Shape Perception and Zoom Level We see a benefit of duces SurgeryCuts as fundamental technique itself, we intend to
SurgeryCuts in the visual representation of a cut as the lenticular explore the benefits of automatic and interactive approaches to cut
shape and the resulting continuous distribution of the distortion cre- generation as discussed in the previous Section 7 in future works on
ate a regular distortion area. This kind of regular, but not completely the topic. Finally, we are looking forward to the application of the
circular shape is uncommon for most environments and thus makes contributed metrics to perform comparisons of further techniques.
© 2019 The Author(s)
Computer Graphics Forum © 2019 The Eurographics Association and John Wiley & Sons Ltd.You can also read