9 Maps as foams and the rheology of digital spatial media: a conceptual framework for considering mapping projects as they change over time ...
←
→
Page content transcription
If your browser does not render page correctly, please read the page content below
9
Maps as foams and the rheology
of digital spatial media: a conceptual
framework for considering mapping
projects as they change over time
Cate Turk

Introduction

  The world of mapping has rapidly moved from provisioning users with static two-
  dimensional hard copy displays to maps that are on-line, immediate and dynamic.
  (Cartwright, 2013: 56)

With a curious twist, we have come to think of a map like a ‘folding’ map that
we carry around on our travels – a tactile three-dimensional thing with move-
ment encapsulated in its title – as static as Abend also argues in this volume. This
kind of idea contrasts with the flat-screen worlds of digital mapping at which we
gaze (often while sitting relatively inert). William Cartwright (2013) refers to a
transition in mapping that is happening in our time. Published paper maps that
provide static depictions of places, frozen at the moment of compilation, are
being replaced by digital mapping which enables dynamic, interactive visualisa-
tions where map readers can track changes or make changes over time. In this
chapter I explore how this dynamism changes the way we think about and study
mapping. Unravelling the curious twist, I consider how maps can be dynamic in
a number of different senses.
    I begin by examining two senses in which contemporary maps or ‘new spatial
media’ (Elwood and Leszczynski, 2012: 544) are dynamic. In the first sense,
‘dynamism’ is due to the technological possibilities of these new media, such as
‘slippy interactive mashup map objects’; and second a ‘dynamism’ is described
by theoretical perspectives drawn from contemporary critical cartography
which see maps as ‘mutable’ and ‘manifold’. Turning to the questions this raises

                                                                                Cate Turk - 9781526122520
                                               Downloaded from manchesterhive.com at 07/11/2021 03:57:14PM
                                                                                             via free access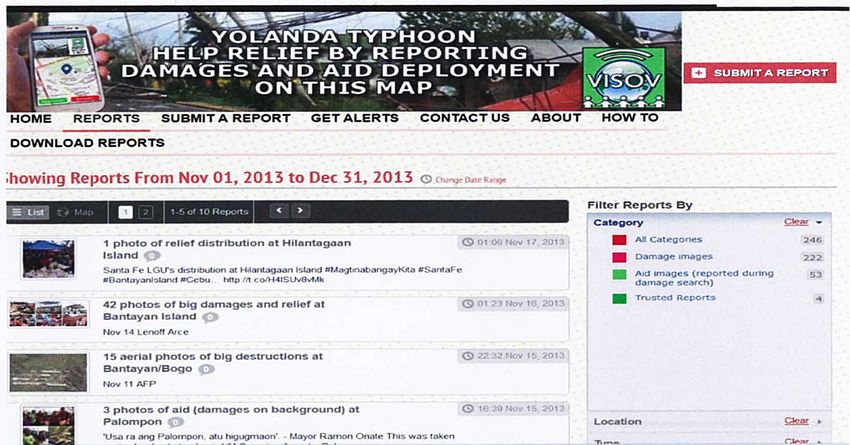
198                              (In)formalising

about how we might study maps as malleable changing objects, I suggest an
analytical approach based on philosopher Peter Sloterdijk’s (1998; 1999; 2004)
concepts of bubbles, spheres and foams. These models, I argue, prove a useful
way to conceptualise the fluid, contingent networks of relations that constitute
dynamic mapping projects. Then, in order to illustrate how this conceptual
model works, I examine a selection of crisis mapping practices focusing on the
relations between maps and ‘produsers’1 (Bruns, 2006: 276); as well as the
communities and interests that help determine the ultimate success and utility
of crisis mapping efforts. Throughout, ‘bubbles’, ‘foams’ and the application of
rheology (the physics of deformations and flows of matter) to mapping are up
for discussion and critique.

Dynamic maps and new spatial media

In the online environment, maps can be very obviously dynamic; with interac-
tive visual interfaces, possibilities for inputs by multiple produsers, and continu-
ally accumulating datasets. Functions like ‘slippy maps’ (where the map moves
within a screen revealing more and more territory as we scroll) enable a haptic
engagement where maps shift beneath our fingertips. Coding protocols promote
the ready mixing and mashing of data into map interfaces, and datasets may con-
tinually accumulate as new data is fed into a map over time (sometimes purport-
edly in ‘real-time’). Moving to mobile devices, we see maps change through our
movement, navigating with us.
   There are at least four different ways in which these new ‘digital spatial media
interfaces’ are dynamic. First, there are animated visualisations, where differ-
ent map features move on a screen interface to provide more information. For
example, the effective animation in Figure 9.1 shows winds as they move around
the globe.
   Second, we see dynamism as a result of user manipulation of the map inter-
face, such as slippy maps or the ability to select a particular base map, perform a
sorting of map layers and so forth (Figure 9.2).
   With the use of maps on mobile devices, user movement is integrated into
the dynamic map interface such that the map moves in ways according to user
location or preferences.
   Third, there are maps where datasets are continually or periodically updated,
either through automated feeds, user-entered data or the addition of updated
information by the map administrators. The combination of crowd-sourcing
with mapping encourages members of the public to add their own data or change
data. The updated content might be geographic features in a base map or the

                                                                                Cate Turk - 9781526122520
                                               Downloaded from manchesterhive.com at 07/11/2021 03:57:14PM
                                                                                             via free access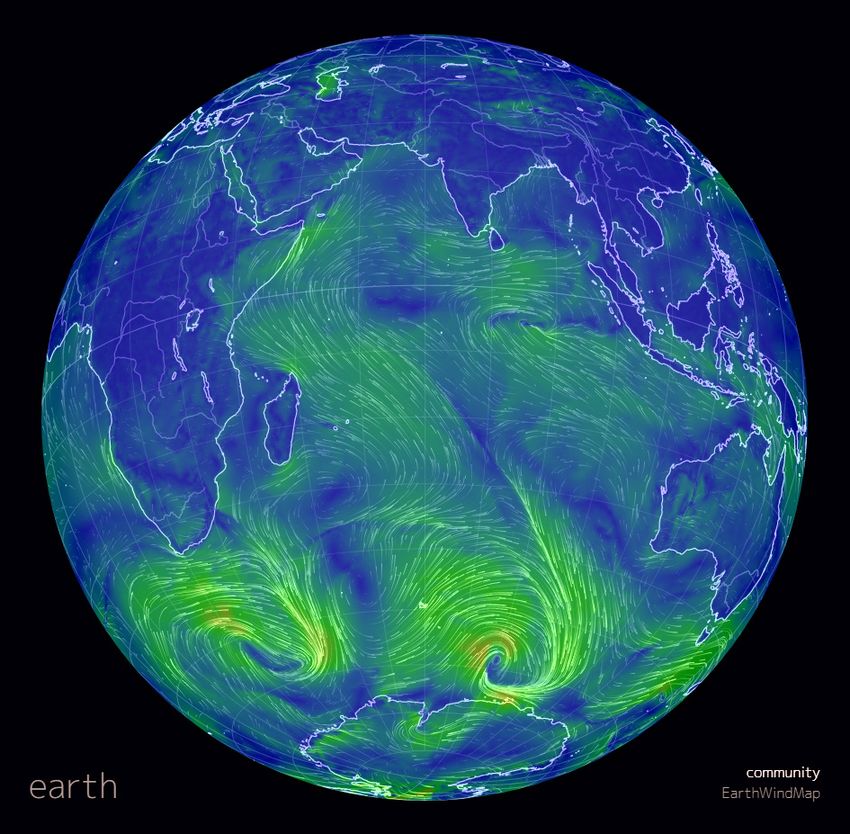
Maps as foams 199
Figure 9.1 Wind map, showing the way winds are flowing around the Earth (https://
earth.nullschool.net).
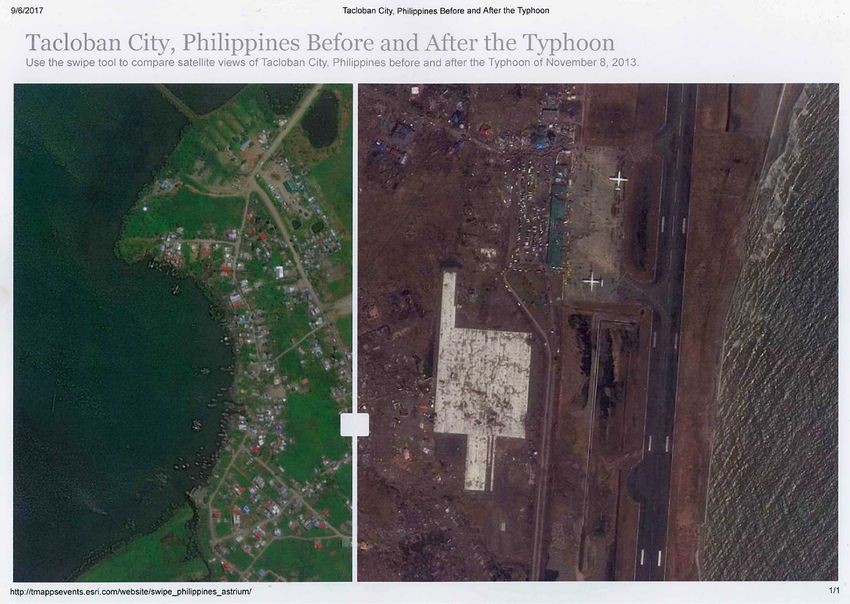
Figure 9.2 Haiyan/Yolanda Swipe Map, enabling comparison of before and after
satellite imagery (www.esri.com/services/disaster-response/hurricanes/typhoon-
haiyan-yolanda-swipe-map).
Cate Turk - 9781526122520
Downloaded from manchesterhive.com at 07/11/2021 03:57:14PM
via free access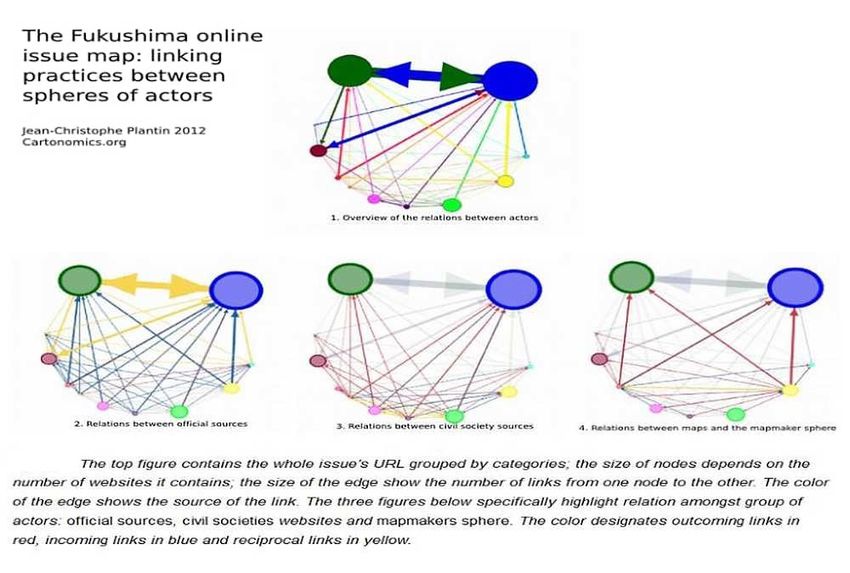
200                              (In)formalising

contribution of additional thematic data (see, for example ESRI, GIS Corps and
StandbyTaskforce, 2013, where photos were added over time into a data layer).
    The possibilities for recombination offered by digital presentation bring a
fourth kind of dynamism. Maps are web elements which can be easily be cut,
pasted, mashed-up, re-purposed and hyper-linked. Hence, the surrounding
web context of the map changes. The website in which a map is embedded
equates to what Woods and Fels (2008: 8–12) term the ‘paramap’, that is,
the context surrounding a map that affects how it looks and is interpreted.
The ‘paramap’ includes map elements such as title and legend (known as the
‘perimap’) but also extends to any documentation that explains what the map
is showing (the ‘epimap’). Maps thus change when a website design is updated
or the map is re-presented in new sites, such as when a map is republished in
a news report.
    In each of these four ways, the content of the map and/or the interface is
dynamic. Maps move, acquire data, have multiple authors and are adapted and
re-purposed. The re-presentation of maps in a digital form also has implica-
tions for how we might ‘date stamp’ them or order them temporally. Websites
might be periodically updated but there is no one moment of publication as
there is with a paper map. Indeed, digital media in general is complex in terms
of temporality. Following Tim Barker’s writing about Time and the Digital,
particularly his discussion of the philosophical work of Serres and Deleuze, it
is probably useful to think of digital media as combining multiple temporali-
ties (Barker, 2012). For example, when we access websites we consider them
as ‘present’ or even as being in ‘real-time’, yet they build on a concatenation
of data, conventions and actions from the past, and go on to have implications
affecting users into the future. This complex temporality adds a further dimen-
sion to the dynamic map content and interactive interfaces described above. In
the next section, I first discuss mutability of map objects and the implications of
contingency for the study of maps or mapping projects, this leads on to a deeper
consideration of temporality.

Mutability and contingency

Various authors writing within sciences studies and critical cartography have
explored the ways in which maps change and move. Bruno Latour (1990: 37)
famously coined the term ‘immutable mobile’ to describe how knowledge (geo-
graphic and otherwise) moves through the world using transferable yet fixed
ways of understanding or acting – see Latour (1990). Sybille Lammes (2011)
draws on this when analysing the mutability of maps used in online gaming

                                                                               Cate Turk - 9781526122520
                                              Downloaded from manchesterhive.com at 07/11/2021 03:57:14PM
                                                                                            via free access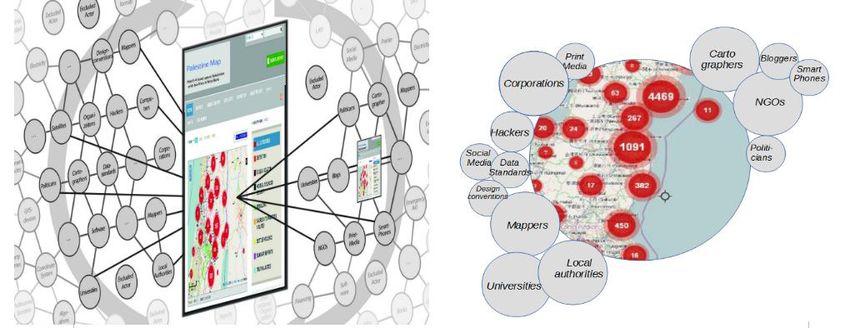
Maps as foams                                               201

contexts. Lammes (2011) describes how due to the mobility of players and the
mutability of the ‘image of the map’ (i.e. the graphic interface) the ‘playing
field’ has become transformable, rather than static as with conventional board
games. To Lammes, this makes the map almost a ‘mutable mobile’ (Lammes,
2011: 3). But not quite, I presume, because there are still some enduring ele-
ments: conventions, code, rules and expectations that enable these maps to be
recombined and reproduced. Nevertheless, Lammes (2011: 3) claims, ‘the map
itself has lost some of its immutability since the image of the map is constantly
altered by the actions of the mobile player’. As such the visual experience of
cartography within games, and much other digital spatial media, is dynamic.
    Broadening our view to expand out from the central ‘map image’ to consider
a mapping project or set of practices within which maps are embedded, we find
another sense in which maps are dynamic, such that even good old paper maps,
seemingly static on the page, are dynamic too. Del Casino and Hanna (2006: 36)
call maps ‘mobile subjects’: ‘infused with meaning through contested, complex,
intertextual, and interrelated sets of socio-spatial practices’. They account for
these practices in their study of the map use of tourism planners and tourists
exploring place. Their work demonstrates that map making does not stop with
the cartographer and continues through use and performative reproduction.
The extension from ‘map’ to ‘mapping project’ signals the expansion of analysis
away from the map object to a whole assemblage of actors – an ever-shifting
constellation of the various cartographers, software, conventions, organisations
and data sources (particularly previous maps), that, in combination, work to
make, and continually re-make, a map.
    Even when a map has been printed on paper fixed at a point in time, this net-
work of actors and relations is fluid. The contingency of cartographic processes
such as data collection, assigning of categories, and the different circumstances
of map use (the same map being used in different ways in different circum-
stances) mean that maps as they are put together, reworked, folded or read are
constantly in a state of becoming. Martin Dodge and Rob Kitchin (2007: 331)
thus consider maps to be ‘ontogenic’; their very being changing through use and
context. There is a parallel here to Tim Barker’s use of process philosophy in
conceptualising digital media. He writes:

  the digital image, whether static or in motion, is the result of continuous and ongoing
  computations. It does not exist as a thing made but as a thing that is continually in the
  making. (Barker, 2012: 264)

Maps in whatever form are not static objects, but rather are dynamic, fluid and
emerging.

                                                                                     Cate Turk - 9781526122520
                                                    Downloaded from manchesterhive.com at 07/11/2021 03:57:14PM
                                                                                                  via free access
202 (In)formalising
The implications of such ontological instability for research about cartography
are manifold. For critical cartographers, there is a practical conundrum of how
to study and account for continually changing objects: if maps are so dynamic,
continually changing, contingent upon context and use, how can we pin them
down so as to discuss their content, intent and effects? Do we need to freeze
these shifting multiple objects in order to analyse them? Through what means
can we best understand these mobile subjects, mappings and mutabilities?
Several authors have approached this conundrum by taking what Kitchin,
Gleeson and Dodge (2013: 480) describe as a ‘processual approach’; analys-
ing not only the visual content of maps, but the practices of production and
consumption, performance and negotiation associated with maps or mapping
projects. In practical terms, a variety of methods are used to examine mapping
processes. Kitchin, Gleeson and Dodge (2013) employ an insider ethnography
to relate the dynamic process of data collection and map making/use/re-use/
re-authoring, akin to a diary or narrative journal of the life of their map(s).
Through interviews and participant observation, Del Casino and Hanna (2006)
used performative and ethnographic methods to explore their ‘map spaces’.
Chris Perkins writes too that performative approaches may be fruitful as these
‘see mapping as not only taking place in time and space, but also capable of
constituting both’ (Perkins, 2009: 2).
In a recent paper, Bittner, Glasze and Turk (2013) discussed the applicabil-
ity of Laclau and Mouffe’s theory of discourse and hegemony as a way of con-
ceptualising the contingency of mapping projects. This takes the idea that the
world is constituted by linguistic and extra linguistic articulations that become
fixed at moments of ‘sedimentation’, but that these discourses are always able
to be contested. As a consequence, discourses, in this case maps or elements
within maps and the map making process, are contingent upon assemblages of
actors and practices. Again, in order to understand what the map is we need
to analyse not only the map but the suite of people and practices that articulate
and contest it.
Bittner, Glasze and Turk (2013) engage actor-network theory as a means
of gathering together the actors and forces that influence a map, and hence
conceptualise a map assemblage. ANT has been applied to examinations of
contemporary cartography by several authors including: Chris Perkins in his
study of mapping golf (Perkins, 2006) and Francis Harvey’s analysis of the GIS
in administrative contexts in the USA (Harvey, Kwan and Pavlovskaya, 2005).
In their ‘Manifesto for map studies’, Dodge, Perkins and Kitchin (2009) sug-
gest that network analyses could be particularly appropriate for studies of col-
laborative and open-source projects. For the study of digital spatial media, and
more specifically interactive and collaborative mapping projects, ANT offers a
Cate Turk - 9781526122520
Downloaded from manchesterhive.com at 07/11/2021 03:57:14PM
via free accessMaps as foams 203
useful means of tracking and linking the various actors, including non-human
actors (like datasets or software programs) as they affect a map over time. The
network can encompass map producers, map users and the wider assemblages
of actors supporting map production and use. It is a good way of sketching out
myriad data sources and thinking about the chains of technologies that lead to a
final map image.
Yet there are also limitations in using ANT to examine map assemblages.
Foremost, while ANT helps us to consider and account for a broad range of
actors, it does not, to my mind, provide a nuanced way of considering the rela-
tionships between actors. Despite attempts to differentiate and visualise the con-
nections between actors, like that in Figure 9.3 from Jean-Christophe Plantin
(2012), it is difficult to incorporate how organisations and things are linked to
each other.
Moreover (and critically in the context of this chapter and book) it is difficult
to incorporate changes in these relations, and hence to demonstrate how differ-
ent actors work to produce maps or how these roles evolve over time. Returning
to the question of how we account for the mutability of maps, we need rather
a methodology which helps us to incorporate ideas of dynamic interfaces as
well as shifting constellations of actors. Because maps are fluid, ontogenetic and
Figure 9.3 Differentiating relations in a network (from J. C. Plantin, ‘The Fukushima
online issues map: linking practices between spheres of actors’, Cartonomics: Space,
Web and Society, 2012).
Cate Turk - 9781526122520
Downloaded from manchesterhive.com at 07/11/2021 03:57:14PM
via free access204 (In)formalising
c ontingent upon networks of relations, such a methodology should help us to
identify factors that affect a mapping project through time, such as what leads to
stability, rupture, wide acceptance or use.
Bubbles and foams
Philosopher Peter Sloterdijk’s concepts of ‘bubbles’, ‘spheres’ and ‘foams’ offer
just this: a way to conceptualise contingency and temporal variability in maps.
In three connected books (Sloterdijk, 1998; 1999; 2004), Sloterdijk uses three
sorts of sphere metaphors, or ‘thought figures’ as he prefers to call them (Funcke
and Sloterdijk, 2005: 4), to examine social relations. The ‘bubble’ stands for the
internalised world of the individual, insulated within a membrane yet in dyadic
relations with the outside. ‘Spheres’ describes the idealised spaces of moder-
nity, as all-encompassing universes; and ‘foams’ poses an alternative geometry
for social relations where individual (bubbles) jostle within a ‘multi-chambered
system’ (Sloterdijk, 2009: no pagination). Sloterdijk states:
I try to describe these multiplicities of modern life in terms of foam-making – all
individuals are living in a specific bubble within a communicating foam. (Sloterdijk,
quoted in Morse, 2009: no pagination)
This idea of individual ‘bubbles’ within collective ‘foams’ has been taken up
within cultural and architectural theory. Hélène Frichot (2009: 4) writes:
‘contemporary society in the habitat of the city can be really said to behave
in this way, like seething foam, co-isolated bubbles networked in … clusters
and symbioses’. While my discussion of maps and mapping practices does not
describe society at large and operates on quite another level, I find the concept
compelling and applicable to the study of contemporary cartography, precisely
because it is able to accommodate a communicating assemblage that ‘seethes’
through time. Mapping projects, like ‘bubbles’, depend upon internal sub-
stance as well as relationships with outside networks or ‘foams’ of actors. We
can think too about the ‘bubble wall’ as an interface between the map and these
actors, and ask questions about the quality of the interface, its stability and
continuing utility through time. Third, a ‘foam’ is fluid and dynamic, seeth-
ing as ‘bubbles’ merge and expand, fluid interfaces recombining to make new
‘bubbles’. There is the interplay of surface tension in bubbles and jostling from
neighbours, sometimes shaped by larger forces but also capable of maintaining
a stable form for a while. In the next sections, I look at these three aspects of
the metaphor (networks, interfaces and dynamics) in turn, before coming back
Cate Turk - 9781526122520
Downloaded from manchesterhive.com at 07/11/2021 03:57:14PM
via free accessMaps as foams 205
to the idea of temporality and going on to apply the maps as foams metaphor
to a case study.
Networks, assemblages, foams
Taking a map as a ‘bubble’ in an actor-network of ‘foam’, I imagine individual
maps as bounded objects with particular combinations of content, sitting within
networks of other bubbles. As Frichot (2009: 3) suggests: ‘the operational anal-
ogy of foam offers an alternative model to help understand these networks of
humans and things’. Applying the foam metaphor, we can see how a map is not
only connected to other actors, but created through its relations with them. A
map is a contingent object held together by data, technology, use and reputation.
It is formed through the interfaces with other actors. It is as if we inflate the nodes
in a network such that rather than connections being the thin strings of a web,
each entity shares an interface with the neighbouring actors. Figure 9.4 shows the
difference between an illustration of the network of actors combining in a map-
ping project (taken from Bittner, Glasze and Turk, 2013) to a foam of the same
actors, as a basic visualisation of the shift in conceptualising this assemblage.
This step is a critical difference from the network in that the very objects
are constituted by their relations with other things. I find the emphasis
on contingency useful in directing my research, not just to gather together all
the actors involved in a mapping project, but to critically examine the ways
in which they relate to each other. The surfaces connecting bubbles are inter-
faces that can be observed over time to gauge how other actors (other bubbles)
affect the shape of the bubble, its stability and longevity – and ultimately its
existence.
Figure 9.4 Assemblages – from network to foam. Based on original map by S. Adler,
G. Glasze, C. Bittner and C. Turk.
Cate Turk - 9781526122520
Downloaded from manchesterhive.com at 07/11/2021 03:57:14PM
via free access206 (In)formalising
Interfaces
Sloterdijk cites the architect Le Corbusier’s reference to a soap bubble and his
remark that: ‘the outside is the product of an inside’ (Sloterdijk, 2009: no pagi-
nation). This is true of a single bubble, where internal dynamics affect ultimate
stability. But it is different in a foam: the outside of the bubble connects it to other
actors. Bubble walls are interfaces, surfaces of exchange, representing continual
to-ing and fro-ing between actors. These surfaces are the condition of contin-
gency, as the means by which external actors affect the shape of the map-object.
They are also a lens or film that mediates interaction. From the perspective of
being within the foam, looking through the film from one bubble into another,
the interface determines how neighbours exchange or view each other’s content.
Thus, there are two ways in which we can make use of the idea of interfaces
when imagining maps as bubbles – first, by examining the quality of relations
between organisations and people and the exchanges or flows between them;
and second, thinking more specifically about mapping, we can examine quite
literally the quality of the mapping interface, such as cartographic design and
usability. In so doing we need to take into account the multiple perspectives of
users, imagining multiple positions from which we might look through inter-
faces into other bubbles. This ability to take positions is important to the study of
interfaces, as Dodge and co-authors point out: ‘interfaces en-frame and exclude,
working as mediating windows onto the world … [thus] … the task of decoding
the embedded cultural biases and distortions in processes of interface screen-
ing is challenging’ (Dodge, Perkins and Kitchin, 2009: 222). Conceptualising
interfaces as constituted by the interactions between actors means we are able
to incorporate multiple (and hence biased) viewpoints.
Map interfaces are sites of exchange where information or influence moves
between one entity and another. Rather than a strict boundary, the interface is a
permeable structure made up of the exchanges to and fro between actors. Science
studies scholar Andrew Pickering (2005: 21) has described these exchanges as a
‘dance of agency’ and, adding a temporal dimension, he shows how this dance
constitutes the ongoing process of practice. Through working things out with
others, an entity changes over time. Thus, the acknowledgement of contingency
contains an inherently temporal dimension. Conversely, as Clive Barnett (2004:
17) describes, ‘the poststructuralist understanding of temporality is in terms of
a series of successive moments of pure contingency, tied together by nothing
other than the force of an imposed convention or act of vitalistic will’. Coming
back to our ‘thought figure’: through processes of articulation, the bubbles take
on shapes and positions within a foam, yet these are, as Barnett (2004: 8) writes,
Cate Turk - 9781526122520
Downloaded from manchesterhive.com at 07/11/2021 03:57:14PM
via free accessMaps as foams 207
‘only ever according to a contingent set of identifications that remain open to
contestation’. The foam demonstrates the temporary nature of (map) assem-
blages, particularly the fluidity of interfaces/relations between actors.
Dynamics and temporality
Time emerges from a process that flows through the nexus of perpetually perishing
(and perpetually becoming) actual entities. (Barker, 2012: 1051)
Studying interfaces as constituted by the relations between actors in a foam leads
then inevitably to a consideration of dynamics and temporality. The constella-
tion of bubbles and the quality of interfaces are continually shifting, such that the
contingent assemblage moves like a fizzy foam. There are a variety of ways in
which we might observe how mapping projects (as foams) undertake transitions
temporally. The bubble metaphor invites consideration of surface tension, play-
ing off interior and exterior pressures. We might also study how map bubbles
‘get oxygen’ so to speak, or inflate through self-promotional ‘hot air’. Even the
stable maintenance of relations is a continual dance of agency between actors
through time. Foam physicists (rheologists) describe transitions where bubbles
switch neighbours or where bubbles are subsumed into others. Some of these
may be appropriate descriptions of shifts between actors affording, building
upon or diverging from each other in the course of a mapping project. Maps gain
authority and stability from the stability and quantity of users or supporters, this
too changes over time and affects the form of the map.
There are thus a variety of shifts or transitions we could use to describe
the evolution of a mapping project. The complexity of relations is, however,
only able to be captured approximately in the metaphor of the mass of foam.
The messy frothing foam signals that multifarious processes take place simul-
taneously, some connected, others with slower knock-on effects. A research
methodology might focus in on particular sets of exchanges and consider how
they are part of interrelated dynamic processes, happening at different speeds
and scales. Tim Barker describes the multiple temporalities of digital media,
where ‘the time of the software, the time of the network, and the time of other
users are all put in relation and are experienced as a mesh of multiple domains
of the temporal’ (Barker, 2012: 1586). Examining these, we can also draw on
James Williams’ discussion of Deleuze that introduces ‘a formal network of
processes defining time as multiple … [operating] on one another but in dif-
ferent ways depending on which process takes another within itself’ (Williams,
2011: 3).
Cate Turk - 9781526122520
Downloaded from manchesterhive.com at 07/11/2021 03:57:14PM
via free access208 (In)formalising
Deleuze provides three different ‘syntheses’ of time that unsettle the
concepts of ‘past’, ‘present’ and ‘future’ and examines how these concepts
act upon each other as dimensions synthesised through particular processes
(Williams, 2011). For example, Tim Barker suggests that: ‘the digital medium
is not merely a means of representing the world. Rather it is a mode of recom-
posing the present, of providing a means to rethink the present’ (Barker,
2012: 102–103). He goes further to say digital media ‘provides the potential
for the actualisation of events and a state of presentness in which the past is
constantly re-presented in the present’ (Barker, 2012: 74). The endeavour
to provide maps in ‘real-time’ underscores the emphasis on representing in
online interactions, as previous datasets, programmed code and even future
scenarios are drawn into suites of information exchanged in a present engage-
ment between user and digital interface. In Barker’s terms: ‘the human user is
temporalised by the digital process as his or her actions become transposed into
the digital and this action alters his or her movements in the present’ (Barker,
2012: 62).
Within the ‘foam’, we could account for multiple perspectives to examine
how different actors in the assemblage ‘temporalise’ each other. How do past
mappings work on new data? How do programming protocols produce particu-
lar ways of moving through sequences of dynamic maps? How are map curators
temporalised by the flows of new map data? How does the presumed ‘present-
ness’ of real-time mapping feed into map use? Furthermore, acknowledging the
multiple temporalities of digital spatial media, we might ask how these interac-
tions are happening at different scales: from the micropolitics of interactions
along ‘bubble’ interfaces to the larger ebbs and flows of the collective. Yet it is
easy to get carried away with metaphors. The best test of utility is to see how
the concept works with a concrete example, whether the ‘thought figure’ helps
in shaping a research method.
Crisis mapping foams
Natural catastrophes, or crises, like earthquakes, typhoons, tsunamis and bush-
fires, are heightened events where time is said to be ‘of the essence’ in coor-
dinating a response to save lives and property. Here I examine how dynamic
maps, digital spatial media, are being used to respond to such crises. I use my
approach to the analysis of interactive ‘crisis mapping’ projects as a means to
explore and review how using the concepts of ‘bubbles’ and ‘foams’ can help us
to make sense of these mapping projects over time. The mapping of crises is an
apt case study because we see how maps seek to account for shifting landscapes
Cate Turk - 9781526122520
Downloaded from manchesterhive.com at 07/11/2021 03:57:14PM
via free accessMaps as foams 209
and changing circumstances, the temporal emergence of a crisis is echoed in the
ways mappings emerge during crisis response.
Maps are an essential medium for organising and sharing information in
emergency contexts – think of the big wall maps common in emergency coor-
dination centres. Crisis maps are online collaborations where volunteers create
maps to help understand and respond to natural disasters and political
conflicts. For example, following the huge storm Typhoon Haiyan (locally
known as Yolanda) which hit the Philippines in November 2013, several
maps were created to help make sense of the crisis and to coordinate the aid
response. Immediately after the storm, volunteer cartographers travelled to
the Philippines to supply maps to the emergency responders. At the same time,
mappers both amateur and professional worked together online to map the
catastrophe from afar.
Here, through a ‘foam’ inspired investigation, I track these projects, explor-
ing the actors they bring together, the way maps gain traction among actors
(and hence relevance to the disaster response) and how this changes over time.
Following archival research and participant observation, a range of mapping
projects have been analysed (see Table 9.1 below).
Employing a methodology inspired by the bubble/foam metaphor, for each
of these examples might usefully deploy questions documented in Table 9.2.
Table 9.1 Archival mapping sources used by author for analysis
Mapping project Source
Humanitarian OpenStreetMap Team https://wiki.openstreetmap.org/wiki/
(2013) Typhoon_Haiyan
VISOV (Volontaires internationaux https://haiyan.crowdmap.com
en soutien aux opérations virtuelles)/
Ushahidi Crowdmap (2013)
University of Heidelberg/Ushahidi http://crisismap.geog.uni-heidelberg.de/
(2013) ushahidi/login
StandbyTaskforce/GIS Corps/ESRI www.esri.com/services/
(2013) disaster-response/hurricanes/
typhoon-hayian-yolanda-maps
Google Crisis Response (2013) http://google.org/crisismap/a/gmail.
com/TyphoonYolanda
Tomnod Satellite Image assessment www.tomnod.com/campaign/
(2013) haiyantyphoon2013
Philflood map/Ushahidi Crowdmap https://philfloodmap.crowdmap.com
(2013)
Cate Turk - 9781526122520
Downloaded from manchesterhive.com at 07/11/2021 03:57:14PM
via free access210 (In)formalising
Table 9.2 Questioning the mapping bubbles and form
Internal substance: What is the content of the map?
What form does the project take?
Relationships between net- Who is involved in making the map?
works/foams of actors: Who uses it?
How established are its supporters?
Are potential actors left out?
How does this change throughout the project?
What sorts of practices maintain the foam?
The quality of the interface(s): How is the map used?
How is it communicated?
How stable or credible does it seem (to other actors)?
How do the actors interact with the map and with each
other?
Continuing utility through How has the map changed?
time: How has the ‘foam’ around it shifted?
What are the common understandings that hold a foam
together?
What sorts of data flows have been incorporated?
What sorts of feedback processes does this entail?
Through this sort of analysis, it is possible to draw out factors that have influ-
enced the ability of these crisis maps to reach their set objectives, considering,
at the same time, barriers and rupture. Some of this research is presented here,
demonstrating how the ‘foam’ metaphor and the emphasis on networks, inter-
faces and dynamics might be applied to an analysis of mapping.
Networks
Probably the most highly publicised map response to Typhoon Yolanda/Haiyan
was the work of Humanitarian OpenStreetMap Team – HOT (2013). The
‘Hotties’, as they are known, engaged volunteers who worked together online
to help trace map features from satellite imagery to create maps of the affected
areas (examples of the HOT maps are shown below in figures 9.5, 9.6 and 9.7).
This sub-group of the OSM community has established protocols for responding
to crises and is part of international networks of institutions assisting disaster
response. Furthermore, it has an established base of volunteers, who have map-
ping and programming skills, as well as resources for quickly training newcom-
ers to help map. Communication channels are well set up and those contributing
to the map can make use of an interface that has been evolving through user
Cate Turk - 9781526122520
Downloaded from manchesterhive.com at 07/11/2021 03:57:14PM
via free accessMaps as foams 211
feedback. As a result, the HOT team was able to rapidly supplement existing
maps of the affected areas (using pre-disaster satellite images from Bing maps)
and then, in a second phase, map the extent of damage because they were
granted access to post-disaster satellite imagery.
This mapping project ‘bubble’ is well supported within a relatively stable
‘foam’ of significant long-term actors and many smaller contributors. The repu-
tation of the existing organisation, the number of people contributing and the
stability of key actors supporting this mapping project are all factors that have
promoted the project’s longevity and success, not only in getting the mapping
work done, but in sharing the map with users (both in the disaster affected areas
and elsewhere). The HOT map stands in contrast with maps that have had poor
uptake due to a lack of engagement, such as https://philfloodmap.crowdmap.
com/ where there have been few entries and hence a very small network of
adjoining bubbles.
Interfaces 1
Often the quality of the interface plays a role in determining a map’s wider
circulation and use. This Google map (http://google.org/crisismap/a/gmail.
com/TyphoonYolanda) has large icons which often overlap, making it hard to
recognise resources available or get an overview of the situation. Thus, despite
the overwhelming reputation of the parent organisation, the map has limited
use. Another map drew on a popular crisis mapping software (Ushahidi), and
was instigated by a reputable academic institution (University of Heidelberg,
2013) – both established actors – but password access meant that potential users
were vetted. The audience of passive map viewers (who might have browsed the
map but didn’t want to register) was thus also restricted, limiting the circula-
tion of the map. In these last two cases the interface – the ability of others to
interact with the map – determines who is included in the (foam) assemblage
and the terms of the relations. It is worth noting these are reciprocal conditions:
the more actors there are, the more information that is able to be contributed to
the map, and therefore it is more likely to attract further users. We might think
of this as the ‘stickiness’ of the bubble assemblage.
Interfaces 2
More is revealed about these projects by examining the other sense of ‘inter-
facing’; how map users or contributors interact with each other. Rob Kitchin
and Martin Dodge have noted the way in which crowd-sourced projects, like
OSM, demonstrate shifting ontologies of mapping projects because they expose
Cate Turk - 9781526122520
Downloaded from manchesterhive.com at 07/11/2021 03:57:14PM
via free access212 (In)formalising
the decision-making processes and contingencies in map production. They
write: ‘OpenStreetMap is a valuable “live laboratory” in which to explore the
ontological politics of cartography and the ways in which a mapping ontology
“appears solid, but is in fact always shifting”’ (Dodge and Kitchin, 2013: 29).
Because discussions about decisions are archived in emails lists and a wiki, we
can see through the discourse how and why curatorial choices were made.
Actors work contingently to affect the OSM map making process, jostling in a
way we might imagine as akin to bubbles shaping each other in a foam.
In this case, a chain of emails between participants who helped HOT’s online
response to Typhoon Haiyan/Yolanda reveal some of the micro-dynamics of
this mapping project: from the initial email before the storm warning alerting
members of the possibility that their help may be needed, to the negotiations
of specific mapping practices, such as how to label damaged buildings or gain
access to satellite imagery. Emails written by different users give us positioned
descriptions of the process, thus we can see how those new to HOT or OSM
sought clarifications about mapping protocols, or those representing aid organi-
sations put questions to the HOT community. Feedback from NGOs using
the HOT map in the affected area helped to inform the way map features are
edited, and some of the online mapping community even found opportunities
to undertake fieldwork, further enriching the map. These processes of feedback
at the interfaces (exposed for my research in this case in the HOT email list, but
taking place continuously through discussions and interactions between actors)
describe the continual shaping of the map.
Dynamics
Taking these exchanges as a starting point, the following sections and the accom-
panying cartoons (see Figures 9.5, 9.6 and 9.7) focus on micropractices at
the interfaces between actors. They serve to demonstrate ways in which this
approach helps to study the dynamics of mapping projects. Three different per-
spectives are presented examining: dynamics between actors; dynamics within a
map; and dynamics of ‘foams’, respectively. Each shows how the ‘foam’ meta-
phor enables a consideration of temporality and changes in relations.
1 Dynamics between actors: shaping networks over time
The HOT mapping project, as described above, is an example of a well-sup-
ported and used map. The stability and established reputation of organisa-
tions associated with HOT has helped to circulate the map among emergency
responders working on the ground in the Philippines, as well as among those
Cate Turk - 9781526122520
Downloaded from manchesterhive.com at 07/11/2021 03:57:14PM
via free accessMaps as foams 213
Figure 9.5 The HOT mapping deployment post Typhoon Haiyan/Yolanda: inception
and growth (author’s image).
coordinating the response. Here, the foam illustrates an assemblage where the
support of significant actors gives credibility and extends the possibilities for
wider map distribution and engagement. These stable actors give support to the
project through the stability of the interface.
Yet there may also be dynamics that lead to the possibility of rupture. At
one stage, the HOT email list shows frustrations felt in waiting for access
to satellite imagery. While some of the coordinating group were undertaking
negotiations with larger institutional partners, others set up a petition to try and
lobby for speedier access to the imagery. Emails allude to tensions between the
HOT board and a petitioner. In this case the bubble doesn’t split but stability is
disrupted.
Another example shows dynamics between actors and how we can take posi-
tioned viewpoints into account, looking through the foam.
This sequence of events shows how the network of significant actors, while
promising stability, poses some risks for how the HOT map is viewed. In
this case, a partnership within a network of emergency response organisations
Figure 9.6 The HOT mapping deployment post Typhoon Haiyan/Yolanda: discussion
and disruption (author’s image).
Cate Turk - 9781526122520
Downloaded from manchesterhive.com at 07/11/2021 03:57:14PM
via free access214 (In)formalising
Figure 9.7 The HOT mapping deployment post Typhoon Haiyan/Yolanda: viewed
through other actors (author’s image).
and, in particular, a close engagement with the United States government’s
State Department, potentially overshadows the work of HOT. The ambigu-
ous phrasing of this article (DipNote, 2015) about HOT work, in the context
of a joint project with the State Department known as ‘Mapgive’, implicitly
credits the US Department of State for the HOT’s Haiyan/Yolanda response
(Amrwaga, 2015). While the State Department would most probably clarify
the nature of their engagement, from the perspective of an outside actor reading
about these mapping activities, the State Department ‘bubble’ takes in the HOT
work. These small interactions, insignificant in the overall work that these maps
set out to do, are relevant here because they signal how a map is contingent upon
the ways it is generated, presented and used.
2 Time within a map
Maps are opportunistic compilations of data, ‘bricolage’ as John Pickles puts it
(2004: 88; following Lestringant, 1994). As such, data from different sources
and time periods may be combined together into a map, sometimes in a chrono-
logical sequence, but often containing disjunctures and inconsistencies. Take
as an example this screenshot (Figure 9.8) from the Volontaires internationaux
en soutien aux opérations virtuelles (VISOV, 2013) Ushahidi Crowdmap of
damage from the typhoon.
The screenshot shows map data in the form of a list of reported entries,
mainly incorporating photographs of damage. Reports are date stamped at the
right according to when they were entered into the ‘crowdmap’ database. Some
reports contain dates as part of the data entered – see ‘Nov 11 AFP’ in the third
entry, for example. We could assume this was when the photo was taken, but
it could also be when the organisation received the photographs from someone
else. So there are least two different times combined into the photo report and
Cate Turk - 9781526122520
Downloaded from manchesterhive.com at 07/11/2021 03:57:14PM
via free accessMaps as foams 215
Figure 9.8 Mapping software collating crowd-sourced reports about storm damage
(Volontaires internationaux en soutien aux opérations virtuelles, https://haiyan.
crowdmap.com).
going back in the chronology there is also the time when the damage occurred.
There will always be a time lag (no matter how sophisticated the software)
between the moment an event happens and when it is recorded. In the online
context, there is also the further issue of how the software copes with multiple
time zones and correspondences between the time of the server and of the user.
This series of times and events then becomes collapsed into a report which, in
turn is translated into a dot on the map.
The crowdmap software enables users to filter reports according to date –
noted here by the red text ‘Showing Reports from Nov 01, 2013 to Dec 31,
2013’ – such that a map image might only show a subset of reports. The map
database, however, is an accumulation of reports over time (see Figure 9.9).
Curators may have the ability to delete reports, but in practice most crowdmaps
consist of a piling up of data, such that calling up a map in the present includes old
and new data, some potentially out of date. There is therefore a need to interpret
maps critically and ask whether the current version reflects a real-time present.
The processes of data capture and representation draw together events hap-
pening at different times and reconfigures them in a map interface. Again,
employing the metaphor of a foam assemblage suggests honing in on particular
practices that contribute to the temporality of a map through these technological
engagements.
Like the adding of damage reports through the software interface, a second
example of complex temporalities feeding into the map is that of mapping
Cate Turk - 9781526122520
Downloaded from manchesterhive.com at 07/11/2021 03:57:14PM
via free access216 (In)formalising
Figure 9.9 Foam interfaces can be thick with multiple temporalities (author’s image).
damage from satellite imagery. A couple of the case study map examples make
use of satellite imagery of the damaged areas as it becomes available. The Tomnod
project (Digital Globe, 2013), one of these examples, invites members of the
public to scan satellite imagery, crowd-sourcing the job of processing hundreds
of square kilometres of land to recognise damage from the air. Taking a per-
formative approach to these practices of doing the s canning work, we see how
this process of map or image interpretation involves toggling backwards and
forwards between pre- and post-disaster imagery. By undertaking this jumping
through time, the user sees and experiences, albeit through a mouseclick, the
effects of the storm. Each new tile viewed begins this process of time travel and
(armchair) experience of the disaster again.
The HOT email list shows there was a considerable drive to achieve up-to-
date maps using the latest satellite imagery (and this in a timely way), but even
in this striving for proximity to real-time, the present is mapped with reference
to the past. In order to map what is damaged we need to know what was there
before. It is important to remember this, given the internet’s sense of always
being in the present, meaning what we access today we often assume to be cur-
rent. This is particularly pertinent in the context of a ‘crisis’ where the urgency
of response is a plaidoyer for attempting to map in real-time. Yes, in comparison
to a static wall map, digital spatial media offers possibilities for integrating new
data as it is produced, including incorporating non-human sensors. Further,
the ability to animate the map provides an interface that seemingly moves with
the times. We imagine real-time as represented by the moment new data pops
into a map on our screen. Still, David Pinder’s warning (2007: 460) not to get
caught up ‘in the giddy spectacularised techno-rush that promises even more
powerful techniques of visualisation’, is sound advice. In a way, as we focus in
on the micropractices of mapping and take a ‘freeze frame’ in order to interpret
Cate Turk - 9781526122520
Downloaded from manchesterhive.com at 07/11/2021 03:57:14PM
via free accessMaps as foams 217
the gushing, foaming streams of crisis data, we heed his call for slowing down
and pausing.
3 Foams over time
Yet how might we take an assemblage of seething foam into account? One way
is to recognise and chart the multiple temporalities working on each other, such
as the ways in which older data is incorporated, or how remarks about the pre-
sent rely on knowledge about the past. As a crisis develops and mapping effort
follows as part of the response, the expected temporality of rapid exchanges
and updates may be frustrated or disrupted; the tempo changing depending on
accessibility of information about the crisis or resources to help contribute to a
map. Temporality is thus a significant dimension in the relations between actors
in crisis mapping assemblages.
It is also possible to conceive of the temporality of the foam at another scale,
not just in exchanges between individual actors, but as a way of considering how
the collective moves and changes. From the jostling of bubbles and study of sur-
face tensions, we could, maintaining the metaphor, go on to examine the larger
‘oceanic’ movements; the forces that churn the foam and affect the longer term
progress of these projects (see Figure 9.10). Oceanic metaphors have also been
used to refer to big data – we hear for instance about a ‘tsunami of information’
(D’Antonio, 2011; Brown, Vinzi and Glady, 2013). Crisis map project-histories
could very well be put in similar terms coming into being on a tide of concern;
being brought to the fore through media interest in the disaster, churning and
collecting more actors; and sitting in clusters that after time and exposure
become subsumed into the ether.
Figure 9.10 Map project histories, with apologies to Hokusai (author’s image).
Cate Turk - 9781526122520
Downloaded from manchesterhive.com at 07/11/2021 03:57:14PM
via free access218 (In)formalising
Figure 9.11 Crowd-sourced reporting of water heights. Information is current for a
limited time. Philippine Flood Map 2013, https://philfloodmap.crowdmap.com. Map
data © 2017 Google. This figure has not been made available under a CC licence.
Permission to reproduce it must be sought from the copyright holder.
There is too the ephemeral nature of these maps and their overall relevance
in the big scheme of disaster response. These maps are often a ‘drop in the
ocean’, they have a moment of exposure and fizzle away. Unless a significant
actor or a great many users latch onto the map, it is taken back into the sea of
data. In the life of a ‘fizzing map foam’, new actors join, others leave, engaging
or disengaging with the interface. Some maps, like the Philfloodmap example
in Figure 9.11, are designed for a short period of use. In this case users should
report in when water reaches a certain height.
The information is relevant for a brief, critical period and depends upon user
input during this time in order to work. If there is poor exposure or users engage
only briefly without contributing reports, then there is little content. The map
may be subsumed among other sorts of crisis information and fizzle away.
Here the emphasis on the dynamics of map project history provides a more
nuanced account of these maps and the work of those creating and employing
them. As a method for studying maps, we can include a level of detail account-
ing for the multiple temporalities of map assemblages at different scales. This
is particularly relevant to crisis mapping; where maps can be generated and
edited quickly and the situations in which maps are used may also be subject to
Cate Turk - 9781526122520
Downloaded from manchesterhive.com at 07/11/2021 03:57:14PM
via free accessMaps as foams 219
rapid change. Often maps are being made in two time frames at once – sourcing
pre-disaster information and attaching post-disaster reports. Furthermore, the
constellations of actors move and slip as aid agencies, local communities and
online collaborators join, make use of, or discard the maps produced. The foam
provides a figure that helps to encompass these actors and actions, while main-
taining a central interest in the map.
Conceptualising maps that shift with each moment
Once you begin a hunt for spheres in the form of bubbles, globes and foam, and so
forth, they seem to spring up everywhere, appearing in all variety of shapes and sizes
and inaugurating all kinds of relations. (Frichot, 2009: 4)
Sloterdijk’s ‘thought figure’ is compelling. The bubble/foam topology is an
attractive way to conceptualise an assemblage. As Sloterdijk (2009: no pagina-
tion) himself has remarked however: ‘it is not a universal theory but an explicit
form of spatial interpretation’. Having explored the possibilities here, I consider
it offers a useful way to organise research about relations between objects and
the networks/foams within which they exist. Most importantly for our discus-
sion here, the foam metaphor helps to convey the contingency of mapping
projects and the dynamism of relations. Not only the dynamics of map content
within new spatial media, but significantly the dynamism inherent in all maps.
Furthermore, we can incorporate concepts of interactivity; bricolage (reuse and
recombination of data etc.); stability and fragility; manifold perspectives and
the mediation of interfaces; as well as ideas of (surface)tension and exchanges of
agency. Not to mention the possibilities of viscosity: how foams fizzle and seethe
according to multiple temporalities.
Through the example of mapping Typhoon Haiyan/Yolanda, we have been
able to showcase some of the methods by which the foam metaphor can be
applied to help shape the inquiry and better understand the dynamic relations
within crisis mapping projects. This has helped to show projects where there
is stability and good reception of the map, as well as how maps have utility
for short periods of time or specific groups of users. As Annemarie Mol and
Marianne de Laet say of the fluid networks surrounding the technology of the
Zimbabwe bush pump (Mol and de Laet, 2000), there is no binary assessment of
whether these maps are successful or not. Rather the researcher allows h erself/
himself to be moved by them. Along these lines, I should acknowledge that
the fluid mass of foam includes me as researcher, my views on how these crisis
mapping projects look and work are positioned within the foam too.
Cate Turk - 9781526122520
Downloaded from manchesterhive.com at 07/11/2021 03:57:14PM
via free access220 (In)formalising
Considering digital spatial media as combining multiple temporalities, it is
worth noting how data and relations accumulate in crisis maps over time, as
well as how collaborating in real-time intersects with the contingency of map-
ping projects. Employing a method inspired by foams, we have accounted for
these dynamics at different scales: both the micropolitics of interactions at the
interface and the larger ebbs and flows of the collective. The transition from
‘networks’ to ‘foam’ incorporates concepts of ‘ontogeny’, and enables the
processual approach to understanding maps to account for project h istories.
The jostling of bubbles in the foam is a potent way of imagining maps and
engagements with maps, including the flurry to map order into a crisis.
Note
1 The term ‘produsers’ is used by Bruns (2006: 276) to reference a hybrid of map produc-
ers and users.
References
Amrwaga (2015) Open data day: How the State Department is linking diplomacy with
collaborative mapping during crises. Str8talk Chronicles, 23 February. [Online] Available
at: http://str8talkchronicles.com/open-data-day-how-the-state-department-is-linking-
diplomacy-with-collaborative-mapping-during-crises (accessed 1 March 2015).
Barker, T. (2012) Time and the Digital: Connecting Technology, Aesthetics, and a Process Philosophy
of Time. Hanover, New Hampshire: Dartmouth College Press.
Barnett, C. (2004) Deconstructing radical democracy: Articulation, representation and
being-with-others. Political Geography, 23(5): pp. 503–528.
Bittner, C., Glasze, G. and Turk, C. (2013) Tracing contingencies: Analyzing the political
in assemblages of web 2.0 cartographies. GeoJournal, 78: pp. 935.
Brown, S., Vinzi, V. E. and Glady, N. (2013) Big data: A tsunami of information. Essec
Business School. [Online] Available at: http://knowledge.essec.edu/en/innovation/
keeping-up-with-the-big-data-revolution.html (accessed 1 March 2015).
Bruns, A. (2006) ‘Towards produsage: Futures for user-led content production’. In:
Sudweeks, F., Hrachovec, H. and Ess, C. (eds) Proceedings: Cultural Attitudes towards
Communication and Technology. Perth: Murdoch University, pp. 275–284.
Cartwright, W. (2013) ‘Artefacts and geospaces’. In: Kriz, K., Cartwright, W. and
Kinberger, M. (eds) Understanding Different Geographies: Lecture Notes in Geoinformation
and Cartography. Berlin: Springer-Verlag, pp. 55–66.
D’Antonio, M. (2011) Marketers brace for the Tsunami of big data. 1to1Media. [Online]
Available at: www.1to1media.com/view.aspx?docid=33289 (accessed 1 March 2015).
Cate Turk - 9781526122520
Downloaded from manchesterhive.com at 07/11/2021 03:57:14PM
via free accessYou can also read