Report Impact Assessment of Moving Sand from Adelaide's Northern Beaches - Phase 1 Assessment: 2020-2021 Sand Movement - Department for ...
←
→
Page content transcription
If your browser does not render page correctly, please read the page content below
Report
Impact Assessment of Moving Sand from
Adelaide’s Northern Beaches – Phase 1
Assessment: 2020-2021 Sand Movement
Department for Environment and Water
09 December 2020
Document Status
                                                Version            Doc type            Reviewed by             Approved by                     Date issued
                                                1                  Draft               Astrid Stuer            Mel Lutton                      20/10/2020
                                                2                  Final               Mel Lutton              Mel Lutton                      09/12/2020

                                                Project Details
                                                Project Name                                   Impact Assessment of Moving Sand from Adelaide’s Northern
                                                                                               Beaches – Phase 1 Assessment: 2020-2021 Sand Movement
                                                Client                                         Department for Environment and Water
                                                Client Project Manager                         James Guy
                                                Water Technology Project Manager               Melinda Lutton
                                                Water Technology Project Director              Gildas Colleter
                                                Authors                                        Astrid Stuer, Jamie Kaye, Melinda Lutton
                                                Document Number                                21030014_R02v01c_Adelaide beaches 201203.docx

                                                COPYRIGHT

                                                Water Technology Pty Ltd has produced this document in accordance with instructions from Department for Environment
                                                and Water for their use only. The concepts and information contained in this document are the copyright of Water
                                                Technology Pty Ltd. Use or copying of this document in whole or in part without written permission of Water Technology
                                                Pty Ltd constitutes an infringement of copyright.

                                                Water Technology Pty Ltd does not warrant this document is definitive nor free from error and does not accept liability for
                                                any loss caused, or arising from, reliance upon the information provided herein.
21030014_R02v01c_Adelaide beaches 201203.docx

                                                1/198 Greenhill Road
                                                Eastwood SA 5063
                                                Telephone       (08) 8378 8000
                                                Fax             (08) 8357 8988
                                                ACN             093 377 283
                                                ABN             60 093 377 283

                                                Department for Environment and Water | 09 December 2020
                                                Impact Assessment of Moving Sand from Adelaide’s Northern Beaches – Phase 1 Assessment:                             Page i
                                                2020-2021 Sand Movement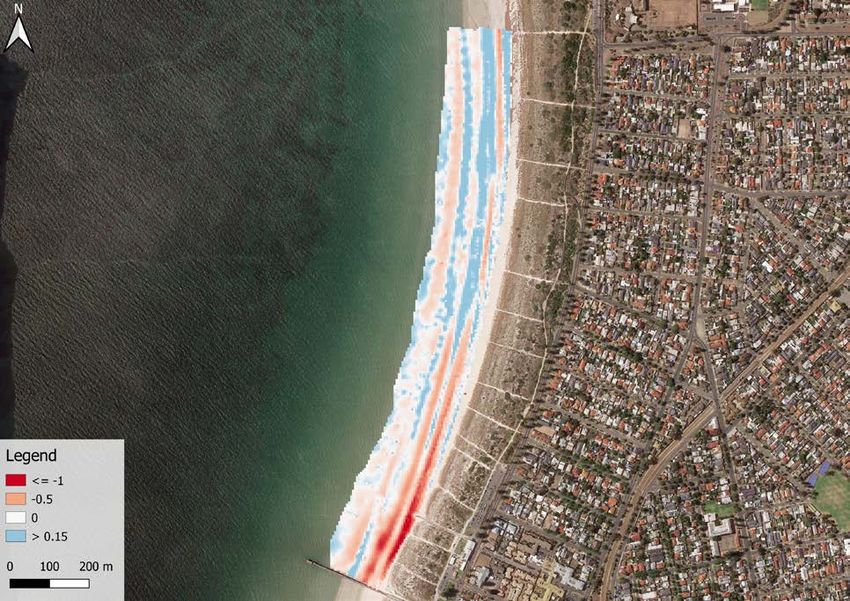
EXECUTIVE SUMMARY
The Department for Environment and Water aims to truck sand for the 2020-21 financial year in advance of a
proposed new sand transfer pipeline being commissioned. The design and construction of the proposed
pipeline has been considered separately. This report is an independent review of impacts of trucking on the
beaches and has been initiated in response to community concern.
The report summarises the anticipated effects of up to 120,000m3 sand transportation (via trucking) from the
northern beaches to West Beach in order to offset current rates of sand loss from West Beach while a new
sand pumping system is planned, designed and constructed from West Beach to the northern beaches.
Scenarios Considered
Three hypothetical sand movement scenarios were considered for collection of different amounts of sand from
different areas at different times, for the 2020-21 financial year. The collection methodologies included:
Movement of up to 120,000m3 of sand in the 2020-21 financial year to West Beach from beaches between
Semaphore Park and Largs Bay.
Sand to be collected by land plane (scraper) from the beach between the low water mark and 5m from
the toe of dune - also noting the requirement in Section 3.3 to consider alternative offset distances from
the toe of dune (5m, 10m and 15m).
Sand to be moved by truck along the beach to the existing beach access point at the Semaphore Surf Life
Saving Club (Point Malcolm Reserve), where it will be loaded onto road haulage trucks and transported
to West Beach.
Harvesting Assessment
An analysis of past harvesting campaigns and an erosion assessment was undertaken to provide an
independent assessment of sand harvesting works on the northern beaches from Semaphore to Largs North.
The analysis is focused on long-term impacts rather than short-term impacts that can affect the beaches at
any time regardless of the sand harvesting works. In other words, the development of erosion scarps can occur
at any time if harvesting is undertaken or not as this is the natural response of the beach to storms. In summary:
Most northern beaches are accreting, and sand harvesting is therefore possible without significant impact
on the dunes.
Erosion is experienced just north of the breakwater which will need to be managed actively. This area
requires ongoing beach nourishment rather than sand harvesting.
21030014_R02v01c_Adelaide beaches 201203.docx
All other beaches will continue to grow despite short term storm impacts and harvesting works.
Semaphore breakwater has been intensely harvested in 18/19 and 19/20, resulting in increased extent of
downdrift erosion at Semaphore Jetty.
The amount of additional storm erosion on the ‘harvested’ beach profiles is relatively small, especially in
comparison to the beach accretion rates, and recovery is expected to occur quickly due to the overall
accretion trend.
From a coastal engineering perspective, sand harvesting has therefore very limited impacts on the harvest
area in terms of impacts on the dune/available erosion buffer. Sufficient dune erosion buffers exist with
no infrastructure at risk from a significant storm event on the pre- or post-profile.
Recommendations are included in Section 2.9, and include further detail on:
Future 2020/21 sand harvesting campaigns at Semaphore breakwater should be no more than the natural
rate of replenishment
Department for Environment and Water | 09 December 2020
Impact Assessment of Moving Sand from Adelaide’s Northern Beaches – Phase 1 Assessment: Page ii
2020-2021 Sand Movement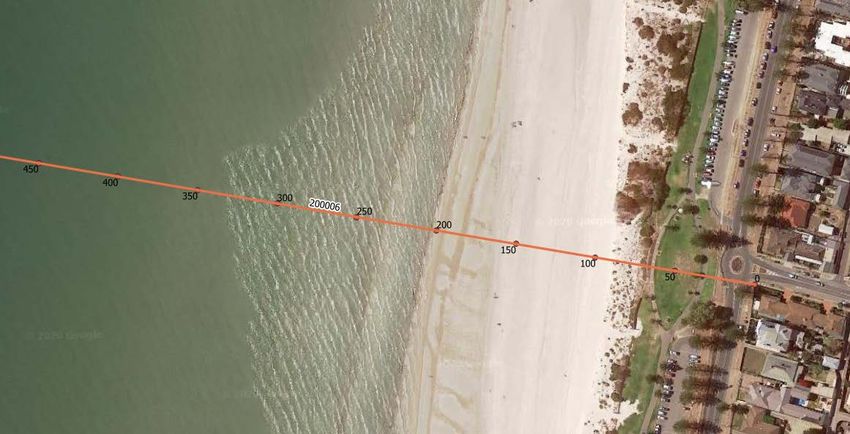
Future harvesting campaigns at the breakwater should therefore be reduced to be no more than the
natural rate of replenishment to limit further downdrift impacts.
Beach conditions shall always be assessed prior to each campaign to ensure that sufficient volumes are
available.
A maximum quantity of about 60,000 m3 can potentially be harvested from the area in between Semaphore
and Largs Jetty and a maximum of 85,000 m3 from North of Largs Jetty in 2020/21.
Detailed discussion of the three 3 scenarios investigated in this report, with preferred recommendations.
Biodiversity
Dune vegetation is a key consideration with respect to sand harvesting impacts, and there is no high value
vegetation identified in the foredune area. With only a small amount of dune recession predicted, it was
considered that there was no vegetation of significance in the area that could be eroded. Although the
vegetation on the dunes will not be physically impacted by machinery in the sand harvesting process, there is
the possibility of resultant foredune erosion and therefore displacement of the vegetation on the outermost
dune face and crest. Section 3 discusses this in further detail. Mitigation measures include:
Ensure that all machinery stays off the vegetated dune system.
Identify and protect nesting sites.
Limit the number of campaigns, however it should be noted that there is a compromise between harvesting
less often and extracting more sand at one time.
Minimise traffic on beach – If larger dump trucks are used, fewer trips are required. This may also be a
compromise as it is unknown whether fewer larger trucks cause greater compaction of the sands.
Ensure maximum vehicle speeds are adhered to and reduce speed if necessary to avoid contact with any
vegetation.
Minimise distribution of vehicle movements on the beach, preferably operating in the intertidal zone.
if it is necessary to move seagrass wrack to harvest sand, it should be relocated to the upper beach rather
than removing from site.
Other Impacts
Safety considerations form a paramount component of the social assessment, and DEW has a current set of
operating conditions of the sand movement works such as truck speed on the beach and give-way rules. It
should be noted that in 40 years of operation, there have not been any reported health and safety incidents
21030014_R02v01c_Adelaide beaches 201203.docx
attributed to the movement of sand.
Other impacts have been considered in this report, and it is recognised that there will be disturbance to local
residents, commercial and beach users during the sand movement campaigns.
Current operational hours are:
7am to 5pm for the land plane
9am to 4pm for the beach trucks
7.30am to 5pm for the road trucks
Department for Environment and Water | 09 December 2020
Impact Assessment of Moving Sand from Adelaide’s Northern Beaches – Phase 1 Assessment: Page iii
2020-2021 Sand Movement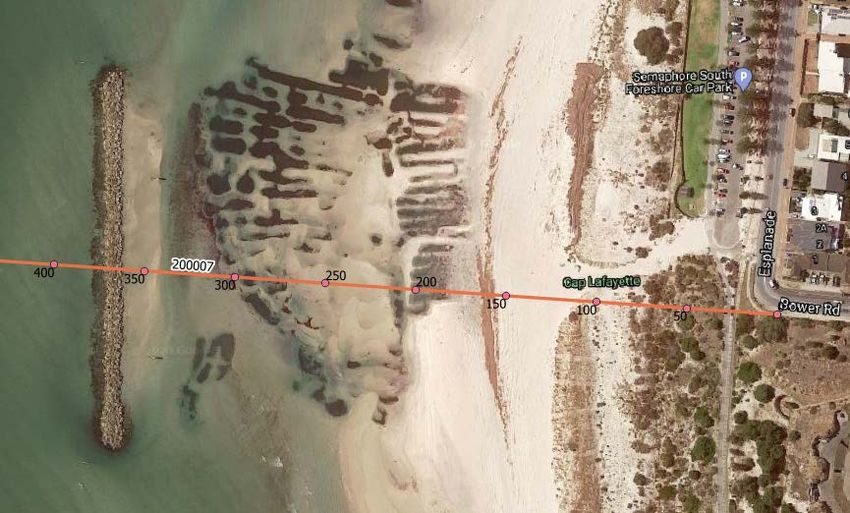
CONTENTS
                                                EXECUTIVE SUMMARY                                                                              II
                                                Scenarios Considered                                                                            ii
                                                Harvesting Assessment                                                                           ii
                                                Biodiversity                                                                                   iii
                                                Other Impacts                                                                                  iii

                                                1         INTRODUCTION                                                                         1
                                                1.1       Purpose of the Report                                                                1
                                                1.2       Background                                                                           1
                                                1.3       Activity to be Assessed                                                              1
                                                1.4       Northern Beaches Previous Campaigns                                                  2
                                                1.5       Desktop Assessment                                                                   2
                                                1.6       Stakeholder Consultation                                                             2

                                                2         COASTAL ENGINEERING ASSESSMENT                                                       3
                                                2.1       Coastal Processes                                                                    3
                                                2.2       2020/21 Harvest Campaign Scenarios                                                   4
                                                2.3       Details of Current Operation                                                         5
                                                2.4       Methodology                                                                          5
                                                2.5       Previous Sand Harvesting Campaigns                                                   5
                                                2.6       Analysis of Surveys                                                                  6
                                                2.6.1     Semaphore breakwater area                                                            8
                                                2.6.2     North of Largs Jetty                                                                15
                                                2.6.3     2016 storm event                                                                    17
                                                2.6.4     Summary                                                                             18
                                                2.7       Erosion Assessment                                                                  18
                                                2.7.1     Sediment size                                                                       19
                                                2.7.2     Water levels                                                                        19
                                                2.7.3     Waves                                                                               20
                                                2.7.4     Results                                                                             21
21030014_R02v01c_Adelaide beaches 201203.docx

                                                2.8       Summary                                                                             22
                                                2.9       Recommendations                                                                     23

                                                3         BIODIVERSITY CONSIDERATIONS                                                         27
                                                3.1       Potential Impacts from Sand Harvesting                                              27
                                                3.1.1     Physical removal or exposure of intertidal ecosystems                               27
                                                3.1.2     Compaction of sands                                                                 27
                                                3.1.3     Wrack loss                                                                          28
                                                3.1.4     Scraper and truck movement keeping fauna from swash zone                            28
                                                3.1.5     Noise and activity disturbance                                                      28
                                                3.1.6     Dune erosion and steepening                                                         28
                                                3.2       Key Environmental Assets and Impact Mitigation                                      28
                                                3.2.1     Flora                                                                               28

                                                Department for Environment and Water | 09 December 2020
                                                Impact Assessment of Moving Sand from Adelaide’s Northern Beaches – Phase 1 Assessment:   Page iv
                                                2020-2021 Sand Movement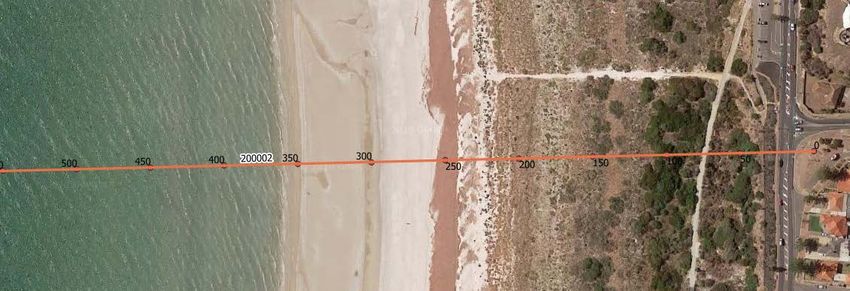
3.2.2    Fauna                                                                                         30
                                                3.2.3    Wrack                                                                                         31
                                                3.2.4    Intertidal Ecosystems                                                                         31

                                                4        TRAFFIC MOVEMENTS                                                                             33
                                                4.1      Current Traffic Movements                                                                     33
                                                4.2      Trucking Movements                                                                            34
                                                4.3      Operational Requirements                                                                      35

                                                5        OTHER IMPACTS                                                                                 36
                                                5.1      Health and Safety                                                                             36
                                                5.2      Social and Amenity                                                                            36
                                                5.3      Impact on Local Businesses                                                                    37
                                                5.4      Stormwater Quality                                                                            37
                                                5.5      Dune Vulnerability                                                                            37
                                                5.6      Other Mitigation                                                                              38
                                                5.7      Economic Assessment                                                                           38

                                                6        REFERENCES                                                                                    39

                                                APPENDICES
                                                Appendix A Profile analysis – detailed description
                                                Appendix B Record of profiles from 2010 to 2020
                                                Appendix C DEW’s Coastal Team Contact Card

                                                LIST OF FIGURES
                                                Figure 2-1      Sand harvesting areas                                                                    3
                                                Figure 2-2      Past Harvesting Campaigns by area                                                        6
                                                Figure 2-3      Survey profiles along the harvest area                                                   7
                                                Figure 2-4      Comparison of beach profiles South of Semaphore breakwater (blue line) and north of Largs
                                                                Jetty (yellow line)                                                                      8
                                                Figure 2-5      Record of sand harvesting at Semaphore breakwater                                        9
21030014_R02v01c_Adelaide beaches 201203.docx

                                                Figure 2-6      17/11/2018                                                                              10
                                                Figure 2-7      23/12/2018                                                                              10
                                                Figure 2-8      Aerial from 16/07/2020 Showing Salient                                                  10
                                                Figure 2-9      DEM comparison 10/2018 to 10/2019                                                       11
                                                Figure 2-10      DEM comparison 10/2019 and 01/2020                                                     12
                                                Figure 2-11     Aerial from 10/2019                                                                     13
                                                Figure 2-12     Aerial from 01/2020                                                                     13
                                                Figure 2-13     Profile Comparison 2010 and 2020 at Semaphore Breakwater                                14
                                                Figure 2-14     Net accretion/recession rates around Semaphore breakwater                               15
                                                Figure 2-15     Comparison plot of beach levels before and after beach harvesting (April – June 2020)   16
                                                Figure 2-16     Dune accretion north of Semaphore Jetty                                                 17
                                                Figure 2-17     Components of a Storm Tide Event                                                        20

                                                Department for Environment and Water | 09 December 2020
                                                Impact Assessment of Moving Sand from Adelaide’s Northern Beaches – Phase 1 Assessment:            Page v
                                                2020-2021 Sand Movement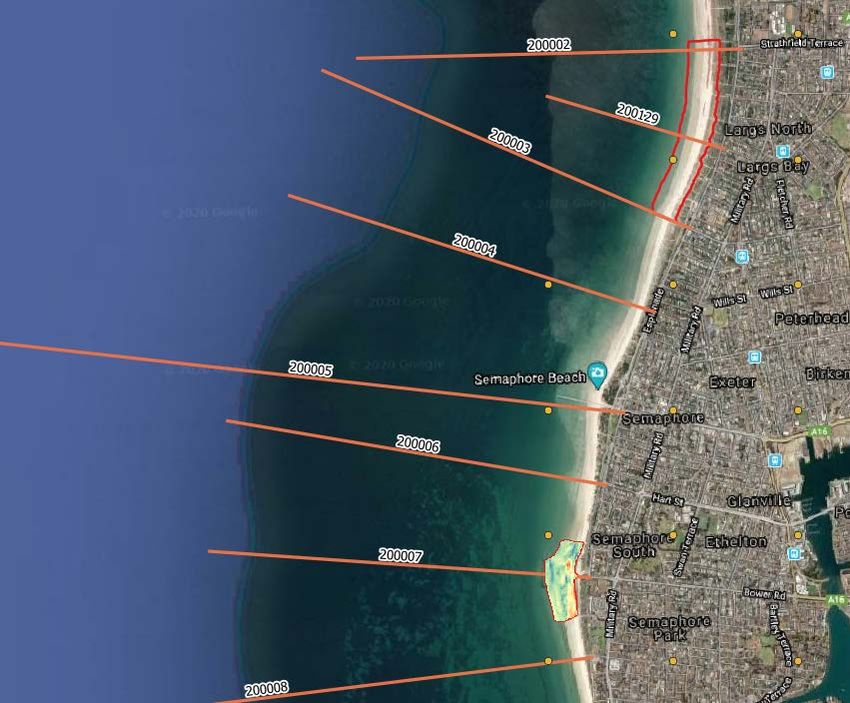
Figure 2-18     Erosion impact on pre and post harvested beach profile                                 21
                                                Figure 2-19     recommended harvesting specifications                                                  24
                                                Figure 3-1      Reclassified dune vegetation condition mapping (original mapping from T&M Ecologists
                                                                2020)                                                                                  29

                                                LIST OF TABLES
                                                Table 2-1       Harvesting scenarios                                                                    4
                                                Table 2-2       Summary of accretion and erosion                                                       18
                                                Table 2-3       Tidal Planes at Adelaide Outer Harbour                                                 19
                                                Table 2-4       Storm tide levels for Adelaide                                                         20
                                                Table 2-5       Wave HEIGHTS                                                                           20
                                                Table 2-6       Erosion increase due to harvesting works                                               21
                                                Table 2-7       Revised scenarios for 2020/21 campaign options                                         25
21030014_R02v01c_Adelaide beaches 201203.docx

                                                Department for Environment and Water | 09 December 2020
                                                Impact Assessment of Moving Sand from Adelaide’s Northern Beaches – Phase 1 Assessment:           Page vi
                                                2020-2021 Sand Movement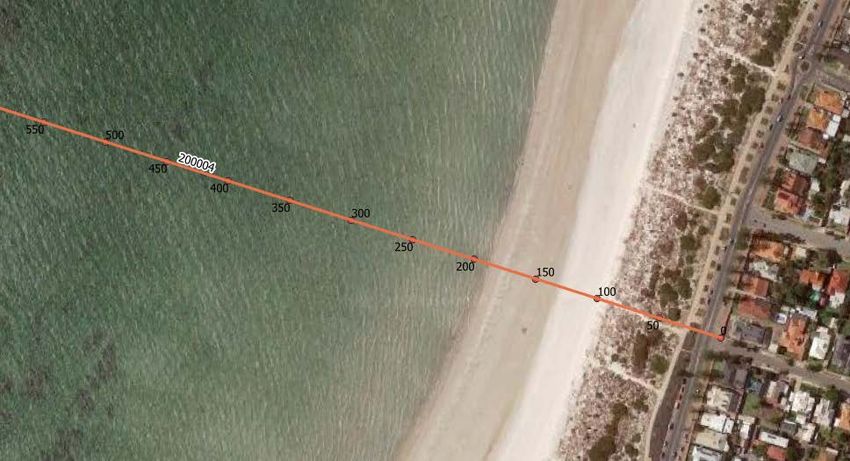
1 INTRODUCTION
1.1 Purpose of the Report
The Department for Environment and Water is commissioning an independent assessment of the impacts of
sand movement activities associated with the Securing the future of our coastline project on the northern
Adelaide metropolitan beach systems (including the local primary dunes systems). The impacts of two
components of the project are to be assessed in separate phases:
Phase 1: Interim sand management (2020-21): Sand transportation (via trucking) from the northern
beaches to West Beach in order to offset current rates of sand loss from West Beach while a new sand
pumping system is planned, designed and constructed from West Beach to the northern beaches.
Phase 2 (Not in Scope): Ongoing sand management: Development of the new sand pumping system,
which will deliver annual recycling of sand from the northern beaches to match littoral drift rates out of
West Beach.
This report is to assess the impacts of trucking sand for the 2020-21 financial year in advance of the new
pipeline being commissioned, which relates to Phase 1 above. It is an independent review of impacts of the
project on the beaches and has been initiated in response to community concerns. The community is generally
concerned about loss of beach width at the collection point, and a resulting loss of recreational amenity. There
are also concerns about the impacts of sand movement logistics, as the continuous trucking operations will
partially restrict access to the beach, significantly impacting amenity value during sand movement operations.
The community is also concerned about the loss of primary foredune and potential environmental impacts on
coastal flora and fauna. Other concerns have been raised about visual amenity (beach appearance after
scraping) including the potential development of erosion scarps. These potential impacts will be assessed as
part of this project.
1.2 Background
The Phase 1 works involve the collection of up to 120,000m3 of sand from the beaches in between Semaphore
Park and Largs Bay. Sand is generally collected in between the low water mark and 5m from the front of the
toe using a scraper. The sand is trucked to a transfer point (existing beach access) at the Semaphore Surf Life
Saving Club, and then is loaded onto road haulage trucks and transported to West Beach for placement. The
scope of works is to assess impacts on the beach at the collection point at Semaphore Park to Largs Bay, but
not at the place of deposition at West Beach.
21030014_R02v01c_Adelaide beaches 201203.docx
Three scenarios have been assessed and are summarised in Table 2-1. Sand is typically moved during Spring
and Autumn and outside of school holidays to enable the public to enjoy the beaches over the summer months
without disturbance. The impact assessment has considered environmental, social and economic aspects that
can potentially arise from the removal of sand at the northern beaches.
1.3 Activity to be Assessed
The following activities will be assessed, which will consider three hypothetical sand movement scenarios
detailed in Table 2-1for the 2020-21 financial year:
Movement of up to 120,000m3 of sand in the 2020-21 financial year to West Beach from beaches between
Semaphore Park and Largs Bay.
Sand to be collected by land plane (scraper) from the beach between the low water mark and 5m from
the toe of dune - also noting the requirement in Section 3.3 to consider alternative offset distances from
the toe of dune (5m, 10m and 15m).
Department for Environment and Water | 09 December 2020
Impact Assessment of Moving Sand from Adelaide’s Northern Beaches – Phase 1 Assessment: Page 1
2020-2021 Sand Movement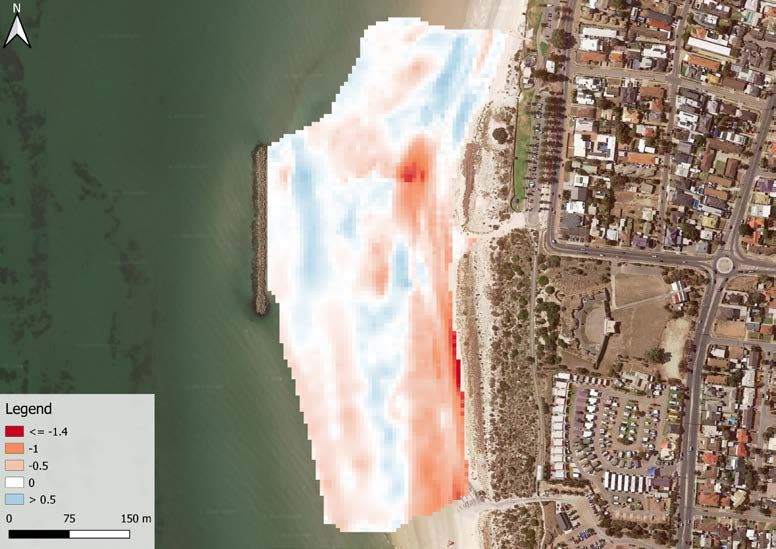
Sand to be moved by truck along the beach to the existing beach access point at the Semaphore Surf Life
Saving Club (Point Malcolm Reserve), where it will be loaded onto road haulage trucks and transported
to West Beach.
Sand to be moved under the Semaphore jetty using a mobile conveyor belt system when necessary.
1.4 Northern Beaches Previous Campaigns
DEW undertook sand back-passing campaigns in spring 2019 and autumn 2020, where sand was removed
from the northern beaches. As part of those campaigns a number of datasets, such as pre- and post-works
surveys, were collected. Additionally, DEW has a long term record of beach profile surveys and sand analysis
information. Water Technology has reviewed all data and reports to make informed decisions about any
possible impacts from the planned spring 2020 and autumn 2021 campaigns. Other previous studies, such as
the DHI 2018 report have also informed the assessment, as this provides detailed data about longshore sand
transport rates in the various beach cells. This enables assessment of the short term and long term impacts
to estimate the time for ‘recovery’ of the northern beaches.
1.5 Desktop Assessment
Based on the review of previous data, Water Technology has undertaken modelling for the three outlined sand
removal scenarios to estimate the:
Anticipated dune recession and the remaining dune buffer at the borrow site; and
Anticipated impacts on downdrift and updrift sites from the borrow site.
Impacts of everyday conditions and minor-to-moderate storm events (e.g. 10% AEP ) on the pre- and post-
works profiles have been assessed and compared.
1.6 Stakeholder Consultation
As part of the ongoing stakeholder consultation process, two workshops were held and presentations of the
findings of this report were made:
Workshop 1 held on 15 September 2020 at the Quest Hotel, Port Adelaide
Workshop 2 held on 25 September 2020 at the Port Environment Centre, Port Adelaide
A number of additional concerns were raised by the stakeholder group, and these have been addressed in this
report where they were in scope. Input was received from stakeholders including:
Individual local stakeholders
21030014_R02v01c_Adelaide beaches 201203.docx
Port Adelaide Residents Environment Protection Group
Semaphore Largs Dunes Group
Save Our Shores (SOS) Semaphore Largs Bay
Friends of Gulf St Vincent
Birdlife Australia
Department for Environment and Water | 09 December 2020
Impact Assessment of Moving Sand from Adelaide’s Northern Beaches – Phase 1 Assessment: Page 2
2020-2021 Sand Movement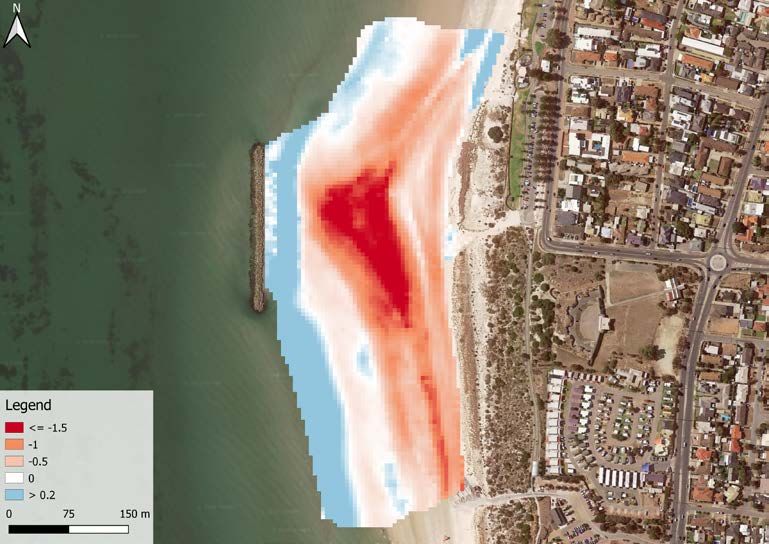
2 COASTAL ENGINEERING ASSESSMENT
The coastal engineering assessment analyses the erosion impact of sand harvesting works on the beaches
and dunes. Sand harvesting is undertaken in three areas (see Figure 2-1):
Near Semaphore Breakwater;
In between Semaphore and Largs Jetty; and
North of Largs Jetty.
21030014_R02v01c_Adelaide beaches 201203.docx
FIGURE 2-1 SAND HARVESTING AREAS
2.1 Coastal Processes
Coastal Processes and sediment movement along Adelaide beaches have been assessed as part of other
studies in the past and are utilised for this project:
CES, 2007: Adelaide’s Living Beaches Strategy, Quantifying Adelaide Coast Protection Alternatives, 01
May 2007
Department for Environment and Water | 09 December 2020
Impact Assessment of Moving Sand from Adelaide’s Northern Beaches – Phase 1 Assessment: Page 3
2020-2021 Sand Movement WRL, 2001: Semaphore Park Offshore Breakwater Optimisation and Detailed Design, Nov 2001.
WRL, 2007: Technical Review of the Semaphore Park Trial Breakwater, South Australia, Oct 2007.
Department for Environment and Heritage, 2005: Adelaide’s Living Beaches, A Strategy for 2005–2025,
Technical Report, June 2005
DHI, 2018: West Beach Coastal Processes Modelling. Assessment of Coastal Management Options,
August 2018.
Most relevant findings to this assessment:
Sediment transport along Adelaide beaches is northwards.
Sediment longshore rates at the northern beaches have been estimated in the order of 55,000 m3/year at
Semaphore (Cell 5) and 0 - 30,000 m3/year at Largs Bay (Cell 6) by CES, 2007.
As part of the Semaphore breakwater design review (WRL, 2007) it was estimated that sustainable sand
yields in the lee of the breakwater range from 28,000 to 45,000 m3/year.
Longshore sediment transport rate estimates at West Beach were updated by DHI, 2018, stating rates
from 50,000 to 150,000 m3/year, with an average of 100,000m3/year. The range of sediment transport is
rather large, meaning that in any given year, the longshore transport can be as little as 50,000 m3/year or
as much as 150,000 m3/year, depending on the weather conditions in that year. The DHI report did not
provide detailed varying longshore sediment transport rates for the various beach cells but estimates the
50,000 to 150,000 m3/year range to be valid for “West Beach and further north”.
2.2 2020/21 Harvest Campaign Scenarios
An independent review of data from past harvesting campaigns was undertaken in order to assess the
following 2020/21 Harvesting Campaign scenarios (Table 2-1).
TABLE 2-1 HARVESTING SCENARIOS
Location of Sand Collection Spring 2020 (m3) Autumn 2021 (m3) Totals for
2020-21 (m3)
Scenario 1
Breakwater salient 0 50,000 50,000
(Point Malcolm)
Between Semaphore and Largs Bay Jetties 10,000 10,000 20,000
21030014_R02v01c_Adelaide beaches 201203.docx
North of Largs Bay Jetty 25,000 25,000 50,000
(to Strathfield Terrace)
TOTALS 35,000 85,000 120,000
Scenario 2
Breakwater salient 0 50,000 50,000
(Point Malcolm)
Between Semaphore and Largs Bay Jetties 17,500 17,500 35,000
North of Largs Bay Jetty 17,500 17,500 35,000
(to Strathfield Terrace)
TOTALS 35,000 85,000 120,000
Scenario 3
Department for Environment and Water | 09 December 2020
Impact Assessment of Moving Sand from Adelaide’s Northern Beaches – Phase 1 Assessment: Page 4
2020-2021 Sand MovementLocation of Sand Collection Spring 2020 (m3) Autumn 2021 (m3) Totals for
2020-21 (m3)
Breakwater salient 0 50,000 50,000
(Point Malcolm)
Between Semaphore and Largs Bay Jetties 20,000 0 20,000
North of Largs Bay Jetty 0 50,000 50,000
(to Strathfield Terrace)
TOTALS 20,000 100,000 120,000
2.3 Details of Current Operation
Currently harvesting of the northern beaches from Semaphore breakwater to Largs north is undertaken using
a land plane (scraper). The contractors are instructed to undertake the operations in the following manner:
Sand is to be won as far seawards as daily tides permit.
Sand shall be removed in layers of depth less than 250 millimetres (approximately) in depth over the entire
area designated for collection.
For all excavations, the edge between the natural undisturbed surface and the excavation shall not exceed
aforementioned specified depths and a batter of 1:10, perpendicular to the edge, shall be left at the end
of each day to remove sharp drops in beach levels which are potentially unsafe to the public.
No collection shall occur within 6 metres of the toe of any seawall or sand dune or from lower than low
water mark unless specified otherwise in the Task Specific Specification or with specific written Principal’s
approval.
2.4 Methodology
In order to assess the outlined scenarios for the 2020/21 harvesting campaigns the following tasks were
undertaken:
1. Review of relevant reports as outlined and summarised in section 2.1 of this report.
2. Analysis of previous harvesting campaigns, locations, quantity and timing (chapter Error! Reference
source not found.).
3. Analysis of existing beach profile records from 2010 to 2020. A trial breakwater was constructed at
21030014_R02v01c_Adelaide beaches 201203.docx
Semaphore (Bower Road), consisting of geobags. The breakwater was subsequently replaced with a
permanent rock breakwater in 2008. As such, an analysis of historical data was undertaken from 2010
onwards, to fully account for any impacts from the permanent rock breakwater (chapter 2.6).
4. Analysis of 2016 storm event (chapter 2.6.3).
5. Analysis of DEM surveys that were undertaken for some campaigns (chapter 2.6).
6. Analysis of aerial photography (chapter 2.6).
7. Erosion assessment (chapter 2.7).
Details of each task are outlined throughout the following chapters.
2.5 Previous Sand Harvesting Campaigns
Records of previous sand harvesting campaigns by area and per financial year are presented in Figure 2-2.
Department for Environment and Water | 09 December 2020
Impact Assessment of Moving Sand from Adelaide’s Northern Beaches – Phase 1 Assessment: Page 5
2020-2021 Sand MovementHarvesting quantities by area
120,000
100,000
80,000
60,000
40,000
20,000
-
14/15 15/16 16/17 17/18 18/19 19/20
Sem BW Sem Jetty Betw jetties Largs north
FIGURE 2-2 PAST HARVESTING CAMPAIGNS BY AREA
During past campaigns, most sand was harvested from the breakwater salient (“Sem BW’). Large campaigns
were undertaken in 15/16, 16/17, 18/19 and 19/20. Specifically, the last two campaigns in 18/19 and 19/20 are
rather large campaigns, undertaken in consecutive years.
The area around Semaphore Jetty was mostly harvested in 14/15 and 15/16 with only a very small quantity
taken in 18/19. Sand from in between Semaphore and Largs Jetty as well as north of Largs Jetty was only
harvested during the most recent 19/20 campaign.
2.6 Analysis of Surveys
Two types of survey data were available for further analysis, DEMs and profile surveys.
Digital elevation models (DEM) were available for 2018-2020 in the lee of the Semaphore breakwater and a
before and after DEM was available for north of Largs Jetty for 2020. DEMs are 3-dimensional models that
show the terrain surface. The DEMs were used to create comparison plots of the terrain before and after sand
harvesting campaigns. In addition to the DEMs, profile survey data is available along Adelaide beaches. An
analysis was undertaken on the profiles within the harvest areas, going back to 2010 to include all impacts
from the breakwater, constructed in 2009. Error! Reference source not found. provides an overview of where
the survey profiles (orange lines) are located and their numbering system as well as the extent of the DEMs
21030014_R02v01c_Adelaide beaches 201203.docx
shown with the red outline.
Department for Environment and Water | 09 December 2020
Impact Assessment of Moving Sand from Adelaide’s Northern Beaches – Phase 1 Assessment: Page 6
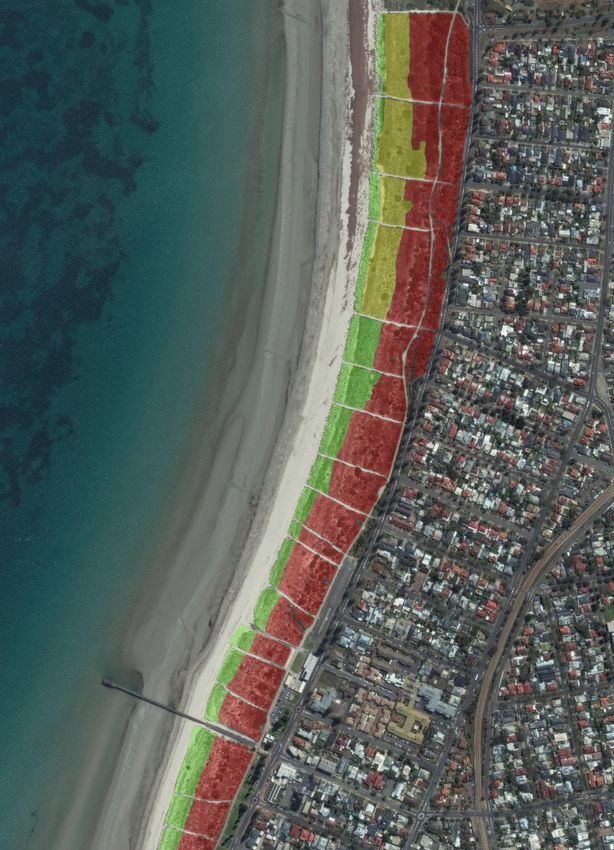
2020-2021 Sand MovementFIGURE 2-3 SURVEY PROFILES ALONG THE HARVEST AREA
The dunes are generally higher and steeper in the south around Semaphore Breakwater and become gentler
sloped and reduce in height towards the north to Largs Bay (Figure 2-4).
21030014_R02v01c_Adelaide beaches 201203.docx
Department for Environment and Water | 09 December 2020
Impact Assessment of Moving Sand from Adelaide’s Northern Beaches – Phase 1 Assessment: Page 7
2020-2021 Sand Movement2020 profile comparison
8
6
4
2
0
0 50 100 150 200 250 300 350 400 450 500
-2
-4
-6
-8
200129A05022020 200008A17022020
FIGURE 2-4 COMPARISON OF BEACH PROFILES SOUTH OF SEMAPHORE BREAKWATER (BLUE LINE) AND
NORTH OF LARGS JETTY (YELLOW LINE)
A detailed analysis of beach profiles was undertaken. Appendix A provides a detailed description of the various
profiles and how they evolved over time with Appendix B providing the actual record of beach profiles from
2010 to 2020. A summary of the findings from the profile survey analysis as well as the DEM analysis is
provided in the following subchapters, split by harvest area.
2.6.1 Semaphore breakwater area
The semaphore breakwater is designed to protect Semaphore Park and to capture sand for beach harvesting.
The breakwater design estimated that a yield of 28,000 to 45,000 m3/year is sustainable with approx. 33,000
m3/year naturally bypassing the breakwater (WRL, 2007). The actual sand volumes in the lee of the breakwater
will vary every year, depending on the storminess of the year and the resulting longshore sediment transport
rates. Bypassed sand will deposit on any of the beaches north of approx. Semaphore Jetty. The breakwater
causes a net loss of sand in the immediate downdrift area of the breakwater due to the breakwater and salient 1
shielding that area.
Comparing the past harvesting campaigns in the lee of the breakwater (Figure 2-5) with the sustainable
harvesting quantities of 28,000 to 45,000 m3/year shows that harvesting campaigns have exceeded the
sustainable quantities. The two campaigns in 15/16 and 16/17 have been preceded and followed by smaller
21030014_R02v01c_Adelaide beaches 201203.docx
campaigns though, resulting in an average of 36,000 m3/year over the 4 years from 14/15 to 17/18. On average
the maximum capacity of 45,000 m3/year has therefore not been exceeded. The last two campaigns however
in 18/19 and 19/20 exceeded the maximum capacity.
1 Salient is the accumulation of sand in the lee of a detached breakwater, causing the beach to be wider in
the lee of the breakwater compared to up and downdrift beaches. Tombolo means that the accumulation of
sand is so big that a sandbar connects the beach to the breakwater.
Department for Environment and Water | 09 December 2020
Impact Assessment of Moving Sand from Adelaide’s Northern Beaches – Phase 1 Assessment: Page 8
2020-2021 Sand MovementFIGURE 2-5 RECORD OF SAND HARVESTING AT SEMAPHORE BREAKWATER
The impact of one harvesting campaign in 2018 is well captured on google earth aerials. Figure 2-6 shows the
aerial captured on the 17/11/2018 displaying localised depressions in the sand from the harvesting campaign.
Figure 2-7 is captured on 23/12/2018, so only one month later and the sand has already been smoothed out
from the longshore sediment transport and tides. While impacts are clearly visible after one campaign, they do
seem to be temporary in nature due to the breakwater fulfilling its purpose and capturing the longshore
sediment transport.
Further analysis of aerial photography showed that a salient has formed most years with the exception of
August 2016 which coincides with a harvesting campaign and no salient forming December 2018 to March
2020 due to the intensive harvesting works occurring at that time. The latest aerial from June 2020 showed
the salient is starting to form again (Figure 2-8).
21030014_R02v01c_Adelaide beaches 201203.docx
Department for Environment and Water | 09 December 2020
Impact Assessment of Moving Sand from Adelaide’s Northern Beaches – Phase 1 Assessment: Page 9
2020-2021 Sand MovementFIGURE 2-6 17/11/2018 FIGURE 2-7 23/12/2018
21030014_R02v01c_Adelaide beaches 201203.docx
FIGURE 2-8 AERIAL FROM 16/07/2020 SHOWING SALIENT
A comparison of the DEM from 10/2018 to 10/2019 is shown in Figure 2-9. The red area represents a lowering
of the beach, with the blue areas representing an increase in beach levels. Over that period 100,000m3 of sand
was harvested from the area. Sand was mostly taken from the salient.
Comparing the 10/2019 and 01/2020 DEMs (Figure 2-10), over which time 70,000 m3 were harvested, clearly
shows that harvesting was mostly undertaken south of the breakwater because there was insufficient sand
availability in the breakwater salient. This is likely caused by the disproportionate harvesting campaign
Department for Environment and Water | 09 December 2020
Impact Assessment of Moving Sand from Adelaide’s Northern Beaches – Phase 1 Assessment: Page 10
2020-2021 Sand Movementundertaken in 18/19 and not allowing sufficient time afterwards for the beach to rebuild. Beach lowering is most
noticeable in the upper beach area next to the dunes south of and directly in the lee of the breakwater.
Figure 2-11 and Figure 2-12 below show the aerials from 10/2019 and 01/2020 and it can be seen that
insufficient sand was available in the lee of the breakwater in the salient. Moving the sand harvest area to
south of the breakwater, exceeding the maximum sustainable harvesting quantity and the coincidence with a
small storm event shortly after the 19/20 harvesting campaign resulted in erosion of the foredune after the Oct-
Dec 2019 campaign.
FIGURE 2-9 DEM COMPARISON 10/2018 TO 10/2019
21030014_R02v01c_Adelaide beaches 201203.docx
Department for Environment and Water | 09 December 2020
Impact Assessment of Moving Sand from Adelaide’s Northern Beaches – Phase 1 Assessment: Page 11
2020-2021 Sand MovementFIGURE 2-10 DEM COMPARISON 10/2019 AND 01/2020
21030014_R02v01c_Adelaide beaches 201203.docx
Department for Environment and Water | 09 December 2020
Impact Assessment of Moving Sand from Adelaide’s Northern Beaches – Phase 1 Assessment: Page 12
2020-2021 Sand MovementFIGURE 2-11 AERIAL FROM 10/2019 FIGURE 2-12 AERIAL FROM 01/2020
Despite the large harvesting campaigns in 18/19 and 19/20, the profile analysis showed that the long-term
trend (2010 to 2020) is beach accretion, which means that the beaches in the lee of and south of the
breakwater are growing. The front of the dunes extended by +10m in the lee of the breakwater (Figure 2-13)
and +8m south of the breakwater. This long-term trend includes the harvesting campaigns that were
undertaken during that time as well as the 2016 storm event, which equates to approx. a 50-year ARI event.
The 2016 storm is further discussed in chapter 2.6.3.
21030014_R02v01c_Adelaide beaches 201203.docx
Department for Environment and Water | 09 December 2020
Impact Assessment of Moving Sand from Adelaide’s Northern Beaches – Phase 1 Assessment: Page 13
2020-2021 Sand MovementFIGURE 2-13 PROFILE COMPARISON 2010 AND 2020 AT SEMAPHORE BREAKWATER
The beach north of the breakwater is receding. This was to be expected due to the downdrift effect of the
breakwater and has been analysed during the design stages of the breakwater. The beach north of the
breakwater (profile 200006) has receded by a total of -27m from 2010 to 2020. The maximum amount of
erosion was -40m, however, beach nourishment campaigns undertaken throughout the years reduced that to
a total of -27m over the 10 years.
Erosion due to the breakwater should ideally be limited to south of Semaphore Jetty. However, analysis of the
Semaphore Jetty profile provided the following insights:
Accretion of +14m from 2010 to 2016;
Erosion of -7m from 2016 to 2020. This change in trend from accretion to erosion has started around the
same time of the 2016 storm event. The 2016 storm had similar impacts on most beaches, however most
other beaches recovered quickly and started accreting, exceeding the 2016 pre-storm profile again in
2017 or 2018 (depending on exact location). This profile however continued to erode. It is suspected that
the large harvesting campaigns in 18/19 and 19/20, which exceeded the recommended maximum
sustainable harvesting quantity of 45,000m3, caused the net deficit of sand availability at that location.
While the net impact is +7m beach accretion at that profile, the beach is experiencing ongoing erosion
since 2016. Further erosion can be expected until such time that a new equilibrium is reached and the
21030014_R02v01c_Adelaide beaches 201203.docx
salient in the lee of the breakwater had time to recover.
Any future campaigns at the breakwater should therefore not exceed the amount of sand that has
accumulated within the breakwater salient during that year (expected range to be within 28,000 to 45,000
m3/year), provided that sufficient time has passed for the area to fill up again after the 18/19 to 19/20
campaigns.
The net dune accretion/recession rates from 2010 to 2020 are summarised in Figure 2-14. During the profile
analysis it became evident that it is difficult to determine the ‘toe of dune’ in the field. Based on the data from
the last 10 years the toe of dune has been generally assessed as being further towards the ocean. As a result,
collection has occurred further away from the toe of dune than the currently nominated 6m offset. Harvesting
works were therefore focused on the intertidal areas, causing the dunes to grow further despite harvesting
being undertaken.
Department for Environment and Water | 09 December 2020
Impact Assessment of Moving Sand from Adelaide’s Northern Beaches – Phase 1 Assessment: Page 14
2020-2021 Sand MovementFIGURE 2-14 NET ACCRETION/RECESSION RATES AROUND SEMAPHORE BREAKWATER
Conclusion
The following conclusions can be drawn for the Semaphore breakwater area:
Large quantities harvested at Semaphore breakwater in 2018/19 and 19/20 exceeded natural
replenishment rates.
It is likely that the intense harvesting at Semaphore breakwater caused the ongoing erosion trend since
2016 at Semaphore Jetty. In other words, if no or reduced harvesting would have occurred at Semaphore
Breakwater in 18/19 and 19/20 (equal or less than natural rate of replenishment) it is possible that the
profile would be in a state of accretion rather than ongoing erosion.
Future harvesting campaigns at the breakwater should therefore be reduced to be no more than the
natural rate of replenishment to limit further downdrift impacts.
2.6.2 North of Largs Jetty
The area north of Largs Jetty has only been harvested in 2019/20, but not in previous years. A before and after
DEM is available from that campaign. A comparison plot is shown in Figure 2-15 with the red areas showing
21030014_R02v01c_Adelaide beaches 201203.docx
lowering of the beach and blue areas an increase in beach levels. It can be seen that more sand was harvested
from the area closer to the jetty, it is understood that this was due to beach wrack on the beach in the northern
section at the time of harvesting. Sand was mostly taken from the upper beach area with less sand taken from
the lower intertidal area. It can also be seen that sand harvesting activities were undertaken in strips.
Department for Environment and Water | 09 December 2020
Impact Assessment of Moving Sand from Adelaide’s Northern Beaches – Phase 1 Assessment: Page 15
2020-2021 Sand MovementFIGURE 2-15 COMPARISON PLOT OF BEACH LEVELS BEFORE AND AFTER BEACH HARVESTING (APRIL –
JUNE 2020)
The profile analysis showed that all beaches are in a state of accretion, with accretion rates of the dunes
increasing towards the north. This is in line with the reduced sediment transport rates that are experienced in
that area, with the longshore sediment transport reducing to nil at North Haven as shown in CES, 2007. In
total, from 2010 to 2020, dunes grew by +9m in between the jetties and by +30 and +35m north of Largs Jetty
(Figure 2-16).
The profile at Largs Jetty (200003) has been excluded from the analysis because the profile sits immediately
adjacent to the Jetty and has been influenced by beach access clearing activities (removal of sand within the
21030014_R02v01c_Adelaide beaches 201203.docx
area under and each side of the jetty). It is therefore not representative of natural processes.
Department for Environment and Water | 09 December 2020
Impact Assessment of Moving Sand from Adelaide’s Northern Beaches – Phase 1 Assessment: Page 16
2020-2021 Sand MovementFIGURE 2-16 DUNE ACCRETION NORTH OF SEMAPHORE JETTY
Conclusion
The following conclusions can be drawn for the area north of Largs Jetty:
Beaches are accreting north of Semaphore Jetty.
Sand harvesting of those areas is therefore possible with minimal impact on the dunes.
2.6.3 2016 storm event
Generally, profile surveys are undertaken once a year. This means that short term impacts and formation of
erosion scarps from small events are not detectable in the analysis. In 2016 two surveys were undertaken due
to the severe storm event that occurred that year. It is estimated that the 2016 storm approximates to a 50-
year ARI storm event which has a 2% chance of occurring in any given year. The two surveys enable the
analysis of the impacts of the storm on the beaches.
The analysis showed that the beaches from south of Semaphore breakwater to Largs Jetty experienced dune
21030014_R02v01c_Adelaide beaches 201203.docx
erosion in 2016. Beaches generally started to accrete again in 2017 and exceeded their pre-2016 storm profile
in 2018. One exception is the area just north of the breakwater which is impacted by downdrift effects from the
breakwater and has been discussed in more detail in chapter 2.6.1.
The beaches north of Largs Jetty did not experience any dune erosion from the 2016 storm event, only some
minimal erosion on the beach itself in the intertidal area. This resulted in those northern dunes continuing to
accrete sand, despite the significant storm event. It can therefore be anticipated that impacts from sand
harvesting activities are less north of Largs Jetty compared to the area south of the jetty due to the reduction
in longshore sediment transport resulting in increased sediment deposition. This results in those northern
beaches recovering more quickly than the southern beaches around Semaphore.
Department for Environment and Water | 09 December 2020
Impact Assessment of Moving Sand from Adelaide’s Northern Beaches – Phase 1 Assessment: Page 17
2020-2021 Sand Movement2.6.4 Summary
A summary of the dune accretion and recession from 2010 to 2020 is provided in Table 2-2. Most dunes are
growing, and sand harvesting is therefore possible with minimal impact on the dunes. However, no sand
harvesting activities should be undertaken in between Semaphore Breakwater and Semaphore Jetty. Instead
ongoing beach nourishment will be required north of the breakwater.
Sand harvesting activities should not exceed the natural rate of replenishment to avoid direct impacts on the
beach and also indirect downdrift impacts on other beaches.
TABLE 2-2 SUMMARY OF ACCRETION AND EROSION
Profile Description Average 2010 to 2020 Comment
dune growth (+) or
recession (-) [front face]
in m
200008 South of +8 Dune grew in height and overall thickness
Semaphore landwards and seawards.
breakwater
200007 Semaphore +13 Lower front dune established in front of
breakwater existing dune.
200006 North of -27 (2020) Dune recession due to breakwater downdrift
Semaphore -40 (2017/18/19) effects. Beach nourishment campaign
breakwater undertaken in 19/20. Largest amount of
recession was experienced in 2017/18/19.
200005 Semaphore Jetty +14 (2010-2016) Dune grew in height 0.8m.
-7 (2016-2020) Dune accretions 2010 to 2016 followed by
+7 (2010-2020) TOTAL dune recession 2016 to 2020. In total there is
dune accretion, however, the existing trend is
recession.
200004 In between +9 Dune grew in height 1.2m.
Semaphore and
Largs jetty
200003 Largs Jetty N/A Profile excluded due to anthropogenic impacts.
21030014_R02v01c_Adelaide beaches 201203.docx
200129 Approx. 700m +30 Steady growth, new foredune forming
north of Largs
Jetty
200002 Approx. 1.5km +35 Steady growth, new foredune forming
north of Largs
Jetty
2.7 Erosion Assessment
In order to assess erosion impacts on the beach before and after sand harvesting activities an erosion
assessment was undertaken. This is done by exposing the beach profile to a storm event. A 1-year and 10-
year ARI event were selected. The impact of the harvesting works was assessed by analysing storm impacts
on the pre-harvested beach profile and the post-harvested beach profile. The following data was used in the
analysis:
Department for Environment and Water | 09 December 2020
Impact Assessment of Moving Sand from Adelaide’s Northern Beaches – Phase 1 Assessment: Page 18
2020-2021 Sand Movement2.7.1 Sediment size
Sand grain analysis has been undertaken in the past and the median grain size (D50) from the Semaphore
Breakwater to Largs Jetty ranges from 0.2 to 0.22mm (“Semaphore Sand Suitability Investigation – Summary”).
Further north, towards North Haven, the sediment characteristics change to a slightly finer sand and the sand
is therefore less suitable to be used for sand back passing as larger quantities of sand would be required to
achieve the same level of protection that the coarser sand can provide. The sand grain analysis showed that
6m3 of sand would be required from North Haven to provide the same level of protection as 1m3 of sand from
Semaphore breakwater due to the varying grain size. A D50 of 0.2mm has therefore been adopted in the
analysis.
2.7.2 Water levels
When considering coastal processes, it is necessary to consider water levels that prevail on site on a daily
basis such as astronomical tides and extreme water levels that can be experienced during storm events, so
called storm tides.
Astronomical tides are the ‘normal’ rising and falling of the ocean water levels in response to gravitational
forces from astronomical bodies, mainly the sun and moon. The effects are predictable and can therefore be
forecast with confidence. Table 2-3 outlines the tidal levels at Adelaide Outer Harbour (2020 Tide Tables,
DPTI).
TABLE 2-3 TIDAL PLANES AT ADELAIDE OUTER HARBOUR
mLAT mAHD
Highest Astronomical Tide (HAT) 2.91 1.46
Mean High Water Springs (MHWS) 2.41 0.96
Mean Sea Level (MSL/MHWN) 1.39 -0.06
Australian Height Datum (AHD) 1.45 0
Lowest Astronomical Tide (LAT) 0.08 -1.37
A storm tide is the combined action of the astronomical tide and the storm event as presented in Figure 2-17.
During a storm event surface winds push the water against the shoreline and changes in atmospheric pressure
result in a rise of water levels. This rise in water levels is called the storm surge. The strong winds during a
storm event also result in the generation of waves. As the waves approach shallow nearshore water they start
to break. The dissipation of wave energy during the wave breaking process induces a localised increase in the
21030014_R02v01c_Adelaide beaches 201203.docx
ocean water level shoreward of the breaking point which is called wave setup. Wave setup can be experienced
for a sustained time and therefore should be considered in the total storm tide component.
Wave runup is typically not included in the total storm tide component because it is very dependent on local
foreshore type and characteristics. Wave runup is the vertical height above the local water level up to which
incoming waves will rush when they encounter the land/sea interface.
Department for Environment and Water | 09 December 2020
Impact Assessment of Moving Sand from Adelaide’s Northern Beaches – Phase 1 Assessment: Page 19
2020-2021 Sand MovementCOASTLINE
INCOMING WAVES
BROKEN WAVES WAVES ARE BREAKING
WAVE RUNUP
WAVE SETUP
STORM SURGE
TIDE ASTRONOMICAL TIDE
LOW WATER
DATUM
Storm Tide = Astronomical Tide + Storm Surge + Breaking Wave Setup
FIGURE 2-17 COMPONENTS OF A STORM TIDE EVENT
Several previous studies asses the storm tide levels at the Adelaide Beaches and are outlined in the design
report for the Semaphore Breakwater (WRL, 2001). The same storm tide levels are adopted in this study and
are outlined in Table 2-4. It must be noted that the presented water levels have been derived from a joint
probability analysis that considers the joint occurrence of extreme waves and water levels.
TABLE 2-4 STORM TIDE LEVELS FOR ADELAIDE
ARI event Water level in mAHD
1 year 1.5
5 year 1.95
10 year 2.05
20 year 2.15
50 year 2.30
100 year 2.35
2.7.3 Waves
The wave heights at the project site are also adopted as per WRL, 2001 and are listed in Table 2-5 below.
TABLE 2-5 WAVE HEIGHTS
21030014_R02v01c_Adelaide beaches 201203.docx
ARI event offshore Hs offshore H10% Corresponding water level in mAHD
1 year 2.1 2.7 1.5
5 year 2.4 3.0 1.95
10 year 2.7 3.4 2.05
20 year 2.9 3.7 2.15
50 year 3.1 3.9 2.3
100 year 3.4 4.3 2.35
Department for Environment and Water | 09 December 2020
Impact Assessment of Moving Sand from Adelaide’s Northern Beaches – Phase 1 Assessment: Page 20
2020-2021 Sand Movement2.7.4 Results
An example of the results is shown in Figure 2-18. The initial beach profile is shown in solid yellow. The 1-year
storm event results in erosion of the dune front of 5m (green solid line). Exposing the beach to the same storm
event but applying the harvested beach profile (yellow dashed line) results in an additional 3m of erosion
(green dashed line).
FIGURE 2-18 EROSION IMPACT ON PRE AND POST HARVESTED BEACH PROFILE
Two profiles were tested, one south of the breakwater (the area in the lee of the breakwater will not be impacted
by erosion due to the protection of the breakwater) and north of Largs Jetty. The actual harvested profiles were
used from the last 19/20 campaign. Additionally, artificial post-harvest profiles were investigated to assess the
impacts from harvesting depth and distance to toe of dune. The results of the analysis are provided in Table 2-
6.
TABLE 2-6 EROSION INCREASE DUE TO HARVESTING WORKS
Storm event ARI Recession of dune Recession of dune Erosion increase due
front before harvesting front after harvesting to harvesting works
(m) (m) (m)
South of Semaphore jetty
21030014_R02v01c_Adelaide beaches 201203.docx
1 5 7 2
10 11 14 3
North of Largs Jetty
1 0 0 0
10 0 5 5
Periodic erosion of the dunes will be experienced regardless of sand harvesting works for the beaches from
south of Semaphore breakwater to Largs Jetty. This means that erosion scarps are likely to be experienced
regardless of sand harvesting works as it is natural for sandy beaches to respond that way to storms. While
dune scarps are natural, to be expected and not critical, they can generate a nuisance to beach goers and can
Department for Environment and Water | 09 December 2020
Impact Assessment of Moving Sand from Adelaide’s Northern Beaches – Phase 1 Assessment: Page 21
2020-2021 Sand Movementgenerate a negative perception amongst the local community regarding the impact of the works. Should that
be the case, active management of occurring erosion scarps by means of smoothing them out can be
considered, however, this also comes at an additional cost and should only be considered for significant
erosion scarps that can pose a public safety risk (e.g. scarps larger than 1 m drop).
The dunes north of Largs Jetty are not affected by erosion, with only the lower beach experiencing minor
erosion in the intertidal area. This is also consistent with the analysis of the 2016 storm, where the dunes north
of Largs Jetty were not impacted by erosion. Larger events (e.g. 100-year ARI event) however will cause
erosion of the foredune due to the higher water levels experienced in a more significant storm event. The
higher water levels cause waves to directly impact on the dunes, resulting in erosion. However, the existing
erosion buffer is ample and only the foredune will be affected in a significant event.
The amount of erosion of the dune front increases after harvesting was undertaken, with up to 3m of additional
erosion experienced south of Semaphore breakwater and up to 5m north of Largs Jetty in a 10-year ARI event.
Experiencing increased erosion on the post-harvested beach profile is to be expected. It is important to note
however, that impacts will vary with time, with the maximum impacts as outlined in Table 2-6 to be experienced
directly after harvesting was undertaken. Impacts can be expected to be reduced after a few months due to
the longshore sediment transport re-filling the beaches.
The remaining dune buffers in all locations (except north of Semaphore breakwater) are substantial and the
dunes can easily accommodate the additional erosion should a storm occur shortly after sand harvesting. No
infrastructure is at risk from a 100-year storm event, neither on the pre-harvest nor the post-harvest profile.
Conclusion
The amount of additional erosion on the ‘harvested’ profile is relatively small, especially in comparison to
the beach accretion rates.
The additional erosion will only be experienced if a storm event occurs shortly after the harvesting
campaign. If the storm occurs a few months after the campaign the beach would have already had time
to re-fill.
Erosion after a storm event is generally a short-term impact. In the long-term beaches will start growing
again after a few months.
The exact amount and location of erosion is highly dependent on water levels during the storm and the
existing height, shape, and slope of the dune.
2.8 Summary
21030014_R02v01c_Adelaide beaches 201203.docx
An analysis of past harvesting campaigns and an erosion assessment was undertaken to provide an
independent assessment of sand harvesting works on the northern beaches from Semaphore to Largs North.
The analysis is focused on long-term impacts rather than short-term impacts that can affect the beaches at
any time regardless of the sand harvesting works. In other words, the development of erosion scarps can occur
at any time if harvesting is undertaken or not as this is the natural response of the beach to storms.
In summary:
Most northern beaches are accreting, and sand harvesting is therefore possible with minimal impact on
the dunes.
Erosion is experienced just north of the breakwater which will need to be managed actively. This requires
ongoing beach nourishment rather than sand harvesting.
All other beaches will continue to grow despite short term storm impacts and harvesting works.
Department for Environment and Water | 09 December 2020
Impact Assessment of Moving Sand from Adelaide’s Northern Beaches – Phase 1 Assessment: Page 22
2020-2021 Sand Movement Semaphore breakwater has been intensely harvested in 18/19 and 19/20, resulting in increased extent of
downstream erosion at Semaphore Jetty.
Amount of additional storm erosion on the ‘harvested’ beach profiles is relatively small, especially in
comparison to the beach accretion rates, and recovery is expected to occur quickly due to the overall
accretion trend.
From a coastal engineering perspective, sand harvesting therefore has very limited impacts on the harvest
area in terms of impacts on the dune/available erosion buffer. Sufficient dune erosion buffers exist with
no infrastructure at risk from a significant storm event on the pre- or post-profile.
2.9 Recommendations
Based on the analysis the following recommendations can be made:
Future 2020/21 sand harvesting campaigns at Semaphore breakwater should be no more than the natural
rate of replenishment (e.g. harvesting should be focused on the salient. If no salient has formed sand
harvesting should be avoided or heavily limited in quantity). No spring 2020 campaign should be
undertaken at the breakwater to allow sufficient time for the salient to re-built. A maximum of 40,000m3
should be harvested in autumn 2021 to limit further downdrift effects, even if more sand is available in the
salient (Table 2-7). A pre-works survey shall confirm exact quantities available at that point in time (it is
possible that less than 40,000m3 will be available).
Beach conditions shall always be assessed prior to each campaign to ensure that sufficient volumes are
available. In other words, if there was a stormy season, harvesting depth shall be reduced further than
what is recommended in the following slides.
Harvesting operations should be optimised to achieve the following profile for South of Semaphore
Breakwater and in between Jetties (Figure 2-19):
Min distance of 5m offset from toe of dune recommended (some short-term impacts will be observed,
however, due to the natural replenishment and existing dune buffer and growth rate, this is considered
acceptable);
Increase of ‘transition slope’ from 1:10 to 1:20;
Harvesting depth shall be kept above MLWS;
Harvesting depth shall not exceed 0.5m;
Natural beach features such as ~MSL berm shall be maintained; and
Majority of sand harvesting to be undertaken in the intertidal area.
21030014_R02v01c_Adelaide beaches 201203.docx
For the area north of Largs Jetty the same recommendations apply, with the exception that harvesting
depth shall not exceed 0.6m.
Department for Environment and Water | 09 December 2020
Impact Assessment of Moving Sand from Adelaide’s Northern Beaches – Phase 1 Assessment: Page 23
2020-2021 Sand MovementFIGURE 2-19 RECOMMENDED HARVESTING SPECIFICATIONS
Working towards the recommended harvested beach profile would result in a maximum quantity of about
60,000 m3 that can potentially be harvested from the area in between Semaphore and Largs Jetty and a
maximum of 85,000 m3 from North of Largs Jetty in 2020/21. However, lesser quantities shall be
envisaged to minimise adverse impacts on beach usability during and after a campaign. Therefore the
suggested quantities of the three scenarios of maximum 35,000 m3 and 50,000 m3 for the area in between
Semaphore and Largs Jetty and North of Largs Jetty respectively are acceptable (Table 2-7).
While generally all 3 scenarios are acceptable with the outlined optimisations, Scenario 3 is the least
desirable. This is because the scenario 3 campaigns are focused on one time of the year rather than
spread out over two campaigns over the year. Harvesting large quantities at one time will result in
increased impacts such as the development of erosion scarps. Scenario 1 and 2 are therefore preferred.
21030014_R02v01c_Adelaide beaches 201203.docx
Department for Environment and Water | 09 December 2020
Impact Assessment of Moving Sand from Adelaide’s Northern Beaches – Phase 1 Assessment: Page 24
2020-2021 Sand MovementTABLE 2-7 REVISED SCENARIOS FOR 2020/21 CAMPAIGN OPTIONS
Location of Sand Collection Spring 2020 (m3) Autumn 2021 (m3) Totals for Recommended revised
2020-21 (m3) quantities
Scenario 1 - recommended
Breakwater salient 0 50,000 50,000 Max 40,000m3 in
(Point Malcolm) 40,000 40,000 autumn 2021. Possibly
less if that quantity is
not available within the
salient.
Between Semaphore and Largs Bay Jetties 10,000 10,000 20,000 Acceptable. Should an
20,000 30,000 additional 10,000 m3 be
required that cannot be
harvested from the
breakwater area they
should be harvested
from this area.
21030014_R02v01c_Adelaide beaches 201203.docx
North of Largs Bay Jetty 25,000 25,000 50,000 Acceptable.
(to Strathfield Terrace)
TOTALS 35,000 85,000 120,000
45,000 75,000
Scenario 2 - recommended
Breakwater salient 0 50,000 50,000 Max 40,000m3 in
(Point Malcolm) 40,000 40,000 autumn 2021. Possibly
less if that quantity is
not available within the
salient.
Between Semaphore and Largs Bay Jetties 17,500 17,500 35,000 Acceptable.
Department for Environment and Water | 09 December 2020
Impact Assessment of Moving Sand from Adelaide’s Northern Beaches – Phase 1 Assessment: 2020-2021 Sand Movement Page 25You can also read