Regolith behavior under asteroid-level gravity conditions: low-velocity impact experiments
←
→
Page content transcription
If your browser does not render page correctly, please read the page content below
Regolith behavior under asteroid-level gravity conditions: low-velocity impact
                                                                                        experiments

                                                        Julie Brisseta , Joshua E. Colwella , Adrienne Dovea , Sumayya Abukhalila , Christopher Coxa , Nadia Mohammeda
                                                                          a Center   of Microgravity Research, University of Central Florida, 4111 Libra Drive, Orlando FL-32816

                                              Abstract
                                                  The dusty regolith covering the surfaces of asteroids and planetary satellites differs in size, shape, and composition from ter-
                                              restrial soil particles and is subject to environmental conditions very different from those found on Earth. This regolith evolves
arXiv:1810.01459v1 [astro-ph.EP] 2 Oct 2018

                                              in a low ambient pressure and low-gravity environment. Its response to low-velocity impacts, such as those that may accompany
                                              human and robotic exploration activities, may be completely different than what is encountered on Earth. Experimental studies
                                              of the response of planetary regolith in the relevant environmental conditions are thus necessary to facilitate future Solar System
                                              exploration activities.
                                                  We combined the results and provided new data analysis elements for a series of impact experiments into simulated planetary
                                              regolith in low-gravity conditions using two experimental setups and a range of microgravity platforms. The Physics of Regolith
                                              Impacts in Microgravity Experiment (PRIME) flew on several parabolic aircraft flights, enabling the recording of impacts into
                                              granular materials at speeds of ∼4-230 cm/s. The COLLisions Into Dust Experiment (COLLIDE) is conceptually close to the
                                              PRIME setup. It flew on the Space Shuttle in 1998 and 2001 and more recently on the Blue Origin New Shepard rocket, recording
                                              impacts into simulated regolith at speeds between 1 and 120 cm/s.
                                                  Results of these experimental campaigns found that there is a significant change in the regolith behavior with the gravity
                                              environment. In a 10−2 g environment (with g being the gravity acceleration at the surface of the Earth), only embedding of the
                                              impactor was observed and ejecta production was produced for most impacts at > 20 cm/s. Once at microgravity levels (< 10−4 g),
                                              the lowest impact energies also produced impactor rebound. In these microgravity conditions, ejecta started to be produced for
                                              impacts at > 10 cm/s. The measured ejecta speeds were somewhat lower than the ones measured at reduced-gravity levels, but the
                                              ejected masses were higher. In general, the mean ejecta velocity shows a power-law dependence on the impact energy with an index
                                              of ∼0.5. When projectile rebound occured, we observed that its coefficients of restitution on the bed of regolith simulant decrease
                                              by a factor of 10 with increasing impact speeds from ∼5 cm/s up to 100 cm/s. We could also observe an increased cohesion between
                                              the JSC-1 grains compared to the quartz sand targets.
                                              Keywords: regolith, asteroid surfaces, low-gravity environments - methods: microgravity experiments, drop tower - planets and
                                              satellites: surfaces

                                              1. Introduction                                                                         Currently, two missions are en-route to asteroids: Hayabusa-
                                                                                                                                 2 carrying the MASCOT lander (Tsuda et al., 2013, Jaumann
                                                  Small airless bodies of the Solar System are known to be                       et al., 2016), due to arrive at Ryugu in 2018, and the OSIRIS-
                                              covered in a layer of regolith, composed of grains of varying                      REx mission arriving at Bennu in 2018, planning to sample
                                              sizes. Created by the bombardment of micrometeoroids or ther-                      its surface using a Touch-And-Go mechanism (Lauretta et al.,
                                              mal disintegration, micron-sized and larger dust particles col-                    2017). In addition, the increased interest in In-Situ Resource
                                              lect on the surfaces of asteroids, comets, and moons (Housen                       Utilization (ISRU) and mining prospects will soon lead to more
                                              et al., 1979, Housen and Wilkening, 1982). Any space mis-                          reconnaissance and pathfinder missions to small bodies of the
                                              sion probing or landing on the surfaces of these small bodies                      Solar System. Understanding interactions with surface regolith
                                              has to interact with this regolith, at the very low surface gravity                at very low gravity levels has therefore become an imperative.
                                              levels induced by the body’s small mass. The first soft landings                   Impacts at a few m/s down to a few cm/s into regolith layers are
                                              on such small bodies were performed by the NEAR-Shoemaker                          of particular interest to these current and future missions.
                                              spacecraft on the asteroid Eros (Veverka et al., 2001), Hayabusa                        Motivated by these upcoming missions, theoretical and nu-
                                              on Itokawa (Kawaguchi et al., 2008), and Philae on the comet                       merical work has recently been performed in order to investi-
                                              67P/Churyumov-Gerasimenko (Biele et al., 2015). In the latter                      gate the behavior of granular material at the surface of small
                                              instances, the landing resulted in an unexpected response of the                   asteroids, such as Ryugu and Bennu (Scheeres et al., 2010,
                                              surface to the low-velocity impact of the lander, in particular the                Sanchez and Scheeres, 2014, Hirabayashi et al., 2015, Thuil-
                                              remarkable recurrent bouncing of Philae on the comet’s surface                     let et al., 2017). In particular, the response of a layer of regolith
                                              after a first touch-down at around 1 m/s.                                          to a low-velocity impact is investigated in e.g. Maurel et al.
                                              Preprint submitted to Progress in Earth and Planetary Science                                                                            October 4, 2018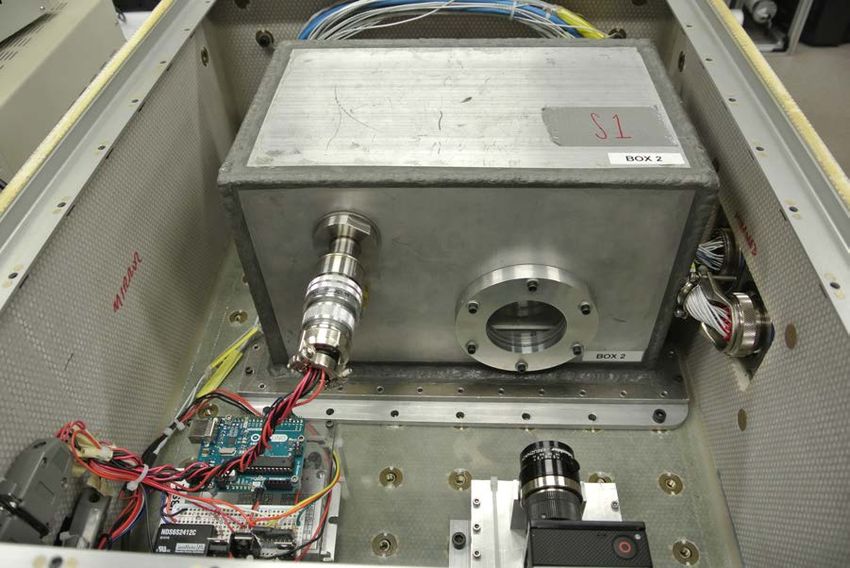
(2017) for MASCOT and Sánchez et al. (2013). Experimental                   This is the undertaking of the present paper. We combine
work supporting these efforts are scarce and often performed             the data sets of all the COLLIDE and PRIME campaigns and
under conditions very different from what can be expected dur-           show the collision outcomes, coefficients of restitution, ejecta
ing a landing/contact at the surface of small bodies (1g, hyper-         speeds, and estimated mass in dependance of the impact veloc-
velocity impacts). For example, the experiment campaign per-             ity and environmental g-level. Section 2 describes the PRIME
formed by Housen and Holsapple (2003) to investigate crater              and COLLIDE hardware setups and data collected. Section 3
formation in porous materials studied impacts at >2 km/s (see            describes the data analysis and results, which we then discuss
Holsapple et al., 2002, Housen and Holsapple, 2011, for a re-            in Section 4.
view of other high-speed impact experiments in porous mate-
rials). In order to investigate the relative influence of gravity
                                                                         2. Experimental setups
on the impact cratering and ejecta production processes in very
large impact events, Housen et al. (1999) perfomed high-speed                The data results presented here were collected over almost
impacts into porous materials in a centrifuge at gravity levels          two decades during microgravity experimental campaigns on a
up to 500g. While thse experiments at high impact velocities             variety of flight platforms. The hardware used to collect data
are relevant for meteorite and inter-asteroid impacts, the veloc-        can be divided into two families: (1) the COLLIDE experiment
ity ranges are not applicable to the landing or sample collection        series, which flew on the Space Shuttle and a suborbital rocket,
on a surface in low gravity.                                             and (2) the PRIME experiment series, which flew on parabolic
     Theoretical and experimental studies that are more relevant         aircrafts.
to an asteroid landing situation are found in the study of im-
pactor deceleration in a granular medium: the Katsuragi and              2.1. COLLIDE
Durian (2007, 2013) and Katsuragi and Blum (2017) series stud-
                                                                         Flight campaigns. The first two COLLIDE flight campaigns
ies the drag force exerted by a granular material on a penetrating
                                                                         were performed in 1998 and 2001, on-board the Space Trans-
impactor; Clark et al. (2012) and Clark and Behringer (2013)
                                                                         portation System (Space Shuttle) STS-90 and STS-108 mis-
study the impactor stopping time and the energy transfer from
                                                                         sions, respectively (COLLIDE-1 and -2). The experiment hard-
the impactor to the granular material at the grain level in quasi-
                                                                         ware and performance were described in Colwell and Taylor
2D setups; Seguin et al. (2008) studies the influence of con-
                                                                         (1999), Colwell (2003). During these flights, a total of 9 im-
tainer walls on the impactor penetration depth; and Machii et al.
                                                                         pacts into regolith simulant were recorded.
(2013) measures the influence of the target strength on the im-
                                                                             More recently, in April 2016, a modified setup was flown
pact outcome. All these experiments were performed at impact
                                                                         on Blue Origin’s New Shepard suborbital rocket (COLLIDE-3).
speeds ranging from a few 10 cm/s to a few m/s, and provide
                                                                         Parts of the Space Shuttle COLLIDE hardware were repurposed
therefore relevant data for the exploration of asteroid surfaces.
                                                                         for this new campaign, and a total of 4 impactor boxes were ac-
However, their experiments were performed in 1g, and the ap-
                                                                         commodated into the crew capsule of New Shepard. Three of
plication of their findings to small body surfaces, which can
                                                                         these boxes were similar to the Space Shuttle hardware, launch-
have gravity levels < 10−5 g, remains unexplored.
                                                                         ing one projectile into a bed of regolith simulant. The fourth
     The study of low-velocity impacts into granular material in
                                                                         box was outfitted with a multi-launcher instead of the single
reduced gravity was started in 1998 with the Shuttle experi-
                                                                         launcher configuration, now allowing for three impactors to be
ment COLLisions Into Dust Experiment (COLLIDE) (Colwell
                                                                         sequentially launched onto the bed of regolith simulant during
and Taylor, 1999, Colwell, 2003). Following experiments were
                                                                         the same experiment run.
performed during parabolic flight campaigns in 2002 and 2003,
using the Physics of Regolith Impacts in Microgravity Exper-             Hardware. For COLLIDE-3, four individual Impactor Box Sys-
iment (PRIME) hardware setup (Colwell et al., 2008). More                tems (IBSs) of COLLIDE-2 were modified for flight on subor-
recent data collection was obtained with these two experiments           bital launch vehicles. We manufactured a vacuum chamber for
during the PRIME-3 (Colwell et al., 2016) and COLLIDE-3                  each IBS in order to perform the impacts under vacuum con-
campaigns, on the NASA C-9 aircraft in 2014 and Blue Ori-                ditions, because the New Shepard crew capsule stays at atmo-
gin’s New Shepard suborbital rocket in 2016, respectively. Both          spheric pressure during the flight. Each vacuum chamber was
these experiment setups generate impacts of ∼cm-sized spheri-            oufitted with a viewport allowing for a camera outside of the
cal projectiles onto beds of granular material at speeds of 1-230        chamber to record the impact. The IBS electronics were re-
cm/s and gravity levels ranging from reduced gravity (∼ 10−2 g)          wired and connected to custom electronics outside the chamber
to microgravity (< 10−4 g). The target materials used were               via an electrical feed-through. Both the chamber and IBS can
quartz sand, JSC-1 Lunar and JSC Mars-1 simulants, sieved                be seen in Figure 1.
at particle size < 250µm. While the results of each of these ex-             The camera system was entirely re-designed for the COLLIDE-
periment campaigns has been published separately (except for             3 campaign. While COLLIDE-1 and -2 used camcorders record-
the most recent COLLIDE-3 campaign), the collected data set              ing on digital video tapes, the new design used a GoPro Hero
has now reached a size of ∼130 data points and presents the op-          3+ black edition recording data files on a microSD card. Both
portunity for a new and combined analysis, with the perspective          configurations required the retrieval of the tapes/memory card
of applying these experimental results to interactions with the          after the experiment run.
regolith-covered surfaces of small Solar System bodies.
                                                                     2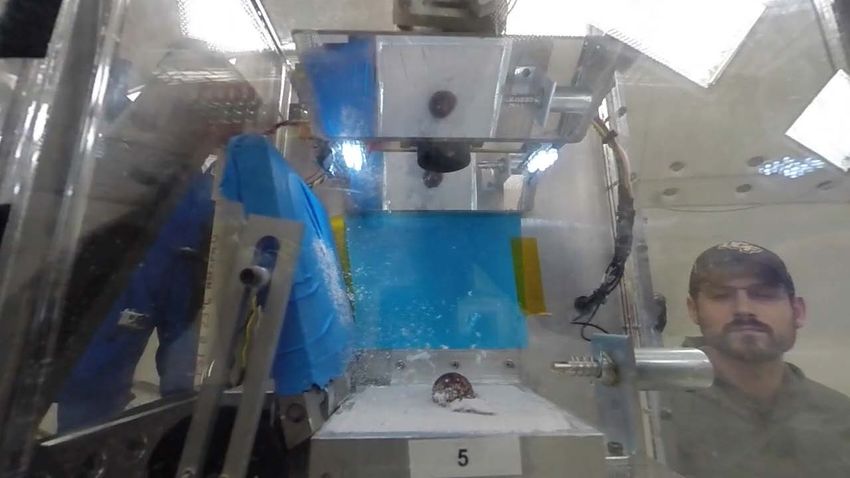
Table 1: Projectiles and target materials of the three COLLIDE and the PRIME-3 campaigns. R = rebound with no ejecta; E = ejecta production, A = asteroid-level
parabola (0.05g), X = no data available (regolith pillar). N/A indicates that no rebound from the projectile on the target could be observed. The table of the 108
PRIME-1 campaign impacts can be found in Colwell et al. (2008). No coefficients of restitution could be measured for the PRIME-1 impacts.

                                                                Projectile                                                            Coefficient
               COLLIDE                         Diameter       Mass Material            Speed         Target                               of
               Campaign              IBS         [cm]          [g]                     [cm/s]        Material          Outcome        Restitution
                  1                   1          0.96         0.99     Teflon           14.80         JSC-1               R             0.028
                  1                   4          0.96         0.99     Teflon           17.10         JSC-1               R             0.022
                  1                   6          0.96         0.99     Teflon           90.00         JSC-1               R              0.03
                  2                   1          2.00         10.71    Quartz          110.00      Quartz Sand            E              0.01
                  2                   2          2.00         9.64     Quartz            3.60      Quartz Sand            E              N/A
                  2                   3          2.00         10.29    Quartz            1.29      Quartz Sand            E              N/A
                  2                   4          2.00         8.66     Quartz           81.00      Quartz Sand            E             0.015
                  2                   5          2.00         8.98     Quartz           12.20         JSC-1               E              N/A
                  2                   6          2.00         10.62    Quartz           28.00      Quartz Sand            E              0.02
                  3                   2          2.05         10.55    Quartz            26.5      Quartz Sand            R           9.3×10⁻³
                  3                   3          2.05         10.55    Quartz            29.3      JSC Mars-1             E              N/A
             PRIME-3 Flight          Box
                  1                   1           2.05        9.82        Quartz        48.45      Quartz Sand             E              N/A
                  1                   3           2.05        11.76       Quartz        49.72      Quartz Sand             E              N/A
                  1                   4           2.05        30.75       Brass         43.19      Quartz Sand             A              N/A
                  1                   5           2.05         9.9        Quartz        43.75      Quartz Sand             E              N/A
                  1                   6           2.05        28.2        Brass         19.87      Quartz Sand             X              N/A
                  1                   7           2.05        9.82        Quartz        33.32        JSC-1                 R             0.078
                  1                   8           2.05        28.2        Brass         19.56        JSC-1                 X              N/A
                  2                   2           2.05        28.2        Brass         16.21      Quartz Sand             R             0.046
                  2                   3           2.05        11.76       Quartz        31.52      Quartz Sand             A              N/A
                  2                   4           2.05        30.75       Brass          38.4      Quartz Sand             A              N/A
                  2                   5           2.05         9.9        Quartz        38.73      Quartz Sand             E             0.025
                  2                   6           2.05        28.2        Brass          13.6      Quartz Sand             X              N/A
                  2                   7           2.05        9.82        Quartz         5.55        JSC-1                 R             0.276
                  2                   8           2.05        28.2        Brass         14.45        JSC-1                 R             0.091
                  3                   1           2.05        9.82        Quartz        24.75      Quartz Sand             E              N/A
                  3                   3           2.05        11.76       Quartz        26.38      Quartz Sand             E              N/A
                  3                   4           2.05        30.75       Brass         31.84      Quartz Sand             A              N/A
                  3                   5           2.05         9.9        Quartz        48.18      Quartz Sand             A              N/A
                  3                   6           2.05        28.2        Brass          15.2      Quartz Sand             X              N/A
                  3                   8           2.05        28.2        Brass          4.02        JSC-1                 R             0.229
                  4                   1           2.05        9.82        Quartz        25.85        JSC-1                 E             0.075
                  4                   3           2.05        11.76       Quartz        20.94      Quartz Sand             E             0.020
                  4                   4           2.05        30.75       Brass         27.77        JSC-1                 A              N/A
                  4                   5           2.05         9.9        Quartz        52.93      Quartz Sand             A              N/A
                  4                   6           2.05        28.2        Brass         10.02      Quartz Sand             X              N/A
                  4                   8           2.05        28.2        Brass         13.38        JSC-1                 R             0.055

                                                                                3
Launcher
           a.                                                                             b.
                                                                                                                                        LED panels

                                                                                                                                       Memory
                                                                                                                                       alloy wire

                                                                                                                                       Mirror

                                                                                                                                       Regolith
                                                                                                                                       tray door

                          Vacuum feed-through                             Camera                                                       Regolith
                                                                                                                                       tray
         Electronics                               Vacuum chamber

Figure 1: COLLIDE-3 hardware: (a) picture of the general setup showing the vacuum chamber with its viewport, the camera for data collecction, and the experiment
electronics for autonomous experiment run; (b) picture of the Impactor Box System (IBS) located inside the vacuum chamber with the launcher and regolith tray.

a.                                                     b.                              minum bar forced in its closed position by the presence of the
                                                                                       bottom plate. This bar is held under tension by a rotary spring
                                                                                       pressing it towards an open position. When the drop hole aligns
           1
                                                                                       with the launcher, the pin is freed thus allowing for the linear
                         2
                                                                                       spring of the launcher to push the projectile outwards. Figure 2
                                    3                                                  shows the multilauncher setup.

                                                                                       Projectiles and Simulants. Table 1 details which projectiles and
                                                                                       simulants were used for all three experiment campaigns. The
                                                                                       projectiles used in the COLLIDE campaigns were Teflon and
Figure 2: COLLIDE-3 multi-launcher system: (a) CAD side view showing the
individual launchers (three, numbered) and the rotating plate at the bottom; (b)
                                                                                       quartz spheres of diameters between 1 and 2 cm. These projec-
picture of the multilauncher from the bottom showing the rotating plate and a          tiles were chosen in order to vary the impact energies over the
projectile (marked by an arrow) in its individual launcher through the plate’s         largest range of values possible while using the same hardware
drop hole.                                                                             setup. For a similar projectile size, 1-cm projectiles had masses
                                                                                       about one order of magnitude smaller than 2-cm projectiles.
                                                                                            The target materials used were quartz sand, the lunar mare
    Three of the IBSs were used as single-launchers (one pro-                          basalt simulant JSC-1, and the Mars soil simulant JSC Mars-1.
jectile per experiment run, like in the COLLIDE-1 and -2 cam-                          The choise of these materials was not motivated by their min-
paigns), while the fourth one was modified to allow for the                            eralogic similarity to asteroid regolith, but rather by the shape
launching of three projectiles during the same experiment run.                         of their grains. Indeed, from the relatively long history of inter-
This modified setup was named multi-launcher. In a single-                             grain collision experiments (see Blum and Wurm, 2008, for a
launcher IBS, the projectile is kept on a compressed spring by                         review), it appears that the actual mineral composition of the
an aluminum bar. This bar is held in its closed position by a                          grains plays a comparatively negligible role in granular mate-
pin attached to two wires of memory shape alloy. When acti-                            rial cohesion compared to the size and shape of the grains. A
vated, these wires retract the pin and the released aluminum bar                       notable exception to this observation takes place if the regolith
swings in its open position via a rotary spring. More details on                       is composed of ices (in particular water ice) or covered with or-
the single-launcher setup can be found in Colwell and Taylor                           ganics, which are much stickier than rocky regolith and there-
(1999), Colwell (2003).                                                                fore change the behavior of grain layers. Ices and organic mate-
    The multi-launcher is composed of three individual launch-                         rials are outside the scope of the present work, and we therefore
ers (slightly smaller than a single-launcher), a central stepper                       only considered grain shape and sizes. The main difference be-
motor, and a circular bottom plate. The stepper motor allows                           tween the chosen simulants is the grain shapes and surface tex-
for the rotation of the bottom plate, which is outfitted with a                        ture, which are increasingly angular and irregular from quartz
drop hole. The projectiles inside individual launchers are kept                        sand to JSC Mars-1 and to JSC-1 Lunar simulant (3). Note that
on a compressed linear spring. They are held in place by an alu-                       quartz sand and JSC Mars-1 are more similar in shape com-

                                                                                   4
pared with JSC-1.                                                          below 0.4 during the experiment runs.
     The target materials were sieved to sizes between 75 and
250 µm, which provides for a normal distribution between these             2.2. PRIME
two sizes, and filled into the target tray of dimensions of 13 ×           Flight campaigns. PRIME flew on three experiment campaigns
13 × 2 cm3 . Grain sizes on the surface of asteroids are known             on the NASA KC-135 and C-9 parabolic airplanes. The first
to have a size distribution ranging from µm to 10 m. The popu-             flight campaign induced five flight weeks between July 2002
lation of grains smaller than 1 cm is difficult to infer from avail-       and May 2003 and is described in Colwell et al. (2008). The
able imaging of surfaces, such as for Vesta (Hiroi et al., 1994)           PRIME-1 campaign produced 108 successful impact record-
and Eros (Dombard et al., 2010), as the image resolutions are              ings.
usually > 1 cm. However, from thermal inertia measurements,                     From the results of this first campaign it was clear that the
Gundlach and Blum (2013) has inferred average regolith grain               regolith was very sensitive to the residual accelerations of the
sizes covering the surfces of 26 asteroids. For 15 of these 26             aircraft. Therefore, the PRIME-2 hardware was modified to be
bodies, they determined an average grain size of < 1 mm, which             partially free-floating. In this setup, the individual impact boxes
corresponds to the grain size distributions we used in the COL-            could be pulled out of the overall payload structure, which was
LIDE and PRIME experiments.                                                bolted to the airplane floor. The boxes were still attached to the
     Seguin et al. (2008) studied the influence of the grain con-          structure by an electrical umbilical. Unexpectedly, the resid-
tainer size on the penetration depth of projectiles droped into            ual accelerations of the plane during parabolas were still high
the container at speeds of < 3 m/s. They showed that for a                 enough to introduce torques onto the impact boxes via this um-
granular material target composed of 300-400 µm-sized grains               bilical, generating a worse acceleration environment than dur-
and projectile sizes ranging from 5 to 40 mm, the container bot-           ing PRIME-1 and no scientific data could be collected.
tom had an influence on the projectile penetration depth only if                The PRIME-3 hardware was designed to be entirely free-
located at a few grain diameters from the surface. They also               floating. Each impact box had its own electronics attached to
showed that the container side wall location had a vanishing in-           it, including a battery pack for power. The following paragraph
fluence on the impactor penetration for a ratio between the tray           describes the hardware flown during the PRIME-3 one-week
and projectile of > 5. Given their impact speeds and the size              flight campaign in August 2014. The PRIME-3 campaign pro-
of their projectiles and target grains, their results are applicable       duced 25 impact recordings. During the flight campaign, the
to the COLLIDE and PRIME experiments. As the target trays                  pilots flew a number of parabolas at 0.05g (named “asteroid-
were 13 × 13 cm2 (13 > 5*2 cm for a projectile of 2 cm in diam-            level” parabolas by the NASA flight support team) in addition
eter) in lateral size, and 2 cm deep (>> 250 µm grain diameter),           to the usual microgravity ones. Out of the 25 recorded impacts,
we expect that the tray had no influence on the target response            7 were at asteroid level. Details on the PRIME-3 campaign can
to the impacts performed in COLLIDE and PRIME.                             be found in Colwell et al. (2016).
     The trays were consistently filled using the same procedure,
in order to reproduce the same target density. This filling proce-         Hardware. Figure 4 shows the PRIME-3 hardware. It is com-
dure consisted in the pouring of simulant material into the tray           posed of 8 individual impact boxes that are kept in a structure
using a funnel, followed by the leveling of the surface using              bolted to the airplane floor. Each box can be slid out of the
a flat metal ruler. We measured the porosities of targets pro-             structure and used to perform an experiment run while com-
duced in this manner in the laboartory (30 times) by filling the           pletely free-floating during a parabola. The impact boxes were
tray using this procedure, then measuring the mass of the target           inherited from PRIME-1 and -2 and modified to allow for an
material using a scale. Knowing the container volume and the               autonomous experiment performance: while the regolith tray
bulk density of the grains, we determined target porosities con-           and launch mechanisms are similar, the electronics were re-
sistently ranging from 0.4 to 0.5. While the compaction level              designed to actuate them externally using a wireless signal. One
of fine grains at the surface of asteroids is not well determined,         camera was used to record the impacts in the individual cham-
the bulk porosity of “rubble-pile” asteroids was estimated to be           bers as it was attached to a bracket that could be switched from
of this order by Britt et al. (2002), indicating that such poros-          box to box. The camera used was also a GoPro Hero 3+ black
ity levels are relevant for the study of low-velocity impacts on           edition. More details on the inside of the impact boxes can be
asteroid surfaces.                                                         found in Colwell et al. (2008).
     In the COLLIDE experiment setup, the target was contained                 During asteroid-level parabolas, the impactor box was placed
by a sliding door, with no particular measures to prevent further          on the floor of the airplane and the projectile launch initiated at
compaction through post-preparation handling and launch vi-                the beginning of the parabola.
brations. However, the COLLIDE-3 videos, which have a high
enough resolution to show details of the target tray filling af-           Projectiles and Simulants. The list of projectiles and simulants
ter the door opened during the rocket flight, show no volume               for the 108 impacts recorded during the PRIME-1 campaign
reduction of the target sample. The target compaction during               can be found in Colwell et al. (2008). Table 1 summarizes the
COLLIDE-1 and -2 could not be quantified due to the low res-               projectiles and simulants used during the PRIME-3 campaign.
olution of the video data, but the projectile impact location in-              The target materials and preparation methods were the same
dicate that the target surface was not significanlty shifted from          as for COLLIDE (see 2.1 for details). The only difference with
its original position, so that we don’t estimate porosities much           the COLLIDE targets is an additional contraption on the tray
                                                                       5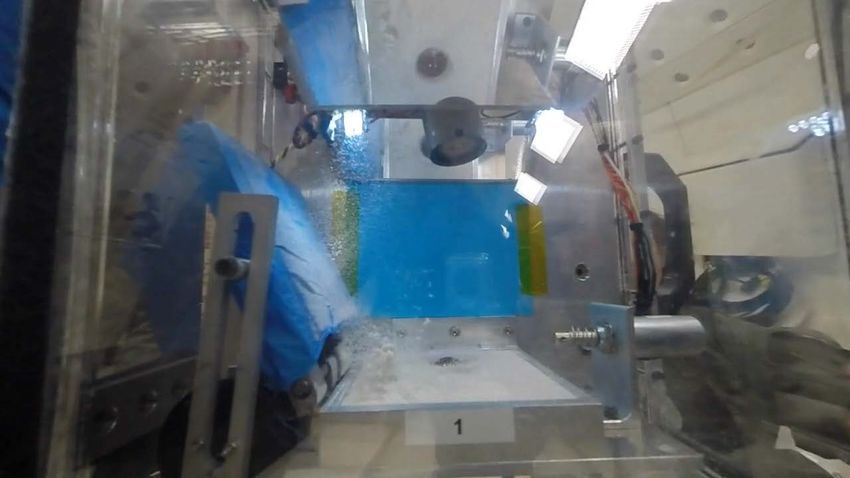
a. c.
500 µm
b. d.
500 µm
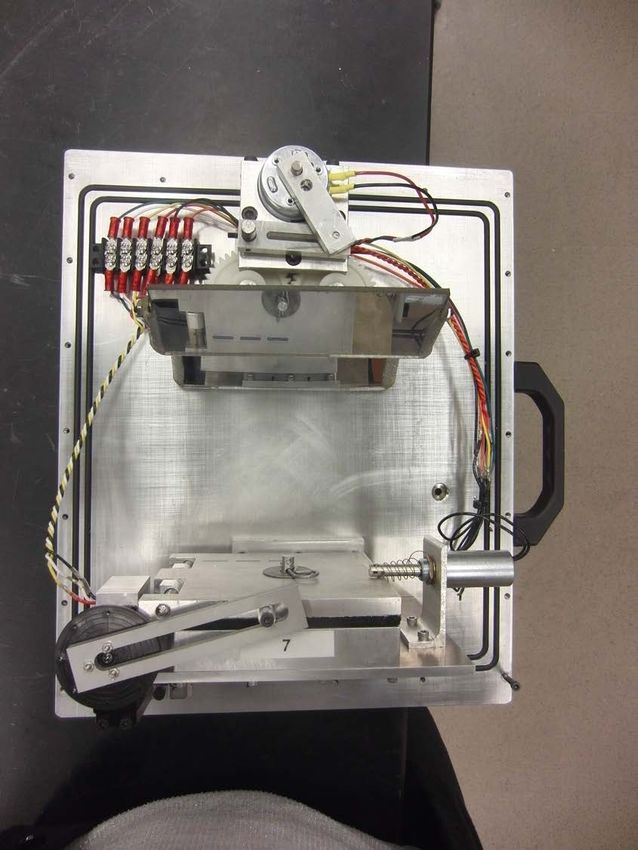
Figure 3: Optical and Sacnning Electron Microscope (SEM) pictures of the simulants used in COLLIDE and PRIME experiments: (a) quartz sand; (b) JSC Mars-1;
(c) JSC-1 Lunar simulant. The sample were prepared in the same manner as for the experiments, by sieving the different grains to below 250 µm. (d) shows the
details of the surface texture of JSC-1 grains.
door that slightly compresses the target after preparation and
through the pre-flight handling process. As the PRIME tray
a. b.
doors open by rotation rather than sliding, a plate was attached
Launch
Mechanism on the inner side facing the sample. Using four weak spring,
this plate applies pressure on the target sample when the tray
Mirrors
door is closed. In this way, the sample is jammed and its poros-
ity remains unchanged (0.4 to 0.5 as described in 2.1) during
2
loading of the experiment boxes on to the aircraft.
1
Tray Door
3. Data analysis and results
Regolith Tray
As the target size distribution and porosity were the same
for all the COLLIDE and PRIME campaigns, we combined the
Figure 4: PRIME-3 hardware: (a) picture of the payload structure that is bolted
collected data sets. This section presents how we analyzed the
to the aircraft floor and holds the 8 impact boxes (only 4 are visible in this front
view); (b) interior of an impact box showing the regolith tray and the launch impacts and the results we obtained, integrating all the data col-
mechanism. During an experiment run, the tray door rotates to open (1) before lected.
the projectile gets launched towards the regolith bed (2). The platforms used to collect data in microgravity induced
residual accelerations on the experiment hardware attached to
them. These accelerations were around 10−3 g in the Space
6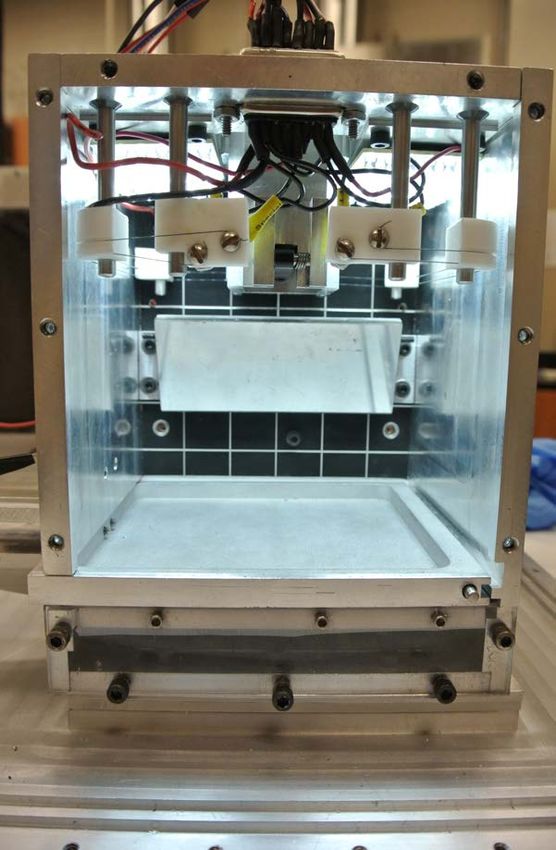
Shuttle (Colwell and Taylor, 1999), and 10−2 g on the parabolic
aircraft (Colwell, 2003) and on Blue Origin’s New Shepard
rocket (Wagner and DeForest, 2016). The free-floating experi-
ment boxes of PRIME-3 offered the best microgravity quality:
with only air drag acting on the box moving at very low speeds
(< 1 mm/s), no residual acceleration could be detected from our
video data. This implies that these experiment runs were per-
formed at residual accelerations under our detection threshold,
10−4 g. In addition to these microgravity experiment runs, the
PRIME-3 flights also allowed us to perform 7 experiment runs
at 0.05g.
    Across all the data collected, four types of collision out-
come were observed:
   • Collisions producing ejecta with an embedded projectile
     (squares in Figure 5): in these collisions, no motion of the
     projectile after the impact is detected. Either the ejecta
     blanket or individual particles could be tracked and their          Figure 5: Outcomes of all the low-velocity impacts observed in PRIME-1, -3,
     speed determined.                                                   and the COLLIDE campaigns as a function of the impact velocity. Circles: pro-
                                                                         jectile embedded, no ejecta; diamonds: projectile rebound, no ejecta; squares:
   • Collisions producing ejecta with projectile rebound (tri-           projectile embedded, ejecta production; triangles: projectile rebound, ejecta
     angles in Figure 5): the projectile can be tracked after the        production. Open symbols: quartz sand target; filled symbols: JSC-1 target;
                                                                         green plus sign: JSC Mars-1 target. Red: reduced gravity (∼ 10−2 g); black:
     collision. In addition to the ejecta speeds, a coefficient of       microgravity (< 10−4 g). All impacts producing no ejecta are shown at a mean
     restitution could be measured for the projectile.                   ejecta velocity of 1 cm/s for the clarity of the graph, even though no speed was
                                                                         measured as no ejecta was observed.
   • Collisions with no ejecta, but projectile rebound (dia-
     monds in Figure 5). The coefficient of restitution for the
     projectile could be measured.
                                                                             In PRIME-3, the camera resolution allowed for the individ-
   • Collisions with no ejecta and embedded projectile (cir-             ual tracking of ejecta particles. For these experiments, we were
     cles in Figure 5).                                                  able to measure a mean ejecta velocity by directly tracking 30
                                                                         particles for each impact, using the Spotlight software devel-
Figure 5 shows these outcomes as a function of the impact ve-
                                                                         oped at NASA Glenn Research Center (Klimek and Wright,
locity. In this graph, all impacts not producing any ejecta were
                                                                         2006). However, due to the nature of the video data collected,
placed at a mean ejecta velocity of 1 cm/s. This is for the pur-
                                                                         the tracking of individual particles is limited to optically thin
pose of representing all the data on the same graph only, as no
                                                                         portions of the ejecta blanket. This includes but is not restricted
speed could be measured on absent ejecta (and a representation
                                                                         to the ejecta “corner” mentioned above. Particle tracking was
at 0 is not possible on a logarithmic scale). The following para-
                                                                         performed by three people independently in order to reduce the
graphs give some additional details on these results for quartz
                                                                         measurement errors. The ejecta grain velocity distribution ob-
sand and JSC-1 target materials.
                                                                         tained for each impact were normal and could be fit by a Gaus-
    JSC Mars-1 behaved similarly to quartz sand in reduced
                                                                         sian curve. Details on the tracking methods can be found in
gravity (the JSC Mars-1 data points seen in Figure 5 are mostly
                                                                         Colwell et al. (2016) (see their figures 5 and 6). For PRIME-3
from the PRIME-1 campaign, see Table 1 in Colwell et al.
                                                                         and COLLIDE-3, the characteristic ejecta velocity was chosen
(2008)). This can be explained by the similar grain shape be-
                                                                         to be the Gaussian mean of velocity distribution of the tracked
tween these two simulants (Figure 3 a. and b.). In microgravity,
                                                                         particles.
only one impact was available for data analysis, which was not
                                                                             Figure 6 shows the results of the ejecta speed measure-
enough for analyzing this set of data.
                                                                         ments for PRIME-1 and -3. The 1-σ error bars for the Gaussian
                                                                         mean determination are shown for the PRIME-3 data points.
3.1. Ejecta production
                                                                         COLLIDE-3 produced ejecta for only one impact and the tar-
     Impacts in COLLIDE-2, -3, PRIME-1, and -3 resulted in               get material was JSC Mars-1. As stated above, JSC Mars-1
the production of an ejecta blanket. In the PRIME-1 and most             behaved similarly to quartz sand and we are not including JSC
of the COLLIDE-2 data (Colwell, 2003), individual ejecta par-            Mars-1 results here. The plateau formed by the PRIME-1 mi-
ticles could not be distinguished due to the low camera resolu-          crogravity data points (black asterisks representing quartz sand
tion. However, features of the ejecta blanket, in particular the         impacts) around 10 cm/s for impact energies below 104 ergs is
fastest particles forming the upper edge of the blanket (named           due to the residual accelerations induced by the parabolic air-
“corner” in (Colwell et al., 2008)) were identified and allowed          craft on the experiment boxes (on the order of 10−2 g). Only
for the measurement of the upper end of the ejecta velocity dis-         particles ejected with energies able to overcome the effect of
tribution.                                                               this ambient gravity field were lifted from the target. For this
                                                                     7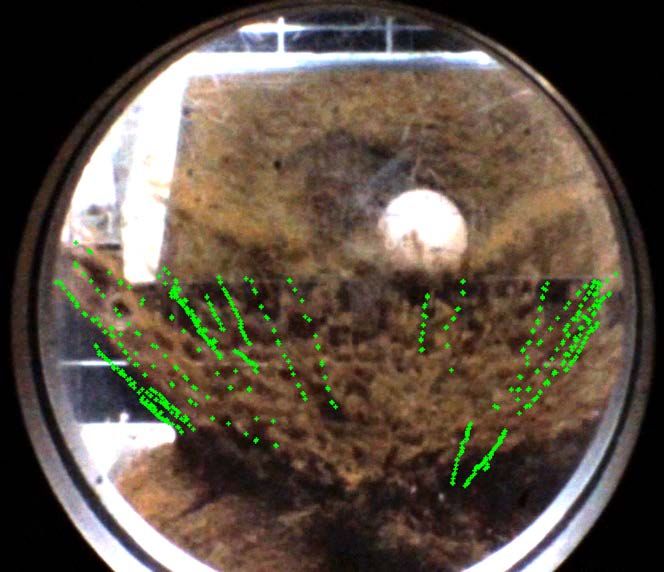
Figure 6: Combined PRIME-1and -3 ejecta velocity measurements as a func-                 Figure 7: Effective coefficient of restitution of the impacts depicted in Figure 6
tion of the impact velocity. PRIME-1 data is shown by red symbols. For                   (the same colors and symbols were used). This coefficient of restitution is de-
PRIME-3, black symbols show impacts in the free-floating box (< 10−4 g),                 fined as the ratio between the average ejecta velocity and the projectile impact
while green symbols show impacts at 0.05g. Impacts into quartz sand are                  velocity.
marked by asterisks, and impacts into JSC-1 by triangles. Error bars are not
shown for PRIME-1: they were smaller than the symbol size (Colwell, 2003).
PRIME-3 error bars represent the 1-σ error of the Gaussian fit to the velocity
distribution of tracked particles. The dashed black line is a power law fit to the       produced on the experiment when attached to the aircraft are
microgravity impacts in sand (index 0.50), and the red dashed line is a power            comparable to 10−2 g, and that our method for determining the
law fit to all the impacts into JSC-1 (index 1.35).
                                                                                         average ejecta speeds provide similar values than the method
                                                                                         used in Colwell et al. (2008).
                                                                                             We defined the effective coefficient of restitution of the im-
reason, the slowest moving ejecta has a minimum speed, set by                            pacts as the ratio between the average ejecta velocity and the
this g-level, and the measured velocities follow a plateau. This                         projectile impact velocity, and investigated its relationship to
plateau also formed in PRIME-3 mirogravity data, but at ejecta                           the impact velocity. These effective coefficients of restitution
velocities around a few cm/s, indicating that residual acceler-                          showed no correlation and a uniform distribution over the avail-
ations were successfully reduced by the free-floating hardware                           able range of impact velocities (Figure 7). We calculated the
configuration, compared to PRIME-1, which was attached to                                overall average effective coefficient of restitutionto be 0.39 ±
the aircraft frame.                                                                      0.15. This value is about twice the one derived by Deboeuf
     The scatter of the PRIME-1 data points towards higher ejecta                        et al. (2009) for impacts of cm-sized spheres into 100 µm glass
velocities was induced by the observational bias produced by                             bead beds. Deviations to our mean value were much higher
the tracking method used: tracking the ejecta “corner” described                         than for the measurements performed in Deboeuf et al. (2009).
above limits the recorded speeds to the fastest moving parti-                            When separating the impacts into quartz sand from the ones into
cles, and is therefore only representative of the upper end of                           JSC-1, we obtained average effective coefficients of restitution
the ejecta velocity distribution: there is therefore a tendency to                       of 0.38 ± 0.15 and 0.45 ± 0.16, respectively. When separating
measure higher ejecta velocities at the same impact energies.                            between impacts in low- and microgravity, we obtained values
However, the data points show a trend followed by the lower                              of 0.43 ± 0.14 and 0.15 ± 0.04, respectively.
limit of the measured velocities: to guide the eye, we fit a power
law to the impacts into quartz sand in microgravity. The index                           3.2. Projectile rebound
obtained in 1.35. For all impacts into JSC-1, a fitted power law                             A number of impacts during the COLLIDE-1, -3, and PRIME-
index is at 0.50. We collected only one data point for JSC-1                             3 campaigns showed a rebound of the projectile after impact on
ejecta at microgravity levels, which lies below this power law                           the target and allowed for the measurement of a coefficient of
                                                                                                          v
fit. Further data collection on JSC-1 ejecta-producing impacts                           restition  = vif , vi and v f being the projectile velocities be-
in microgravity will be required in order to evaluate if this point                      fore (initial) and after (final) the impact (see Table 1). Figure 8
is indicative of a different ejecta behavior between the two grav-                       shows the measured coefficients of restitution as a function of
ity levels.                                                                              the impact energy. For speeds above 30 cm/s, impacts systemat-
     The ejecta speeds measured for impacts at 0.05g during the                          ically produced an ejecta blanket and coefficients of restitution
PRIME-3 campaign are of the same range as the ones measured                              of the projectile could either not be measured or were of the
during the PRIME-1 campaign, where microgravity parabolas                                order of 10−2 .
were flown, but the experiment hardware was fixed to the air-                                At impact speeds between about 20 and 30 cm/s, both ejecta
craft frame. This demonstrates that the residual accelerations                           production and projectile rebound without ejecta were observed.

                                                                                     8
Figure 8: Combined PRIME-3 (black) and COLLIDE (green) coefficient of                    Figure 9: Maximum penetration depth of the projetile into the target for
restitution measurements. This coefficient of restitution is defined as the ratio        PRIME-3 impacts. H is the equivalent total drop distance as described in the
of the projectile speed after and before the impact with the regolith bed. Impacts       text. Impacts into sand are marked by asterrisks, and impacts into JSC-1 by
into quartz sand are marked by asterisks, and impacts into JSC-1 by triangles.           triangles. The line represents an index 1 power law.
Error bars are shown to for the PRIME-3 and COLLIDE-3 measurements. For
COLLIDE-1 and -2 they can be found in Colwell (2003). The straight line
represents the power law fit to all data points shown, which has an index of
-0.27.
                                                                                         of the projectile into the target. As the impact velocity was
                                                                                         not determined by the drop height in PRIME experiments, but
                                                                                         by the stored potential energy in the spring of the projectile
Below 20 cm/s, only rebounds without ejecta were observed. In                            launcher, we calculate an equivalent h from the impact velocity
order to compare our results to the experimental work of Kat-                            vi by equating the 1g potential energy with our kinetic impact
suragi and Blum (2017), we fit a power law to this set of data.In                        energy as follows:
Katsuragi and Blum (2017), spherical projectiles of about 1 cm
in diameter are dropped into aggregates composed of 750 µm                                                               E1g = E0g
SiO2 monomer grains with a packing density of Φ=0.35. The                                                                    1
                                                                                                                       mgh = mv2i
index we obtain with our data is -0.27, similar to the value of                                                              2                                   (1)
-1/4 found by Katsuragi and Blum (2017). We note, however,                                                                      v2
that if we separate the data sets from COLLIDE and PRIME,                                                                  h= i
                                                                                                                               2g
we obtain indexes of -0.10 and -0.50, respectively, a difference
                                                                                             with g = 9.81 m/s. As shown by the index 1 power law in
mostly due to the two very low energy impacts into JSC-1 of
                                                                                         Figure 9, H is dominated by zmax in half of the impacts. This
the COLLIDE-1 flight. As mentioned in Katsuragi and Blum
                                                                                         is due to the very low impact velocities, inducing equivalent
(2017), this overall index value is twice as high as expected
                                                                                         drop heights h  zmax , so that H ∼ zmax . We do not observe
from the theory of an elastic sphere impacting a plane surface
                                                                                         any correlation between the maximum penetration depth and
(Johnson, 1985, Thornton and Ning, 1998). This indicates that
                                                                                         the computed total equivalent drop distance. This is in contrast
energy absorption in a bed of granular material is not entirely
                                                                                         with the relation zmax ∝ H 1/3 observed in Katsuragi and Blum
captured by the mechanics of elastic surfaces.
                                                                                         (2017), representative of a scaling by impact energy. A scaling
                                                                                         by momentum of the form zmax = Amαp vβi , with m p and vi being
3.3. Projectile penetration depth
                                                                                         the projectile mass and impact velocity, respectively, and A, α,
     In the PRIME-3 video data, the resolution is high enough                            and β fit parameters, as performed in Güttler et al. (2009), was
to determine the maximum penetration depth of the projectile                             not successful either.
into the target for 21 impacts. This maximum penetration depth
is defined as the distance between the bottom of the projec-                             3.4. Grain behavior with decreasing gravity level
tile and the target surface. Figure 9 shows these results as a
                                                                                             From the experimental results presented here, we observed
function of the equivalent total drop distance H. This distance
                                                                                         differences in the response of the target to low-velocity impacts
was derived to be able to compare our results with the ones ob-
                                                                                         in reduced gravity (∼ 10−2 g) and microgravity (< 10−4 g). Fig-
tained by Katsuragi and Blum (2017): H = h + zmax , where h
                                                                                         ure 5 shows that compared to the total number of impacts in
is the drop height (experiments in Katsuragi and Blum (2017)
                                                                                         reduced gravity (∼ 10−2 g), only a few of them did not produce
are performed in 1g, and the drop height is used to control the
                                                                                         ejecta: the vast majority of impacts generated an ejecta cur-
impact velocity), and zmax is the maximum penetration depth
                                                                                         tain. In addition, none of the reduced gravity impacts lead to a

                                                                                     9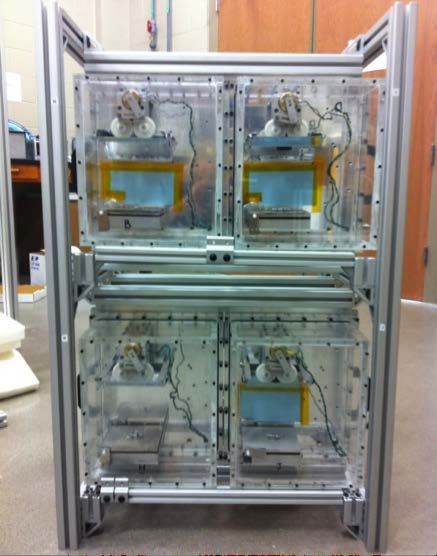
microgravity impacts (< 10−4 g). The impact velocity given for
                                                                                          each target type and ejecta mass level is the average of all im-
                                                                                          pacts that created the same amount of ejecta. From the sand
                                                                                          targets, we can see that the same average impact speed results
                                                                                          in higher ejecta masses in microgravity compared to reduced
                                                                                          gravity. Together with Figure 5, this shows that fewer target
                                                                                          particles are ejected in reduced-gravity, but their ejection speed
                                                                                          is higher.
                                                                                              Figure 10 also shows that no ejecta blanket was observed in
                                                                                          microgravity with JSC-1 targets. While this is also due to the
                                                                                          fact that only very few impacts were performed in JSC-1 in mi-
                                                                                          crogravity at speeds >50 cm/s, the nature of the target plays a
                                                                                          role in the ejecta mass produced: compared to quartz sand parti-
                                                                                          cles, which are rounded and considered cohesionless in vacuum
                                                                                          (once the air humidity is removed), JSC-1 particles are more an-
                                                                                          gular and behave like a cohesive powder. Figure 5 shows that
                                                                                          only two out of eight impacts into JSC-1 at >10 cm/s resulted in
Figure 10: Arbitrary quantified amount of ejecta for all collected data on sand           ejecta production, and these were only individual particles de-
and JSC-1 targets. The amount of ejecta mass was quantified as follows: 0 =               taching instead of an ejecta blanket. As we can see in Figure 10,
no ejecta; 1 = ejection of single particles; 2 = ejecta blanket, mass of the order
of the projectile mass; 3 = ejecta blanket, mass much higher than the projec-             the impact speed does not seem to influence the production if
tile mass. The impact velocity given for each target type is the average of all           these individual particles in JSC-1 targets, compared to quartz
impacts that created the same amount of ejecta. Asterisk = quartz sand target;            sand targets, which display a more consistent trend of increas-
Triangle = JSC-1 lunar simualnt target. Black = microgravity impacts; Red =               ing ejecta mass with increasing impact velocity. When an ejecta
reduced-gravity impacts. The dotted line marks the limit between no significant
ejecta produced (either none at all or only individual particles detaching) and           blanket is produced though, we can see that higher impact ve-
an ejecta blanket.                                                                        locities result in higher ejected masses for both quartz sand and
                                                                                          JSC-1 targets.

rebound of the projectile (no red triangles or diamonds). In par-                         4. Discussion
ticular, when no ejecta was produced around the lowest impact
speeds oberved (∼20 cm/s), only projectile embedding in the                               4.1. Observing ejecta
target could be seen. For the same impact speeds, a micrograv-                                Due to the hyper-g levels experienced after the low gravity
ity environment (< 10−4 g) lead to the rebound of the projectile.                         phase, the state of the target and projectile after each impact
In fact, embedding into the target was only seen in the two im-                           is destroyed and the PRIME and COLLIDE data collection re-
pacts under 4 cm/s. All other impacts than those without ejecta                           lies solely on video recordings. In particular, it is not possible
showed a rebound of the projectile.                                                       to measure the ejected mass, nor the trajectories of all ejected
    Projectile rebound was also observed in combination with                              particles in the case of an ejecta blanket forming. As described
an ejecta curtain in half of the impacts observed in microgavity                          in 3.1, ejected particles could only be tracked in thin parts of
(black triangles). Even though Figure 8 shows that the coeffi-                            the ejecta blanket, or in the case of single particles being lifted
cient of restitution of these rebounds is much smaller compared                           rather than a blanket. Figure 11a shows an example of particle
to the ones with no ejecta production (diamonds), this behavior                           tracks superposed with the ejecta blanket: even though we can
demonstrates the differences in target response in reduced- and                           get particle speeds from these partial tracks, there is a high un-
microgravity environments.                                                                certainty in placing the origin of each track with respect to the
    It can also be noted that for the same impact speed, ejecta is                        surface of the target material and embedded projectile, which
faster on average in reduced gravity compared to microgravity                             location can only be estimated as it is obscured by the ejecta
(red symbols are above black symbols in Figure 5). In addi-                               blanket. For this reason, it is not possible to generate mass vs.
tion, less mass is ejected than in microgravity. Figure 10 shows                          speed or speed vs. launch position diagrams for ejecta, in or-
the average ejecta speeds for four levels of ejected mass: as                             der to compare them to 1-g data and the scaling laws derived in
the ejecta mass can not be measured after each experiment run                             Housen and Holsapple (2011).
(the return to 1g mixes the target material from the tray and the
ejected particles), an estimation was performed from the video                            4.2. Observing projectile rebound
images. Four levels of ejecta mass were identified: no ejecta                                 As described in the previous section, a rebound of the pro-
(0); individual particles detaching from the target (1); ejected                          jectile from the target was never observed in reduced gravity
mass of the order of the projectile mass (2); ejected mass much                           conditions, compared to microgravity. This could be due to two
higher than the projectile mass (3) (we followed the same num-                            factors: either no rebound took place, or the rebound was too
bering as in Colwell (2003)). In Figure 10, the red symbols                               small to be observed at the space and time resolution of the
show reduced-gravity impacts (∼ 10−2 g), and black symbols                                video recordings of the impacts. In the case that the absence of

                                                                                     10
a. c. t0 t0+183 ms 10 frames and over 4 pixels. As no rebound was observed, it
appears that they were due to a different behavior of the target
and no rebound actually took place in reduced gravity. To il-
lustrate this, we show two PRIME-3 impacts with different out-
comes in Figure 11c, and their measured projectile positions,
at deepest penetration (t0 ) and after 22 (no rebound) and 4 (re-
69 px 69 px
bound) frames. Some impacts generating few ejecta allow for
a long term trackng of the projectile after the impact, allow-
ing for the detection of rebound speeds as low as a few mm/s.
b. t0 t0+83 ms
However, large ejecta blankets obstruct the view of the projec-
tile (see Figure 11a), thus limiting the obsevation of very low
rebound speeds in these cases.
4.3. Scaling the penetration depth
As shown in Figure 9, scaling the maximum penetration
91 px 95 px
depth of the projectile into the target (zmax ) with either the im-
pact energy or momentum was not possible. Here, the differ-
Figure 11: Data analysis examples: (a) COLLIDE-3 IBS 3 impact into JSC ence in gravity levels (reduced or microgravity) did not appear
Mars-1 at 29.3 cm/s. Particle tracks are superposed in green and the approxi- in the distribution of the data points.
mate projectile position is shown with a green circle, as the ejecta curtain hides
it entirely. The mirror above the target tray shows a top view of the impact,
Following Katsuragi and Durian (2013), Figure 12a shows
in which the projectile is visible. (b) COLLIDE-3 IBS 2 impact into quartz zmax as a function of the quantity µ−1 (ρ p /ρg )1/2 D2/3 p H
1/3
. In
sand at 26.3 cm/s. Note the mass transfer onto the projectile after rebound. (c) this quantity, µ is the coefficient of friction of the target ma-
PRIME-3 rebound observation: t0 indicates the moment of deepest penetration terial. From angle of repose measurements, we can estimate
of the projectile into the target. (top) Case of ejecta production without projec-
tile rebound (flight 1, box 1): no marble motion can be detected for 183 ms.
that µ = 0.84 for JSC-1 and 0.67 for quartz sand (Brisset et al.,
In following frames, the ejecta curtain hides the projectile, which can not be 2016). ρ p and ρg are the densities of the projectile and target
tracked anymore. (bottom) Case of ejecta production with projectile rebound material, respectively; D p the projectile diameter; and H the
(flight 2, box 5): we can track the motion of the projectile over 10 frames and 4 equivalent total drop distance as defined in the paragraph on
pixels.
penetration depth results. Figure 12a allowed us to recognize
two groups of data points, which we distinguised by color: im-
pacts with projetiles of masses around 10 g (see the PRIME-3
observed rebound in reduced gravity is only due to resolution data in Table 1: 9.82 to 11.76 g) in black, and impacts with ∼30
limitations of the experiment cameras, we can assume that the g projectiles (28.2 to 30.75 g). Power law fits to each popula-
rebound takes place with the same coefficient of restitution as tion yielded similar indexes of about 2.5, and a factor of about
in microgravity and calculate the distance and time travelled by 3 between both. We concluded that our data set scales with
the projectile after the impact before it gets stopped by grav- µ−1 (ρ p /ρg )0.1 D2/3
p H
1/3
, the exponent for ρ p /ρg being 0.1 rather
ity. As the only force on the projectile after it leaves the target than 0.5 (all PRIME-3 projectiles have the same diameter of 2
again is gravity, simple newtonian mechanics give us the time t0 cm). The result of this scaling is shown in Figure 12b.
at the apogee of its trajectory, and the height h above the target This scaling and the associated power law index are in con-
it reaches at t0 : trast with results by Katsuragi and Durian (2013). In particular,
vr 1 v2r the contribution of the projectile to target densities ratio is re-
t0 = ; h= (2)
gl 2 gl duced from an index 0.5 to 0.25, while the projectile diameter
and impact energy have increased contributions from indexes
where vr is the rebound speed, and gl the value of the local
of 0.67 to 1.67 and 0.33 to 0.83, respectively. The coefficient of
gravity acceleration.
friction has an increased contribution from an index -1 to -2.5
For impact speeds around 40 cm/s, we measure coefficients
(µ < 1). This means that in low gravity (no distinction between
of restitution around 0.02 (see Figure 8). This would set vr
reduced and microgravity), the diameter and kinetic energy of
to 8 mm/s. Reduced gravity environments had gravity levels
the projectiles play a more significant role in the penetration
around 10−2 g, thus gl ∼ 0.1 m/s2 . This leads to a travel time
depth than the density ratio with the target material than in 1g.
of t0 = 80 ms and a rebound travel height of h = 320 µm. Dur-
This reflects the fact that the gravity pull on the projectile dur-
ing the PRIME-3 campaign, the camera resolution was around
ing penetration is much reduced, and the density ratio between
80 µm/pixel and the recording was performed at 120 fps (about
projectile and target material is a less significant factor during
8 ms between frames). In addition, reduded gravity environ-
penetration. Large and high-velocity projectiles will penetrate
ments during this campaign lead to short parabolic trajectories
the target easier in reduced gravity. The role of the cohesion
of the ejected particles consistent with a ∼ 0.05g acceleration
between the target grains (which is implicit in the coefficient
environment, leaving a clear view of the projectile during the
for friction µ) is increased by the reduced gravity environment:
entire recording. This means that a rebound would have been
cohesive targets are more efficiently stopping a projectile than
observed and a rebound motion could have been measured for
11a. b.
Figure 12: Scaling of the maximum penetration depth during PRIME-3 impacts: (a) with the quantity µ−1 (ρ p /ρg )1/2 D2/3
p H
1/3 (see text for details); and (b) with
2/3 1/3
µ (ρ p /ρg ) D p H . Asterisks and triangles represent quartz sand and JSC-1 targets, respectively. Impacts performed with projectiles of masses ∼ 10 g are
−1 0.1
marked by black symbols, and ∼ 30 g by red symbols. The black and red lines in (a) are power law fits to these two types of impacts (10 g and 30 g projectiles),
both with indexes ∼ 2.5. The line in (b) shows the power law fit to the entire data set, with an index of 2.5.
in 1g. This supports the notion that cohesive forces can be- can overcome the gravity field and be ejected from the target. In
come significantly more important in low gravity compared to microgravity, the gravity force is low enough to allow for most
the weight of the target particles (see following paragraph). grains to get lifted, even the slower ones, and the average ejecta
speed is accordingly lower. In addition, as the gravity and co-
4.4. Gravity-cohesion competition hesion forces are of the same order in microgarvity, the target
In Figure 13, we compare the ambiant gravity forces to material displays a more elastic behavior: cohesion forces be-
inter-particle cohesion forces (van der Waals), following the ex- tween the particles seem to allow for a partially elastic response
ample of Scheeres et al. (2010), using measured inter-particle of the surface to the impact, thus leading to a rebound of the
force values rather than model estimations. The straight black projectile (see Figure 5, open triangles and diamonds), while in
lines in this figure represent the cohesion force between two reduced gravity environments the presence of a constant down-
grains, which is linearly proportional to the particle radius, as ward force locks the particles in place (e.g. jamming, Cates
measured for two different types of particles. We are using et al., 1998) and increases the inter-particle forces due to fric-
the Johnson-Kendall-Roberts theory (Johnson et al., 1971), es- tion inside the material (Murdoch et al., 2013), thus preventing
timating the force between two grains to be the pull-off force, projectile rebound.
F po = 3πγr, γ being the surface energy of a grain, and r its In Figure 13, we can also see that JSC-1 targets (which ap-
radius. The surface energies for quartz sand was measured in proximately behave like SiO2 grains) have stronger cohesion
Kendall et al. (1987) and in Brisset et al. (2016) for polydis- forces between grains than quartz sand: the cohesion and grav-
perse SiO2 particles in similar experiment conditions (vacuum ity forces are of the same order already in reduced gravity, while
levels of around 10 mTorr at room temperature). These polydis- cohesion dominates by several orders of magnitude in micro-
perse SiO2 grains were similar to JSC-1 lunar simulant in shape, gravity. The strong dominance of the cohesive forces can ex-
while quartz sand has more rounded, less cohesive grains. The plain why none of the impacts in JSC-1 in microgravity cre-
red dashed lines mark the force of gravity on individual grains ated an ejecta curtain. While most impacts in JSC-1 were per-
for three g-levels and the green vertical line marks the largest formed at speeds below 40 cm/s and higher impact speeds may
particles present in the target materials used in the present work. have possibly triggered larger ejecta masses, impacts at similar
In this figure, we can see that, for quartz sand, the forces speeds and in the same micrograivty environment generated an
induced on the target grains due to gravity are several orders of ejecta curtain with sand target (Figure 10). The predominance
magnitude larger than inter-particle adhesive forces at 1g and of cohesive forces between JSC-1 grains kept target material
10−2 g. Only at 10−5 g, these two forces are of the same order from escaping.
for the smaller target particles. This can explain the reason for We can also see a difference in behavior of the JSC-1 targets
lower ejected masses and larger average ejecta speeds (at the in reduced- and microgravity environments: for the same im-
same impact speed) observed in reduced gravity compared to pact velocities, rebound is observed in microgravity, while the
microgravity: in reduced gravity, only the fastest, lighter grains projectile embeds into the target in reduced gravity (filled black
12impacts of spacecraft landers at the correct size scales, those
simulations are mostly using hyper-velocity or 1g experiment
impact data for calibration. The only simulations predicting
and reproducing projectile bouncing from the surface (Maurel
et al., 2017), for example, are using Earth gravity impact ex-
periments at >10 m/s into granular material (Yamamoto et al.,
2006) or impacts on hard surfaces as input parameters (Biele
et al., 2017). Maurel et al. (2017) specifically indicate the need
for parameter refinement based on microgavity data from ex-
periments.
It can be noted that the experimental conditions, in particu-
lar the level of residual accelerations, have a significant impact
on the target behavior. Even for irregular grains that behave
like cohesive powders, the granular material displayed a dif-
ferent behavior in reduced- and microgravity. This means that
the behavior of granular material at the g-levels present on the
surface of small asteroids (10−4 g and below) cannot be extrap-
Figure 13: Comparison between gravitational and cohesive forces depending on olated from its behavior at Lunar g-level (∼ 10−2 g). Therefore,
the grain radius. The black lines correspond to the measured pull-off force be- experiments relevant to the interaction with surfaces of bodies
tween SiO2 polydisperse (Brisset et al., 2016) and quartz sand grains (Kendall
et al., 1987). The grain sizes at which the measurements were performed are like Ryugu and Bennu will require the high-quality micrograv-
marked as diamond symbols. The dashed red lines show the gravitational forces ity environment of free-fall drop towers or free-floating experi-
on the regolith grains for different g-level environments. The green line marks ment hardware.
the largest particles of our target size distributions.
5. Conclusion
diamonds and red circles in Figure 5). Even though JSC-1 dis- We have combined and analyzed low-velocity impacts into
plays a more cohesive behavior than sand in reduced gravity, regolith from five experimental campaigns. The PRIME and
the data inidicates that these cohesion forces do not dominate COLLIDE experiment setups allowed for recording impacts of
gravity enough at 10−2 g to lead to the rebound of the projectile. cm-sized spherical projectiles into a bed of regolith simulant
(quartz sand, JSC-1 Lunar, and JSC Mars-1 simulant), sieved
4.5. Interacting with small body surfaces to sizes under 250 µm. Due to their flight platform, these ex-
The experiments presented here are limited by the size of periments were run either at reduced gravity levels of ∼ 10−2 g
the target tray and projectile. However, it is possible to learn when fixed to the parabolic aircraft or during 0.05g parabolas,
from their results about possible outcomes of surface interac- or at microgravity levels of < 10−4 g, when free-floating in the
tions by spacecraft landers or sampling mechanisms. In partic- airplane or during Shuttle and suborbital rocket campaigns. The
ular, impact speeds under 1 m/s are typical for past and planned impacts into regolith simulant resulted into four types of out-
missions interacting with the surface of a small body; Philae comes, some producing ejecta and some displaying projectile
touched down on the surface of 67P/Churyumov-Gerasimenko rebound. These results revealed major differences in the target
for the first time at ∼ 1 m/s, OSIRIS-REx’s Touch-And-Go behavior depending on if the experiment was run in reduced- or
(TAG) mechanism is planned to impact the surface of Bennu microgravity conditions. The main results of the data analysis
at around 20 cm/s, Hayabusa-2’s MASCOT will land on Ryugu can be summarized as follows:
also at several 10 cm/s. The present experiments are therefore • We observed projectile rebound off the target in micro-
in a relevant impact speed regime. While the regolith size dis- gravity. None of the impacts in reduced gravity displayed
tribution on asteroid surfaces seems to heterogenously include a similar behavior. The coefficient of restitution of the
large and fine particles, images of the surfaces of asteroids vis- impacts varied with the impact energy following a power
ited by spacecraft show the presence of regions of very smooth law of index -1/4 (Figure 8);
terrain covered in grains of sizes below a mm (e.g. the smooth
ponds on Eros; Cheng et al., 2002). These smooth terrains also • The maximum penetration depth was observed to depend
represent ideal surface interaction sites as they reduce the risks more on the projectile size and energy and less on its den-
related to landing on uneven surfaces. Therefore, the target size sity difference with the target than in 1g;
distributions of our experiments are relevant to understanding
spacecraft interactions with asteroid surfaces. • For the same impact speeds, more mass was ejected in
At these relevant impact speeds and grain sizes, we ob- microgravity compared to reduced gravity, but the aver-
served the new phenomenon of projectile bouncing off of gran- age ejecta speed was lower (Figures 6 and 10);
ular material surfaces in microgravity. While numerical sim- • The difference in cohesive forces in quartz sand and JSC-
ulations are currently the only way of studying low-velocity 1 could be observed from the experiment results, with
13You can also read