Interpersonal Synchrony Special Issue - Neural reference groups: a synchrony-based classification approach for predicting attitudes using fNIRS
←
→
Page content transcription
If your browser does not render page correctly, please read the page content below
Social Cognitive and Affective Neuroscience, 2021, 117–128

                                                                                doi:10.1093/scan/nsaa115
                                                                                Advance Access Publication Date: 7 October 2020
                                                                                Original Manuscript

Interpersonal Synchrony Special Issue
Neural reference groups: a synchrony-based

                                                                                                                                                       Downloaded from https://academic.oup.com/scan/article/16/1-2/117/5918688 by guest on 10 March 2021
classification approach for predicting attitudes
using fNIRS
Macrina C. Dieffenbach,1 Grace S. R. Gillespie,1 Shannon M. Burns,1
Ian A. McCulloh,2 Daniel L. Ames,1 Munqith M. Dagher,3 Emily B. Falk,4 and
Matthew D. Lieberman1
1
 Annenberg School of Communication, University of Pennsylvania, Philadelphia, Philadelphia, PA 19104, USA,
2
 Accenture Federal Services, 800 N Glebe Rd, Arlington, VA 22203, 3 Independent Institute & Administration
Civil Society Studies (IIACSS) Research Group, Al Hussam Center 2 270 Arar Mustafa Wahbii Al Tal, Amman,
Jordan and 4 Annenberg School of Communication, University of Pennsylvania, Philadelphia, PA 19104, USA,
Department of Psychology, University of Pennsylvania, Philadelphia, PA 19104, USA, Wharton Marketing
Department, University of Pennsylvania, Philadelphia, PA 19104, USA, University of Pennsylvania
Correspondence should be addressed to Macrina C. Dieffenbach, Department of Psychology, University of California – Los Angeles, 4611 Pritzker Hall,
Los Angeles, CA 90095, USA. E-mail: macrina.dieffenbach@gmail.com

Abstract
Social neuroscience research has demonstrated that those who are like-minded are also ‘like-brained.’ Studies have shown
that people who share similar viewpoints have greater neural synchrony with one another, and less synchrony with people
who ‘see things differently.’ Although these effects have been demonstrated at the ‘group level,’ little work has been done to
predict the viewpoints of specific ‘individuals’ using neural synchrony measures. Furthermore, the studies that have made
predictions using synchrony-based classification at the individual level used expensive and immobile neuroimaging equip-
ment (e.g. functional magnetic resonance imaging) in highly controlled laboratory settings, which may not generalize to
real-world contexts. Thus, this study uses a simple synchrony-based classification method, which we refer to as the ‘neural
reference groups’ approach, to predict individuals’ dispositional attitudes from data collected in a mobile ‘pop-up neuro-
science’ lab. Using functional near-infrared spectroscopy data, we predicted individuals’ partisan stances on a sociopolitical
issue by comparing their neural timecourses to data from two partisan neural reference groups. We found that partisan stance
could be identified at above-chance levels using data from dorsomedial prefrontal cortex. These results indicate that the neu-
ral reference groups approach can be used to investigate naturally occurring, dispositional differences anywhere in the world.
Key words: neural reference groups; neural synchrony; intersubject correlation; fNIRS; dmPFC

When people share similar ideas and opinions, they are often                    synchrony (i.e. correlated neural fluctuations over time) with
referred to as being ‘like-minded.’ In support of this metaphor,                others who hold similar psychological perspectives and less
recent research demonstrates that people show greater neural                    neural synchrony with those who ‘see’ things differently. Thus,

Received: 3 February 2020; Revised: 19 June 2020; Accepted: 29 September 2020

© The Author(s) 2020. Published by Oxford University Press.
This is an Open Access article distributed under the terms of the Creative Commons Attribution-NonCommercial License (http://creativecommons.
org/licenses/by-nc/4.0/), which permits non-commercial re-use, distribution, and reproduction in any medium, provided the original work is properly
cited. For commercial re-use, please contact journals.permissions@oup.com

                                                                                                                                                 117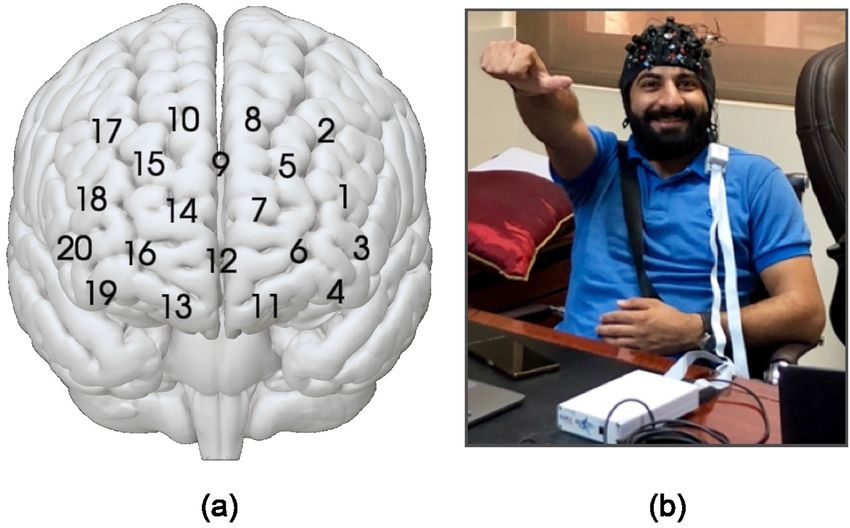
118 | Social Cognitive and Affective Neuroscience, 2021, Vol. 16, No. 1

studies have also identified distinguishable neural signatures           et al., 2014), such that people sharing a perspective show greater
between people who hold different perspectives at the group              synchrony than those asked to see things differently. Further,
level (Nummenmaa et al., 2018). Taking this idea one step fur-           individuals who are given alternative frames for interpreting an
ther, recent studies have also shown that it is possible to              ambiguous narrative show differential neural responding in the
predict the perspective that particular ‘individuals’ hold by com-       brain’s mentalizing network, language areas and subsets of the
paring the amount of synchrony they show with groups of                  mirror neuron system (Yeshurun et al., 2017).
people who hold one perspective versus another, and then clas-                Building on the group differences that they identified,
sifying them into whichever group they more closely resemble             these studies also applied classification-based machine learning
(Lahnakoski et al., 2014; Yeshurun et al., 2017). These studies          and could reliably distinguish between individuals who inter-
applied synchrony-based classification approaches to predict             preted the same information through two different frameworks.
differing mindsets that were experimentally induced. However,            Lahnakoski et al. (2014) use a k-nearest neighbors machine
no published research has yet attempted to use a synchrony-              learning approach, classifying participants based on the group
based approach to predict naturally occurring, dispositional             membership of the participants with whom they show the great-
differences (i.e. longstanding psychological characteristics).           est synchrony. In contrast, Yeshurun et al. (2017) use a k-nearest

                                                                                                                                                 Downloaded from https://academic.oup.com/scan/article/16/1-2/117/5918688 by guest on 10 March 2021
    Furthermore, the synchrony-based classification studies              centroid approach, in which participants are classified based
conducted to date used functional magnetic resonance imag-               on showing greater synchrony with the average of one group
ing (fMRI), which is expensive and immobile. Given that MRI              of participants versus another. In this article, we refer to the
machines are located in limited areas of the world (e.g. urban           approach used by Yeshurun et al. (2017) as the neural reference
and mostly western locations), this imaging modality can only            groups approach. This approach is simple to implement com-
reach certain populations, which limits its generalizability and         putationally and requires making few analytic choices, thus
potential to study particular populations of interest. Thus, more        limiting ‘researcher degrees of freedom’ (Botvinik-Nezer et al.,
work is needed to determine whether the same classification-             2020). In addition, it involves comparing new participants’ data
based approaches used in the fMRI literature can be applied to           to group average timecourses, which are less noisy references
data collected from portable neuroimaging devices, which are             for classification than neighboring individuals’ timecourses.
able to reach a broader population (Burns clustering to identify              Whereas these studies looked at experimentally manipu-
small group, 2019).                                                      lated differences in perspective, other research has examined
    Therefore, in this study, we used a simple synchrony-based           how naturally occurring, dispositional differences influence
classification method, which we refer to as the ‘neural refer-           neural synchrony (Finn et al., 2020). For instance, researchers
ence groups’ approach, to predict dispositional attitudes at the         found that individuals with similar levels of trait paranoia
individual level. Furthermore, we applied this method to neural          (high or low) showed more similar neural responding in regions
time series data collected using functional near infrared spec-          of the DMN (Finn et al., 2018). Other researchers have found
troscopy (fNIRS), a portable neuroimaging device. This research          that individuals with similar sexual desire and self-control pref-
was conducted in the Middle East to demonstrate the possibility          erences have similar neural fluctuations in several brain net-
of conducting simple, naturalistic viewing studies anywhere in           works, including the DMN (Chen et al., 2020). Furthermore,
the world and also the feasibility of analyzing their data using a       individuals with the same cognitive style (analytical or holistic
computationally accessible classification method.                        thinking) show synchrony in several cortical regions, including
    The neural reference groups approach involves comparing              prefrontal cortex (Bacha-Trams et al., 2018). Finally, other stud-
an individual’s brain data to data from groups of people with            ies of have also found a strong relationship between similarities
pre-identified distinct mindsets, and then ‘matching’ the indi-          in self-reported experiences of narratives and neural responses
vidual into the group with which they have greater neural                (Jääskeläinen et al., 2008; Nummenmaa et al., 2012; Nguyen et al.,
synchrony. Neural synchrony analyses were first developed to             2019; Saalasti et al., 2019; Tei et al., 2019).
localize universal cognitive processes that occur during the                  Although this nascent body of research has examined the
processing of naturalistic stimuli. For instance, intersubject           neural correlates of individual differences, no researchers have
correlation is a neural synchrony approach that is commonly              used a classification approach to make predictions about the
used for understanding which regions and networks of the                 dispositions of specific individuals using neural synchrony mea-
brain are active across individuals during narrative comprehen-          sures. From a basic science perspective, classification-based
sion (Hasson et al., 2004; Nastase et al., 2019). Such work has          analyses have the advantage of being driven by reverse-
demonstrated strong synchronization in both low-level sensory            inference rather than forward-inference, drawing a stronger
regions and high-level association cortices, suggesting that indi-       link between brain activity and particular psychological func-
viduals show similarities in their processing of both low- and           tionality (Poldrack, 2011). From an applied science perspective,
high-level information features (Hasson et al., 2004, 2010). Fur-        classification-based research can move beyond simply explain-
thermore, regardless of the modality in which a narrative is             ing differences in dispositional experience (i.e. what tradi-
presented, comprehension of its content tends to be associ-              tional, forward-inference studies do) to actually make real-world
ated with activation in the brain’s default mode network (DMN;           predictions about individuals whose dispositional characteris-
Wilson et al., 2007; Jääskeläinen et al., 2008; Honey et al., 2012;   tics are not known in advance.
Regev et al., 2013).                                                          To be clear, there is also significant literature on how differ-
    Research using the intersubject correlation approach has             ences in dispositional tendencies are associated with different
also examined how neural responses differ across individuals             neural responses to short, repeatable events (in contrast to more
who ‘see things differently,’ or are interpreting the same stimuli       naturalistic timecourse data). For instance, many studies have
according to different frameworks. For instance, when individu-          shown that liberals and conservatives show differential neural
als are told to attend to different aspects of a scene (e.g. scenery     responding in a number of regions, including the DMN, dorso-
versus plot) while watching a movie, they show distinguish-              lateral prefrontal cortex (dlPFC), anterior cingulate, amygdala
able differences in regions associated with attention and the            and insula (Knutson et al., 2006; Westen et al., 2006; Kaplan
processing of objects and scenes (parahippocampal gyrus, pos-            et al., 2007; Kanai et al., 2011; Jost and Amodio, 2012; Ahn
terior parietal cortex and lateral occipital cortex; Lahnakoski          et al., 2014; Van Bavel and Pereira, 2018). Other studies have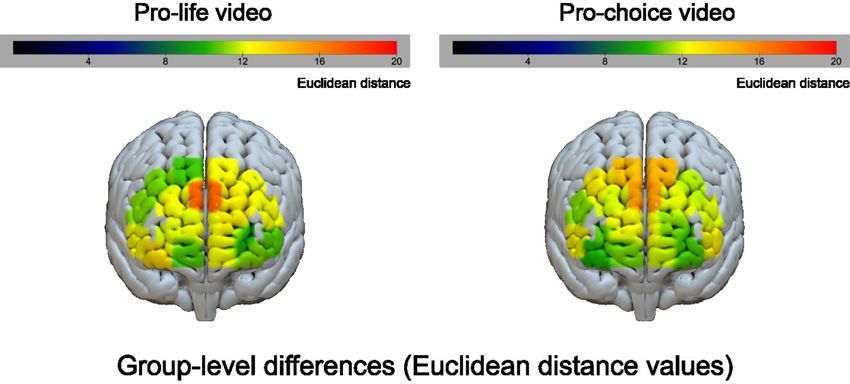
M. C. Dieffenbach et al. | 119

applied machine learning to univariate data to make predic-           likely to be pro-choice or pro-life. In tests of such classification
tions about other real-world characteristics, including physical      strategies, the true dispositional attitude of the ‘new individual’
and psychological well-being (Memarian et al., 2017) and polit-       is actually known, but the classification process is blind to this
ical orientation (Ahn et al., 2014). Although these studies have      information and only compared to this criterion in the final step
been useful in illuminating naturally occurring differences in        to determine the accuracy of the classification method.
brain functioning, their use of event-based paradigms limits the           Only one other known study has used this neural reference
ecological validity of their findings. In contrast, measuring brain   groups method, predicting the experimentally manipulated per-
fluctuations during unstructured experiences, such as watching        spective from which participants were understanding a narra-
a video or having a conversation, yields findings that are more       tive (Yeshurun et al., 2017). The present study was a first test
likely to be generalizable to real-world experience. Furthermore,     of this method on dispositional attitudinal differences. Partici-
these naturalistic paradigms are simple to design and conduct,        pants in the Middle East who held opposing views on a sociopo-
which is useful in terms of being able to use them to study a wide    litical issue came to a pop-up neuroscience lab and viewed
range of dispositional differences in a variety of contexts.          two videos in which other individuals expressed their opinions
    In summary, previous synchrony-based studies have taken           about the issue. While watching the videos, participants were

                                                                                                                                                Downloaded from https://academic.oup.com/scan/article/16/1-2/117/5918688 by guest on 10 March 2021
a forward-inference approach, showing that individuals who            scanned using fNIRS. Data were collected from channels posi-
share similar traits also show similar neural responses. Two syn-     tioned in lPFC and mPFC regions. Lateral prefrontal regions were
chrony studies to date have taken a reverse-inference approach        selected due to previous associations of dlPFC with counterargu-
to predict participants’ temporary mindsets, which were exper-        ing behavior (O’Donnell et al., 2018; Liu et al., 2020). As part of the
imentally induced, based on their neural fluctuations. The only       DMN, mPFC was selected due its association with social cogni-
studies that have made predictions about naturally occurring,         tive processes: A large body of evidence suggests that ventrome-
‘dispositional’ differences have been event-based, which can be       dial cortex is associated with affective processing, anteromedial
limited in terms of their generalizability. Thus, there have been     prefrontal cortex with self-referential thinking and dorsomedial
no classification-based synchrony studies that attempt to use         cortex (dmPFC) with mentalizing and judgments about others,
naturalistic timecourse data to predict individuals’ dispositional    (Lieberman et al., 2019). Furthermore, prior work has shown that
tendencies to process or experience the world differently. Fur-       dmPFC synchrony can detect when individuals have more sim-
thermore, most research using a classification-based approach         ilar spontaneous interpretations of a narrative (Finn et al., 2018;
to predict dispositional tendencies has been conducted in highly      Nguyen et al., 2019). Finally, collecting data from mPFC and lPFC
controlled laboratory settings using fMRI, which is costly and        regions minimized the chance of signal drop-out, as they are
limited in terms of the populations it can reach. Although fMRI       conveniently located beneath areas of the scalp that have less
research has been important in advancing classification-based         hair (i.e. the forehead).
methods, further work is needed to demonstrate the efficacy                We conducted analyses in two stages to determine whether
of conducting classification analyses on data acquired in more        members of the opposing ideological groups showed differ-
naturalistic, real-world settings. Therefore, we set out to exam-     entiable neural responses to the videos. First, we examined
ine whether it was possible to use a synchrony-based clas-            whether there were group-level differences. On a channel-by-
sification approach on neural timecourse data acquired in a           channel basis, we averaged across the neural timecourses of
non-standard lab setting using fNIRS, which is a less expensive       all members within each ideological group, which created two
and more portable neuroimaging modality than fMRI. Further-           group average timecourses per channel. We then conducted
more, we attempted to do so in a ‘non-WEIRD population’ in the        Euclidean distance analyses between these average timecourses
Middle East, an area of the world in which neuroscience studies       to detect group-level differences. We hypothesized that we
are rarely conducted outside of Israel (Burns et al., 2019).          would find group differences between the timecourses of the
                                                                      two neural reference groups.
                                                                           Second, we used the neural reference groups approach to
The present study                                                     make predictions about ideological stance at the individual level.
In this study, our goal was to predict individuals’ dispositional     The neural reference groups approach utilizes a leave-two-out
attitudes on a sociopolitical topic in a pop-up lab that was set up   procedure: the timecourses from pairs of participants are ‘left
in an office space in Amman, Jordan. Given that attitudes can         out’ from the dataset and are then compared to the timecourses
serve as interpretive frames that affect attention, mentalizing,      of each neural reference group formed from the remaining data.
counterarguing and other cognitive processes, we predicted that       Participants were classified as holding one ideological stance or
individuals with different attitudes should show differential         the other based on which neural reference group their neural
neural responding in regions associated with these processes          responses more closely resembled (i.e. which group they showed
(i.e. lateral prefrontal cortex [lPFC] and medial prefrontal cortex   greater synchrony with). This process was repeated, holding
[mPFC]). If this is the case, then it is possible to create neu-      out a different pair of participants in each iteration, until all
ral reference group data by averaging across neural timecourses       participants have received predictions. In order to assess the
from the same brain region in participants who share similar          accuracy of the neural reference groups approach, participants’
attitudes or other hidden psychological characteristics. When         true attitudes were compared to the model’s predictions. Given
two or more neural reference groups are obtained, new individ-        that individuals who hold different ideological stances are likely
uals whose attitudes or characteristics are not already known         to process sociopolitical content differentially, we hypothesized
can be classified into one of the groups by comparing whether         that we would be able to accurately predict participants’ stances
they show greater synchrony with one group versus another. In         at the individual level.
other words, two groups of people who have different attitudes
about, for example, abortion, are likely to have different neural     Method
responses when listening to an anti-abortion message. A new
                                                                      Participants
individual listening to the same message will reveal greater sim-
ilarity to one group (e.g. the pro-choice group) than to the other    Participants (N = 72) were adult males who were recruited in
(e.g. pro-life group), indicating whether the new individual is       Amman Jordan, for a video marketing study, from which the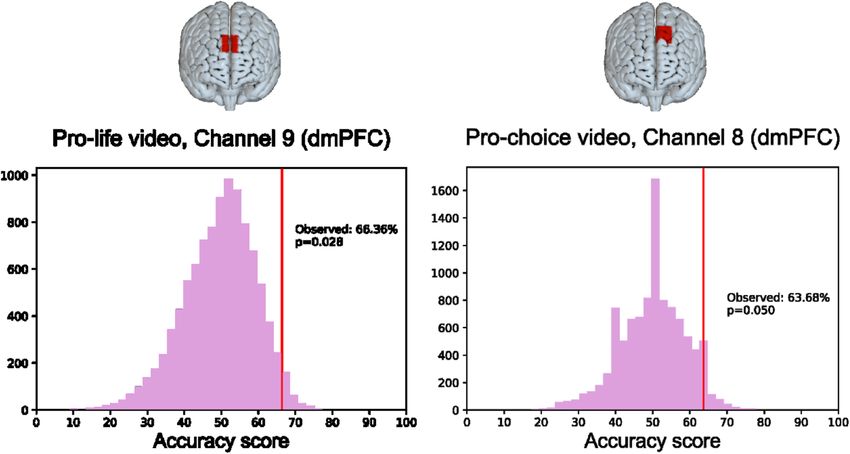
120 | Social Cognitive and Affective Neuroscience, 2021, Vol. 16, No. 1

authors obtained the data for analysis. All participants were            (translated) questions (1 = ‘strongly disagree,’ 3 = ‘neither agree
screened over the phone in Arabic and were asked for their con-          nor disagree,’ 5 = ‘strongly agree’): ‘The person in the video gives
sent to participate. Total sample size was determined by how             convincing reasons for [increasing access to/preventing] abor-
many participants could be scanned with the resources and                tion for women who are raped’ and ‘The reasons provided in
time allotted to collecting data in a 10-day timespan. Partici-          the video are strong for [increasing access to/preventing abor-
pants were recruited such that half of the sample would hold             tion] for women who are raped.’ Following the video portion
one political stance and half would hold the opposite stance             of the scan, participants completed two functional localizers,
(n = 36 for each group). During pre-screening, participants used a       which were translated into Arabic: the ‘Why-How task,’ a well-
7-point scale (1 = ‘strongly disagree,’ 7 = ‘strongly agree’) to indi-   validated localizer of the brain’s mentalizing system (Spunt and
cate their agreement with the following statement: ‘Women who            Adolphs, 2014), and a ‘counter-arguing task’ developed by our
are raped should be allowed to have abortions.’ This item was            team (O’Donnell, in prep). The data from these localizer tasks
developed by the research team to assess attitudes on a facet            were not used in the present analyses.
of the abortion debate that was salient to the population being
studied. In this article, we will refer to those in support of this      Data analysis

                                                                                                                                                Downloaded from https://academic.oup.com/scan/article/16/1-2/117/5918688 by guest on 10 March 2021
sub-issue of abortion as being pro-choice and those who oppose
it as pro-life, though the reader should consider that these terms       fNIRS acquisition and pre-processing
are simplifications of a complex issue and, importantly, do not          Acquisition. Participants were scanned using two NIRSport
correspond directly to pro-choice and pro-life views as they are         fNIRS units (NIRx, Los Angeles, CA), with a layout of 20 chan-
often defined in Western countries. Individuals who answered             nels, composed of 8 light sources and 7 detectors (Figure 1). The
between 1 and 3 on the scale above were classified as being pro-         NIRSport systems were selected due to their portability and
life, and individuals who answered between 5 and 7 were classi-          compact size, as the machines were transported in carry-on lug-
fied as being pro-choice. Individuals who answered a ‘4’ were not        gage from the United States to Jordan and back. The layout was
admitted into the study. For the final sample of participants who        standardized using the 10-10 UI external positioning system.
completed the study, the average opinion for pro-choice group            Channels were placed in medial and lateral prefrontal areas,
members was a 6.47 (SD = 0.71) on the scale, whereas the opinion         which are associated with mentalizing (mPFC) and counterar-
for pro-life group members was 1.67 (SD = 0.80).                         guing (dlPFC) processes (Denny et al., 2012; O’Donnell et al., in
                                                                         prep). Data were collected at a sampling rate of 7.81 Hz at wave-
Procedure                                                                lengths of 760 and 850 nm. Given this high sampling rate, the
                                                                         timecourses for each video consisted a large number of time-
Participants came into an office space at the Independent Insti-         points (2195 for the pro-choice video, and 2531 for the pro-life
tute & Administration Civil Society Studies Research Group               video).
polling firm, where a pop-up fNIRS laboratory had been set up.
After providing consent, participants’ heads were measured and
then fitted with an appropriately sized stretchy cap, which held         Pre-processing. Prior to data pre-processing, participants were
the fNIRS optodes against the skull. The fNIRS equipment was             excluded from all analyses if their answers on the primary
then calibrated to ensure good signal quality between sources            attitudinal pre-screening question, indicated they had a neu-
and detectors. During the fitting and calibration process, par-          tral political stance when it was re-administered on the day
ticipants completed a questionnaire to assess their attitudes            of the scanning session (i.e. 4 on the 7-point scale; n = 2 par-
toward the abortion issue. This questionnaire included the orig-         ticipants recruited as pro-life). Participants were also excluded
inal pre-screening item (i.e. whether women who are raped                if their stance on the day of the scanning session conflicted
should be allowed to have abortions), which was used to confirm          with the stance they had been assigned during pre-screening
the participant’s ideological stance on the day of the scan. The         (n = 2 recruited pro-life, n = 1 recruited as pro-choice). Partic-
questionnaire also included a question that assessed whether             ipants were also excluded from analyses on a video-by-video
participants thought abortion should be allowed in a series of           basis if technical issues occurred during acquisition for that
different circumstances (‘Do you agree or disagree with each of          video (n = 3 pro-choice watching the pro-choice video; n = 2 pro-
the following reasons for having an abortion?’) For this question,       life watching pro-choice; n = 2 pro-life watching pro-life; n = 2
participants rated a series of items, answering ‘Agree,’ ‘Disagree’      pro-choice watching pro-life). Following these exclusions, the
or ‘No Opinion.’ This question was included as a nuanced atti-           following sample sizes remained for each political group watch-
tude measure for the purposes of tracking attitude change over           ing each video type: n = 32 pro-choice Ps watching pro-choice
time, although it was not analyzed in this study.                        videos, n = 30 pro-life Ps watching pro-choice videos, n = 33 pro-
    Next, participants completed the scanning portion of the             choice Ps watching pro-life videos and n = 30 pro-life Ps watching
study. During scanning, participants watched two 4- to 5-minute          pro-life videos.
YouTube-style videos of Arabic speakers discussing their stance              The remaining data were pre-processed using a customized
on the abortion issue in 2 separate functional runs. The order           fNIRS pre-processing pipeline that utilizes the HOMER2 anal-
of the videos was counterbalanced across participants. The               ysis package (Huppert et al., 2009). For each scan, data chan-
speaker in one video expressed a pro-choice stance, and the              nels were marked as having usable signal if detector satu-
other expressed a pro-life stance. Scripts for the videos were           ration did not occur for longer than 2 seconds at a time,
written by the research team, translated into Arabic and then            and if the variation of the signal’s power spectrum did not
recorded by actors. After watching each video, participants              exceed a quartile coefficient of dispersion of 0.1 over the course
completed a questionnaire in which they evaluated the qual-              of the scan. Then, the raw NIRS data were filtered using a
ity of the speaker’s arguments using a subset of items that              bandpass filter of 0.005–0.5 Hz and corrected for motion arti-
were adapted from a validated scale of perceived argument                facts using a PCA algorithm, converted into hemoglobin con-
strength (Zhao et al., 2011). Participants used a Likert scale to        centrations using the Modified Beer–Lambert Law, and then
indicate the extent to which they agreed with the following              z-scored. Timecourses were truncated prior to the analyses,
M. C. Dieffenbach et al. | 121
Downloaded from https://academic.oup.com/scan/article/16/1-2/117/5918688 by guest on 10 March 2021
Fig. 1. (a) Locations of 20 NIRS channels, which are formed between adjacent sources and detectors. (b) Experimental setup, showing participant fitted with fNIRS cap
in the mobile laboratory, which was established in a market research company’s office space.
which included trimming off any scan time that occurred We determined whether the Euclidean distances obtained for
before or after the stimuli were displayed and removing the each channel were significantly different from chance through a
first 12 seconds of scan time during the video to account permutation testing procedure (see Yeshurun et al., 2017). Partic-
for delay in the hemodynamic response function. Analyses ipants’ group membership was shuffled, while ensuring that the
were conducted on oxygenated hemoglobin in accordance with sample sizes of the shuffled groups were matched to the origi-
our lab’s prior work (Burns et al., 2018, 2019). Research has nal groups. Then, Euclidean distances were computed between
shown that oxygenated hemoglobin has a stronger signal-to- the shuffled groups. This procedure was repeated 10 000 times,
noise ratio compared to deoxygenated hemoglobin (Strang- such that the observed Euclidean distance values could be com-
man et al., 2002). Furthermore, the oxygenated hemoglobin pared to a null distribution of 10 000 shuffled Euclidean distance
signal is more closely correlated with the fMRI BOLD signal values. For each channel and video, P values were calculat-
(Cui et al., 2011), which was relevant given that this study ing by dividing the number of shuffled values that exceeded
was replicating a method conducted on fMRI data (Yeshurun the observed Euclidean distance by the number of repetitions
et al., 2017). (number exceeding the observed values + 1/10 000).
In order to localize the data within a common brain space
such that the present results could be compared with results
Synchrony-based classification analyses using ‘neural
from fMRI studies, approximate MNI coordinates were iden-
tified for each 10-10 channel position using a probabilistic
reference groups’
registration method (Singh et al., 2005). For visualization pur- Subsequent to the Euclidean distance group analyses, we used
poses, NIRS data were converted to *.img files using xjView a classification-based machine learning approach to investigate
(http://www.alivelearn.net/xjview/), and then overlaid on a 3D whether participants’ partisan stance (pro-life or pro-choice)
cortical surface using the software Surf Ice. could be predicted at the individual level. These classifica-
tion analyses, which were conducted on individual channels,
involved comparing a participant’s neural timecourse to aver-
Measuring group-level neural differences age timecourses from the two partisan neural reference groups
(Figure 2). In other words, the reference group averages, which
As a first analysis step, we examined whether participants in excluded the participant’s own data, served as benchmarks to
the pro-life and pro-choice groups showed distinguishable dif- which the participants’ neural data could be compared. Partici-
ferences in their neural responses to the videos. We conducted pants were classified as belonging to a group based on showing
this analysis on a channel-by-channel basis and for each video greater similarity to (as in greater synchrony with) one reference
separately. First, we created average timecourses for each attitu- group over the other. For this analysis, Euclidean distance was
dinal group by calculating the mean across participants within a used as a measure of neural synchrony.
group at each timepoint (t). Then, to test for differences between Following Yeshurun et al. (2017), classification analyses were
the groups, we computed the Euclidean distance between the conducted on a channel-by-channel basis in regions of interest
group average timecourses using the following formula: (ROIs) selected based on the results of the Euclidean distance
analysis. Classifications were conducted on fNIRS timecourses
√
for each video separately. For each channel’s analysis, the sam-
D= Σt (choice (t) − life (t))2
ple size for each partisan group ranged from n = 18 to n = 29,122 | Social Cognitive and Affective Neuroscience, 2021, Vol. 16, No. 1
Downloaded from https://academic.oup.com/scan/article/16/1-2/117/5918688 by guest on 10 March 2021
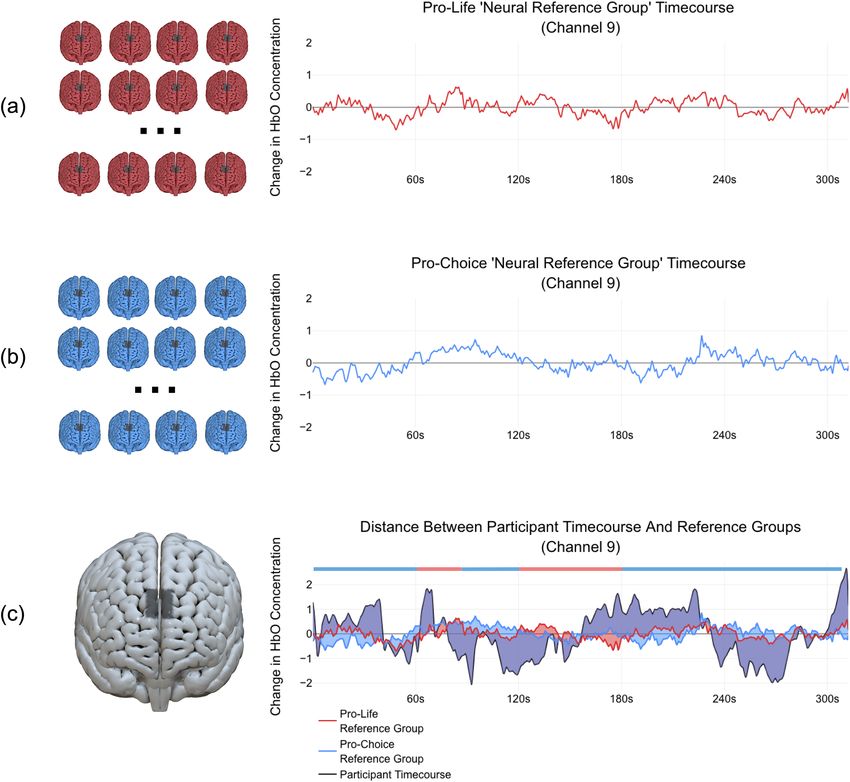
Fig. 2. Depiction of the neural reference group classification approach. (a) Neural timecourses from channel 9 for participants holding a pro-life stance are averaged
together to form a pro-life neural reference group timecourse. (b) Timecourses for participants holding a pro-choice stance are averaged together to form a pro-choice
neural reference group timecourse. (c) A participant’s timecourse, whose data were not included in the reference group timecourses, is compared to the timecourses of
the two neural reference groups. The participant is then categorized as belonging to one group or the other by demonstrating greater similarity with one group over the
other, as measured by a distance metric (Euclidean distance in this case, though Pearson correlation might also be used). Areas that are shaded in purple demonstrate
overlap where the participant‘s timecourse differed from both reference groups. Areas shaded blue or red correspond to where the participant’s timecourse diverged
more from one of the reference groups (blue=diverging further from pro-choice, red=diverging further from pro-life). These red and blue areas are key to determining
which reference group the participant differs from most in order to match the participant as being likely to belong to one group or the other. Blue and red bars shown
above the graph indicate sections of the timecourse where the participant differed more than (i.e. had a greater Euclidean distance from) one group or the other. For
the participant shown here, a larger blue area than red area across all timepoints indicates that the participant differed more from the pro-choice group, and thus this
participant was classified as being pro-life. In future studies, it may be valuable to examine regions of the timecourse when most participants tend to show similarity
to one group over the other and identify moments in the video to which those timepoints correspond.
depending on how many participants had usable data within the generation algorithm to reduce the number of participants in the
channel. This sample size was deemed to be adequate based majority partisan group. This downsampling procedure, which
on the constraints of the study and previous classification- was implemented using the imbalanced-learn Python package,
based neuroimaging work using similar sample sizes (Yeshurun utilizes k-means clustering to identify small groups of indi-
et al., 2017). For channels that had imbalanced data, such vidual timecourses that cluster together within the majority
that there were different numbers of participants within each partisan group (Lemaître et al., 2017). It computes the average
partisan group (or in machine learning terms, different num- timecourse across participants within the identified clusters,
bers of ‘samples’ within each ‘class’), we used a prototype and then replaces the original participant data with that newlyM. C. Dieffenbach et al. | 123
generated average. This process yielded an equal number of we examined participants’ perceptions about the argument
participants within each partisan group for each classification strength of the videos. The two items used to assess the
analysis. videos’ perceived argument strength were highly correlated, and
To conduct the classification, a nearest centroid classifier was thus were combined into a composite variable for each video
selected due to the study’s small sample size, because it does (αpro-choice = 0.86 [0.79, 0.93]); (αpro-life = 0.89 [0.83,0.94]).
not require the cross-validation procedure that is necessary for We then conducted a repeated-measures ANOVA, with par-
tuning hyper-parameters (see Yeshurun et al., 2017). The classifi- tisan group as a between-subjects factor and video type as
cation procedure was implemented in Python using scikit-learn a within-subjects factor. As predicted, there was a signifi-
(Pedregosa et al., 2011), where the accuracy of the classifier was cant interaction in how participants from the two groups rated
tested using a leave-two-out process (i.e. leaving out one sample the perceived argument strength of the videos, F(1,62) = 57.43,
from each reference group to maintain equal numbers of sam- P < 0.001, η2 p = 0.48. Pro-choice participants rated the pro-
ples within the two reference groups), with each sample being choice argument as being of higher quality, (M = 3.69, SD = 1.02)
left out once. The model was tested on the left-out samples, than the pro-life participants (M = 2.43, SD = 1.10), t(62) = −4.73,
having been trained on the remaining data. P < 0.001. On the other hand, pro-life participants gave a
Downloaded from https://academic.oup.com/scan/article/16/1-2/117/5918688 by guest on 10 March 2021
We selected Euclidean distance to serve as the classifier’s higher rating to the pro-life argument (M = 4.2, SD = 0.71) than
similarity index (i.e. the model’s synchrony measure) and we pro-choice participants (M = 2.26, SD = 1.13), t(56.49) = −8.29,
selected the mean to represent the centroid, in accordance with P < 0.001. This indicated that the partisan groups were signifi-
standard defaults for the nearest centroid classifier and its use cantly different in terms of the extent to which they thought the
in previous work (Yeshurun et al., 2017). During the classifica- videos contained strong, high-quality arguments.
tion procedure, for each fold in the leave-two out procedure,
the Euclidean distance was computed separately between the
neural timecourses of each of the two left-out samples and the
Group-level neural differences
mean timecourses of the remaining samples for the two par-
tisan groups. Participants were classified as being a member Given that behavioral differences were seen between the groups
of one group or the other based on which Euclidean distance for the ratings of the arguments in the videos, we first exam-
value was lower. In other words, a participant was categorized ined whether there were also differences between the average
as being likely to belong to whichever group’s neural timecourse neural timecourses of the two groups. For both videos, the great-
was more similar to their own timecourse within a given chan- est differences in neural responding between the pro-life and
nel. For instance, if a participant’s timecourse within a given pro-choice groups were seen in channels located within the
channel was closer in Euclidean space to the average pro-life dmPFC, a region of the mentalizing network (Figure 3). In other
timecourse, that participant would be classified as being pro-life. words, participants in the two groups tended to respond more
In contrast, if a participant’s timecourse was closer to the pro- differently to the videos in this region. The largest Euclidean
choice timecourse, the participant would be classified as being distance value, which was seen in channel 9 for the pro-life
pro-choice. video, was marginally significant at P < 0.06. However, this effect
To obtain a measure of classification accuracy, the classifier’s was not significantly different from chance following False Dis-
predictions were compared participants’ true partisan positions, covery Rate (FDR) correction with a q criterion of 0.05 (Ben-
as measured by self-report. While the partisan position of each jamini and Hochberg, 1995), which was used due to the large
participant was known to the experimenters, the classification number of tests across videos and channels (2 videos × 20
algorithm was blinded to the partisan position of the partici- channels = 40 tests). No other channels for either video showed
pants left out in any particular iteration. Classification accuracy significantly different Euclidean distances between the two
scores were computed by dividing the number of participants groups.
that were classified correctly by the total number of participants Although these differences between the two partisan groups
included (number of participants correctly classified/number of did not reach statistical significance at the group level, we also
classifications made). To obtain stable accuracy values, since investigated whether it would be possible to make above-chance
different combinations of participants could be left-out in the predictions about group membership at the individual level. Pre-
leave-two-out procedure, the classification procedure was per- vious work has shown that in some instances, individual-level
formed 1000 times within each channel. Final classification classification can achieve greater discriminatory power than
accuracy scores were computed as the average accuracy score group-level analyses due to inherent differences between the
from all 1000 repetitions. Permutation tests, where group mem- two methods (Arbabshirani et al., 2017). Whereas the group-
bership labels were shuffled, were then used to test the signif- based difference analysis attempts to determine whether the
icance of these accuracy scores. Classification accuracy scores partisan groups show different neural responses ‘on average,’
were obtained for data shuffled over 10 000 repetitions and com- the individual-based classification analysis takes a slightly dif-
pared to the accuracy scores for the real dataset (number of null ferent approach. It investigates whether it is possible to cate-
values larger than the real value + 1/10 000), an approach used gorize an individual as being likely to belong to one group or
by Yeshurun et al. (2017) the other.
For the classification analyses, we began by implementing
a simple ranked feature selection procedure to narrow down
Results which channels would be used in order to reduce the number of
statistical tests conducted. We selected the channels in which
Group-level behavioral differences
the group average timecourses were the farthest apart (>mean
Prior to investigating for neural differences between the Euclidean distance value + 1SD) to serve as ROIs. The channels
group, we first investigated whether there were differences that passed this threshold were all located in dmPFC (channel
in how members of the groups rated the videos. Specifically, 9 for the pro-choice video, channels 8, 9 and 10 for the pro-life124 | Social Cognitive and Affective Neuroscience, 2021, Vol. 16, No. 1
Downloaded from https://academic.oup.com/scan/article/16/1-2/117/5918688 by guest on 10 March 2021
Fig. 3. For each video within each channel, group-level differences between pro-life and pro-choice participants were computed as the Euclidean distance between the
mean timecourse for each group. These Euclidean distance values are shown projected onto a 3D cortical surface for each video: pro-life (left) and pro-choice (right).
These maps were used to identify ROIs for conducting the classification-based analyses.
video). We modeled this ROI-based approach off of the proce- 63.68% of the time, which was above chance (P = 0.050). There-
dure conducted by Yeshurun et al. (2017), which is analogous to fore, it was possible to identify participants’ views based on
the standard searchlight procedure developed by Kriegeskorte how another region in dmPFC responded to an individual talking
et al. (2006). In the majority of multivariate studies, a ‘search- about his pro-choice views at better-than-chance rates (Figure 4,
light’ is used to identify regions that show different levels of right). The classification analyses in channels 9 and 10 did not
mean activity across conditions at the group level. Then, a clas- produce predictions at above-chance levels: the classification
sification analysis is applied on the same data at the individual accuracy level was 62.31% (P = 0.106) for channel 9 and 50.33%
level. This searchlight procedure was developed by the same (P = 0.238) for channel 10.
research group that first raised methodological concerns about Therefore, we observed effects of dmPFC predicting partisan
double dipping (Kriegeskorte et al., 2009). According to Etzel stance across both videos. Given this finding, we conducted an
et al. (2013), the searchlight procedure is not susceptible to the exploratory follow-up analysis to examine whether including
issues of double dipping given that the group- and individual- data from both videos in a single analysis would improve the
level analyses address fundamentally different questions: the classifier’s predictive ability. Channel 9 was selected as an ROI
group-level analyses examine mean differences, whereas the for this exploratory analysis given that its classification accu-
individual-level analyses examine individual differences. Fur- racy was greater than 60% for both videos. Participants were
thermore, in our study, the ROIs were selected based on ranked included in this analysis if they had usable data in channel 9
distance values as opposed to using P-values generated through for at least one of the videos, which yielded a sample size of
significance testing. N = 51 (npro-choice = 25, npro-life = 26). For each video, a participant’s
time series data obtained in channel 9 was compared to the
time series from the two reference groups. For participants who
Synchrony-based classification results
had quality data for both videos, this yielded four Euclidean
To conduct the individual-level analyses, we trained a classi- distance values: (1) pro-life video time series (video) compared
fier in the selected ROIs within dmPFC for each video separately with pro-life reference group (ref); (2) pro-life video, pro-choice
(Figure 4). For the pro-life video, only channel 9 passed the ref; (3) pro-choice video, pro-life ref and (4) pro-choice video,
Euclidian distance threshold set, and hence we conducted the pro-choice ref. To calculate an average distance score relative to
classification analysis within this channel only (dmPFC, [MNI: each reference group, we averaged the distance scores that were
2, 54, 38]). We found that participants’ neural timecourses in calculated relative to the same reference group across videos
channel 9 successfully predicted their attitudinal stance 66.52% (i.e. 1 and 3, 2 and 4). Participants who had quality data for only
of the time at above-chance levels (P = 0.028). Thus, it was pos- one video had only 2 Euclidean distance value scores (one rela-
sible to identify whether participants identified as being ‘pro- tive to each reference group for only one video), and thus, these
choice’ or ‘pro-life’ above chance based on how their dmPFC were used to represent their average distance scores. Finally,
responded to an individual talking about his pro-life views. a difference score between the average distances was used to
(Figure 4, left). classify participants as matching more closely with one refer-
For the pro-choice video, we conducted analyses in chan- ence group or the other. For instance, if a participant’s average
nels 8, 9 and 10 of dmPFC, as all three surpassed the Euclidean Euclidean distance from the pro-choice reference group was
distance threshold that we had set. We found that channel 8 smaller than their distance from the pro-life group, they were
(left dmPFC, [MNI: − 10, 44, 48]) predicted group membership classified as being pro-choice.M. C. Dieffenbach et al. | 125
Downloaded from https://academic.oup.com/scan/article/16/1-2/117/5918688 by guest on 10 March 2021
Fig. 4. Classification accuracy for channels (in dmPFC) that could distinguish between partisan groups at above-chance levels for the pro-life (left) and pro-choice
(right) videos. For each video, the observed classification accuracy is shown relative to a null distribution of accuracy scores generated for shuffled data.
This approach did not yield a higher accuracy rate than 2019; Chen et al., 2020). Although studies have used neural
what was achieved in channel 9 in the videos separately synchrony measures to make predictions about experimen-
(accuracy = 54.90%, P = 0.348). However, an interesting finding tally induced psychological differences (Lahnakoski et al., 2014;
emerged when we examined the extent to which there was Yeshurun et al., 2017), no synchrony-based studies to date have
consistency in classification across the pro-life and pro-choice attempted to predict naturally occurring psychological char-
videos. In other words, we investigated whether participants acteristics, such as dispositional attitudes. Furthermore, no
‘matched with’ the same neural reference group for both videos. prior work has applied a classification-based approach to fNIRS
For instance, if a participant’s timecourse for the pro-life video data, which can be collected in more naturalistic environ-
looked more similar to the pro-life reference group, and their ments as well as across culturally and demographically inclu-
timecourse for the pro-choice video also looked more similar sive settings. Thus, the present study utilized fNIRS technol-
to the pro-life reference group, they would be classified consis- ogy in a pop-up laboratory, measuring the neural respond-
tently as being pro-life. An inconsistently classified participant ing of participants with two different partisan stances as they
might show greater similarity to the pro-life reference group watched naturalistic video stimuli. The study’s primary aim
for one video, but greater similarity to the pro-choice refer- was to assess whether individuals’ views could be predicted by
ence group for the other, for instance. To be included in this applying a synchrony-based classification approach that com-
analysis, participants were required to have usable data in chan- pared individuals’ neural data to data from neural reference
nel 9 for both videos, which yielded a sample size of N = 37 groups.
(npro-choice = 15, npro-life = 22). Of the participants whose classifica- Our results showed that we could predict participants’ views
tion was consistent across videos (n = 17), 82.35% were classified on a specific abortion issue at above-chance levels. For two sep-
accurately. In other words, if both classification tests yielded the arate videos, classification could be achieved with significant
same result, this result was highly diagnostic of the participant’s accuracy using neural data acquired from dmPFC. In a sub-
true attitude. Permutation testing, which created a null distribu- sequent exploratory analysis, participants who matched with
tion of accuracy scores obtained by comparing shuffled group the same neural reference group in dmPFC across both videos
assignments to the consistent participants’ classified groups, were classified at an even higher rate. This region is a part of
indicated this was a significant result (P = 0.001); however, this the mentalizing network, a set of brain regions associated with
analysis was conducted post hoc on a small sample and requires thinking about mental states (Frith and Frith, 2006; Mitchell,
replication. 2009; Lieberman et al., 2019). Prior fMRI and fNIRS studies have
also demonstrated a positive association between dmPFC activ-
ity and perceptions of the effectiveness of persuasive messages
Discussion
(Klucharev et al., 2008; Falk et al., 2010 2013; Burns et al., 2019).
Previous fMRI research has established that those who are ‘like- Thus, in the current study, participants in the two partisan
minded’ tend to show similarities based on how their brains groups were differentially responding in a region that has previ-
respond to external stimuli (Parkinson et al., 2018). Likewise, ously been associated with mentalizing and being persuaded by
fMRI studies have shown that individuals who demonstrate a message. Such a finding would track with differences observed
differences in their internal states show differentiable neu- in participants’ self-report data, in which there were significant
ral responding (Lahnakoski et al., 2014; Yeshurun et al., 2017; differences between the partisan groups in terms of how strong
Bacha-Trams et al., 2018; Finn et al., 2018 2020; Nguyen et al., they found the video arguments to be.126 | Social Cognitive and Affective Neuroscience, 2021, Vol. 16, No. 1
For researchers who may be interested in conducting future Nevertheless, accuracy rates of 66% and 63% in a binary clas-
research on synchrony-based classification using fNIRS data, it sification are extremely typical for successful classification stud-
is worth noting that current fNIRS technology tends to have bet- ies in neuroimaging. With high in-group variance resulting from
ter signal in regions with thinner or no hair, and thus regions a relatively small sample size and noisy data, it may be that we
in prefrontal cortex, such as dmPFC, are optimal locations to were underpowered to be able to detect statistically significant
measure. Whereas equipment constraints limited the number group-level differences. In contrast, the classification-based
of regions that could be measured in the current study, future analysis focuses on comparing an individual’s timecourse to the
studies might also consider measuring signal in other DMN mean of each group and may be less sensitive to the amount
regions, such as the inferior parietal lobule and inferior pari- of variance present. Even if both groups have high variance,
etal and temporoparietal junction. In addition, recent research accurate prediction may still occur if enough signal is present in
has also demonstrated that friends, who tend to be similar to the mean to facilitate the individual’s matching with the correct
one another in terms of how they ‘see’ the world, show greater group. Thus, further work examining the relationship between
neural similarity in these regions (Parkinson et al., 2018). group-level and individual-level classification analyses on time
Although the same general brain region (dmPFC) yielded series data may help explain why these discrepancies might
Downloaded from https://academic.oup.com/scan/article/16/1-2/117/5918688 by guest on 10 March 2021
accurate classification across both videos in the current study, happen in the context of this particular classification approach.
it is worth noting that the exact location of the channels that In addition, future studies might consider collecting larger sam-
yielded the most accurate classifications for each video differed. ple sizes, along with employing techniques to reduce statistical
For the pro-life video, significant classification was achieved noise caused by participants and/or equipment.
using data from channel 9, but not from channel 8. The oppo- Furthermore, it is possible that the low-budget quality of
site was found for the pro-choice video (though here, channel 9 the stimuli used in the current experiment influenced statis-
did show a trend towards significance). It is unclear why such a tical power. Given the study’s time constraints, the actors in
discrepancy may have occurred. It is possible that due to head the videos used in the stimulus set alternated between mak-
movement, the fNIRS cap may have shifted such that the chan- ing eye contact with the camera versus looking down at their
nels were in slightly different locations between the videos. scripts, which may have elicited muted emotional responses
However, we think this is unlikely given that the order of the from participants. However, even if participants could recognize
videos was counterbalanced across participants. It is also pos- that the speakers in the videos were actors, the videos’ political
sible that an inherent difference between the stimuli yielded content was enough to elicit distinguishable neural responses
differential activity in slightly different regions. We find it to be between partisan groups. We believe that the limitations of our
promising that similar effects were seen across the two videos, stimuli make the study’s significant findings more impressive,
and yet we also would advocate for future research to attempt and expect that richer stimuli might yield stronger effects. For
to obtain accurate classification in a consistent set of regions. instance, previous work has shown that highly engaging stim-
Furthermore, we are encouraged by our finding that participants uli are more likely to evoke higher levels of neural synchrony
who were consistent in matching with the same reference group (Cohen et al., 2017). In terms of identifying distinguishable group
across stimuli within the same region were classified with a high differences, an ideal stimulus would be one that is highly engag-
degree of accuracy. This would suggest that future researchers ing for individuals within a group and also polarizing between
who intend to use the neural reference groups approach in two or more groups. Future researchers who wish to apply the
applied research might consider using ‘neural synchrony con- current classification approach should carefully consider the
sistency’ across stimuli as a proxy for degree of confidence in selection of their stimuli to optimize statistical power.
predictions conducted at the individual level. Finally, this study should be seen as a ‘proof of concept,’
Despite it being possible to classify participants at the indi- demonstrating that it is possible to predict attitudes by con-
vidual level in dmPFC channels, there were no significant dif- ducting classification analyses on naturalistic timecourse data.
ferences in neural responses at the group level. Replications of More work is needed to demonstrate that models using the
this research may help explain why this occurred. One expla- neural reference groups approach can make accurate out-of-
nation for this could be that the partisan groups did not have sample predictions. It remains an open question whether this
truly dissociable neural data. We find this explanation to be classification approach can generalize beyond a small sample
unlikely due to a large body of evidence suggesting that individ- of individuals who share similar demographics or if it becomes
uals who hold different political beliefs show differential neural fine-tuned to the particularities of a specific population used
responding (Knutson et al., 2006; Westen et al., 2006; Kaplan in a particular study. For instance, this study used a small
et al., 2007; Jost and Amodio, 2012; Ahn et al., 2014; Van Bavel and stimulus set focused on one sociopolitical issue, and it was
Pereira, 2018). conducted only among Arab males living in Jordan. Additional
An alternative explanation would be that the study was work will be required to replicate this work to ensure that
underpowered, such that the individual-based classification the findings generalize to attitudes on other issues among
approach was more sensitive to neural differences than the other populations.
group-level analyses. Previous research has shown that discrep- In summary, this study demonstrates that the neural refer-
ancies can occur between these types of analyses due to differ- ence groups approach can be used to make predictions about
ences in the research questions they attempt to address, and real-world differences using data collected in naturalistic set-
how they measure ‘success’ using different statistics (Arbabshi- tings around the world. Furthermore, such predictions can be
rani et al., 2017). It is possible that the fNIRS data collected in the made by using a synchrony-based classification approach that
pop-up lab in the Middle East were noisier than fNIRS or fMRI utilizes neural reference groups. The classification accuracy
data from a traditional, controlled lab setting. Data collection scores obtained in our study were greater than those that would
was restricted to a 10-day timespan. Naturally, this meant that be achieved by chance and are consistent with scores observed
we did not have as large a sample as we would have liked. We in a prior, analogous fMRI study (Yeshurun et al., 2017). We find
are currently analyzing an analogous study run in our lab in the this result to be encouraging, given the challenges that were
United States which has a larger sample size.You can also read