Disparities in the pace of biological aging among midlife adults of the same chronological age have implications for future frailty risk and ...
←
→
Page content transcription
If your browser does not render page correctly, please read the page content below

Articles
                                                                                                    https://doi.org/10.1038/s43587-021-00044-4

Disparities in the pace of biological aging among
midlife adults of the same chronological age have
implications for future frailty risk and policy
Maxwell L. Elliott 1 ✉, Avshalom Caspi1,2,3,4,5, Renate M. Houts1, Antony Ambler3,6,
Jonathan M. Broadbent7, Robert J. Hancox8, HonaLee Harrington1, Sean Hogan6, Ross Keenan9,10,
Annchen Knodt1, Joan H. Leung 11,12, Tracy R. Melzer9,13, Suzanne C. Purdy9,11,12, Sandhya Ramrakha6,
Leah S. Richmond-Rakerd14, Antoinette Righarts 8, Karen Sugden1, W. Murray Thomson 7,
Peter R. Thorne 9,12,15, Benjamin S. Williams1, Graham Wilson6, Ahmad R. Hariri1, Richie Poulton6 and
Terrie E. Moffitt1,2,3,4,5

Some humans age faster than others. Variation in biological aging can be measured in midlife, but the implications of this
variation are poorly understood. We tested associations between midlife biological aging and indicators of future frailty risk
in the Dunedin cohort of 1,037 infants born the same year and followed to age 45. Participants’ ‘Pace of Aging’ was quantified
by tracking declining function in 19 biomarkers indexing the cardiovascular, metabolic, renal, immune, dental and pulmonary
systems across ages 26, 32, 38 and 45 years. At age 45 in 2019, participants with faster Pace of Aging had more cognitive dif-
ficulties, signs of advanced brain aging, diminished sensory–motor functions, older appearances and more pessimistic percep-
tions of aging. People who are aging more rapidly than same-age peers in midlife may prematurely need supports to sustain
independence that are usually reserved for older adults. Chronological age does not adequately identify need for such supports.

A
         s we age, the risk that we will experience chronic diseases        chronological age for some people6–9. Among older adults of the
         (for example, heart disease, diabetes and cancer) and declin-      same chronological age, those with accelerated biological aging (as
         ing capacities (for example, reduced strength, impaired            measured by blood and DNA methylation biomarkers) are more
hearing and poorer memory) increases1. To help mitigate personal            likely to develop heart disease, diabetes and cancer and have a
and societal costs associated with aging, population-level policies         higher rate of cognitive decline, disability and mortality10–16.
typically specify eligibility on the basis of chronological age. These          Current disease-management strategies usually treat and man-
include retirement age, pensions, social security and healthcare sub-       age each age-related chronic disease independently7. In contrast,
sidies, all intended to support independence. However, while many           the geroscience hypothesis proposes that many age-related chronic
individuals continue to live independently and flourish into their          diseases could be prevented by slowing biological aging itself7,17.
nineties, others experience organ failure, dementia and mortality           The geroscience hypothesis states that biological aging drives
before their sixties, the age when entitlement to many of the afore-        cellular-level deterioration across all organ systems, thereby caus-
mentioned age-based supports begins2. Thus, chronological age is,           ing the exponential rise in multimorbidity across the second half
at best, an imperfect basis for aging policy.                               of the lifespan6. The implication is that by slowing biological aging
    All individuals age chronologically at the same rate, but there         directly, instead of managing each disease separately, the risk for
is marked variation in their rate of biological aging; this may help        all chronic age-related diseases could be simultaneously amelio-
explain why some adults experience age-related decline faster than          rated5. Early trials suggest that this goal may be attainable18,19. To
others3,4. Biological aging can be defined as decline that (1) simul-       achieve maximal prevention of age-related diseases, interven-
taneously involves multiple organ systems and (2) is gradual and            tions to slow biological aging will need to target individuals by
progressive5. Across the lifespan, the consequences of individual           midlife before decades of subclinical organ decline have accumu-
differences in genetic endowment, cellular biology and life expe-           lated6,20. However, little is known about how to identify adults in
riences accumulate, driving the divergence of biological age from           midlife who are aging fast and who are most likely to benefit from

Department of Psychology and Neuroscience, Duke University, Durham, NC, USA. 2Center for Genomic and Computational Biology, Duke University,
1

Durham, NC, USA. 3Social, Genetic and Developmental Psychiatry Centre, Institute of Psychiatry, Psychology and Neuroscience, King’s College London,
London, UK. 4PROMENTA, Department of Psychology, University of Oslo, Oslo, Norway. 5Department of Psychiatry and Behavioral Sciences, Duke
University, Durham, NC, USA. 6Dunedin Multidisciplinary Health and Development Research Unit, Department of Psychology, University of Otago,
Dunedin, New Zealand. 7Faculty of Dentistry, University of Otago, Dunedin, New Zealand. 8Department of Preventive and Social Medicine, Otago Medical
School, University of Otago, Dunedin, New Zealand. 9Brain Research New Zealand-Rangahau Roro Aotearoa, Centre of Research Excellence, Universities of
Auckland and Otago, Auckland, New Zealand. 10Christchurch Radiology group, Christchurch, New Zealand. 11School of Psychology, University of Auckland,
Auckland, New Zealand. 12Eisdell Moore Centre, University of Auckland, Auckland, New Zealand. 13Department of Medicine, University of Otago, Dunedin,
New Zealand. 14Department of Psychology, University of Michigan, Ann Arbor, MI, USA. 15School of Population Health, University of Auckland, Auckland,
New Zealand. ✉e-mail: maxwell.elliott@duke.edu

Nature Aging | VOL 1 | March 2021 | 295–308 | www.nature.com/nataging                                                                            295
Articles                                                                                                                     NATure Aging

geroscience-informed interventions and, for this reason, we stud-          geroscience hypothesis, which states that aging represents cor-
ied biological aging in midlife.                                           related gradual decline across organ systems, we calculated each
    We measured biological aging in a population-representative            study member’s Pace of Aging as the sum of age-dependent
                                                                                                                                ∑19       annual
1972–1973 birth cohort of 1,037 individuals followed from birth            changes across all biomarkers: Pace of Agingi =        B=1  μ 1iB. The
to age 45 years in 2019 with 94% retention: the Dunedin Study21.           resulting Pace of Aging was then scaled to a mean of 1 so that it
Over 20 years—at ages 26, 32, 38 and 45—we repeatedly collected            could be interpreted with reference to an average rate of 1 year of
19 biomarkers to assess changes in the function of cardiovascular,         biological aging per year of chronological aging. Study members
metabolic, renal, immune, dental and pulmonary systems, and                showed wide variation in their Pace of Aging (mean = 1 biological
quantified age-related decline shared among these systems (Fig.            year per chronological year, s.d. = 0.29). Over the two decades in
1). We call this index of biological aging in the Dunedin Study the        which we measured biological aging, the study member with the
‘Pace of Aging’. In a 2015 article, we quantified the Pace of Aging        slowest Pace of Aging aged by just 0.40 biological years per chrono-
across 12 years from age 26 to 32 to 38 (ref. 22). Here, we report three   logical year, while the study member with the fastest Pace of Aging
innovations. First, we extend measurement to age 45, which yields          accrued 2.44 biological years per chronological year (Fig. 2b).
a measure that exceeds the midpoint of the contemporary lifespan.
Second, we report four biomarker waves, which increases statistical        Accelerated biological aging and the aging brain. Deterioration of
power for growth–curve models of biomarker-decline slopes and              the brain (for example, in Alzheimer’s disease and related demen-
improves precision of the Pace of Aging. Third, we test associations       tias) is a major contributor to morbidity and loss of independence in
with new outcomes: brain structure, brain age gap estimate (brain-         older adults23,24. Brain imaging can detect subtle signs of brain aging
AGE), gait speed, additional function tests, visual contrast sensitiv-     decades before the onset of age-related disease25,26. Several magnetic
ity, hearing and attitudes toward aging.                                   resonance imaging (MRI) measures have been associated with a
    We tested the hypothesis that individual differences in the Pace of    higher risk for cognitive decline and neurodegenerative disease in
Aging from ages 26 to 45 would be associated, at age 45, with estab-       older adults, including thinner cortex, smaller surface area, smaller
lished risk factors for future frailty, morbidity and early mortality      hippocampal volume, a larger volume of white matter hyperintensi-
across four domains (Fig. 1). First, we tested whether individuals with    ties (WMH), lower fractional anisotropy and older brain age27–29.
a faster Pace of Aging had, at 45, early signs of brain aging that have    Here, derived from high-resolution structural MRI scans at age
been linked to dementia in older adults. Second, we tested whether         45, we found that an accelerated Pace of Aging in the first half of
individuals with a faster Pace of Aging had more cognitive difficul-       the lifespan was associated with most of these risk factors. Table 1
ties and cognitive decline. Third, we tested whether those with a faster   reports effect sizes, significance tests and covariate-adjusted analy-
Pace of Aging already displayed signs of diminished sensory–motor          ses (sex-, continuously measured body mass index (BMI)- and
functional capacities that are linked to loss of independence, falls and   smoking-adjusted; and excluding study members with cancer, dia-
mortality in studies of older adults. Fourth, we tested whether individ-   betes or heart attack) for all brain measures.
uals with an accelerated Pace of Aging look older than their same-aged         Study members with a faster Pace of Aging had thinner aver-
peers, whether they self-report pessimism about aging and whether          age cortical thickness (β = −0.14, P < 0.001; 95% confidence inter-
informants have noticed age-related difficulties in study members.         val (CI): −0.21, −0.08) and smaller total surface area of the cortex
                                                                           (β = −0.08, P = 0.003; 95% CI: −0.14, −0.03). Furthermore, regional
Results                                                                    investigations of cortical thickness and surface area were conducted
Quantifying two decades of biological aging in midlife. The Pace           using the HCP-MPP1.0 parcellation, which consists of 360 parcels
of Aging was quantified in three steps. First, we measured longitu-        (that is, brain regions)30. Associations between faster Pace of Aging
dinal changes in 19 biomarkers at ages 26, 32, 38 and 45 years (see        and thinner cortex were widespread (89.72% of parcels had nega-
Supplementary Table 1 for details on each biomarker), assessing            tive effect sizes, 38.33% were statistically significant at P < 0.05, cor-
cardiovascular, metabolic, renal, immune, dental and pulmonary             rected for false discovery rate; Supplementary Table 3), with the
systems, totaling 69,715 data points (cohort participants × biomark-       largest associations in the medial temporal and insular cortices
ers × assessment phases) (Fig. 1). All biomarkers at each age were         (Fig. 3a). Regional associations with surface area were also wide-
standardized on the basis of their original distribution at age 26         spread (96.11% of parcels had negative effect sizes, 22.50% were
(that is, set to a mean of 0 and a standard deviation (s.d.) of 1) and     statistically significant, P < 0.05, corrected for false discovery rate;
coded so that higher values represented ‘older/less healthy’ levels        Supplementary Table 4), with the largest associations in the visual
(that is, scores were reversed for cardiovascular fitness, lung func-      and lateral temporal cortices (Fig. 3b). Those with a faster Pace of
tion, creatinine clearance and high-density lipoprotein cholesterol        Aging also had smaller volumes of the hippocampus (β = −0.10,
for which values are expected to decline with increasing chronologi-       P = 0.001; 95% CI: −0.16, −0.04)—a brain region central to both
cal age). In our cohort of midlife adults, biomarkers showed a pat-        healthy memory function and age-related memory decline31.
tern of age-dependent decline in the functioning of multiple organ             Study members with a faster Pace of Aging had early signs of
systems over the 20-year follow-up period.                                 white matter deterioration, as indicated by a larger log-transformed
    Second, linear mixed-effects modeling was used to quantify each        volume of WMH (β = 0.18, P < 0.001; 95% CI: 0.11, 0.24; Fig.
study member’s personal rate of change across each of the 19 bio-          3c), but they did not have lower fractional anisotropy (β = −0.03,
markers. The 19 models took the form Bit = γ0 + γ1Ageit + μ0i + μ1iAg      P = 0.439; 95% CI: −0.09, 0.04), a measure of white matter micro-
eit + ϵit, where Bit is a biomarker measured for individual i at time t,   structural integrity.
γ0 and γ1 are the fixed intercept and slope estimated for the cohort,          We also studied a relatively new measure called ‘brain age gap esti-
and μ0i and μ1i are the random intercepts and slopes estimated for         mate’ (brainAGE). BrainAGE is the difference between each study
each individual i. Biomarker slopes indicated a tendency to decline        member’s chronological age and their brain age as estimated from
with age (Fig. 2a). Of the 171 unique correlations among bio-              a machine-learning algorithm that was trained to predict chrono-
marker slopes, 124 (73%) had a positive sign indicating coordinated        logical age from gray- and white matter measures in independent
change with age. Correlations between biomarker slopes averaged            samples ranging in age from 19 to 82 (ref. 32). Higher scores on brain-
r = 0.1 ranging from r = −0.2 to r = 0.7 across the 19 biomarkers          AGE thus indicate a brain age that is older than chronological age.
(Supplementary Table 2).                                                   Dunedin study members with a faster Pace of Aging tended to have
    Third, we combined information from the 19 slopes to calcu-            brains that were typical of an older person as represented by higher
late each study member’s personal Pace of Aging. In line with the          brainAGE scores (β = 0.20, P < 0.001; 95% CI: 0.13, 0.26; Fig. 3d).

296                                                                                Nature Aging | VOL 1 | March 2021 | 295–308 | www.nature.com/nataging
NATure Aging                                                                                                                                                            Articles
                                                                                                 Aging outcomes

              Neuroimaging measures                        Cognitive difficulties                               Sensorimotor functional capacity       Perceptions of aging
              • Gray matter measures                       • Tests of cognitive functioning                     • Tests of functional fitness          •   Attitudes toward aging
              • White matter measures                      • Cognitive decline                                  • Tests of vision and hearing          •   Perceived health
                                                           • Informant-reported cognitive difficulties          • Self-reported physical limitations   •   Age appearance
                                                                                                                                                       •   Facial aging

                                                                                                        PoA

                                                                          0.4

                                                                          0.3
                                                                Density

                                                                          0.2

                                                                          0.1

                                                                           0
                                                                                       Slow           Average             Fast

                                                                                                        PoA:
                                                                                       individual differences in rate of change
                                                                                                  in system integrity

                                                                                                    Multiple
                                                                                                    systems

                   Cardiovascular                       Metabolic                        Renal                  Immune                  Dental               Pulmonary

                            Measurement of multiple systems
                            at ages 26, 32, 38 and 45 years
                     1972
                           1973
                                 1975
                                      1977
                                            1979
                                                 1981
                                                    1983
                                                        1985
                                                           1987

                                                                      1990

                                                                                1993

                                                                                        1998

                                                                                                                  2004

                                                                                                                                           2011

                                                                                                                                                                  2018
                                                                                                                                                                         2019
                  Year

                         Birth    3     5    7     9 11 13 15         18        21      26                        32                       38                      45

                                                                                           Assessment age (years)

                                                                                         Dunedin Longitudinal Study

Fig. 1 | Study design. We studied the Pace of Aging (PoA) in the Dunedin birth cohort. The timeline on the bottom of the figure visualizes the design of
the Dunedin Longitudinal Study. The years of each phase of data collection and the corresponding ages are listed. The PoA was derived from measuring
longitudinal changes in 19 biomarkers at four timepoints between the ages of 26 and 45 years. These biomarkers indexed functioning across multiple organ
systems (each visualized under the heading ‘multiple systems’). We combined rates of changes across these biomarkers to produce a single measure
termed the PoA. We then investigated associations between the PoA and aging outcomes across four domains at age 45: neuroimaging measures,
cognitive difficulties, sensorimotor functional capacity and perceptions of aging.

Accelerated biological aging, cognitive difficulties and cogni-                                           factor for Alzheimer’s disease and dementia, and cognitive decline is
tive decline. Cognitive testing is used widely to assess risk for                                         a hallmark feature of these age-related disorders33,34. Dunedin study
age-related neurological disease. Low cognitive functioning is a risk                                     members with a faster Pace of Aging displayed poorer cognitive

Nature Aging | VOL 1 | March 2021 | 295–308 | www.nature.com/nataging                                                                                                               297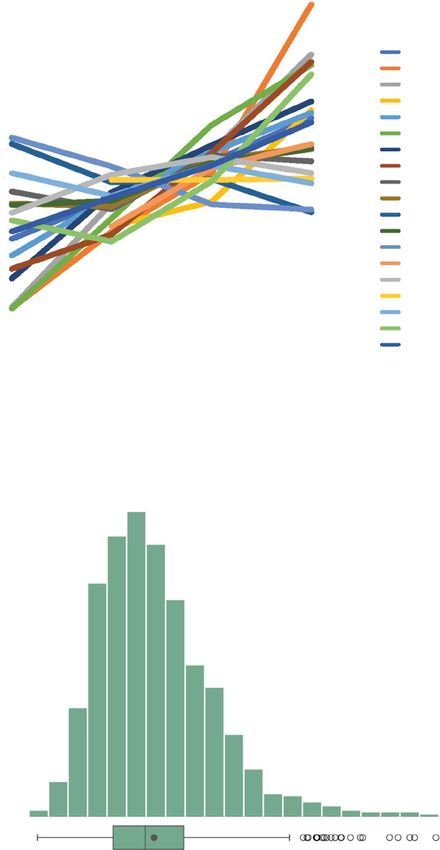
Articles                                                                                                                                NATure Aging

                    a
                                         1.0

                                         0.8

                                                                                                               BMI
                                         0.6                                                                   Waist–hip ratio
                                                                                                               Hemoglobin A1c
                                         0.4                                                                   Leptin
                                                                                                               Mean arterial pressure

                                         0.2                                                                   VO2Max (rev)
                 Biomarker z-score

                                                                                                               FEV1/FVC (rev)
                                                                                                               FEV1 (rev)
                                         0.0
                                                                                                               Total cholesterol
                                                                                                               Triglycerides
                                        –0.2                                                                   HDL cholesterol (rev)
                                                                                                               Lipoprotein(a)
                                        –0.4                                                                   ApoB100/ApoA1
                                                                                                               eGFR (rev)

                                        –0.6                                                                   Blood urea nitrogen
                                                                                                               hsCRP
                                                                                                               White blood cell count
                                        –0.8
                                                                                                               Mean periodontal attachment loss
                                                                                                               Dental caries experience
                                        –1.0
                                               26         32                  38             45
                                                               Age (years)

                    b
                                         20

                                         15
                 Percentage of cohort

                                         10

                                          5

                                          0

                                                    0.5           1.0              1.5              2.0                 2.5
                                                                             PoA

Fig. 2 | Biological aging across two decades from age 26 to age 45. a, For visualization, biomarker values were standardized to have mean = 0 and s.d. = 1
across the two decades of follow up (z-scores). Z-scores were coded so that higher values corresponded to older levels of the biomarkers. b, PoA is
denominated in years of physiological change per chronological year. A PoA of 1 indicates a cohort member who experienced 1 year of physiological change
per chronological year (the cohort average). A PoA of 2 indicates a cohort member aging at a rate of 2 years of physiological change per chronological
year (that is, twice as fast as the cohort average). The box plot displays the distribution of the PoA; the box borders and midline represent the 25th, 50th
and 75th percentiles, with whiskers extending to the furthest observation within the 1.5 interquartile range of the 25th and 75th percentiles. n = 955 study
members. Apo, apolipoprotein; (rev), reverse.

functioning and more cognitive decline by age 45. Table 1 reports                     Compared to peers with a slower Pace of Aging, those who
effect sizes, significance tests and covariate-adjusted analyses for all           were aging faster had lower age 45 intelligence quotient (IQ) scores
cognitive measures.                                                                (β = −0.33, P < 0.001; 95% CI: −0.38, −0.26). This difference in

298                                                                                       Nature Aging | VOL 1 | March 2021 | 295–308 | www.nature.com/nataging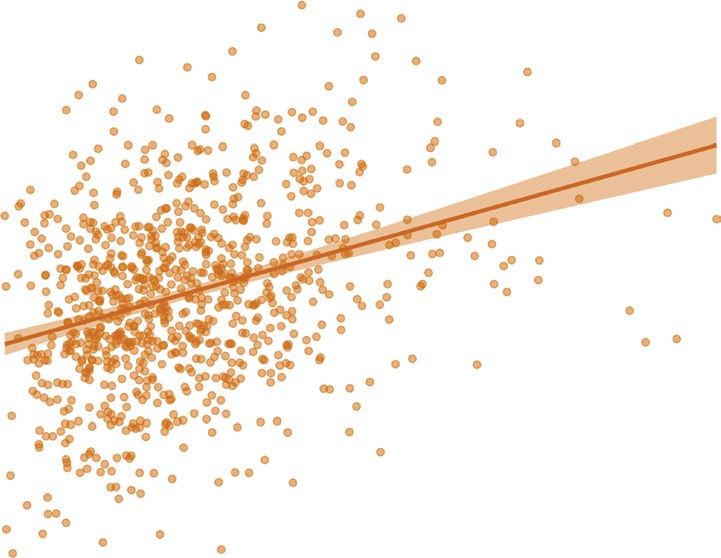
NATure Aging                                                                                                                                                                       Articles
Table 1 | Associations between the Pace of Aging, neuroimaging and cognitive measures
                                            Adjusted for sex                                  Adjusted for sex, BMI and smoking                        Without cancer, diabetes or heart attack
                        n            β (95% CI)                           P              n         β (95% CI)                           P             n        β (95% CI)                            P
Signs of brain aging
 Cortical               860           −0.14 (−0.21 to −0.08)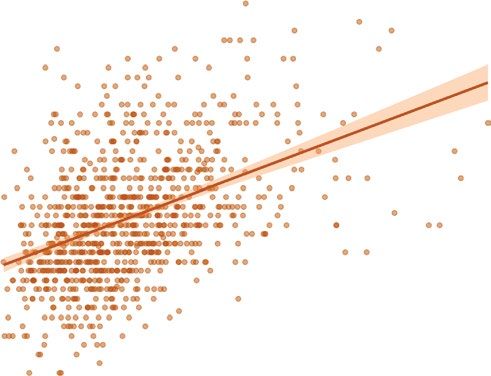
Articles                                                                                                                                                                          NATure Aging

Table 2 | Associations between the Pace of Aging, measures of sensory–motor functional capacity and perceptions of aging
                                            Adjusted for sex                              Adjusted for sex, BMI and smoking                          Without cancer, diabetes or heart attack
                          n            β (95% CI)                       P               n           β (95% CI)                  P               n          β (95% CI)                            P
Sensory–motor capacity
 Gait speed               903          −0.33 (−0.39 to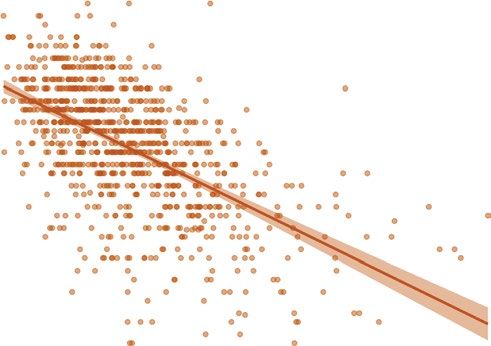
NATure Aging                                                                                                                                                      Articles
                   a                                                                          b

                                                       Cortical thickness                                                             Surface area

                                                      –0.15    0      0.15                                                         –0.15   0         0.15

                   c                                                                          d
                                           10                                                                          30

                                                                                                                       20
                                           8
                                                                                         BrainAGE (years difference)
                   log[WMH volume (mm3)]

                                                                                                                       10
                                           6

                                                                                                                        0

                                            4

                                                                                                                       –10

                                            2
                                                                                                                       –20
                                                0.5     1.0        1.5       2.0   2.5                                       0.5    1.0       1.5           2.0   2.5
                                                                PoA 26–45                                                                  PoA 26–45

Fig. 3 | Study members who were aging faster showed signs of advanced brain aging relative to slower-aging peers. a,b, The overlays display
cortical regions (in blue) whose thickness (a) or surface area (b) are significantly associated (false discovery rate corrected, two-sided test) with PoA.
Associations were tested using linear regression performed at each cortical region. c,d, The scatterplots show associations between PoA and volume of
WMH (n = 851) (c) as well as brainAGE (a measure of the difference between each study member’s chronological age and their brain age as estimated
from a machine-learning algorithm that was trained to predict chronological age from gray- and white matter measures in independent samples ranging in
age from 19 to 82; n = 868) (d)32. Scatterplots include the mean regression line ±1 s.e.m.

    Compared to peers with a slower Pace of Aging, those who                              were nearby (listening in spatialised noise–sentences test (LiSN-S)
were aging faster had slower gait speed (β = −0.33, P < 0.001; 95%                        low cue, β = −0.17, P < 0.001; 95% CI: −0.23, −0.10) and when dis-
CI: −0.39, −0.27), poorer balance (one-legged balance, β = –0.36,                         tractors were spatially distant (LiSN-S spatial advantage, β = 0.22,
P < 0.001; 95% CI: −0.42, −0.30), were slower at rising repeatedly                        P < 0.001; 95% CI: 0.15, 0.28). Finally, study members with a faster
from a chair (chair stands, β = −0.30, P < 0.001; 95% CI: −0.37, −0.24)                   Pace of Aging noticed sensory–motor difficulties in their everyday
and stepping in place (2-min step test, β = −0.28, P < 0.001; 95% CI:                     lives, self-reporting more physical limitations (36-item short-form
−0.34, −0.22), were weaker (grip strength, β = −0.05, P = 0.017; 95%                      health survey (SF-36) physical functioning scale, β = 0.29, P < 0.001;
CI: −0.09, −0.01) and had more difficulties with fine motor control                       95% CI: 0.23, 0.35).
(grooved pegboard, β = −0.27, P < 0.001; 95% CI: −0.33, −0.20).
    In addition, study members who were aging faster had dimin-                           Accelerated biological aging and negative perceptions of aging.
ished sensory abilities. Visual contrast sensitivity and hearing ability                  Age-related morbidity and mortality are not only forecasted by
are known to decline with advanced age35,39. Study members with a                         objective measures of physical and cognitive functioning. Older
faster Pace of Aging at age 45 had more difficulty visually distin-                       adults who self-report that they feel old are also more likely to sub-
guishing an object from its background on tests of contrast sensitiv-                     sequently be diagnosed with age-related disease and die at a younger
ity (β = −0.13, P < 0.001; 95% CI: −0.19, −0.07). They also had more                      age40,41. We found that study members with a faster Pace of Aging
difficulties detecting high-pitch-tones (high-frequency pure-tone                         were more likely to hold unfavorable views of aging. Table 2 reports
audiometry (HF-PTA), β = 0.17, P < 0.001; 95% CI: 0.10, 0.23)                             effect sizes, significance tests and covariate-adjusted analyses for all
and low- to mid-pitch tones (four-frequency pure-tone average                             perception measures.
(4F-PTA), β = 0.20, P < 0.001; 95% CI: 0.14, 0.26) and were worse at                          Study members with a faster Pace of Aging had more negative
hearing sentences in noisy environments when auditory distractors                         attitudes towards aging (β = −0.22, P < 0.001; 95% CI: −0.28, −0.16),

Nature Aging | VOL 1 | March 2021 | 295–308 | www.nature.com/nataging                                                                                                   301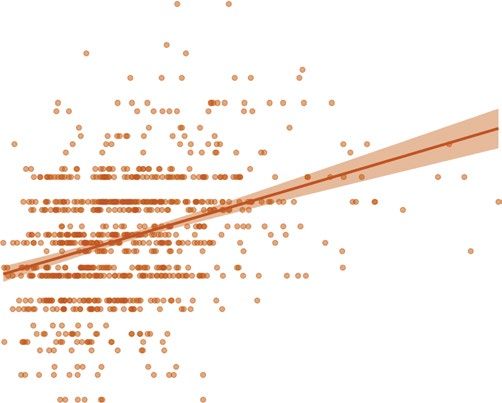
Articles NATure Aging
a Self-rated Informant-rated Researcher-rated
4 4
Researcher-rated health (z-score)
Informant-rated health (z-score)
2
2 2
Health
PoA
0 0
1
–2 –2
0 –4 –4
Poor Fair Good Very Excellent 0.5 1.0 1.5 2.0 2.5 0.5 1.0 1.5 2.0 2.5
good PoA 26–45 PoA 26–45
Health rating
4 4
Researcher-rated age appearance (z-score)
Informant-rated age appearance (z-score)
2 2 2
Age appearance
PoA
0 0
1
–2 –2
–4 –4
0
Younger Actual Older 0.5 1.0 1.5 2.0 2.5 0.5 1.0 1.5 2.0 2.5
Age appearance rating PoA 26–45 PoA 26–45
b c
4
2
Facial age (z-score)
0
–2
–4
0.5 1.0 1.5 2.0 2.5
PoA 26–45
Fig. 4 | Study members who were aging faster were perceived as less healthy and looking older when compared to slower-aging peers. a, Associations
between PoA and self-reported health (n = 927) and age appearance (n = 892), informant-rated health (n = 881) and age appearance (n = 881) and
research-worker-rated health (n = 930) and age appearance (n = 930). Violin/box plots show the distribution of PoA at each self-rating; the box borders
and midline represent the 25th, 50th and 75th percentiles, with whiskers extending to the furthest observation within 1.5 interquartile ranges of the 25th
and 75th percentiles. b, Digitally averaged composite faces made up of the ten male and female study members with the youngest (left) and oldest (right)
facial age ratings. c, Scatterplot of the association between PoA and facial age ratings by independent raters (n = 905). Scatterplots include the mean
regression line ±1 s.e.m. All graphs are adjusted for sex.
endorsing sentiments such as ‘things keep getting worse as I get −0.41, −0.29) and that they felt older than their chronological age
older’ and ‘I am not as happy now as I was when I was younger’. They (β = 0.09, P = 0.005; 95% CI: 0.03, 0.16). When asked similar ques-
self-reported that they felt less healthy (β = −0.35, P < 0.001; 95% CI: tions about the study members, informants (who knew them well)
302 Nature Aging | VOL 1 | March 2021 | 295–308 | www.nature.com/nataging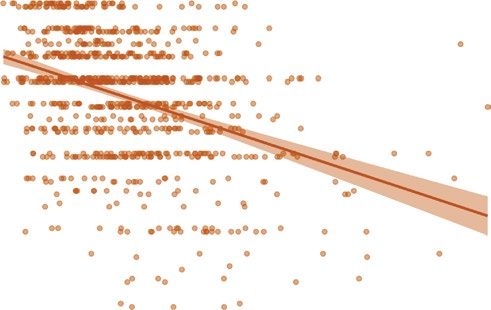
NATure Aging                                                                                                                 Articles
and research workers (who met the study members during their                   This study was not without limitations. First, these findings are
1-day unit visit) both reported that study members with a faster Pace      on the basis of a single birth cohort from New Zealand. Second, our
of Aging seemed in worse health (informant, β = −0.38, P < 0.001;          study currently lacks follow up past the age of 45. Further inves-
95% CI: −0.45, −0.32; research worker, β = −0.58, P < 0.001; 95% CI:       tigation of the Pace of Aging in diverse cohorts and older adults
−0.62, −0.52) and looked older than their age (informant, β = 0.35,        is needed. Third, the Pace of Aging was derived from 19 bio-
P < 0.001; 95% CI: 0.29, 0.41; research worker, β = 0.44, P < 0.001;       markers repeatedly assessed across 20 years, which will be infea-
95% CI: 0.38, 0.49; Fig. 4a). In addition, study members who were          sible for most studies of biological aging. However, we recently
aging faster self-reported that they looked older than their age           reported that a proxy for the Pace of Aging can now be quantified
(β = 0.10, P = 0.003; 95% CI: 0.03, 0.16) and, when solely presented       from genome-wide DNA methylation data extracted from a single
with facial images, independent raters scored study members with           cross-sectional blood draw51. This advance makes it possible for
a faster Pace of Aging as looking older than their peers (β = 0.33,        studies lacking four waves of biomarkers to incorporate the measure
P < 0.001; 95% CI: 0.26, 0.39) (Fig. 4b,c). Finally, study members         and extend this work; for example, it predicts disease and mortality
with a faster Pace of Aging were less likely to think that they would      in US and UK samples51. Fourth, while associations were consistent
live past the age of 75 (β = −0.27, P < 0.001; 95% CI: −0.33, −0.20).      across domains and measures, effect sizes were generally moderate.
                                                                           However, these moderate associations between the Pace of Aging
Sensitivity analyses. Associations with the Pace of Aging were             and midlife function probably reflect the cumulative effects of the
robust to several sensitivity analyses. First, associations with the       aging process. Therefore, if the Pace of Aging truly measures the
Pace of Aging were not attributable to being overweight or to smok-        underlying aging process, the associations reported here should
ing at age 45 (Tables 1 and 2). Second, associations with the Pace         grow larger over time, as fast and slow agers continue to diverge52.
of Aging were not driven by common age-related diseases (Tables                Within the bounds of these limitations, our findings have implica-
1 and 2). Third, associations were not dependent on the slope of           tions for geroscience theory, research and policy. Concerning theory,
any single biomarker or any family of biomarkers included in               Pace of Aging operationalises geroscience theory, unlike previous
the measure of the Pace of Aging (Supplementary Figs. 1 and 2).            methods for measuring biological aging. Many biological-age mea-
Fourth, associations were not driven by outlier values or by social        sures are derived from cross-sectional multi-age datasets and there-
class (Supplementary Fig. 3). Fifth, associations with the Pace of         fore confound age with cohort differences17,47,53. People born 70–80
Aging were best characterized as linear (Supplementary Table               years ago and people born 20–30 years ago experienced differen-
5). Sixth, associations with the Pace of Aging were not driven by          tial exposures to childhood diseases, tobacco smoke, airborne lead,
baseline differences in health at age 26 (intercept; Supplementary         antibiotics, anti-inflammatory medications and poorer nutrition.
Table 6). Finally, associations with the Pace of Aging were approxi-       Cross-sectional biological-age measures can also be confounded by
mately equal in males and females (Supplementary Fig. 4 and                acute illness that is not aging. In contrast, the Pace of Aging has four
Supplementary Table 7).                                                    key features that discriminate age-related biological decline during
                                                                           adulthood (desired signal) versus health difficulties arising in early
Discussion                                                                 life from biomarker-altering exposures (noise), or acute illness near
Chronological age is a poor proxy for biological age, even in midlife.     the time of blood draw (noise). Pace of Aging reflects (1) simultane-
Here, in a population-representative birth cohort without variation        ous decline in several organ systems, (2) decline in one direction
in chronological age, we found that study members varied widely in         that does not show recovery that would indicate acute illness, (3)
their Pace of Aging. Furthermore, study members who had a faster           decline that continues over 20 years and (4) decline in people all
Pace of Aging in midlife exhibited signs of advanced brain aging,          born the same year, unconfounded by cohort effects.
experienced more cognitive difficulties, had diminished sensory–               We find that a faster rate of biological aging, assessed across sev-
motor functional capacity and had more negative perceptions of             eral organ systems, throughout midlife, is associated with several
aging. Sensitivity analyses supported our hypothesis that the Pace         measures of functional impairment and frailty risk that have estab-
of Aging is a robust indicator of the cumulative, progressive and          lished links to morbidity and mortality in older adults. The breadth
gradual deterioration across organ systems that underlies biological       of these associations is consistent with the geroscience hypothesis
aging. Together, these findings support at least two conclusions: (1)      depicting accelerated aging as a common cause of age-related chronic
meaningful variation in biological aging can be measured in midlife        disease. Further research is needed to test whether interventions in
and (2) people with a faster rate of biological aging across the first     humans can slow biological aging in midlife and reduce long-term
half of the lifespan are more likely to experience age-related func-       risk for age-related chronic disease. Interventions that can achieve
tional impairment by midlife. These findings reinforce the question        even mild slowing of biological aging promise to improve quality of
of whether midlife is a window of opportunity for the mitigation           life in older adults while yielding substantial healthcare savings17,54.
of age-related disease42–44. We have shown that biological aging in            Concerning research and policy, current efforts aimed at
midlife is meaningful, yet further research is needed to determine         improving biological aging measurements are driven primarily by
whether biological aging in midlife is still malleable. Randomized         the need to test emerging anti-aging biotechnology46,55,56. While
trials are beginning to test this possibility45,46.                        our findings support these efforts, they also suggest that biologi-
    Four design features of the Dunedin Study support these con-           cal aging may have broader implications for society. Many social
clusions. First, all study members were born in 1972–1973, which           programs, including state pensions and Medicare in the United
allows the direct measurement of individual differences in biologi-        States, are designed to offset the economic and health burdens that
cal aging uncoupled from age and cohort effects47,48. Second, the          accrue as individuals age. Eligibility for these benefits has been
Dunedin Study has very low attrition rates; unlike many longitudi-         determined historically on the basis of chronological age. For exam-
nal studies of older adults that have selective attrition and mortality,   ple, the age for US Social Security eligibility was set to 65 in 1939
the full range of health is represented49,50. Third, the Dunedin Study     when the average life expectancy was 63.7 (ref. 57). However, with
has collected four waves of biological measurements from age 26 to         lengthening lifespans, it is important to also consider biological age.
age 45—a unique dataset allowing for more accurate estimates of            Our findings suggest that already by midlife, chronological age is
biological aging. Fourth, although age-related diseases are uncom-         a crude, poorly calibrated measure of the functional consequences
mon in midlife, study members were assessed at age 45 with a bat-          of aging. We provide evidence that disparities in biological aging
tery of established measures that are commonly used in geriatric           independent of chronological age are already linked to functional
settings to predict frailty, morbidity and mortality.                      difficulties in midlife. Furthermore, by linking the Pace of Aging to

Nature Aging | VOL 1 | March 2021 | 295–308 | www.nature.com/nataging                                                                          303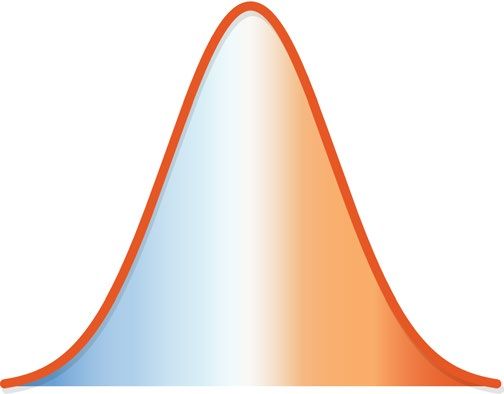
Articles                                                                                                                                         NATure Aging

both objective and subjective outcomes, we found that the Pace of                       from the Pace of Aging was entered as a covariate (Supplementary Table 6). (8)
Aging carries a phenotypic presentation with biological and social                      Finally, associations with the Pace of Aging were investigated separately for males
                                                                                        and females to investigate the possibility that there were sex-differences in these
implications. For example, study members who were in the fastest                        associations (Supplementary Fig. 4). Multiple comparisons were corrected using
quintile of the Pace of Aging had brainAGEs that were an average of                     the false discovery rate correction across all 38 sex-adjusted models presented
3.79 years older and had faces that were rated as looking 4.32 years                    in Tables 1 and 2. Analyses reported here were checked for reproducibility by an
older than those in the slowest quintile. Thus, at age 45, study mem-                   independent data-analyst who recreated the code by working from the manuscript
                                                                                        and applied it to an independently generated copy of the dataset.
bers with an accelerated Pace of Aging are simultaneously at higher
risk for health challenges and future frailty as well as age-based
discrimination.                                                                         Measuring the Pace of Aging. We had four major goals in developing the measure
                                                                                        of the Pace of Aging. (1) We sought to create a longitudinal biomarker panel
    Widespread application of biological aging measures could
                                                                                        that would capture the age-related decline of several different organ systems (for
represent an alternative to using birthdates when determining the                       example, pulmonary, renal, dental, etc.). This is essential, as the idea of measuring
allocation of healthcare and financial support for those suffering                      the Pace of Aging is derived from geroscience, a field that—in contrast to
from the sequelae of aging. For example, in the United States, there                    single-disease paradigms—aims to understand how mechanisms of aging underlie
are continuing debates about lowering the Medicare age to expand                        multiple and diverse age-related diseases. (2) For a biomarker to be included in
                                                                                        the Pace of Aging, we required evidence that each biomarker had been robustly
access to preventative healthcare58,59. Perhaps someday we will be                      associated with an age-related disease or early death in previous research. (3) We
able to use biological aging measures to guide treatment access.                        needed each biomarker to have a minimum of three waves of data to model the
With further development, geroscience could provide the concep-                         rate of decline in each biomarker using growth–curve modeling. In the Dunedin
tual tools, measurement technology and interventions required to                        Study, this meant that we had to have data going back nearly 20 years to the late
mitigate disparities in the pace of biological aging through more tai-                  1990s when we started our biobank (16 biomarkers have four waves and 3 had
                                                                                        three waves). (4) Each biomarker had to be widely and routinely used so that our
lored and just access to independence-sustaining resources.                             findings would be both translatable to clinical settings and generalizable to other
                                                                                        studies. The Pace of Aging consists of all biomarkers that met these criteria.
Methods                                                                                      Applying these criteria to the Dunedin Study biobank generated our panel
Study design and population. Participants are members of the Dunedin Study, a           of 19 biomarkers: BMI, waist–hip ratio, glycated hemoglobin, leptin, blood
longitudinal investigation of health and behavior in a representative birth cohort.     pressure (mean arterial pressure), cardiorespiratory fitness (maximal aerobic
The 1037 participants (91% of eligible births) were all individuals born between        capacity VO2Max), forced vital capacity ratio (FEV1/FVC, where FVC is
April 1972 and March 1973 in Dunedin, New Zealand, who were eligible on the             forced vital capacity), forced expiratory volume in 1 s (FEV1), total cholesterol,
basis of residence in the province and who participated in the first assessment at      triglycerides, high-density lipoprotein (HDL), lipoprotein(a), apolipoprotein
age 3 years21. The cohort represents the full range of socioeconomic status (SES) in    B100/A1 ratio, estimated glomerular filtration rate (eGFR), blood urea nitrogen
the general population of New Zealand’s South Island and, as adults, matches the        (BUN), high-sensitivity C-reactive protein (hsCRP), white blood cell count,
New Zealand National Health and Nutrition Survey on key adult health indicators         mean periodontal attachment loss (AL) and the number of dental-caries-affected
(for example, BMI, smoking and general practitioner visits) and the New Zealand         tooth surfaces (tooth decay). Biomarkers were assayed at the age 26, 32, 38 and
Census of citizens of the same age on educational attainment21,60. The cohort           45 assessments. The Pace of Aging reported here represents an extension of a
is primarily white (93%, self-identified), matching South Island demographic            previously reported measure that used 18 biomarkers assayed at ages 26, 32 and
characteristics. General assessments were performed at birth as well as ages 3, 5, 7,   38 (ref. 22). Here we add a recently completed fourth measurement wave of data,
9, 11, 13, 15, 18, 21, 26, 32 and 38 years and, most recently (completed April 2019),   at age 45, totaling 19 biomarkers. We added measures of leptin and caries-affected
at age 45 years, when 938 of the 997 study members (94.1%) still alive participated.    tooth surfaces, both of which have now been assessed at multiple waves allowing
At the age 26-, 32-, 38- and 45-year assessments, biomarkers were collected that        growth–curve modeling. Telomere length was dropped because of an emerging and
make up the Pace of Aging. Study members with data available at age 45 years did        yet-unresolved field-wide debate about its measurement61. Specifically, telomere
not differ significantly from other living participants in terms of childhood SES       length derived from qPCR has been determined to be unsuitable for use in large
or childhood neurocognitive functioning (see attrition analysis in Supplementary        epidemiological studies because of high levels of measurement error. Details on
Figs. 1 and 2). At each assessment, each participant was brought to the research        biomarker measurements are provided in Supplementary Table 1.
unit for interviews and examinations. The research staff makes standardized                  We calculated each study member’s Pace of Aging in three steps. In the
ratings, informant questionnaires are collected and administrative records are          first step, we transformed the biomarker values to a standardized scale. For
searched. Written informed consent was obtained from cohort participants and            each biomarker at each wave, we standardized values according to the age 26
study protocols were approved by the institutional ethical review boards of the         distribution (that is set to mean of 0 and s.d. of 1). Standardization was conducted
participating universities. This study follows the Strengthening the Reporting          separately for men and women. Standardized biomarker values greater than zero
of Observational Studies in Epidemiology (STROBE) reporting guideline.                  indicated levels that were ‘older’ and values less than zero indicated levels ‘younger’
The premise and analysis plan for this project were preregistered at https://bit.       than the average 26-year-old. To match, scores were reversed for VO2Max, FEV1/
ly/2ZVtnsq.                                                                             FVC, FEV1, eGFR and HDL cholesterol, which are known to decline with age. Over
                                                                                        the two decades of follow up, the biomarkers in the panel indicated a progressive
Statistical analysis. Unless otherwise specified, all statistical analyses were         deterioration of physiological integrity with advancing chronological age; that
completed using linear regression models in R (v.3.4.0). Unless otherwise noted,        is, their cohort mean values tended to increase (that is, worsen) from the age 26
standardized regression coefficients are reported as Pearson’s r effect sizes. All      assessment to the age 45 assessment (Fig. 2).
models were adjusted for sex. In addition, eight types of sensitivity analysis were          In the second step, we calculated each study member’s slope for each of the
performed to determine the robustness of the associations with the Pace of Aging.       19 biomarkers—the average year-on-year change observed over the two-decade
(1) In addition to sex, BMI and smoking status at age 45 were simultaneously            period. Slopes were estimated using a mixed-effects growth model that regressed
added as covariates to rule out the possibility that associations were limited to       the biomarker’s level on age. A complete list of means of biomarker slopes and
overweight individuals and smokers (Tables 1 and 2). (2) Sex-adjusted models            pairwise correlations among biomarker slopes is presented in Supplementary
were run in which all study members who had diagnosed, common age-related               Table 2. For only 4 of the 19 biomarkers we examined, cohort mean levels did
diseases (cancer, diabetes or heart attack; Tables 1 and 2) were excluded. (3)          not worsen over time, as expected on the basis of published associations with
To test the possibility that associations with the Pace of Aging were driven by a       age-related chronic disease: white blood cell count and CRP levels remained stable
particular biomarker or family of biomarkers, we investigated all associations after    with age; HDL cholesterol and apolipoprotein B100/A1 ratio improved with age.
systematically leaving out each of the 19 biomarkers in the Pace of Aging one at a      However, individual–difference slopes for these biomarkers did show the expected
time (Supplementary Fig. 1) and then after leaving out each family of biomarkers        pattern of correlation with other biomarkers’ slopes. For example, study members
one at a time (Supplementary Fig. 2). (4) To test the possibility that associations     whose apolipoprotein B100/A1 ratio increased during the follow-up period also
with the Pace of Aging were biased by the long right-hand tail of the Pace of           showed increasing adiposity, declining lung function and increasing systemic
Aging distribution, we investigated associations after Winsorizing (±2 s.d.) the        inflammation. We retained all preregistered biomarkers in the Pace of Aging
Pace of Aging and after log-transforming the Pace of Aging (Supplementary Fig.          model.
3). (5) To test the possible influence of social determinants on aging trajectories          In the third step, we combined information from the 19 slopes of the
as confounding factors, childhood SES was added as a covariate (Supplementary           biomarkers to calculate each study member’s personal ‘Pace of Aging’. Because
Fig. 3). (6) To test the possibility that associations with the Pace of Aging were      we did not have any a priori basis for weighting differential contributions of the
better characterized as nonlinear associations, linear and quadratic Pace of Aging      biomarkers to an overall Pace of Aging measure, we combined information using
terms were added simultaneously as independent variables into the regression            a unit-weighting scheme (all biomarkers were standardized to have mean = 0,
models (Supplementary Table 5). (7) To test the possibility that associations with      s.d. = 1 on the basis of their age 26 distributions, so slopes were denominated in
the Pace of Aging were driven by baseline differences in health levels, the intercept   comparable units). We calculated each study member’s Pace of Aging as the sum of

304                                                                                              Nature Aging | VOL 1 | March 2021 | 295–308 | www.nature.com/nataging
NATure Aging Articles
age-dependent annual changes in biomarker Z-scores. Because the Dunedin birth mapping. This resulted in cortical thickness, surface area and hippocampal volume
cohort represents its population, its mean and distribution represent population data for 861 study members.
norms. We used these norms to scale the Pace of Aging to reflect physiological
change relative to the passage of time. We set the cohort mean Pace of Aging as White matter hyperintensities. To identify and extract the total volume of WMH,
a reference value equivalent to the physiological change expected during a single T1-weighted and FLAIR images for each participant were processed with
chronological year. Using this reference value, we rescaled Pace of Aging in terms the UBO Detector, a cluster-based, fully automated pipeline with established
of years of physiological change per chronological year (mean = 1, s.d. = 0.29). out-of-sample performance and high reliability in our data (test–retest
On this scale, cohort members ranged in their Pace of Aging from 0.4 years of ICC = 0.87)66,67. The resulting WMH probability maps were thresholded at
physiological change per chronological year (slow) to 2.4 years of physiological 0.7, which is the suggested standard. WMH volume is measured in Montreal
change per chronological year (fast) (Fig. 2). Neurological Institute space, thus removing the influence of differences in brain
As a sensitivity check to ensure that the geroscience definition of aging as volume on WMH volume. Because of the potential for bias and false positives
unidirectional decline fits the data, we examined biomarker patterns of change due to the thresholds and masks applied in UBO, the resulting WMH maps for
for potential nonlinearity. Three biomarkers—leptin, hsCRP and eGFR—were each study member were checked manually by two independent raters to ensure
measured at only three timepoints and could only be fit with a linear model. For that false detections did not substantially contribute to estimates of WMH
all other biomarkers, we fit an additional model that included fixed effects for volume. Visual inspections were done blind to the participants’ cognitive status.
the intercept, linear change and quadratic change, as well as random effects for Due to the tendency of automated algorithms to mislabel regions surrounding
the intercept and linear terms. For nine biomarkers, fit statistics (residual log the septum as WMH, these regions were masked manually out to further ensure
likelihood, Akaike information criterion and Bayesian information criterion) the most accurate grading possible. WMH data were excluded if study members
indicated that the linear model provided a better fit than the quadratic model. had missing FLAIR scans, multiple sclerosis, inaccurate white matter labeling or
For seven biomarkers, fit statistics indicated that the quadratic model provided a low-quality MRI data, yielding 852 datasets for analyses. In all analyses, WMH
marginally better fit than the linear model. However, for these seven biomarkers, volume was log-transformed.
the linear slope estimates extracted from the two models were highly correlated
in sex-adjusted models (waist–hip ratio: 0.99, VO2Max: 1.00, FEV1/FVC: 0.99, Diffusion-weighted imaging. Diffusion-weighted images were processed in the
FEV1: 0.99, apolipoprotein B100/A1 ratio: 0.99; BUN: 0.99; gum health: 0.99), Oxford Center for Functional MRI of the Brain (FMRIB)’s software library
leading us to conclude that we could reasonably use the linear slope estimates (http://fsl.fmrib.ox.ac.uk/fsl). Raw diffusion-weighted images were corrected for
from the models including linear fixed effects only. This is graphically apparent susceptibility artifacts, movement and eddy currents using topup and eddy. Images
in Supplementary Fig. 7, which compares the linear-only and linear + quadratic were then skull-stripped and fitted with diffusion tensor models at each voxel
growth curves. using FMRIB’s Diffusion Toolbox (http://fsl.fmrib.ox.ac.uk/fsl/fslwiki/FDT). The
resulting fractional anisotropy (FA) images from all study members were registered
Structural MRI. Image acquisition. Each participant was scanned using a Siemens nonlinearly to the FA template developed by the Enhancing Neuro Imaging
MAGNETOM Skyra (Siemens Healthcare GmbH) 3 T scanner equipped with Genetics Through Meta-Analysis consortium (ENIGMA), a minimal deformation
a 64-channel head/neck coil at the Pacific Radiology Group imaging center in target calculated across a large number of individuals68. The images were then
Dunedin, New Zealand. High-resolution T1-weighted images were obtained processed using the tract-based spatial statistics analytic method69 modified
using an MP-RAGE sequence with the following parameters: reptition time to project individual FA values onto the ENIGMA–diffusion tensor imaging
(TR) = 2,400 ms; echo time (TE) = 1.98 ms; 208 sagittal slices; flip angle, 9°; field skeleton. Following the extraction of the skeletonized white matter and projection
of view FOV = 224 mm; matrix = 256 × 256; slice thickness = 0.9 mm with no of individual FA values, ENIGMA-tractwise regions of interest, derived from the
gap (voxel size 0.9 × 0.875 × 0.875 mm3) and total scan time = 6 min and 52 s. Johns Hopkins University white matter parcellation atlas70, were transferred to
Three-dimensional fluid-attenuated inversion recovery (FLAIR) images were extract the mean FA across the full skeleton and average FA values for a total of 25
obtained with the following parameters: TR = 8000 ms; TE = 399 ms; 160 sagittal (partially overlapping) tracts. After visual inspection of all diffusion images, seven
slices; FOV = 240 mm; matrix = 232 × 256; slice thickness = 1.2 mm (voxel size study members were removed because data were collected with a 20-channel head
0.9 × 0.9 × 1.2 mm3) and total scan time = 5 min and 38 s. Additionally, a gradient coil to accommodate claustrophobia or large head size, leading to poorer diffusion
echo field map was acquired with the following parameters: TR = 712 ms; image quality; three were removed due to major incidental findings; five were
TE = 4.92 and 7.38 ms; 72 axial slices; FOV = 200 mm; matrix = 100 × 100; slice removed due to excessive (>3 mm) motion detected with eddy tool and seven were
thickness = 2.0 mm (voxel size 2 mm isotropic) and total scan time = 2 min and removed due to missing diffusion scans. This resulted in diffusion images for 854
25 s. Diffusion-weighted images providing full brain coverage were acquired study members available for analyses.
with 2.5-mm isotropic resolution and 64 diffusion-weighted directions (4,700 ms
repetition time, 110.0 ms echo time, b-value = 3,000 s mm−2, FOV = 240 mm, Brain age. We estimated brain age with a publicly available algorithm, developed
96 × 96 acquisition matrix, slice thickness = 2.5 mm). Nonweighted (b = 0) images by a different research team, which uses information about cortical anatomy to
were acquired in both the encoding (AP) and reverse encoding (PA) directions to estimate the age of a person’s brain32. This algorithm was trained on chronological
allow for echo planar imaging distortion correction. A total of 875 study members age in samples ranging from 19 to 82 years old. The algorithm has been shown
completed the MRI scanning protocol (see Supplementary Figs. 1 and 2 for to predict chronological age in multiple independent samples and to have high
attrition analyses). test–retest reliability in the Dunedin Study (ICC = 0.81)71, although it has a
documented tendency to underestimate chronological age by approximately
Image processing. Structural MRI data were analyzed using the Human 3 years among adults between chronological ages 44 and 46 years72. For this
Connectome Project (HCP) minimal preprocessing pipeline as detailed reason, we standardized the scores to the mean chronological age of the Dunedin
elsewhere62. Briefly, T1-weighted and FLAIR images were processed through Study members at the time of their scanning in the Phase-45 assessment72. In all
the PreFreeSurfer, FreeSurfer and PostFreeSurfer pipelines. T1-weighted and analyses, we used brainAGE, which is the difference between each Study member’s
FLAIR images were corrected for readout distortion using the gradient echo field estimated brain age and their chronological age. An older brainAGE results when
map, coregistered, brain-extracted and aligned together in the native T1 space the predicted brain age is older than the study member’s chronological age and is
using boundary-based registration63. Images were then processed with a custom presumed to reflect accelerated brain aging. Data from six study members were
FreeSurfer recon-all pipeline that is optimized for structural MRI with a higher excluded due to major incidental findings or previous head injuries (for example,
resolution than 1 mm isotropic. Finally, recon-all output was converted into large tumors or extensive damage to the brain or skull). This resulted in brainAGE
CIFTI (Connectivity Informatics Technology Initiative) format and registered scores for 869 study members available for analyses.
to a common 32k_FS_LR mesh using MSM-sulc64. Outputs of the minimal
preprocessing pipeline were checked visually for accurate surface generation by Cognitive functioning. Neurocognitive functioning. The Wechsler Adult
examining each participant’s myelin map, pial surface and white matter boundaries. Intelligence Scale-IV (WAIS-IV)73 was administered to each participant at age 45
years, yielding the IQ. In addition to full-scale IQ, the WAIS-IV yields indexes
Cortical thickness, surface area and hippocampal volume. For each participant, of four specific cognitive function domains: processing speed, working memory,
the mean cortical thickness and surface area were extracted from each of the 360 perceptual reasoning and verbal comprehension.
cortical parcels in the HCP-MPP1.0 parcellation30. Average cortical thickness
and average surface area (reported in Tables 1 and 2) were calculated as the Child-to-adult neurocognitive decline. The Wechsler Intelligence Scale for Children–
average value of cortical thickness and surface area across these 360 parcels. Revised (WISC–R)74 was administered to each participant at ages 7, 9 and 11 years,
Regional cortical thickness and surface area measures have each been found to yielding the IQ. To increase baseline reliability, we averaged each participant’s
have excellent test–retest reliability in this sample (mean intraclass correlation three scores. We measured cognitive decline by studying IQ scores at midlife
coefficients (ICCs) = 0.85 and 0.99 respectively)65. Bilateral hippocampal volume after controlling for IQ scores in childhood (as a sensitivity analysis, in addition
was extracted from the FreeSurfer ‘aseg’ parcellation. Of the 875 study members to analyzing residualized change, we also analyzed ‘change scores’ assessed as the
for whom data were available, 4 were excluded due to major incidental findings difference between adult IQ and childhood IQ and obtained the same substantive
or previous injuries (for example, large tumors or extensive damage to the brain/ and statistically significant results). We focus on change in the overall IQ given
skull), 9 due to missing FLAIR or field map scans and 1 due to poor surface evidence that age-related slopes are correlated across all cognitive functions,
Nature Aging | VOL 1 | March 2021 | 295–308 | www.nature.com/nataging 305You can also read