LCA of a Nordex Windfarm with Delta4000 Turbines - On behalf of Nordex Group - Nordex SE
←
→
Page content transcription
If your browser does not render page correctly, please read the page content below
LCA of a Nordex
Windfarm with
Delta4000 Turbines

 On behalf of Nordex Group
Client: Nordex Group

Title: Life Cycle Assessment of a Nordex Wind Farm with
 Delta4000 Turbines
Report version: v2.1

Report date: 20/03/2020

© Sphera Solutions, Inc.

On behalf of Sphera Solutions, Inc., and its subsidiaries

Document prepared by

Manfred Russ [] mruss@sphera.com

Principal Consultant 23/03/2020 phone +49-711-341817-413

Lana Reid-McConnell

Consultant

Quality assurance by

Dr Peter Shonfield

Technical Director

Under the supervision of

Dr Sabine Deimling

Sector & Team Lead Food, Agriculture & Renewable Materials

This report has been prepared by Sphera Solutions, Inc. (“Sphera”) with reasonable skill and diligence within the
terms and conditions of the contract between Sphera and the client. Sphera is not accountable to the client, or any
others, with respect to any matters outside the scope agreed upon for this project.

Sphera disclaims all responsibility of any nature to any third parties to whom this report, or any part thereof, is made
known. Any such, party relies on the report at its own risk. Interpretations, analyses, or statements of any kind made
by a third party and based on this report are beyond Sphera’s responsibility.

If you have any suggestions, complaints, or any other feedback, please contact us at servicequality@sphera.com.

LCA of a Nordex Windfarm with Delta4000 turbines 2 of 78
Table of Contents

Table of Contents ................................................................................................................................ 3
List of Figures ...................................................................................................................................... 6
List of Tables ....................................................................................................................................... 7
List of Acronyms .................................................................................................................................. 8
Glossary .............................................................................................................................................. 9
1. Goal of the Study ....................................................................................................................... 11
2. Scope of the Study .................................................................................................................... 12
 2.1. Product System ................................................................................................................. 12

 2.2. Product Functions and Functional Unit ............................................................................. 13

 2.3. System Boundary .............................................................................................................. 14

 2.3.1. Time Coverage .......................................................................................................... 15
 2.3.2. Technology Coverage ............................................................................................... 15
 2.3.3. Geographical Coverage............................................................................................. 15
 2.4. Allocation ........................................................................................................................... 16

 2.4.1. Multi-output Allocation ............................................................................................... 16
 2.4.2. End-of-Life Allocation ................................................................................................ 16
 2.5. Cut-off Criteria ................................................................................................................... 17

 2.6. Selection of LCIA Methodology and Impact Categories.................................................... 18

 2.7. Interpretation to Be Used .................................................................................................. 21

 2.8. Data Quality Requirements ............................................................................................... 21

 2.9. Type and format of the report ............................................................................................ 21

 2.10. Software and Database ..................................................................................................... 22

 2.11. Critical Review ................................................................................................................... 22

3. Life Cycle Inventory Analysis .................................................................................................... 23
 3.1. Data Collection Procedure ................................................................................................ 23

 3.2. Model Overview ................................................................................................................. 25

 3.3. Delta4000 Wind Farm ....................................................................................................... 26

 3.3.1. Overview of Product System ..................................................................................... 26
 3.3.2. Delta4000 Turbine ..................................................................................................... 26

LCA of a Nordex Windfarm with Delta4000 turbines 3 of 78
3.3.3. Cables........................................................................................................................ 29
 3.3.4. Substation .................................................................................................................. 30
 3.3.5. Logistics (distribution from manufacturing to site) ..................................................... 30
 3.3.6. Installation ................................................................................................................. 30
 3.3.7. Use phase ................................................................................................................. 31
 3.3.8. End-of-Life ................................................................................................................. 32
 3.4. Background Data ............................................................................................................... 34

 3.4.1. Fuels and Energy ...................................................................................................... 34
 3.4.2. Raw Materials and Processes ................................................................................... 35
 3.4.3. Transportation ........................................................................................................... 37
 3.4.4. Waste treatment ........................................................................................................ 38
 3.5. Data assumptions and data gaps ...................................................................................... 38

4. LCIA Results .............................................................................................................................. 41
 4.1. Overall Results .................................................................................................................. 42

 4.2. Detailed Results ................................................................................................................ 44

 4.2.1. Climate change (fossil) .............................................................................................. 44
 4.2.2. Photochemical Ozone Formation .............................................................................. 47
 4.2.3. Acidification potential, terrestrial and freshwater ....................................................... 48
 4.2.4. Eutrophication, Freshwater ....................................................................................... 49
 4.2.5. Eutrophication, Marine............................................................................................... 50
 4.2.6. Eutrophication, Terrestrial ......................................................................................... 51
 4.2.7. Resource use, energy carriers .................................................................................. 52
 4.2.8. Resource use, minerals and metals .......................................................................... 53
 4.2.9. Respiratory inorganics ............................................................................................... 54
 4.3. Sensitivity Analysis ............................................................................................................ 55

 4.4. Scenario Analyses ............................................................................................................. 56

 4.4.1. Lifetime and net AEP value (scenario 1) ................................................................... 56
 4.4.2. Foundation with high ground water level (scenario 2) ............................................... 57
 4.4.3. End-of-life allocation (scenario 3) .............................................................................. 57
 4.4.4. Tolerances for thickness of steel pipes for tower sections (scenario 4) .................... 58
 4.4.5. Risk assessment for sulphur hexafluoride gas in switchgears (scenario 5) .............. 59
 4.5. Return on Energy (RoE) .................................................................................................... 60

5. Interpretation ............................................................................................................................. 61
 5.1. Identification of Relevant Findings .................................................................................... 61

 5.2. Assumptions and Limitations ............................................................................................. 66

 5.3. Results of Sensitivity and Scenario Analysis .................................................................... 66

LCA of a Nordex Windfarm with Delta4000 turbines 4 of 78
5.3.1. Sensitivity Analysis .................................................................................................... 66
 5.3.2. Scenario Analysis ...................................................................................................... 66
 5.4. Data Quality Assessment .................................................................................................. 68

 5.4.1. Precision and Completeness ..................................................................................... 68
 5.4.2. Consistency and Reproducibility ............................................................................... 69
 5.4.3. Representativeness ................................................................................................... 69
 5.5. Model Completeness and Consistency ............................................................................. 69

 5.5.1. Completeness ............................................................................................................ 69
 5.5.2. Consistency ............................................................................................................... 69
 5.6. Conclusions, Limitations, and Recommendations ............................................................ 69

 5.6.1. Conclusions ............................................................................................................... 69
 5.6.2. Limitations ................................................................................................................. 70
References ........................................................................................................................................ 72
Annex A: Critical Review Statement ............................................................................................. 74

LCA of a Nordex Windfarm with Delta4000 turbines 5 of 78
List of Figures

Figure 1: Product system – view of Delta4000 N149/ 4.0-4.5 turbine............................................... 12
Figure 2: Overview of system boundaries ......................................................................................... 14
Figure 3: Schematic representations of the cut-off and substitution approaches ............................. 17
Figure 4: LCA model from GaBi ........................................................................................................ 25
Figure 5: Composition breakdown by mass for the Delta4000 turbine ............................................. 26
Figure 6: Turbine electrical components in GaBi .............................................................................. 28
Figure 7: Drivetrain (incl. bearings, gears, etc.) for turbine in GaBi .................................................. 28
Figure 8: Nacelle wind turbine components in Gabi.......................................................................... 29
Figure 9: Relative impact potentials for the full life cycle per functional unit, production of 1 kWh
electricity............................................................................................................................................ 43
Figure 10: Life cycle climate change (g CO2 eq.) per functional unit ............................................... 45
Figure 11: Delta4000 Turbine impact breakdown - climate change (8.3 g CO2 eq.) ........................ 46
Figure 12: Life cycle photochemical ozone formation – human health (mg NMVOC eq.) per
functional unit .................................................................................................................................... 47
Figure 13: Life cycle acidification, terrestrial and freshwater (x10 -6 moles of H+ eq.) per functional
unit ..................................................................................................................................................... 48
Figure 14: Life cycle eutrophication freshwater (kg P eq.) per functional unit .................................. 49
Figure 15: Life cycle eutrophication marine (kg N eq.) per functional unit ........................................ 50
Figure 16: Life cycle eutrophication terrestrial (Mole of N eq.) per functional unit ............................ 51
Figure 17: Life cycle resource use, energy carriers (J) per functional unit ....................................... 52
Figure 18: Life cycle resource use, mineral and metals (kg Sb eq.) per functional unit ................... 53
Figure 19: Life cycle respiratory inorganics (disease incidences) per functional unit ....................... 54
Figure 20: Sensitivity analysis on parameters (cable length and wind farm life time) ...................... 55
Figure 21: Climate change for scenarios 1.1 and 1.2 (Lifetime and net AEP) .................................. 56
Figure 22: Climate change for scenario 2.1 (Foundation ground water level) .................................. 57
Figure 23: Climate change for scenario 3.1 (end-of-life allocation) .................................................. 58
Figure 24: Climate change for scenarios 4.1 and 4.2 (steel pipe thickness) .................................... 59
Figure 25: Climate change for scenario 5.1 (% of SF6 gas leak) ...................................................... 60

LCA of a Nordex Windfarm with Delta4000 turbines 6 of 78
List of Tables

Table 1: System boundaries.............................................................................................................. 15
Table 2: Impact category descriptions .............................................................................................. 19
Table 3: Sub-plans used to build the GaBi model ............................................................................. 25
Table 4: Mass composition of turbine components required to fulfil functional unit .......................... 26
Table 5: Data for resources/ processes required for installation stage ............................................. 30
Table 6: Key energy datasets used in inventory analysis ................................................................. 34
Table 7: Key material and process datasets used in inventory analysis........................................... 35
Table 8: Transportation and road fuel datasets ................................................................................ 37
Table 9: Key waste treatment datasets used in inventory analysis .................................................. 38
Table 10: Impact potentials for the full life cycle of the product system per functional unit, production
of 1 kWh of electricity ........................................................................................................................ 42
Table 11: Heat map of full life cycle for baseline scenario (100% = cradle through to the use phase,
Decommissioning = % of cradle to use phase) ................................................................................. 62
Table 12: Heat map for Delta4000 component contribution across all impact categories ................ 64
Table 13: PEF 3.0 Normalisation of Nordex wind farm and German and Swedish Grid mix............ 65
Table 14: Summary of climate change potential for the life cycle of all scenario analysis ............... 67

LCA of a Nordex Windfarm with Delta4000 turbines 7 of 78
List of Acronyms

AEP Annual Energy Production
AP Acidification Potential
CML Centre of Environmental Science at Leiden
EF Environmental Footprint
EoL End-of-Life
EP Eutrophication Potential
GaBi Ganzheitliche Bilanzierung (German for holistic balancing)
GHG Greenhouse Gas
GWP Global Warming Potential
HV high voltage
IEC International Electrotechnical Commission
ILCD International Cycle Data System
ISO International Organization for Standardization
LCA Life Cycle Assessment
LCI Life Cycle Inventory
LCIA Life Cycle Impact Assessment
MV medium voltage
NMVOC Non-Methane Volatile Organic Compound
tkm ton-kilometer
VOC Volatile Organic Compound

LCA of a Nordex Windfarm with Delta4000 turbines 8 of 78
Glossary

Life cycle

A view of a product system as “consecutive and interlinked stages … from raw material acquisition
or generation from natural resources to final disposal” (ISO 14040:2006, section 3.1). This includes
all material and energy inputs as well as emissions to air, land and water.
Life Cycle Assessment (LCA)
“Compilation and evaluation of the inputs, outputs and the potential environmental impacts of a
product system throughout its life cycle” (ISO 14040:2006, section 3.2)
Life Cycle Inventory (LCI)
“Phase of life cycle assessment involving the compilation and quantification of inputs and outputs
for a product throughout its life cycle” (ISO 14040:2006, section 3.3)
Life Cycle Impact Assessment (LCIA)
“Phase of life cycle assessment aimed at understanding and evaluating the magnitude and
significance of the potential environmental impacts for a product system throughout the life cycle of
the product” (ISO 14040:2006, section 3.4)
Life cycle interpretation
“Phase of life cycle assessment in which the findings of either the inventory analysis or the impact
assessment, or both, are evaluated in relation to the defined goal and scope in order to reach
conclusions and recommendations” (ISO 14040:2006, section 3.5)
Functional unit

“Quantified performance of a product system for use as a reference unit” (ISO 14040:2006, section
3.20)
Allocation

“Partitioning the input or output flows of a process or a product system between the product system
under study and one or more other product systems” (ISO 14040:2006, section 3.17)
Closed-loop and open-loop allocation of recycled material
“An open-loop allocation procedure applies to open-loop product systems where the material is
recycled into other product systems and the material undergoes a change to its inherent properties.”
“A closed-loop allocation procedure applies to closed-loop product systems. It also applies to open-
loop product systems where no changes occur in the inherent properties of the recycled material. In
such cases, the need for allocation is avoided since the use of secondary material displaces the use
of virgin (primary) materials.”
(ISO 14044:2006, section 4.3.4.3.3)

LCA of a Nordex Windfarm with Delta4000 turbines 9 of 78
Foreground system

“Those processes of the system that are specific to it … and/or directly affected by decisions
analysed in the study.” (JRC, 2010, p. 97) This typically includes first-tier suppliers, the
manufacturer itself and any downstream life cycle stages where the manufacturer can exert
significant influence. As a general rule, specific (primary) data should be used for the foreground
system.
Background system
“Those processes, where due to the averaging effect across the suppliers, a homogenous market
with average (or equivalent, generic data) can be assumed to appropriately represent the respective
process … and/or those processes that are operated as part of the system but that are not under
direct control or decisive influence of the producer of the good….” (JRC, 2010, pp. 97-98) As a
general rule, secondary data are appropriate for the background system, particularly where primary
data are difficult to collect.
Critical Review

“Process intended to ensure consistency between a life cycle assessment and the principles and
requirements of the International Standards on life cycle assessment” (ISO 14044:2006, section
3.45).

LCA of a Nordex Windfarm with Delta4000 turbines 10 of 78
1. Goal of the Study The Nordex Group is a world leading wind turbine manufacturer, renowned for its investment in R&D and the resulting technical excellence of its products. The wind turbine to be analysed in this study is the newest turbine developed by Nordex, the Delta4000. As well as producing technologically-leading products, Nordex is also concerned with minimising its impact on the environment and is seeking to better understand the sustainability performance of its products through a life cycle perspective. The product system to be assessed in this study is the N149/4.0-4.5, the latest development of the successful Delta4000 series, which is the culmination of over 35 years of experience in the sector. Nordex Group has commissioned Sphera, a sustainability, environmental health & safety software and consulting company, to carry out a life cycle assessment (LCA) of an exemplary Delta4000 wind farm. The objectives of this LCA study are to: Develop Nordex’s understanding of the environmental performance of the Delta4000 wind farm Identify environmental “hot spots” associated with the life cycle of the wind farm Inform design choices for future development of the Delta4000 and other wind turbine designs Assist the company with setting environmental targets. The intended audience for the study is both internal and external to the Nordex Group (e.g. including employees, customers, investors, rating agencies, certifiers). The results of this study are not intended to be used in comparative assertions intended to be disclosed to the public. This LCA has been conducted according to the requirements of ISO 14044 (ISO, 2006) and has undergone critical review by an independent reviewer. LCA of a Nordex Windfarm with Delta4000 turbines 11 of 78
2. Scope of the Study

 The following sections describe the general scope of the project to achieve the stated goals. This
 includes, but is not limited to, the identification of specific product systems to be assessed, the
 product function, functional unit and reference flows, the system boundary, allocation procedures,
 and cut-off criteria of the study.

 2.1. Product System

 This study evaluates an exemplary Nordex wind farm in Sweden, which uses N149/4.0-4.5 turbines
 that are part of the Delta4000 turbines series. The N149/4.0-4.5 turbine is one of the Nordex
 Group’s highest yielding onshore turbine for light and medium wind regions and has an energy yield
 up to 28% higher than that of the company’s previous N131/3600 model.

 Figure 1: Product system – view of Delta4000 N149/ 4.0-4.5 turbine

 The N149/4.0-4.5 turbine has a standard maximum output of between 4.0-4.5 MW, project-specific
 even up to 4.8 MW, and so is adaptable to the respective grid operator’s individual requirements,
 along with local wind conditions and noise restraints. This allows for further optimisation when
 several of these turbines are deployed in a wind farm, where each turbine can adapt to its unique
 position to maximise the wind energy harnessed based on the local conditions.

 LCA of a Nordex Windfarm with Delta4000 turbines 12 of 78
A typical wind farm has a lifetime of around 20 years, depending on the local site conditions of the
wind farm. This time period has been used as the baseline for this study. The towers available offer
hub heights of 105, 125 and 164 metres, however this study focuses on the 105 m hub height. The
rotor sweep is 17,460 m2 with a blade diameter of 149.1 m. The turbine can be operated at sites
with average temperatures in a “normal” climate range and is adaptable to temperatures as low as
minus 20 degrees Celsius. In the cold climate variant, the turbine can be operated also down to
minus 30 degrees Celsius.
The turbine is currently one of the quietest turbines on the market for its power rating of 4.0-4.5 MW
and for the class of light wind sites. The maximum sound power level of the N149/4.0-4.5 lies
between 103.6 dB(A) and 106.1 dB(A). In addition to this, at sites with lower permissible sound
power requirements, the turbine has the potential to operate under a broader range of sound-
optimising modes e.g. for just under 3 MW nominal power the sound power level lies at max. 96.5
dB(A).

2.2. Product Functions and Functional Unit

In LCA studies, the functional unit quantifies and describes the performance of a product system
and is used as the basis for reporting results.
The function of a wind farm is to generate electricity by harnessing wind energy. As such, the
functional unit for this study has been defined as:

 The generation of 1 kWh of electrical energy (net) considering the full lifetime of the
 wind farm (Delta4000 turbines), located in an exemplary Swedish scenario and operating
under low wind conditions (IEC wind class III), and thereafter distributed to a 110kV electrical
 grid.

The wind farm design is based on a predefined project landscape. The assessed site is a low wind
site (IEC wind class III) which is defined as less than 7.5 m/s average wind speed at hub height
(actual value applied in this study: average wind speed at hub height 6.8 m/s). Site-specific
parameters for losses and uncertainties are considered using a net annual energy production (AEP)
calculation.
The certified standard lifetime of Delta4000 turbines is 20 years. In principle, the lifetime of those
turbines can be extended by 10 years to a total lifetime of 30 years, according to the method of life
time extensions and the related advisory opinions by TÜV Nord and TÜV Süd (TÜV Nord CERT,
2018) and (TÜV Süd Industrie Service, 2019). The applied lifetime of turbines in a wind farm follows
site-specific conditions. For the assessed wind farm of this study, the CoE landscape for Sweden
defines a lifetime of 25 years applying the method of lifetime extension by 5 years.
Thus, this functional unit allows for an average energy production to be determined based on-site-
specific parameters for a location in Sweden. The baseline assumption for the wind farm lifetime is
25 years, but a reduced lifetime of 20 years and an extended lifetime of 30 years have been
considered in a sensitivity analysis. In LCAs on onshore wind turbines, the lifetime is often defined
with 20 years as base case.

LCA of a Nordex Windfarm with Delta4000 turbines 13 of 78
2.3. System Boundary

The full life cycle of the turbine has been considered, from cradle-to-grave, i.e., from the point at
which raw materials are extracted from the environment through to manufacturing, installation,
operation and end-of-life.
An overview of the system boundaries of the study can be found in Figure 2. The study accounts for
the whole product, including packaging. This includes the extraction and production of raw
materials, the manufacturing of these materials into the finished product with packaging, the
transportation and distribution of the product for use and end-of-life stages, the use stage and the
end-of-life stage including recycling and final disposal.
The local system boundary for the wind farm ends with the connection to the electricity grid. The
turbines in the wind farm are connected via MV (medium voltage) cables to the substation. The
substation transforms the electricity to 110kV (high voltage). The HV cable connects the wind farm
to the grid.
Transport is included for inbound raw materials to the manufacturing sites and then distribution of
the product system from the manufacturing site to the location of the wind farm. Transport was also
included from the wind farm to end-of-life processing.

Figure 2: Overview of system boundaries

The system boundaries have been summarised in Table 1, detailing stages both included and
excluded.

LCA of a Nordex Windfarm with Delta4000 turbines 14 of 78
Table 1: System boundaries Included Excluded Raw material production Employee commuting Fabrication of raw materials into parts and components Manufacturing Installation, Associated infrastructure such as roads Operation End-of-life The boundary for the study is at the connection point to the grid. As such, electrical losses due to the voltage elevation in the substation as well as due to the distribution with the MV and HV cables inside and outside the wind farm have been included in the study. The boundary is taken to be the point at which the wind farm produces an equivalent of 1 kWh to be transmitted into the grid. Impacts associated with employee commuting have been excluded as these are expected to be negligible for a manufactured product. However, all transports associated with the maintenance done by service teams and the replacement of parts during the service life of the turbines have been included. The following sections describe the intended time, technology and geographical references that were aimed for at the start of the study. The actual data that were collected and used in the study are described in Chapter 3. How well these data match the requirements stated below is assessed in Chapter 5. 2.3.1. Time Coverage The intended time reference for the study is to assess the operation of the Nordex wind farm (Delta4000 turbines) in 2019. The results of the study should remain valid until significant technological changes occur. 2.3.2. Technology Coverage The study aims to assess the current technology and materials used to develop and operate the Nordex wind farm (Delta4000 turbines). The technology represented in the study is representative of some of the leading wind turbines available internationally. 2.3.3. Geographical Coverage The study focuses on assessing the Nordex wind farm (Delta4000 turbines) in Sweden. This is a light wind site with IEC wind class III, which is defined as having an average wind speed of less than 7.5 m/s at hub height. LCA of a Nordex Windfarm with Delta4000 turbines 15 of 78
2.4. Allocation 2.4.1. Multi-output Allocation No allocation has been necessary in relation to the foreground data used in this study as no co- products or by-products are generated. Allocation within background data (energy and materials) from the GaBi 2019 databases is documented online (Sphera, 2019). 2.4.2. End-of-Life Allocation End-of-life allocation follows the requirements of ISO 14044, section 4.3.4.3. These address the question of how to assign impacts from virgin production processes to material that is recycled and used in future product systems. Two main approaches are commonly used in LCA studies to account for end-of-life recycling and recycled content. Cut-off approach – burdens or credits associated with material from previous or subsequent life cycles are not considered i.e., are “cut-off”. Therefore, scrap input to the production process is considered to be free of burdens but, equally, no credit is received for scrap available for recycling at end-of-life. Hence this approach rewards the use of recycled content but does not reward end-of-life recycling. Substitution approach – this approach is based on the perspective that material that is recycled at end-of-life will substitute for an equivalent amount of virgin material. A credit is given to account for the benefits of this substitution. However, this also means that burdens equivalent to this credit should be assigned to scrap used as an input to the production process, with the overall result that the impact of recycled granulate is the same as the impact of virgin material. Hence this approach rewards end-of-life recycling but does not reward the use of recycled content. The substitution approach has been selected as the baseline method in this study as we consider this to be most appropriate for the main materials used to construct wind turbines, where there is significant demand for recycled materials generated at end-of-life (e.g. steel). This follows the recommendations provided in the GHG Protocol Product Life Cycle Accounting and Reporting Standard (WRI, 2011) and in the LCI methodology report of the worldsteel association (worldsteel, 2017). Metals, especially steel, is the dominating material group for Delta4000 turbines. An explanation of how the substitution approach has been implemented in the LCA model is provided below. The cut-off approach has been modelled in a scenario analysis and is also described below. Short description of the substitution approach which has been selected as the baseline method in this study: Material recycling (substitution approach): Open scrap inputs from the production stage are subtracted from scrap to be recycled at end-of-life to result in the net scrap output from the product life cycle. This remaining net scrap is sent to material recycling. The original burden of the primary material input is allocated between the current and subsequent life cycle using the mass of recovered secondary material to scale the substituted primary material, i.e., applying a credit for the substitution of primary material so as to distribute burdens appropriately among the different product life cycles. These subsequent process steps are modelled using industry average inventories. LCA of a Nordex Windfarm with Delta4000 turbines 16 of 78
Energy recovery (substitution approach): In cases where materials are sent to waste incineration,
they are linked to an incineration inventory dataset that accounts for waste composition and heating
value as well as for regional efficiencies and heat-to-power output ratios. Credits are assigned for
power and heat outputs using the regional grid mix and thermal energy from natural gas. The latter
represents the cleanest fossil fuel and therefore results in a conservative estimate of the avoided
burden.
Landfilling (substitution approach): In cases where materials are sent to landfills, they are linked to
an inventory that accounts for waste composition, regional leakage rates, landfill gas capture as
well as utilisation rates (flaring vs. power production). A credit is assigned for power output using
the regional grid mix.

Short description of the cut-off approach that has been modelled in a scenario analysis:
Material recycling (cut-off approach): Any open scrap inputs into manufacturing remain
unconnected. The system boundary at end-of-life is drawn after scrap collection to account for the
collection rate, which generates an open scrap output for the product system. The processing and
recycling of the scrap is associated with the subsequent product system and is not considered in
this study.
Energy recovery & landfilling (cut-off approach): Any open scrap inputs into manufacturing remain
unconnected. The system boundary includes the waste incineration and landfilling processes
following the polluter-pays-principle. In cases where materials are sent to waste incineration, they
are linked to an inventory that accounts for waste composition and heating value as well as for
regional efficiencies and heat-to-power output ratios. In cases where materials are sent to landfills,
they are linked to an inventory that accounts for waste composition, regional leakage rates, landfill
gas capture as well as utilisation rates (flaring vs. power production). No credits for power or heat
production are assigned.

 (i) Cut-off approach (scrap inputs and outputs (ii) Substitution approach (credit given for net scrap
 are not considered) arising)

Figure 3: Schematic representations of the cut-off and substitution approaches

2.5. Cut-off Criteria

No cut-off criteria have been defined for this study. The system boundary was defined based on
relevance to the goal of the study. For the processes within the system boundary, as much

LCA of a Nordex Windfarm with Delta4000 turbines 17 of 78
available energy and material flow data have been included in the model as possible. In cases
where no matching life cycle inventories are available to represent a flow, proxy data have been
applied based on conservative assumptions regarding environmental impacts.
The choice of proxy data is documented in Chapter 3.4. The influence of these proxy data on the
results of the assessment has been carefully analysed and is discussed in Chapter 5. For a small
number of materials, data have been omitted entirely. The impact of these omissions is discussed in
Chapter 5.

2.6. Selection of LCIA Methodology and Impact Categories

The impact assessment categories and other metrics considered to be of high relevance to the
goals of the project are shown in Table 2. The impact methodologies used to evaluate each impact
category are a selection of those used in the European Commission’s Product Environmental
Footprint initiative (latest version, EF3.0, see (PEF METHOD 2019, 2019)) that are considered
more relevant for the assessed product system. These are considered to be the most robust and up
to date available for the respective impact categories.
Global warming potential was chosen because of its high public and institutional interest and being
generally deemed to be the most pressing environmental issue of our time. The global warming
potential impact category has been assessed based on the current IPCC characterisation factors
taken from the 5th Assessment Report (IPCC, 2013) for a 100-year timeframe (GWP100) as this is
currently the most commonly used metric [1]. In this study, the impacts covering the fossil related
part of the climate change are considered. The biogenic and land use related parts are not
considered. The global warming potential results related to the photosynthetically bound carbon
(also called biogenic carbon) and the release of that carbon during the use or end-of-life phase as
CO2 and/or CH4 is balanced out to zero as the complete life cycle of the system is analysed and
relevant materials including biogenic carbon are thermally treated in end-of-life (so. no CH4
emissions in EoL). Direct land use change is not considered for the foreground system of this study,
so that part of GWP effects are not analysed. Indirect land use change has not been considered
due to the high uncertainties in determining indirect effects.
Eutrophication, acidification, and photochemical ozone creation potentials were chosen because
they are closely connected to air, soil, and water quality and capture the environmental burdens
associated with commonly regulated emissions such as NO x, SO2, VOC, and others.
Resource use, energy carriers and minerals and metals were chosen as these often correlate
closely with many other environmental impact categories and are directly relevant to issues relating
to fuel supply, energy efficiency, choice of feedstocks and consumption of non-renewable
resources. Similarly, resource use, minerals and metals were selected as wind turbines are heavily
dependent on such materials.
Respiratory inorganic emissions have been included as there is increasing recognition of the
significant disease burden posed by exposure to particulate matter both indoors and outdoors (Lim,
2012). The health effects of inhalable particulate matter include respiratory and cardiovascular

[1]The climate change methodology used in PEF is based on the latest IPCC reports but also includes the
effects of “climate-carbon feedback” which results in higher global warming potentials but is also associated
with greater uncertainty. In this study we have used the more commonly-applied emission factors from the
same report that exclude climate-carbon feedback effects.

LCA of a Nordex Windfarm with Delta4000 turbines 18 of 78
effects, such as aggravation of asthma, respiratory symptoms and an increase in hospital
admissions, as well as mortality from cardiovascular and respiratory diseases and from lung cancer.
The Montreal Protocol on Substances that Deplete the Ozone Layer was implemented in 1989 with
the aim of phasing out emissions of ozone depleting gases. The protocol has been ratified by all
members of the United Nations – an unprecedented level of international cooperation. With a few
exceptions, use of CFCs, the most harmful chemicals have been eliminated, while a complete
phase out of less active HCFCs will be achieved by 2030. As a result, it is expected that the ozone
layer will return to 1980 levels between 2050 and 2070. In addition, no ozone-depleting substances
are emitted in the foreground system under study. For these reasons, ozone depletion potential has
not been considered in this study.
Water scarcity has not been analysed in this study as some of the most relevant background
datasets for the assessed system from worldsteel do not have a closed water balance which leads
to negative water scarcity results for the steel LCIs. Besides the LCI weakness concerning water,
those worldsteel datasets are considered as highest quality LCI datasets for steel products as they
represent up-to-date primary data from steel manufacturing sites around the globe.
All impact categories for toxicity and human health effects have not been analysed in this study
because they are considered both as not scientifically robust and not relevant for the assessed
system.
Land use has not been considered in this study. An exemplary wind farm in Sweden is analysed but
not an actually installed wind farm. Impacts regarding land use or direct and indirect land use
change (e.g. for climate change) are depending on site-specific conditions which have not been
defined in that detail (e.g. soil quality) for this study.

Table 2: Impact category descriptions

 Impact Description Unit Reference
 Category
 Climate change A measure of greenhouse gas emissions, kg CO2 (IPCC, 2013;
 fossil such as carbon dioxide (CO2) and methane equivalent Guinée, et
 (Global (CH4). These emissions are causing an al., 2002)
 warming increase in the absorption of radiation
 potential, emitted by the earth, increasing the natural
 GWP100) greenhouse effect. This may in turn have
 adverse impacts on ecosystem health,
 human health and material welfare.
 Eutrophication Eutrophication covers all potential impacts of Freshwater: kg (Seppälä J.,
 potential, excessively high levels of macronutrients, P equivalent 2006; Posch,
 freshwater, the most important of which nitrogen (N) and Marine: kg N 2008; Struijs,
 marine and phosphorus (P). Nutrient enrichment may equivalent 2009)
 terrestrial cause an undesirable shift in species Terrestrial:
 composition and elevated biomass Mole of N
 production in freshwater, marine and equivalent
 terrestrial ecosystems. In aquatic
 ecosystems increased biomass production
 may lead to depressed oxygen levels,
 because of the additional consumption of
 oxygen in biomass decomposition.

LCA of a Nordex Windfarm with Delta4000 turbines 19 of 78
Acidification A measure of emissions that cause Mole of H+ (Seppälä J.,
 potential, acidifying effects to the environment. The equivalent 2006; Posch,
 terrestrial and acidification potential is a measure of a 2008)
 freshwater molecule’s capacity to increase the
 hydrogen ion (H+) concentration in the
 presence of water, thus decreasing the pH
 value. Potential effects include fish mortality,
 forest decline and the deterioration of
 building materials.
 Photochemical A measure of emissions of precursors that kg NMVOC (Van Zelm
 ozone contribute to ground level smog formation equivalent R., 441-453)
 formation, (mainly ozone O3), produced by the reaction
 human health of VOC and carbon monoxide in the
 presence of nitrogen oxides under the
 influence of UV light. Ground level ozone
 may be injurious to human health and
 ecosystems and may also damage crops.
 Resource use, A measure of the total amount of non- MJ (Guinée, et
 energy carriers renewable primary energy extracted from al., 2002; van
 the earth. Resource use is expressed in Oers, de
 energy demand from non-renewable Koning,
 resources including both fossil sources (e.g. Guinée, &
 petroleum, natural gas, etc.) and uranium for Huppes,
 nuclear fuel. Efficiencies in energy 2002)
 conversion (e.g. power, heat, steam, etc.)
 are taken into account.
 Resource use, The consumption of non-renewable kg Sb (van Oers,
 mineral and resources leads to a decrease in the future equivalent de Koning,
 metals availability of the functions supplied by these Guinée, &
 resources. Depletion of mineral resources Huppes,
 and non-renewable energy resources are 2002)
 reported separately. Depletion of mineral
 resources is assessed based on ultimate
 reserves.
 Respiratory Respiratory inorganics/ Particulate matter Disease (Fantke,
 inorganics emissions and secondary aerosols formed in incidences 2016)
 the atmosphere from NOx, NH3 and SO2
 emissions contribute to human health
 impacts in the form of respiratory disease
 and related effects.

It shall be noted that the above-mentioned impact categories represent impact potentials, i.e., they
are approximations of environmental impacts that could occur if the emissions would (a) actually
follow the underlying impact pathway and (b) meet certain conditions in the receiving environment
while doing so. In addition, the inventory only captures that fraction of the total environmental load
that corresponds to the functional unit (relative approach). LCIA results are therefore relative
expressions only and do not predict actual impacts, the exceeding of thresholds, safety margins, or

LCA of a Nordex Windfarm with Delta4000 turbines 20 of 78
risks. The results for each impact are presented in isolation, without reference to other impact categories, before final conclusions and recommendations are made. 2.7. Interpretation to Be Used The results from the study have been interpreted according to the Goal and Scope. The interpretation addresses the following topics: Identification of significant findings, such as the main process steps, materials, and emissions contributing to the overall results. Evaluation of completeness, sensitivity, and consistency to justify the exclusion of data from the system boundaries as well as the use of proxy data. Conclusions, limitations and recommendations. 2.8. Data Quality Requirements The data used to create the inventory model shall be as precise, complete, consistent, and representative as possible with regards to the goal and scope of the study under given time and budget constraints. Measured primary data are considered to be of the highest precision, followed by calculated data, literature data, and estimated data. The goal is to model all relevant foreground processes using measured or calculated primary data. Completeness is judged based on the completeness of the inputs and outputs per unit process and the completeness of the unit processes themselves. The goal is to capture all relevant data in this regard. Consistency refers to modelling choices and data sources. The goal is to ensure that differences in results reflect actual differences between product systems and are not due to inconsistencies in modelling choices, data sources, emission factors, or other artefacts. Reproducibility expresses the degree to which third parties would be able to reproduce the results of the study based on the information contained in this report. The goal is to provide enough transparency with this report so that third parties are able to approximate the reported results. This ability may be limited by the exclusion of confidential primary data and access to the same background data sources. Representativeness expresses the degree to which the data matches the geographical, temporal, and technological requirements defined in the study’s goal and scope. The goal is to use the most representative primary data for all foreground processes and the most representative industry-average data for all background processes. Whenever such data were not available (e.g., no industry-average data available for a certain country), best- available proxy data were employed. An evaluation of the data quality with regard to these requirements is provided in Chapter 5 of this report. 2.9. Type and format of the report In accordance with the ISO requirements (ISO, 2006) this document aims to report the results and conclusions of the LCA completely, accurately and without bias to the intended audience. The results, data, methods, assumptions and limitations are presented in a transparent manner and in sufficient detail to convey the complexities, limitations, and trade-offs inherent in the LCA to the LCA of a Nordex Windfarm with Delta4000 turbines 21 of 78
reader. This allows the results to be interpreted and used in a manner consistent with the goals of
the study.

2.10. Software and Database

The LCA model was created using the GaBi 9 Software system for life cycle engineering (software
version 9.2), developed by Sphera Solutions Inc. The GaBi 2019 LCI database is the basis for most
of the life cycle inventory data for modelling the background system. Datasets from the database
version with service pack status SP39 are applied.

2.11. Critical Review

A review, according to ISO 14044, section 6.2, has been carried out for this study. The Critical
Review Statement can be found in Annex A.
Names and affiliations of reviewer:

Matthias Schulz
Accredited Reviewer on behalf of DEKRA Assurance Services GmbH

LCA of a Nordex Windfarm with Delta4000 turbines 22 of 78
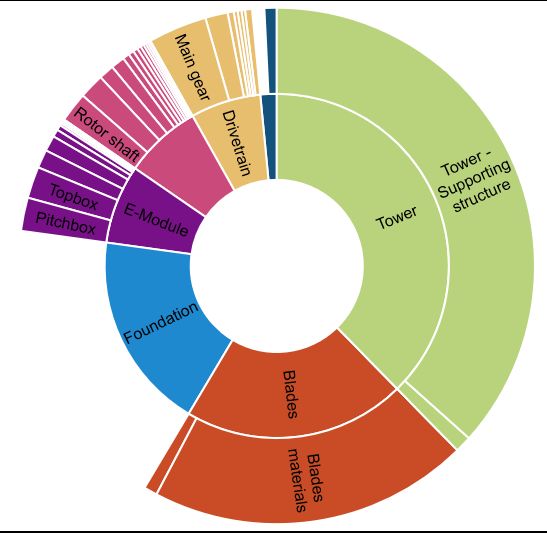
3. Life Cycle Inventory Analysis 3.1. Data Collection Procedure Primary data were collected using customised data collection templates from Sphera, which were sent out by email to the respective data providers. Upon receipt, each data collection template was cross-checked for completeness and plausibility using mass balance, stoichiometry, as well as internal and external benchmarking. Where gaps, outliers, or other inconsistencies were found, Sphera engaged with the data provider to resolve these issues. Various data providers were engaged within Nordex. The following experts indicated with their respective roles and functions have supported the data collection: Senior Expert Global Sustainability Mgmt. Senior Master Data & Process Manager Senior Engineer, Wind & Site Assessment Expert Engineer, Mechanical Drive Expert Engineer, Electrical Drive Expert Engineer, Blade Material & Design Expert Engineer, Tower & Foundation Expert Engineer, Mechanics, Tower & Loads Head of Design Mechanics, Design Mechanics Head of Repowering & Projects Group Lead PM (Project Management) Development Group Lead Sales Coordination Service Configuration Manager HSE Manager Facility Manager Energy Manager Project Manager Most of the collected data is based on in-house expertise at Nordex as OEM of wind turbines and wind farm service provider for maintenance and repair. Some data is collected from tier 1 suppliers. The main areas of data collection comprised the following components or life cycle phases: Delta4000 turbine Top-down approach: bill of material (BOM) for complete turbine (“digital twin”) with the respective configuration for the project design (wind farm in Sweden) Bottom-up approach: bill of materials (BOM) for single components and parts of the Delta4000 turbine collected from different expert engineers who are responsible for a part of a component or a complete component Components of the turbine are foundation, tower, blades, drivetrain, nacelle, E-module (electrics and electronics) LCA of a Nordex Windfarm with Delta4000 turbines 23 of 78
Additional data collected per component: coatings, surface treatments, machining processes, connection of components (e.g. welding or bolts), specifications regarding material type and shape/design of parts, location of supplied materials and parts Nordex manufacturing sites for blades and nacelle in Germany– data collected for energies and utilities consumption, emissions, generated waste/wastewater and waste/wastewater treatment Majority of the data is measured; data uncertainties and gaps are closed with calculations and in few cases with estimations. Cable connections and substation BOM for MV cable in wind farm BOM for HV cable as connection to grid BOM for substation Length of cable connections from PM experts Majority of the data is measured; data gaps are closed with calculations and estimations. Logistics (transportation of all wind farm components, construction materials and machines to wind farm site) Data on transport means and distances Data collection comprises all components of the turbine, cables, foundation materials, construction machines like cranes (main and auxiliary crane), infrastructure like lifting equipment and containers, construction materials for construction of drive-way and set-up area Majority of the data is calculated and estimated. Installation Data based on the balance of plant (BoP) of the wind farm Data collection comprises the cabling trenches excavation, the diesel consumption considering all construction machines like cranes, telehandler and working platforms, diesel consumption of aviation lights, consumption of construction materials for lifting areas and crane pads, waste and waste treatment of installation activities, construction and material consumption of wind farm access roads Majority of the data is calculated, some data is measured and estimated. Use phase Data collection comprises net AEP, maintenance, replacement and related transports Majority of the data is measured, data gaps are closed with calculations and estimations Decommissioning / End-of-Life Data collection comprises the demolition of the wind farm including cranes, excavators and trucks, the transport to a recycler or disposer depending on the material group. Data on rotor blade recycling is collected at neocomp. Majority of the data is calculated, some data is measured and estimated Most of the data that is described in the following sections is confidential as it is sensitive primary industry data, so it was transferred to the Annex B. The confidential Annex B was part of the report version used for the critical review, but it is not part of the published report. LCA of a Nordex Windfarm with Delta4000 turbines 24 of 78
3.2. Model Overview

This section provides an overview of the LCA model developed in GaBi. Each life cycle stage was
modelled separately to allow for analysis and identification of hot spots throughout the life cycle.
Table 3 and Figure 4 show the LCA model created in GaBi for the wind farm analysed in this study.
The model was split into 7 key life cycle sections which are further detailed in Section 3.3.

Table 3: Sub-plans used to build the GaBi model

Item number Component Life Cycle Stage
1 Delta4000 – N149/4.0-4.5 Raw materials / Manufacturing
2 Cables for wind farm Raw materials / Manufacturing
3 Substation Raw materials / Manufacturing
4 Logistics Transport
5 Installation Installation
6 Use Phase Use
7 Decommissioning End-of-life

Figure 4: LCA model from GaBi

LCA of a Nordex Windfarm with Delta4000 turbines 25 of 78
You can also read