How realistic are the wakes of scaled wind turbine models? - WES
←
→
Page content transcription
If your browser does not render page correctly, please read the page content below
Wind Energ. Sci., 6, 961–981, 2021
https://doi.org/10.5194/wes-6-961-2021
© Author(s) 2021. This work is distributed under
the Creative Commons Attribution 4.0 License.

                                   How realistic are the wakes of
                                    scaled wind turbine models?
             Chengyu Wang, Filippo Campagnolo, Helena Canet, Daniel J. Barreiro, and Carlo L. Bottasso
               Wind Energy Institute, Technische Universität München, 85748 Garching bei München, Germany
                                 Correspondence: Carlo L. Bottasso (carlo.bottasso@tum.de)

                                 Received: 30 October 2020 – Discussion started: 10 November 2020
                              Revised: 7 April 2021 – Accepted: 17 May 2021 – Published: 30 June 2021

        Abstract. The aim of this paper is to analyze to which extent wind tunnel experiments can represent the be-
        havior of full-scale wind turbine wakes. The question is relevant because on the one hand scaled models are
        extensively used for wake and farm control studies, whereas on the other hand not all wake-relevant physical
        characteristics of a full-scale turbine can be exactly matched by a scaled model. In particular, a detailed scaling
        analysis reveals that the scaled model accurately represents the principal physical phenomena taking place in the
        outer shell of the near wake, whereas differences exist in its inner core. A large-eddy simulation actuator-line
        method is first validated with respect to wind tunnel measurements and then used to perform a thorough com-
        parison of the wake at the two scales. It is concluded that, notwithstanding the existence of some mismatched
        effects, the scaled wake is remarkably similar to the full-scale one, except in the immediate proximity of the
        rotor.

1    Introduction                                                        probes to particle image velocimetry (PIV) (Meinhart,
                                                                         1999) and scanning lidars (van Dooren et al., 2017),
The simulation of wind turbine wakes in wind tunnels has                 whereas measurements of comparable accuracy and res-
been gaining increasing interest in recent years. In fact, since         olution are today hardly possible at full scale. Addi-
wakes represent a major form of coupling within a wind                   tionally, time flows faster in a scaled experiment than
plant, understanding their behavior and accurately simulat-              at full scale (Bottasso and Campagnolo, 2021; Canet
ing their effects are today problems of central importance               et al., 2021; Campagnolo et al., 2020), which means that
in wind energy science, with direct practical implications on            a large informational content can be accumulated over
design, operation and maintenance. Recent studies include                relatively short periods of time.
the analysis of single and multiple interacting wakes – see,
for example, the review in Bottasso and Campagnolo (2021)             – Models can be designed ad hoc to achieve specific
or, among others, Whale et al. (1996), Chamorro and Porté-              goals and can be extensively instrumented (Bottasso and
Agel (2009, 2010), Bartl and Sætran (2016), Bastankhah and              Campagnolo, 2021), while layouts and scenarios can
Porté-Agel (2016), Tian et al. (2018), Campagnolo et al.                be readily changed to explore different operating con-
(2016), Bottasso et al. (2014a), Campagnolo et al. (2020),              ditions of interest.
Wang et al. (2020c) and references therein.
                                                                      – Costs are limited, even for highly sophisticated models,
   Wind tunnel testing offers some unique advantages over
                                                                        also because there are no energy production losses as it
full-scale field testing.
                                                                        is often the case in the field; additionally, the costs of
    – The ambient conditions are repeatable and – at least to           sophisticated wind tunnel facilities are typically amor-
      some extent – controllable.                                       tized by their use for several different applications over
                                                                        long periods of time.
    – Detailed flow measurements are possible with a
      plethora of devices, from standard pressure and hot-wire

Published by Copernicus Publications on behalf of the European Academy of Wind Energy e.V.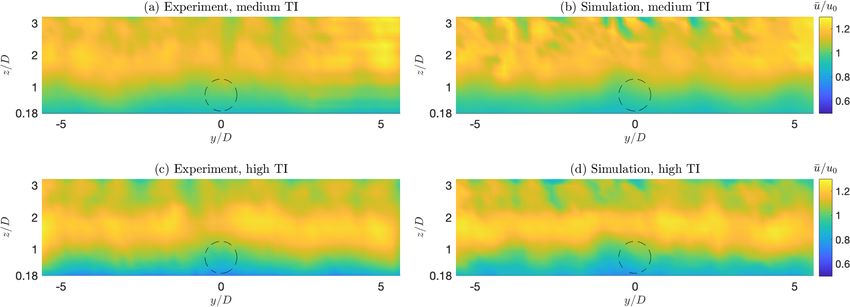
962                                               C. Wang et al.: How realistic are the wakes of scaled wind turbine models?

  – Open datasets can be shared within the research com-           turbine showed that wake behavior is unaffected by this pa-
    munity and collaborations are facilitated, since there are     rameter when it is larger than circa 105 . However, in reality
    no – or few – constraints from intellectual property than      the behavior of the blades and, as a consequence, of the wake
    when real wind turbine data are used.                          is much more strongly affected by the chord-based Reynolds
                                                                   number, as initially discussed in Bottasso et al. (2014a). In
Testing in the controlled and repeatable environment of the        fact, the much lower Reynolds regime of a small-scale model
wind tunnel is today contributing to the understanding of the      blade compared to a full-scale machine implies very dif-
physical processes at play, generates valuable data for the        ferent aerodynamic characteristics of the airfoils, which in
validation and calibration of mathematical models, and offers      turn drive a number of specific design choices of the scaled
opportunities for the verification of control technologies.        model (Bottasso and Campagnolo, 2021; Canet et al., 2021).
    However, notwithstanding these and other unique advan-         Notwithstanding the differences caused by the chord-based
tages, a major question still hovers over the wind tunnel sim-     Reynolds number mismatch, it is relatively easy – as shown
ulation of wakes: how faithful are these wakes to the actual       more in detail later on – to match the main processes taking
ones in the field? In fact, in private conversations these au-     place in the outer shell of the near wake, as well as the ones
thors have often been questioned on the actual usefulness of       that govern its breakdown and the characteristics of the far
wind tunnel testing, based on a perceived lack of realism of       wake. On the other hand, several mismatched effects do ex-
these scaled experiments. Indeed, some skepticism is justi-        ist in the central core of the near wake. Dimensional analysis
fied and completely understandable: simulation codes are be-       also expresses the scaling relationships that allow the map-
ing calibrated and validated with respect to wind tunnel mea-      ping of scaled quantities into equivalent full-scale ones, and
surements, and wind farm control techniques are being com-         vice versa.
pared and evaluated in wind tunnel experiments. Therefore,            Based on the understanding provided by dimensional anal-
it is important to quantify the level of realism of wind tunnel    ysis and wake physics, full-scale models are designed in this
simulated wakes and to identify with better clarity what as-       work to match some of the G1 scaled turbine parameters.
pects faithfully represent the full-scale truth and what aspects   Various versions of these models are considered, ranging
do not.                                                            from a more realistic full-scale turbine – with a larger num-
    A thorough and complete answer to this question is proba-      ber of mismatched effects – to less realistic ones that however
bly still out of reach today. In fact, detailed inflow and wake    match a larger set of quantities of the scaled model.
measurements of a full-scale turbine would be necessary,              The full-scale models are then simulated with the LES-
with a level of detail comparable to the ones achievable in        ALM code, using the same exact numerical methods and al-
the tunnel. Lidar technology is making great progress (Zhan,       gorithmic parameters used for the scaled simulations. These
2020) and might soon deliver suitable datasets. It should be       wind turbine models are also exposed to the same identical
a goal of the scientific and industrial communities to com-        ambient turbulent inflow used for the scaled model. The un-
pletely open such future datasets to research, which would         derlying assumption is that, since the code was found to be
surely greatly favor the scientific advancement of the field.      in very good agreement with measurements obtained in the
In the meanwhile, however, some partial answers to the ques-       scaled experiments, the same code based on the same numer-
tion of wake realism can still be given. This is the main goal     ical setup should deliver results of similar accuracy even at
of the present paper.                                              full scale. This assumption cannot be formally proven at this
    This study considers the Technische Universität                stage, but it seems to be very reasonable, and it is probably
München (TUM) G1 scaled wind turbine (Bottasso                     the only possible approach that can be pursued in the absence
and Campagnolo, 2021) and a dataset obtained with this ma-         of a detailed full-scale dataset.
chine in the boundary layer wind tunnel of the Politecnico di         Finally, the numerically simulated scaled and full-scale
Milano in Italy. A large-eddy simulation (LES) actuator-line       wakes are compared. The analysis considers wind-aligned
method (ALM) (Wang et al., 2019) is used to simulate the           and misaligned conditions, typical of wake steering con-
wind tunnel experiments, including the passive generation          trol applications, and various metrics, including wake shape,
of a sheared turbulent inflow. The code has been validated         path, speed profile, Reynolds shear stresses, power available
with respect to the present and other similar measurements.        and wind direction modification due to the curled wake in
    Following Bottasso and Campagnolo (2021) and Canet             misaligned conditions. This detailed comparison is used to
et al. (2021), dimensional analysis and wake physics are           quantify the degree of similarity among the different mod-
used here to review the main factors driving wake behav-           els and across the various metrics. Since the models differ
ior. The same analysis also reveals which physical aspects         by known mismatched effects, this also helps pinpoint and
of full-scale wakes cannot be matched at the reduced scale         explain any source of discrepancy.
and with the considered experimental setup. A first analysis          The paper is organized according to the following plan.
of scaling was performed by Chamorro et al. (2016), consid-        Section 2 uses dimensional analysis and wake physics to
ering the effects caused by the mismatch of the rotor-based        identify the quantities that can be exactly matched between
Reynolds. Experimental results based on a miniature wind           scaled and full-scale models, the ones that can only be par-

Wind Energ. Sci., 6, 961–981, 2021                                                    https://doi.org/10.5194/wes-6-961-2021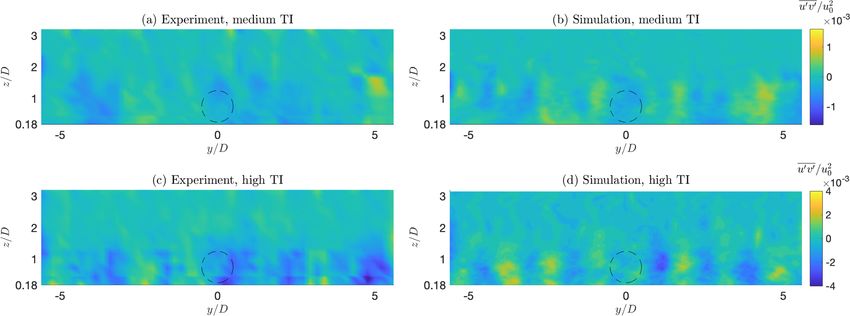
C. Wang et al.: How realistic are the wakes of scaled wind turbine models?                                                     963

tially matched, the ones that are unmatched, and those that                non-dimensional spanwise distribution of 0 (and,
are neglected from the present analysis. Next, Sect. 3 de-                 hence, also its non-dimensional spanwise gradient)
scribes the scaled experimental wind turbine and its full-scale            ensures that the two rotors shed the same trailing
counterparts, which include various modifications to high-                 vorticity.
light the effects of specific mismatches. Section 4 describes              The root of the G1 blade is located further away from
the numerical simulation model, including the generation of                the rotor axis than a typical full-scale machine, due to
the turbulent inflow in the wind tunnel. Results and detailed              the space required for housing the pitch actuation sys-
comparisons among the scaled and the full-scale models are                 tem in the hub. The resulting effects caused on the wake
reported in Sect. 5. Finally, Sect. 6 summarizes the main find-            were investigated by developing two different full-scale
ings of this work.                                                         models: one with the exact same non-dimensional cir-
                                                                           culation of the G1 and one with more typical full-scale
2     Scaling                                                              values, as discussed later.
                                                                       – Rotor-based Strouhal number. The rotor-based Strouhal
The matched, partially matched, unmatched and neglected
                                                                         number St = f D/V is matched, where f is a char-
physical effects of the scaled and full-scale models are re-
                                                                         acteristic frequency and D = 2R is the rotor diameter.
viewed next. Quantities referred to the scaled model are in-
                                                                         This definition of the Strouhal number has been recently
dicated with the subscript (·)M , while quantities referred to
                                                                         shown to characterize the enhanced wake recovery ob-
the full-scale physical system are indicated with the sub-
                                                                         tained by mixing, both in the case of dynamic induction
script (·)P . Scaling is defined by two parameters (Bottasso
                                                                         control (Frederik et al., 2020a) and by cyclic pitch exci-
and Campagnolo, 2021; Canet et al., 2021): the length scale
                                                                         tations (Frederik et al., 2020b).
factor nl = lM /lP , where l is a characteristic length (for ex-
ample the rotor radius R); and the time compression ratio
nt = tM /tP , where t is time. In the present case nl = 1/162.1      2.2   Approximatively matched quantities
and nt = 1/82.5. A more complete treatment of scaling for            The following quantities or effects are very nearly, but not
wind turbine rotors is given in Bottasso and Campagnolo              exactly, matched.
(2021) and Canet et al. (2021).
                                                                       – Thrust coefficient. The thrust coefficient is defined as
                                                                         CT = T /(1/2ρAV 2 ), where T is the thrust force, ρ is
2.1    Matched quantities                                                air density and A = π R 2 is the rotor swept area. The
    – Inflow. The ambient flow is obtained by simulating the             thrust characterizes to a large extent the speed deficit in
      passive generation of turbulence in the wind tunnel, as            the wake. In misaligned conditions, it is also the prin-
      explained in Sect. 4.2; the developed flow is sampled              cipal cause for the lateral deflection of the wake. The
      on a rectangular plane, which becomes the inflow of                thrust coefficient is very nearly matched, whereas the
      the scaled turbine simulations. For the full-scale turbine         power coefficient is not (as discussed later). In fact, the
      simulations, the sides of the rectangular inflow area are          latter strongly depends on airfoil efficiency, which is af-
      geometrically scaled by nl , while time is scaled by nt            fected by the chord-based Reynolds number mismatch
      and speed V as VM /VP = nl /nt , resulting in a flow with          between the two models. On the other hand, drag has
      exactly the same identical characteristics (e.g., shear,           only a limited effect on thrust, which as a result is very
      turbulence intensity, integral length scale) at the two            similar in the models at the two scales.
      scales.                                                          – Dynamic spanwise vortex shedding. During transients,
                                                                         spanwise vorticity is shed that is proportional to the
    – Tip speed ratio (TSR). The TSR is defined as λ =
                                                                         temporal gradient of the circulation. To match the
      R/V , where  is the rotor speed. TSR determines not
                                                                         spanwise vortex shedding of a rotor, the matching of
      only the triangle of velocity at the blade sections, but
                                                                         (1/RV )d0/dτ should be ensured (Bottasso and Cam-
      also the pitch of the helical vortex filaments shed by the
                                                                         pagnolo, 2021; Canet et al., 2021), where τ is a non-
      blade tips.
                                                                         dimensional time (for example, τ = r t, with r be-
    – Non-dimensional          circulation.       The        non-        ing a reference rotor speed), equal for both the full and
      dimensional circulation is defined as 0(r)/(RV ) =                 scaled models.
      1/2(c(r)/R)CL (r)(W (r)/V ), where CL is the lift                    Rewriting the non-dimensional circulation as
      coefficient, c the local chord, W the local flow speed                0     1c

                                                                                           W UP UT

      relative to the blade section and r is the spanwise                      =      CLα            − θ   ,                    (1)
                                                                           RV     2R       V    W2
      blade coordinate (Burton et al., 2011). Each blade
      sheds trailing vorticity that is proportional to the spatial         with CLα being the lift curve slope, the dynamic span-
      (spanwise) gradient d0/dr. Therefore, matching the                   wise vortex shedding condition implies the matching of

https://doi.org/10.5194/wes-6-961-2021                                                       Wind Energ. Sci., 6, 961–981, 2021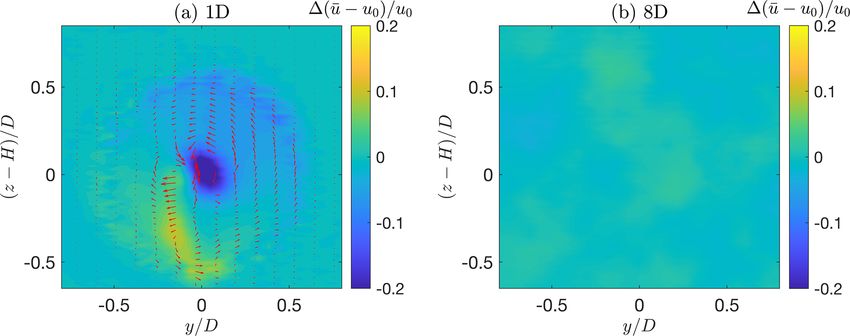
964                                                  C. Wang et al.: How realistic are the wakes of scaled wind turbine models?

      the non-dimensional time rates of change of the sec-             2.3   Unmatched quantities
      tional tangential and perpendicular flow components UP
      and UT , with W 2 = UP2 + UT2 , and of the pitch angle θ .       The following quantities cannot be matched based on the cur-
      The flow speed component tangential to the rotor disk            rent experimental setup and scaling choices.
      is UT = r + uT , where uT contains terms due to wake              – Chord-based Reynolds number. The chord-based def-
      swirl and yaw misalignment. The flow speed component                 inition of the Reynolds number reads Re = ρW c/µ,
      perpendicular to the rotor disk is UP = (1 − a)V + uP ,              where µ is the fluid viscosity. The Reynolds num-
      where a is the axial induction factor, and uP is the con-            ber mismatch can be computed as ReM /ReP = n2l /nt ,
      tribution due to yaw misalignment and vertical shear.                which is equal to 1/318.5 in the present case. This
      A correct similitude of dynamic vortex shedding is en-               implies that the blades of the G1 model operate in a
      sured if the non-dimensional time derivatives λ0 , a 0 , u0P ,       very different regime than the ones of the full-scale
      u0T and θ 0 are matched, where (·)0 = d · /dτ .                      blade (Lissaman, 1983). To mitigate these effects, the
      Matching of λ0 is ensured here by the fact that the two              G1 blade has a larger chord than the full-scale one
      rotors operate at the same TSR in the same inflow; ad-               and uses ad hoc low-camber airfoils specifically con-
      ditionally, the simulations were conducted by prescrib-              ceived for low-Reynolds-number flows (Bottasso and
      ing the rotor rotation (i.e., without a controller in the            Campagnolo, 2021; Selig, 2003). Additionally, note that
      loop), so that 0 = 0. The term a 0 accounts for dynamic             the scaling relationship of the rotor speed is M /P =
      changes in the induction, which are due to the speed                 1/nt . Therefore, by increasing the rotor speed of the
      of actuation (of torque and blade pitch) and the intrin-             model M (which has the effect of accelerating time
      sic dynamics of the wake. The speed of actuation is                  by reducing the ratio nt ), one can lower the Reynolds
      not relevant in this case, due to the absence of a pitch–            mismatch (Bottasso and Campagnolo, 2021).
      torque controller. The intrinsic dynamics of the wake, as
      modeled by a first-order differential equation (Pitt and           – Power coefficient. The power coefficient is defined
      Peters, 1981), is also automatically matched thanks to               as CP = P /(1/2ρAV 3 ), where P is the aerodynamic
      the matching of the design TSR (Bottasso and Campag-                 power. The power coefficient of the scaled model is
      nolo, 2021; Canet et al., 2021). Finally, u0P and u0T are            lower than the one of the full-scale machine, because
      matched because the inflow is the same, with the ex-                 of the smaller efficiency of the airfoils at low-Reynolds
      ception of the contribution of wake swirl, which is not              regimes. Since the torque coefficient is CQ = CP /λ,
      exactly the same because of the different torque coeffi-             then also CQ is unmatched and smaller for the scaled
      cient, as noted below.                                               model than for the full-scale one, resulting in reduced
                                                                           wake swirling (Burton et al., 2011).
  – Inflow size. The cross section of the wind tunnel has
    a limited size, resulting in the blockage phenomenon,                – Tower and nacelle vortex shedding. Bluff bodies pe-
    i.e., in an acceleration of the flow between the object be-            riodically release vortices in their wakes (von Kar-
    ing tested and the sides (lateral walls and ceiling) of the            man, 1911), at a characteristic frequency proportional
    tunnel (Chen and Liou, 2011). Although this problem                    to the Strouhal number. The tower-based Strouhal num-
    is not strictly related to the scaling laws discussed here,            ber St = f d/V is matched when the tower diameter d
    it is still an effect that needs to be accounted for, espe-            is geometrically scaled. However, as noted later, the di-
    cially if the ratio of the frontal area of the tested objected         ameter of the G1 tower is larger than the one of the full-
    and the cross-sectional area of the tunnel is not negligi-             scale machine, so that frequency and size of the shed
    ble. Simulations in domains of increasingly larger cross               vortices are accordingly affected. An even larger mis-
    sections were conducted to quantify the blockage affect-               match applies to the nacelle, because of power density
    ing the experimental setup considered here.                            and miniaturization constraints.

  – Integral length scale (ILS). Relative to the size of the             – Stall delay due to rotational augmentation. Match-
    TUM G1 turbines, the wind tunnel used in this research                 ing these effects requires the matching of the blade
    (located at Politecnico di Milano, Italy) generates a full-            chord and twist distributions, of the non-dimensional
    scale ILS of approximately 142 m at hub height, which                  circulation, and of the Rossby number Ro = r/(2W )
    is respectively about 16 % and 58 % smaller that the                   (Dowler and Schmitz, 2015; Bottasso and Campag-
    lengths specified by the second edition (IEC 61400-                    nolo, 2021). While the latter two quantities are indeed
    1, 1999) and third edition (IEC 61400-1, 2005) of the                  matched, the former two are not, in order to mitigate the
    IEC 61400-1 international standards. To understand the                 chord-based Reynolds number mismatch. To quantify
    effects of this mismatch on wake behavior, simulations                 the effects of rotational augmentation on wake behavior,
    were conducted in turbulent inflows differing only in                  two versions of the full-scale turbine were developed, as
    their integral scales.                                                 explained later on.

Wind Energ. Sci., 6, 961–981, 2021                                                        https://doi.org/10.5194/wes-6-961-2021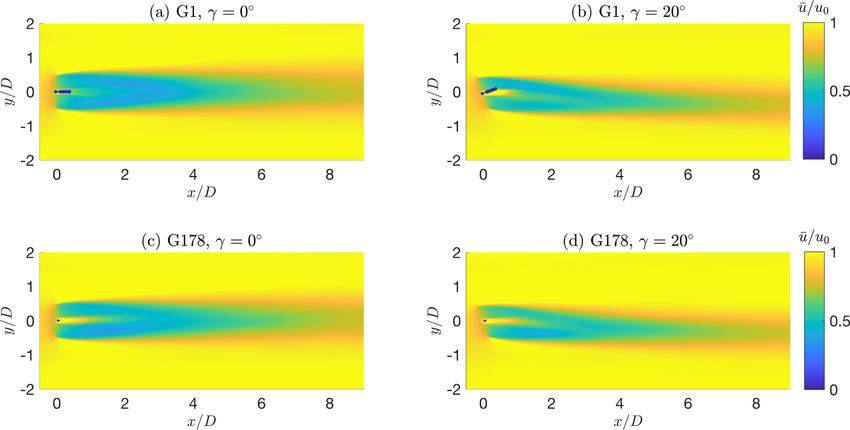
C. Wang et al.: How realistic are the wakes of scaled wind turbine models?                                                     965

  – Chord-based Mach number. The chord-based Mach                   (including the same ambient turbulent fluctuations), the tip
    number is defined as Ma = W/s, where s is the speed             vortices have the same geometry (due to a matched design
    of sound. Although this flow parameter is not matched,          TSR) and strength (due to a matched non-dimensional circu-
    compressibility effects are irrelevant for the full and         lation), and the speed deficit is also essentially the same (be-
    scaled models considered here, as for virtually all             cause of the very nearly matched thrust coefficient). Hence, it
    present-day wind turbines.                                      is reasonable to assume a nearly identical near-wake behav-
                                                                    ior of the external wake shell, given that all main processes
  – Boundary layer stability and wind veer due to the Cori-         are matched between scaled and full-scale models (with the
    olis force. The wind tunnel used in the present research        exception of the effects that the unmatched tower may have).
    can only generate neutrally stable boundary layers. Al-            The situation is different in the near-wake inner core. Here
    though atmospheric stability has a profound effect on           the root vortices combine with the effects caused by the pres-
    wakes (Abkara and Porté-Agel, 2015), this problem has           ence of the nacelle and tower. In particular, the nacelle has a
    already been studied elsewhere, and it is considered to         much larger relative frontal area, creating a different block-
    be out of scope for the present investigation. Similarly,       age (radial redirection), nacelle wake and vortex shedding.
    Coriolis effects on the inflow and wake behavior are not        Additionally, in the 20 % inboard portion of the blade, both
    represented in a wind tunnel, although they are known           the circulation and rotational augmentation effects are un-
    to have non-negligible effects on capture, loading and          matched. Finally, the mismatch of power induces a mismatch
    also on wake path (van der Laan and Sørensen, 2007).            of torque that reduces wake swirl; as shown by blade element
                                                                    momentum (BEM) theory, swirl is mostly concentrated in the
2.4   Neglected quantities                                          inner core of the wake and decays rapidly with radial position
                                                                    (Burton et al., 2011). Hence, the near-wake inner core is ex-
The following effects could be matched with a different ex-         pected to behave differently in the scaled and full-scale mod-
perimental setup and scaling choices but were neglected in          els. However, some of the results reported here, in addition to
the present work.                                                   evidence from other sources (Wu and Porté-Agel, 2011), in-
  – All gravo-aeroelastic effects. Since the blades of the          dicate that the inner core near wake has only a modest effect
    G1 turbine are not aeroelastically scaled (and are very         on far-wake behavior. For example, it is common practice
    stiff), also the full-scale model was simulated with-           to simulate far-wake behavior with LES codes without even
    out accounting for flexibility. Aeroelasticity could have       representing the turbine nacelle and tower (Martínez-Tossas
    some effects on near-wake behavior for very flexible ro-        et al., 2015).
    tors but would probably have only a negligible role on             As a consequence, thanks to the employed scaling and
    the characteristics of the far wake. Therefore, aeroelas-       matching criteria, the far-wake behavior is expected to be
    tic effects were excluded from the scope of the present         extremely similar between the wind-tunnel-generated wake
    investigation.                                                  and the full-scale one. The results section will more precisely
                                                                    support this claim.
  – Unsteady airfoil aerodynamics. Unsteady aerody-
    namics, including linear unsteady corrections (for              3     Wind turbine models
    example, according to Theodorsen’s theory; Bis-
    plinghoff and Ashley, 2002), and dynamic stall, was not         3.1    The TUM G1 scaled wind turbine
    considered in the present analysis. However, it was veri-
    fied that the mildly misaligned operating conditions an-        The TUM G1 is a three-bladed clockwise-rotating (looking
    alyzed here would not have triggered dynamic stall, ex-         downstream) wind turbine, with a rotor diameter D of 1.1 m,
    cept in a few instances, similarly to what was found in         a hub height H of 0.825 m, and rated rotor and wind speeds
    Shipley (1995). Here again, these effects would hardly          of 850 rpm and 5.75 m s−1 , respectively. The G1 was de-
    have any visible effects on far-wake behavior.                  signed based on the following requirements (Bottasso and
                                                                    Campagnolo, 2021):

2.5   Remarks                                                           – a realistic energy conversion process and wake behav-
                                                                          ior;
Wake stability analysis shows that the vortical structures re-
leased by the blade tips and root interact in the near wake             – a sizing of the model obtained as a compromise be-
(Okulov and Sørensen, 2007).                                              tween Reynolds mismatch, miniaturization constraints,
   In the outer shell of the near wake, the mutual interaction            limited wind tunnel blockage, and ability to simulate
of the tip vortices – triggered by turbulent fluctuations – leads         multiple wake interactions within the size of the test
to vortex pairing, leapfrogging and eventually to the break-              chamber;
down of the coherent wake structures (Sørensen, 2011). The
scaled and full-scale rotors are exposed to the same inflow

https://doi.org/10.5194/wes-6-961-2021                                                      Wind Energ. Sci., 6, 961–981, 2021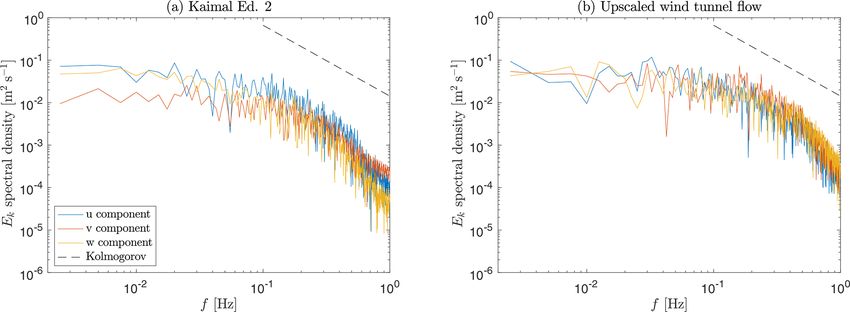
966 C. Wang et al.: How realistic are the wakes of scaled wind turbine models?
– active individual pitch, torque, and yaw control in order The aerodynamic design of the rotor of the DTU turbine
to test modern control strategies at the turbine and farm was modified, in order to match the characteristics of the G1
levels; in terms of design TSR and non-dimensional circulation dis-
tribution (and, as a consequence, to match also the thrust).
– a comprehensive on-board sensorization. Three versions of the rotor were realized. The standard G178
The turbine has been used for several research projects and uses the same airfoils of the DTU turbine over the entire
numerous wind tunnel test campaigns (Campagnolo et al., blade span, while chord and twist distributions were modified
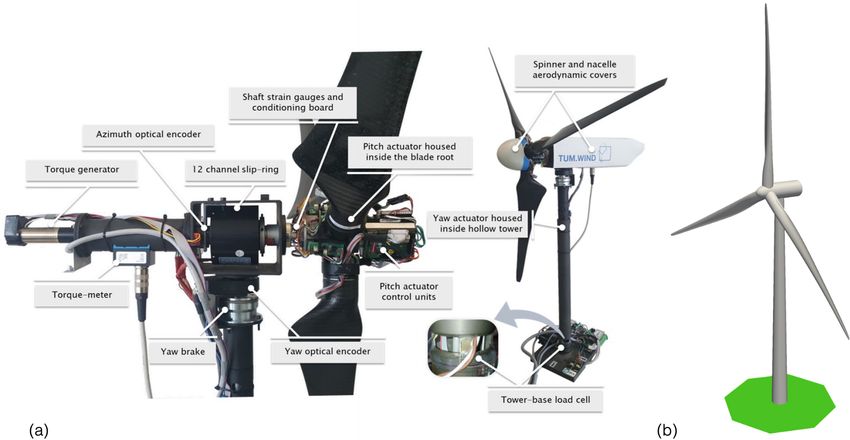
2016, 2020). The main features of the G1 rotor and nacelle to satisfy the matching criteria. As the root of the G1 blade
are shown in Fig. 1a. is located further away from the rotor axis than in the case of
A brushless motor equipped with a precision gearhead and the G178, the non-dimensional circulation is matched only
a tachometer is installed in the rear part of the nacelle and between 20 % and 100 % of blade span. To account for the
generates the resisting torque, which is in turn measured by effects of rotational augmentation, the inboard airfoils were
a torque sensor located behind the two shaft bearings. An corrected for delayed stall according to the model of Snel
optical encoder, located between the slip ring and the rear (1994).
shaft bearing, measures the rotor azimuth, while two custom- A second rotor was designed to investigate the effects of
made load cells measure the bending moments at the foot of the mismatched non-dimensional circulation on wake behav-
the tower and on the shaft in front of the aft bearing. Thrust ior. To this end, the twist angle close to the root was modified
is estimated from the fore–aft bending moment measured by to decrease the lift inboard and match the non-dimensional
the load cell at the base of the tower, correcting for the drag circulation of the G1 turbine even in this part of the blade; all
of the tower and rotor–nacelle assembly. the other parameters of the model were kept the same as in
Each wind turbine model is controlled by its own dedi- the G178 turbine. This second turbine is termed G178-MC,
cated real-time modular Bachmann M1 system, implement- where MC stands for “matched circulation”.
ing supervisory control functions, pitch–torque–yaw control A third version of the rotor was obtained by eliminating
algorithms, and all necessary safety, calibration and data log- from the G178 the rotational augmentation model, to investi-
ging functions. Measurements from the sensors and com- gate its effects. The resulting rotor is termed in the following
mands to the actuators are transmitted via analogue and dig- G178-nRA, where nRA stands for “no rotational augmenta-
ital communication. The Bachmann M1 system is capable of tion”.
acquiring data with a sample rate of 2.5 kHz, which is used The blades of the reference turbine are equipped with the
for aerodynamic torque, shaft bending moments and rotor az- four airfoils FFA-W3-241, FFA-W3-301, FFA-W3-360 and
imuth position. All other measurements on the turbine are FFA-W3-480 (Fuglsang et al., 1998), respectively from tip
acquired with a sample rate of 250 Hz. to root. For the operating conditions analyzed in this paper,
the chord-based Reynolds of the G1 varies along the blade
span within the range 60 000–85 000. Airfoils operating at a
3.2 Full-scale wind turbine
Reynolds number below 100 000 experience significant par-
A full-scale wind turbine was designed through a backward- asitic drag due to the formation of a laminar separation bub-
engineering approach to match the characteristics of the ble (Winslow et al., 2018), which affects their maximum lift
G1 scaled machine. The DTU 10 MW wind turbine (Bak et coefficient and lift-to-drag ratio. To limit these effects, the
al., 2013), shown in Fig. 1b, was used as a starting design for low-Reynolds airfoil RG14 (Lyon and Selig, 1996) is used
this purpose. This turbine has a rotor diameter of 178 m and throughout the whole span of the G1. Trips can be employed
a hub height of 119 m, and the modified version used here is for triggering the boundary layer transition and eliminat-
termed G178. ing or reducing the laminar bubble (Selig and McGranahan,
The ratio of the rotor diameter D of the G1 and DTU tur- 2004). However, tripping is not used on the G1 blades, be-
bines was used to define the geometric scaling factor nl . The cause it is not effective on these low-camber airfoils (Cam-
hub height H of the full-scale machine was slightly adjusted pagnolo, 2013).
to match the ratio D/H of the G1 turbine. The efficiency E = CL /CD vs. non-dimensional span r/R
The shape of nacelle and tower were kept the same as the of the reference and scaled blade is shown in Fig. 2 at rated
DTU reference, creating a mismatch with the G1 turbine. In conditions. The airfoil efficiency for the scaled rotor is al-
fact, the scaled model – due to miniaturization constraints most half the one of the full-scale machine in the outer
– has a frontal area of the nacelle that is 2.6 times larger span of the blade; since most of the power is indeed ex-
than the one of the scaled DTU turbine; similarly, the tower tracted in this region, the reduced efficiency results in a lower
diameter of the G1 turbine is 49 % larger than the scaled one power coefficient for the scaled model. The FFA-series air-
of the DTU machine. This creates a mismatch in the drag foil characteristics were computed with Ansys Fluent (AN-
of the nacelle and tower, in their local blockage and vortex SYS, 2019), while the RG14 ones were obtained by correct-
shedding. ing the baseline values of Lyon and Selig (1996) with rotor
Wind Energ. Sci., 6, 961–981, 2021 https://doi.org/10.5194/wes-6-961-2021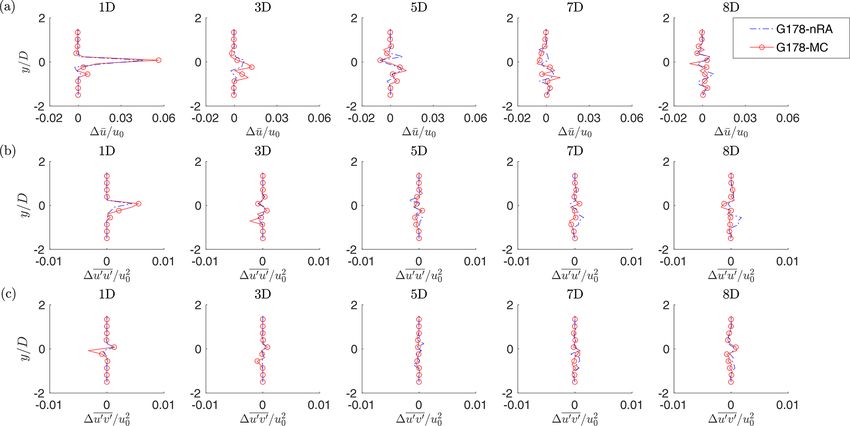
C. Wang et al.: How realistic are the wakes of scaled wind turbine models?                                                      967

Figure 1. (a) The TUM G1 turbine (Campagnolo et al., 2016). (b) The full-scale DTU 10 MW turbine (from Bak et al., 2013).

                                                                     circulation between G178 and G178-nRA is due to rotational
                                                                     augmentation.

                                                                     4     Simulation model

                                                                     4.1    LES-ALM CFD code
                                                                     Numerical results were obtained with a TUM-modified ver-
                                                                     sion of SOWFA (Fleming et al., 2014), more completely de-
Figure 2. Efficiency E along the blade span r/R for the G178 and     scribed in Wang et al. (2018, 2019). The code has been used
G1 turbines at rated TSR.                                            extensively to numerically replicate wind tunnel tests con-
                                                                     ducted with G1 turbines, achieving an excellent correlation
                                                                     with the experimental measurements in a wide range of con-
                                                                     ditions, including full and partial wake overlaps, wake de-
power and thrust measurements through the tuning approach            flection, static and dynamic induction control, and individual
of Wang et al. (2020a).                                              pitch control (for example, see Wang et al., 2019, 2020b, c).
   Distributions of the twist, chord, lift coefficient and non-         The finite-volume LES solver is based on the standard
dimensional circulation of the G1 and of the full-scale rotors       Boussinesq PISO (Pressure Implicit with Splitting of Opera-
are shown in Fig. 3. Chord distributions are normalized by           tor) incompressible formulation and is implemented in Open-
their respective arithmetic mean c0 over the span. Lift coef-        FOAM (Jasak, 2009). Spatial differencing is based on the
ficient and circulation are evaluated at rated conditions using      Gamma method (Jasak et al., 1999), where a higher level of
the BEM method implemented in the code FAST 8 (Jonkman               upwinding is used in the near-wake region to enhance stabil-
and Jonkman, 2018). The lift coefficient of the G1 is signif-        ity. Time marching is based on the backward Euler scheme.
icantly smaller than the one of the full-scale turbines, which       The pressure equation is solved by the conjugate gradient
is a result of its larger rotor solidity. The lower lift is how-     method, preconditioned by a geometric-algebraic multi-grid,
ever compensated for by a larger chord and different twist           while a bi-conjugate gradient is used for the resolved velocity
distributions, resulting in a matched non-dimensional circu-         field, dissipation rate and turbulence kinetic energy, using the
lation from 20 % span to the blade tip for the G178 turbine.         diagonal incomplete-LU factorization as preconditioner. The
For the G178-MC model, the non-dimensional circulation is            turbulence model is based on Smagorinsky (1963), where the
matched over the whole blade span. The difference in lift and        Smagorinsky constant is equal to 0.16.

https://doi.org/10.5194/wes-6-961-2021                                                       Wind Energ. Sci., 6, 961–981, 2021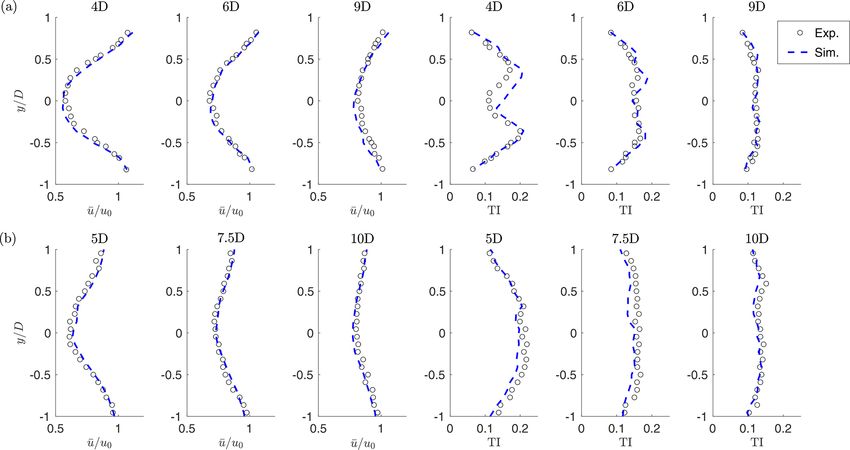
968                                                C. Wang et al.: How realistic are the wakes of scaled wind turbine models?

Figure 3. Distributions of twist θ (a), non-dimensional chord c/c0 (b), lift coefficient CL (c) and non-dimensional circulation 0/RV (d),
for the G1 and for the G178, G178-MC and G178-nRA full-scale turbines.

   An actuator-line method (ALM) (Troldborg et al., 2007) is           14 type-B spires were placed side by side 1 m from each
used to represent the effects of the blades, according to the          other, 1 m downstream of the test chamber inlet. A type-B
velocity sampling approach of Churchfield et al. (2017). The           spire consists of an equilateral trapezoid and a supporting
implementation of the actuator lines is obtained by coupling           board. The height of the trapezoid is 2.0 m, while the widths
the computational fluid dynamics (CFD) solver with the                 of the bottom and top edges are 0.26 and 0.1 m, respectively.
aeroservoelastic simulator FAST 8 (Jonkman and Jonkman,                The developed turbulent flow where the turbine is located
2018). For improved accuracy, the airfoil polars of the G1             (19.1 m downstream of the inlet) has a vertical shear with
are tuned based on experimental operational data (Bottasso             a power coefficient equal to 0.12, a small horizontal shear,
et al., 2014b; Wang et al., 2020a). The rotor speed is set to a        and hub-height speed and TI of 5.75 m s−1 and 5 %, respec-
constant value to precisely match the desired TSR (Wang et             tively. A second higher-turbulence inflow was generated us-
al., 2018). Finally, the immersed boundary (IB) formulation            ing nine triangular spires with a height of 2.5 m and a base of
method (Mittal and Iaccarino, 2005; Jasak and Rigler, 2014)            0.8 m, placed at a distance of 1.55 m from each other. In ad-
is employed to model the effects of the turbine nacelle and            dition, 24 rows of 0.23 × 0.23 × 0.1 m bricks were placed on
tower.                                                                 the ground, with 12 bricks in odd rows and 13 bricks in even
   Details on the mesh and other algorithmic settings are de-          ones, resulting in a staggered brick distribution. This second
scribed in the following sections.                                     configuration resulted in a vertical shear with a power coeffi-
                                                                       cient equal to 0.19, a small horizontal shear, and hub-height
                                                                       speed and TI of 5.75 m s−1 and 14 %, respectively.
4.2   Turbulent inflow                                                    The simulations were conducted in two phases: first, de-
                                                                       veloped turbulent flows were obtained by simulating the in-
Experiments with the G1 turbine took place in the large
                                                                       teraction of the chamber inlet wind with the spires and bricks;
boundary layer test section of the wind tunnel at the Politec-
                                                                       next, the results of these precursor simulations were sampled
nico di Milano, where a turbulent flow is generated passively
                                                                       on a plane 3.59 D upstream of the rotor disk and used as in-
by the use of spires. Without the spires, the flow at the inlet
                                                                       let for the simulations of the turbine and its wake. For the
has a turbulence intensity (TI) of about 1 %–2 % and a small
                                                                       turbulence-generating precursor simulations, the mesh was
horizontal variability caused by the presence of 14 fans and
                                                                       obtained with Ansys ICEM, which resulted in a structured
internal transects upstream of the chamber. The non-uniform
                                                                       body-conforming grid around the spires (Wang et al., 2019),
blockage caused by the spires decelerates the flow close to
                                                                       entirely consisting of hexahedral elements. The bricks placed
the wind tunnel floor, generating an initial vertical shear; fur-
                                                                       on the floor for the higher turbulence case were modeled
thermore, large vortical structures develop around the edges
                                                                       by the IB method. All simulations included the floor, side
of the spires, which then break down as the flow evolves
                                                                       walls and the ceiling of the tunnel. Boundary layers on these
moving downstream.
                                                                       surfaces were modeled by wall functions with an average
   Two setups are considered, with two different TI levels.
                                                                       y + value of 50, achieved with local mesh refinement. The
To mimic a typical medium-turbulence offshore condition,

Wind Energ. Sci., 6, 961–981, 2021                                                         https://doi.org/10.5194/wes-6-961-2021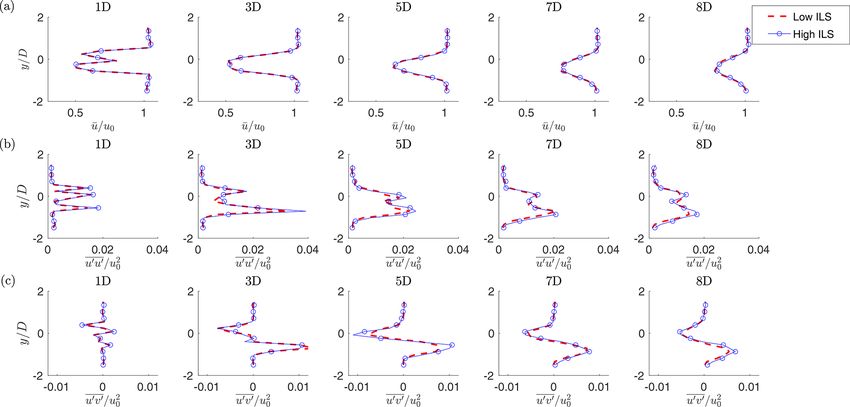
C. Wang et al.: How realistic are the wakes of scaled wind turbine models?                                                               969

chamber cross section has a width of 13.84 m and a height          Table 1. Experimental and simulated power and thrust coefficients
of 3.84 m, resulting in some vertical blockage, whose effects      for the G1 turbine, in the medium-TI case.
were quantified by running various simulations for increas-
ing values of the chamber height, as reported later.                Coefficient             CP                            CT
   The grid for the wind turbine simulations uses three zones       Case          Experiment     Simulation     Experiment     Simulation
of increasing density, as shown in Fig. 4, with the smallest        γ = 0◦          0.416          0.420          0.881          0.851
cells having a size of 0.015 m (i.e., 1.4 × 10⁻² D). The ALM        γ = 20◦         0.364          0.358          0.810          0.742
discretization used 108 points over the blade span, i.e., a
spacing equal to 4.7 × 10⁻³ D. The simulations were run for
360 rotor revolutions, which were enough for reaching a tur-       lower efficiency of the airfoils of the scaled blade (see Fig. 2),
bulent steady-state regime.                                        since TSR and circulation are matched.
   For the full-scale machine, each inflow was scaled in space        Figure 8 shows hub-height time-average horizontal pro-
and time, as previously explained, resulting in flows with the     files of the streamwise velocity and of turbulence intensity
same identical characteristics at the two scales. Similarly, the   (Wang et al., 2019). In the experiments, wake data were mea-
same LES and ALM grids were geometrically upscaled and             sured with triple hot-wire probes at a sampling frequency of
used for the full-scale simulations; this means that also the      2000 Hz for a duration of 40 s, which corresponds to almost
full-scale simulations have the same slight anisotropic block-     1 h at full scale. Results are reported for the aligned case at
age effects of the wind tunnel case.                               various downstream distances, for both the medium (Fig. 8a)
   Figure 5 shows the streamwise velocity u/u0 , where (·) in-     and high (Fig. 8b) TI cases. The downstream distances are
dicates a time-averaged quantity and u0 the time-constant          different for the two TI cases, because the datasets were ob-
hub-height wind speed, at the chamber cross section 3.59 D         tained in previously performed unrelated experiments. While
in front of the rotor. Figure 5a and c report the results of an    the match of the wake profile is excellent for all locations,
experimental mapping of the flow performed with triple hot-        the numerical results slightly overestimate turbulence inten-
wire probes, while Fig. 5b and d report the numerical results;     sity in the center of the near-wake region. Overall, simulation
Fig. 5a and b correspond to the medium turbulence case,            and experimental results are in very good agreement.
while Fig. 5c and d correspond to high turbulence. Notice
that measurements are available only 0.18 D above the floor.       5.2     Scaled to full-scale comparisons
A good match between experimental measurements and sim-
ulation results can be observed over the whole cross section       Next, having established a good correspondence between the
of the test chamber, including not only the vertical shear but     numerical results and experimental measurements, simula-
also the slight horizontal non-uniformities. These are made        tions were conducted with the full-scale turbines to under-
even more clear by Fig. 6, which reports the Reynolds shear        stand the effects of mismatched quantities.
stress component u0 v 0 /u20 , where the prime here indicates a       Table 2 shows the turbine power and thrust coefficients for
fluctuation with respect to the mean.                              the different cases, considering the G1 and the three G178
   For the same plane, Fig. 7a shows the mean (i.e., time-         turbine models. As expected, the power coefficient of the
averaged) speed profile along a vertical line directly in front    G1 turbine is lower than the one of all full-scale G178s, be-
of the rotor center, while Fig. 7b reports the TI profile on the   cause of the reduced efficiency caused by the lower Reynolds
same line. Here again, a good match between experimental           number regime. On the other hand, there is a good match
measurements and simulations can be observed, except in the        of the thrust coefficient, especially for G178; the nRA and
immediate proximity of the floor.                                  MC versions produce a slightly lower lift in the inboard sec-
                                                                   tion of the blade and hence have a marginally lower CT .
                                                                      Figure 9 gives a qualitative overview of the wakes of the
5     Results                                                      G1 and G178 turbines for the aligned and misaligned cases.
                                                                   The wake deficits are similar, except for the central region of
5.1    Code to experiment verification                             the near wake, as expected. Even this qualitative view shows
                                                                   a significant effect of the much larger nacelle of the G1. This
First, experimental measurements obtained with the G1 are          difference however disappears moving downstream, and the
compared with the corresponding numerical simulations.             far wakes of two turbines appear to be almost identical.
Two operating conditions in the partial load regime (re-              A more quantitative characterization of the differences be-
gion II) are considered: one aligned with the flow and one         tween the scaled G1 model and the realistic full-scale G178
with a misalignment angle γ equal to 20◦ . Table 1 reports         turbine is given by Fig. 10 (medium TI) and Fig. 11 (high TI),
the experimental and simulated power and thrust coefficients       considering the misaligned case. For both figures, panel a
in the two cases, in medium-TI conditions. Notice that the         shows the mean speed in the longitudinal direction, while
power coefficient of the G1 is lower than the one of the G178.     panels b and c show the Reynolds stress components u0 u0 /u20
Using BEM, this difference can be fully explained by the           and u0 v 0 /u20 , respectively.

https://doi.org/10.5194/wes-6-961-2021                                                         Wind Energ. Sci., 6, 961–981, 2021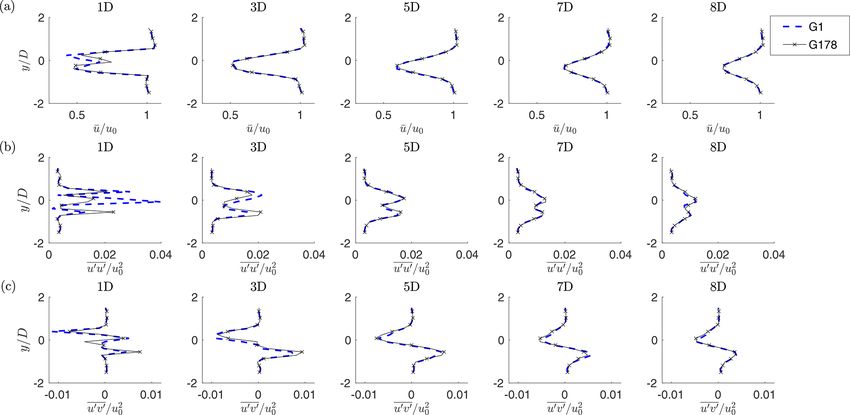
970                                                  C. Wang et al.: How realistic are the wakes of scaled wind turbine models?

Figure 4. Frontal (a) and lateral (b) views of the computational domain and refinement zones used for the wind turbine simulations. Precursor
simulations were used to generate turbulent inlet conditions at a plane 3.59 D upstream of the rotor disk. The cell size in the three zones
is 0.055, 0.027 and 0.014 D, respectively.

Figure 5. Streamwise velocity distribution on a cross section of the test chamber 3.59 D in front of the rotor. (a, c) Experimental measure-
ments; (b, d) numerical simulations; (a, b) medium-TI case; (c, d) high-TI case.

   Results indicate an excellent match between the scaled and            5.4   Effect of nacelle size and unmatched CP on swirl
full-scale wakes, for both TI levels. Some differences only
appear in the peaks of u0 u0 /u20 immediately downstream of              For the wind-aligned operating condition, Fig. 13 shows the
the rotor. However, the velocity profiles are remarkably sim-            delta wake velocity deficit obtained by subtracting the G178-
ilar already at 3 D, notwithstanding the differences around              MC from the G1 solution, looking upstream. Figure 13a rep-
the hub and the blade inboard sections between the two ma-               resents the near wake 1 D immediately behind the rotor disk
chines. Similar conclusions are obtained for the aligned case.           plane, while Fig. 13b reports the far wake at 8 D. The color
                                                                         field represents the difference in the non-dimensional stream-
                                                                         wise velocity deficit component 1(u − u0 )/u0 , whereas the
5.3   Effects of unmatched inboard circulation and
                                                                         arrows represent differences in the in-plane velocity vectors.
      rotational augmentation
                                                                            In this case, since the non-dimensional circulation is
The effects of unmatched inboard circulation and rotational              matched, there are only two factors that could result in non-
augmentation are quantified by computing the differences in              zero difference fields: the larger relative frontal area of the
u/u0 , u0 u0 /u20 or u0 v 0 /u20 at various downstream locations.        nacelle (and, similarly, of the tower) of the G1 and its smaller
Results are shown in Fig. 12, where differences are computed             power coefficient caused by the chord-based Reynolds num-
subtracting the G178 solution from the G178-MC or G178-                  ber mismatch. The impacts of these two factors are clearly
nRA ones. As indicated by the figure, these effects are ex-              visible in the near wake, respectively looking at the stream-
tremely small and possibly discernible from numerical noise              wise and in-plane velocities.
only in the immediate proximity of the rotor.                               Considering first the streamwise component, the larger
                                                                         blockage of the G1 nacelle creates the negative velocity bub-
                                                                         ble that is clearly visible at the center of the rotor, which indi-

Wind Energ. Sci., 6, 961–981, 2021                                                            https://doi.org/10.5194/wes-6-961-2021
C. Wang et al.: How realistic are the wakes of scaled wind turbine models? 971
Figure 6. Shear stress distribution on a cross section of the test chamber 3.59 D in front of the rotor. (a, c) Experimental measurements;
(b, d) numerical simulations; (a, b) medium-TI case; (c, d) high-TI case.
Figure 7. Mean velocity (a) and turbulence intensity (b) distributions along a vertical line 3.59 D in front of the rotor.
cates a larger deficit behind the G1 than behind the G178-MC swirl rotation is only concentrated close to the hub and de-
in this part of the wake. cays quickly with radial position.
The effect of the tower is different from the one of the As the flow propagates downstream and the wake progres-
nacelle and leads to a positive streamwise speed difference sively recovers, differences between the velocity fields decay,
instead of a negative one. In fact, while the nacelle is almost and the effects of the mismatches can hardly be seen at 8 D.
a pure blockage in the center of the rotor where wake recov- The only difference that can still be appreciated is the effect
ery is the weakest, the presence of the tower wake increases of the larger tower. This results in some blockage close to
the local turbulence intensity, with the effect of increasing the ground that has not yet fully recovered at this distance,
the recovery of the turbine wake. This results in the verti- resulting in about a 6 % difference in the longitudinal veloc-
cal region of higher streamwise speed that can be seen in the ity component immediately above the floor and, hence, in a
figure in the lower part of the rotor disk. When looking up- slightly enhanced shear below hub height. Elsewhere, differ-
stream, the rotor spins counterclockwise, whereas the wake ences between the two fields never exceed 3 %.
rotates clockwise by the principle of action and reaction, and
this explains why the region affected by the tower wake is
convected towards the negative y direction. 5.5 Effect of wind tunnel blockage
Consider next the in-plane velocities. Compared to the
wake of the G178-MC turbine, the wake of the G1 rotates Considering the G1 turbine, the wind tunnel test chamber
at a slower pace, as indicated by the counterclockwise rota- has a height hwt = 3.49 D and a width wwt = 12.5 D, re-
tion of the difference field shown in the picture. The slower sulting in a cross-sectional area Awt = 43.6 D 2 . Although
rotation of the G1 wake is a direct consequence of its smaller the resulting area ratio A/Awt = 0.018 is relatively small,
power coefficient that, for the same TSR, implies also a re- the non-negligible vertical ratio D/hwt = 0.286 can cause
duced torque coefficient. As expected, the mismatch in the some anisotropic blockage. To quantify this effect, numerical
simulations were conducted in domains of increasing height
https://doi.org/10.5194/wes-6-961-2021 Wind Energ. Sci., 6, 961–981, 2021972 C. Wang et al.: How realistic are the wakes of scaled wind turbine models?
Figure 8. Horizontal hub-height profiles of normalized time-average streamwise velocity and turbulence intensity, for the medium (a) and
high (b) inflow TI cases. Black o symbols: experimental results; blue dashed line: G1 simulations.
Table 2. Power and thrust coefficients for the different turbine models in the two considered operating conditions.
Coefficient CP CT
Turbine model G1 G178 G178-nRA G178-MC G1 G178 G178-nRA G178-MC
γ = 0◦ 0.420 0.475 0.472 0.470 0.851 0.831 0.827 0.822
γ = 20◦ 0.358 0.421 0.418 0.417 0.742 0.731 0.727 0.723
from 1.75 D to 10.47 D, as shown in Fig. 14a. The actual The first metric considered here is the available power
wind tunnel height is indicated by a red square mark in the ratio downstream of the turbine, noted Pa (x/D)/P0 =
figure. u3 (x/D)/u30 , where P0 is the power output of the turbine,
b
Figure 14b shows the non-dimensional power increase and bu(x/D) is the rotor-effective wind speed at the down-
1P /P∞ vs. the area ratio A/Awt , where P∞ is the power stream location x/D. The available power ratio depends on
for the largest domain – assumed to be blockage-free. Re- the shape of the wake, its recovery and trajectory. This quan-
sults indicate a power increase caused by blockage of about tity was computed from the longitudinal flow velocity com-
1.5 %. ponent in the wake on the area of the rotor disk at various
downstream positions directly behind the wind turbine, as
5.6 Wind farm control metrics shown in Fig. 15.
For the 20◦ misaligned case, the available power ratio re-
The previous analysis has shown that the wake of the G1 tur- sults are reported in Fig. 16a. As shown in the figure, the
bine has a very close resemblance to the one of the full- available power changes moving downstream because the
scale G178, although some differences are present in the wake expands, recovers and – since the turbine is misaligned
near-wake region. However, it is difficult to appreciate the with respect to the wind vector – shifts progressively more
actual relevance of these differences, and a more practical to the side of the impinged (virtual) rotors. The difference of
quantification of the accuracy of the match would be desir- the available power behind the G1 and G178 turbines is small
able. The G1 turbine is mostly used for studying wake in- and decreases quickly moving downstream. The figure also
teractions within clusters of turbines and for testing mitigat- shows the effects of blockage, by reporting the results for the
ing control strategies. This suggests the use of wind-farm- actual wind tunnel size using a solid line and the ones for the
control-inspired metrics for judging the differences between
the scaled and full-scale machines.
Wind Energ. Sci., 6, 961–981, 2021 https://doi.org/10.5194/wes-6-961-2021C. Wang et al.: How realistic are the wakes of scaled wind turbine models? 973 Figure 9. Wakes of the scaled G1 (a, b) and full-scale G178 (c, d) turbines. (a, c) Aligned case; (b, d) yaw misaligned case. Figure 10. Hub-height profiles of normalized time-average streamwise velocity (a), normal stress (b) and shear stress (c), in the misaligned and medium-TI condition. unrestricted case using a dashed line; here, again, this effect served experimentally by Wang et al. (2018), these vortices is very modest. result in additional lateral flow speed components, which The second metric considered here is the ambient flow ro- are not limited to the wake itself but extend also outside tation in the immediate proximity of a deflected wake. By of it. By this phenomenon, the flow direction within and misaligning a wind turbine rotor with respect to the incom- around a deflected wake is tilted with respect to the upstream ing flow direction, the rotor thrust force is tilted, thereby gen- undisturbed direction. Therefore, when a turbine is operating erating a cross-flow force that laterally deflects the wake. within or close to a deflected wake, its own wake undergoes As shown with the help of numerical simulations by Flem- a change in trajectory – termed secondary steering – induced ing et al. (2018), this cross-flow force induces two counter- by the locally modified wind direction. rotating vortices that, combining with the wake swirl induced The change in ambient wind direction 10 caused by the by the rotor torque, lead to a curled wake shape. As ob- curled wake is reported in Fig. 16b as a function of the down- https://doi.org/10.5194/wes-6-961-2021 Wind Energ. Sci., 6, 961–981, 2021
974                                                  C. Wang et al.: How realistic are the wakes of scaled wind turbine models?

Figure 11. Hub-height profiles of normalized time-average streamwise velocity (a) and shear stresses (b, c), in the misaligned and high-TI
condition.

Figure 12. Difference in the profiles of the normalized time-average streamwise velocity (a), normal stress (b) and shear stress (c) along
hub-height horizontal lines, in yaw misaligned and medium-TI conditions. Dash-dotted blue line: effect of rotational augmentation, i.e., G178
results subtracted from G178-nRA results. Red solid line and ◦ symbols: effect of mismatched circulation close to the root, i.e., G178 results
subtracted from G178-MC results.

stream distance x/D; even in this case, the effects of block-            probably due to the slightly different strength of the central
age can be appreciated by comparing the solid and dashed                 vortex generated in response to the rotor torque. On the other
lines. The angle 10 was computed from the wake velocity                  hand, the two counter-rotating vortices caused by the tilted
components, averaging over the rotor disk areas already used             thrust are well matched – given the good correspondence of
for the analysis of the available power. Here again the dif-             this force component between the two models.
ference in the change in ambient wind direction behind the
G1 and G178 turbines is quite small. A non-perfect match is

Wind Energ. Sci., 6, 961–981, 2021                                                             https://doi.org/10.5194/wes-6-961-2021
C. Wang et al.: How realistic are the wakes of scaled wind turbine models?                                                               975

Figure 13. Difference in the wake velocity fields, obtained subtracting the G178-MC solution from the G1 one, looking upstream. Color
field: streamwise velocity deficit difference 1(u−u0 )/u0 ; arrows: difference in the in-plane velocity vectors. (a) Near wake 1 D immediately
behind the rotor disk plane. (b) Far wake at 8 D.

Figure 14. Wind tunnel blockage effect. (a) Cross-sectional areas. (b) Percent power increase with respect to the unrestricted flow vs. area
ratio A/Awt .

                                                                         simulated wind speed at two points in front of the turbine. For
                                                                         the size of the G1 turbine, this second estimate of the ILS
                                                                         resulted in a full-scale value of approximatively 142 m. On
                                                                         the other hand, the IEC 61400-1 international standards pre-
                                                                         scribe space-autocorrelation-based lengths of 170 m in the
                                                                         second edition (IEC 61400-1, 1999) and of 340 m in the third
                                                                         edition (IEC 61400-1, 2005). Although the ILS presents a
                                                                         significant natural variability at each location and across dif-
                                                                         ferent sites (Kelly, 2018), the value achieved in the wind tun-
                                                                         nel with the G1 is undoubtedly in the low range of naturally
Figure 15. Wake of the G1 turbine for the yaw misaligned case.           occurring scales.
The black dashed lines indicate the locations of virtual downstream         To understand the effects of the partially mismatched ILS
turbines.                                                                on wake behavior, two turbulent inflows were generated, dif-
                                                                         fering only in this parameter. However, the passive develop-
                                                                         ment through spires and bricks of two inflows with differ-
5.7   Effect of integral length scale                                    ent ILS values, but exactly the same TI and vertical shear,
                                                                         is clearly an extremely difficult task. To avoid this compli-
The ILS of the wind tunnel flow was obtained by first com-               cation, the turbulent flow field generator TurbSim (Jonkman,
puting the time autocorrelation of the wind speed at one po-             2009) was used, selecting the Kaimal model and prescrib-
sition in front of the turbine and then multiplying the result           ing directly the turbulence scale parameter (see Eq. (23) in
by the mean wind speed. The length scales obtained from                  Jonkman, 2009). The resulting turbulent wind time histories
measurements in the wind tunnel and the simulated flow re-               were specified as Dirichlet inflow conditions for the subse-
sulted in nearly identical values, as already shown by Wang              quent LES-ALM simulations.
et al. (2019). A second estimate of the ILS was based on
the space autocorrelation between simultaneous values of the

https://doi.org/10.5194/wes-6-961-2021                                                             Wind Energ. Sci., 6, 961–981, 2021
You can also read