Technical note: Sea salt interference with black carbon quantification in snow samples using the single particle soot photometer
←
→
Page content transcription
If your browser does not render page correctly, please read the page content below
Atmos. Chem. Phys., 21, 9329–9342, 2021
https://doi.org/10.5194/acp-21-9329-2021
© Author(s) 2021. This work is distributed under
the Creative Commons Attribution 4.0 License.

Technical note: Sea salt interference with black carbon
quantification in snow samples using the
single particle soot photometer
Marco Zanatta1,a , Andreas Herber1 , Zsófia Jurányi1 , Oliver Eppers2,3 , Johannes Schneider2 , and Joshua P. Schwarz4
1 Alfred-Wegener-Institut, Helmholtz-Zentrum für Polar- und Meeresforschung (AWI), Bremerhaven, Germany
2 Particle Chemistry Department, Max Planck Institute for Chemistry, Mainz, Germany
3 Institute for Atmospheric Physics, Johannes Gutenberg University of Mainz, Mainz, Germany
4 Chemical Sciences Laboratory, Earth System Research Laboratories, Boulder, CO, USA
a now at: LISA, UMR CNRS 7583, Université Paris-Est-Créteil, Université de Paris,

Institut Pierre Simon Laplace (IPSL), Créteil, France

Correspondence: Andreas Herber (andreas.herber@awi.de)

Received: 3 March 2021 – Discussion started: 10 March 2021
Revised: 12 May 2021 – Accepted: 20 May 2021 – Published: 17 June 2021

Abstract. After aerosol deposition from the atmosphere,          erentially undetected. The high concentration of suspended
black carbon (BC) takes part in the snow albedo feed-            salt particles and the formation of thick salt coatings on rBC
back contributing to the modification of the Arctic radiative    cores caused problems in the SP2 analog-to-digital conver-
budget. With the initial goal of quantifying the concentra-      sion of the signal and incandescence quenching, respectively.
tion of BC in the Arctic snow and subsequent climatic im-        Changes to the signal acquisition parameters and the laser
pacts, snow samples were collected during the research ves-      power of the SP2 improved the mass detection efficiency,
sel (R/V) Polarstern expedition of PASCAL (Physical Feed-        which, nonetheless, stayed below unity. The present work
backs of Arctic Boundary Layer, Sea Ice, Cloud and Aerosol;      provides evidence that a high concentration of sea salt un-
Polarstern cruise 106) in the sea-ice-covered Fram Strait in     dermines the quantification of rBC in snow performed with
early summer 2017. The refractory BC (rBC) content was           the SP2 nebulizer system described here. This interference
then measured in the laboratory of the Alfred Wegener In-        has not been previously reported and might affect the future
stitute with the single particle soot photometer (SP2). Based    such analysis of rBC particles in snow collected, especially
on the strong observational correlations between both rBC        over sea ice or coastal regions strongly affected by sea salt
concentration and rBC diameter with snow salinity, we hy-        deposition.
pothesize a salt-induced matrix effect interfering with the
SP2 analysis. This paper evaluates the impact of sea salt,
based on the measurement of electrical conductivity (κ) in
water samples, on rBC measurements made with a SP2 neb-          1   Introduction
ulizer technique. Under realistic salinity conditions, labora-
tory experiments indicated a dramatic six-fold reduction in      Black carbon (BC) aerosol, produced by incomplete com-
observed rBC concentration with increasing salinity. In the      bustion of biomass and fossil fuels, is transported from ex-
salinity conditions tested in the present work (salt concen-     tensive mid-latitude source regions to the Arctic atmosphere
tration below 0.4 g L−1 ) the impact of salt on the nebuliza-    (Schacht et al., 2019), where it influences the regional cli-
tion of water droplets might be negligible. However, the SP2     mate (Quinn et al., 2015). Once removed from the atmo-
mass detection efficiency systematically decreased with in-      sphere, BC particles continue to affect the Arctic radiative
creasing salinity, with the smaller rBC particles being pref-    budget by directly decreasing the snow albedo (Dou and
                                                                 Xiao, 2016) and promoting snow grain growth (Skiles and

Published by Copernicus Publications on behalf of the European Geosciences Union.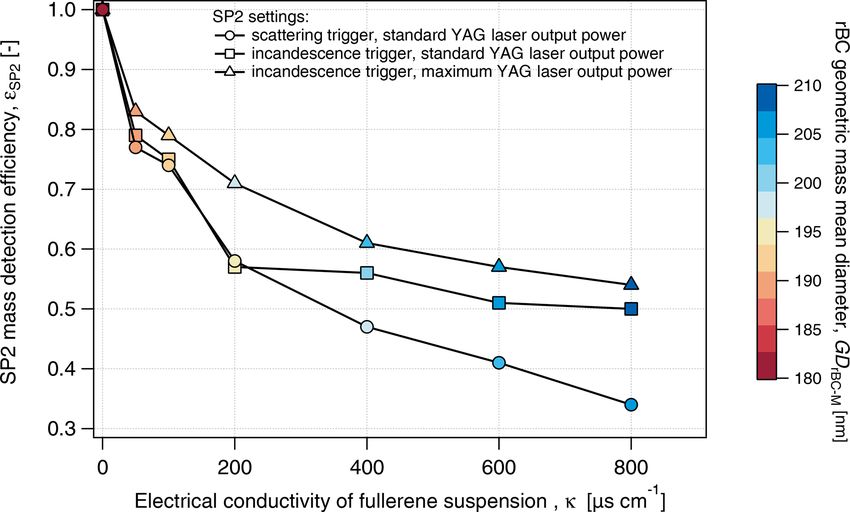
9330                                     M. Zanatta et al.: Sea salt interference with black carbon quantification in snow

Painter, 2017). In turn, the acceleration of the melting rate     ulization efficiency, the degree of comparability with more
leads to earlier exposure to the underlying surface. The over-    traditional techniques such as the thermal optical method and
all process is usually called snow albedo feedback and might      the integrating sphere/integrating sandwich spectrophotome-
be considered among the strongest forcing mechanisms in           ter is still variable (Schwarz et al., 2012; Lim et al., 2014;
the Arctic region (Hansen and Nazarenko, 2004; Flanner et         Mori et al., 2019).
al., 2007; Skiles et al., 2018).                                      In the Arctic region, many snow samples were collected in
    Considering the climatic repercussions caused by BC in        coastal regions and over sea ice (Tørseth et al., 2019) where
snow, the scientific community has been measuring the con-        the sea salt components often dominate the snow chemical
tent of BC in snow across the Arctic for almost 4 decades         composition, especially in summer in presence of open wa-
(Clarke and Noone, 1985; Doherty et al., 2010; Dou and            ter (Krnavek et al., 2012; Jacobi et al., 2019). This is particu-
Xiao, 2016; Tørseth et al., 2019). Unfortunately, a standard-     larly relevant over sea ice, where sea salt aerosol, suspended
ized and universally accepted analytical technique for the        as sea spray, can be deposited at the snow surface, and the
measurement does not yet exist. Generally, the wide variety       capillary upward migration of sea salt from the sea ice can
of analytical approaches to measure BC in snow can be di-         lead to a high salt concentration at the bottom of the snow-
vided into offline and online methods. Considering the of-        pack (Domine et al., 2004). Our surface snow samples, col-
fline approach, BC mass can be measured after the melting         lected over the sea-ice-covered Fram Strait in summer 2017
and filtration of the snow sample via thermal optical analysis    within the PASCAL (Physical Feedbacks of Arctic Boundary
(Hagler et al., 2007) or transmittance spectroscopy (Doherty      Layer, Sea Ice, Cloud and Aerosol) experiment, were highly
et al., 2010). Alternatively, BC mass can be quantified, af-      affected by salt deposition and showed a wide range of salin-
ter the nebulization of the melted snow samples, with online      ity. The presence of salt might have broad impacts on snow
techniques such as the photoacoustic technique (Schnaiter         analysis, including, via the influence of the nebulization of
et al., 2019) or the laser-induced incandescence technique        the sample, the analyte and solvent transport and even the an-
(Schwarz et al., 2012).                                           alytical signal of certain analytical techniques, such as induc-
    In recent years, the laser-induced incandescence tech-        tively coupled plasma atomic emission spectroscopy (e.g.,
nique, more specifically with the single particle soot pho-       Sharp, 1988; Todolí et al., 2002; Burgener and Makonnen,
tometer (SP2; Droplet Measurement Technologies, Long-             2020). Such effects are commonly called matrix effects. Un-
mont, CO, USA), was often used to quantify refractory BC          til now, the potential interference of sea salt during the anal-
(rBC) particle (Petzold et al., 2013) concentrations in the       ysis of rBC particles with the SP2 has not been assessed.
snow and ice in various regions of the Arctic (Khan et al.,           Considering the high salinity of the snow samples col-
2017; Macdonald et al., 2017; Jacobi et al., 2019; Mori et        lected in the Fram Strait, a series of laboratory experiments
al., 2019; Zhang et al., 2020). The rBC analytical procedure      were conducted to quantify the impact of sea salt on neb-
now generally includes the following three steps: (1) melt-       ulization and rBC detection with the SP2 instrument. This
ing of the snow and/or ice sample, (2) nebulization with the      work aims to identify the importance of the salt matrix effect,
pneumatic concentric nebulizer equipped with a warming–           especially in the context of the MOSAiC (Multidisciplinary
cooling desolvating system (i.e., Marin-5 – Teledyne Tech-        drifting Observatory for the Study of Arctic Climate; https:
nologies, Omaha, NE, USA; Apex Q – Elemental Scien-               //mosaic-expedition.org/, last access: 15 June 2021) project,
tific Inc., Omaha, NE, USA) and (3) sampling the resulting        where hundreds of snow samples were collected during the
aerosol with the SP2. During nebulization, the melted sam-        1-year-long drift over the sea ice for the analysis of rBC in
ple is usually transported to the nebulizer at a constant flow    the snow with the SP2 nebulizer technique.
rate via a peristaltic pump. The liquid is then broken into
small droplets and suspended in a nebulization chamber by
means of a pneumatic concentric nebulizer. Once suspended,        2     Technique
the solvent in the droplets is evaporated and removed with a
warming cooling cycle. Several studies addressed the issue        2.1    Snow sampling during the PASCAL expedition
of reducing the losses of rBC during the nebulization phases
by controlling the liquid flow rate, gas flow rate and pressure   The PASCAL expedition (Flores and Macke, 2018), orga-
and temperature cycle (Lim et al., 2014; Wendl et al., 2014;      nized within the framework of the (AC)3 project (ArctiC Am-
Mori et al., 2016; Katich et al., 2017). Overall, up to 75 % of   plification: Climate Relevant Atmospheric and SurfaCe Pro-
rBC mass is suspended from the sample, transported through        cesses, and Feedback Mechanisms; Wendisch et al., 2018),
the nebulizer and, finally, detected by the SP2 without the       was a shipborne field campaign on board the research ves-
addition of surfactants (Lim et al., 2014; Mori et al., 2016).    sel (RV) Polarstern, the research icebreaker of the Alfred
Due to the reduction in water density and viscosity, the dop-     Wegener Institute (Bremerhaven, Germany). The 25 sur-
ing with isopropyl alcohol increases the rBC mass nebuliza-       face snow samples discussed here were collected on the
tion efficiency to values close to unity (Katich et al., 2017).   sea ice during the drift phase, which occurred between 3
It must be considered that, despite corrections for the neb-      and 16 June 2017 in the Fram Strait between 10.0–11.5◦ E

Atmos. Chem. Phys., 21, 9329–9342, 2021                                             https://doi.org/10.5194/acp-21-9329-2021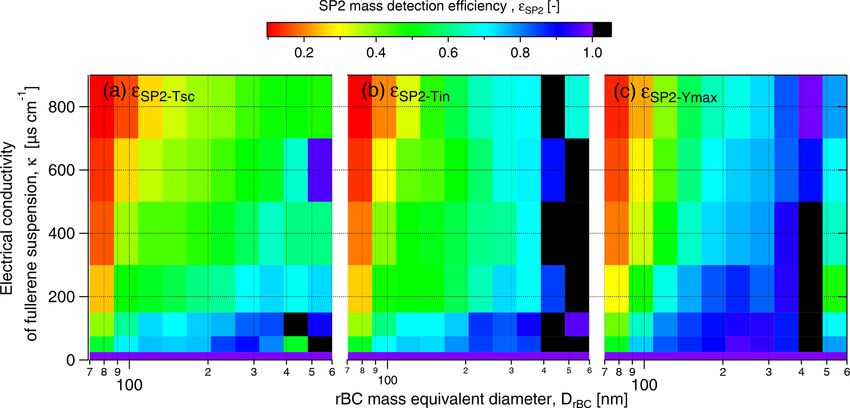
M. Zanatta et al.: Sea salt interference with black carbon quantification in snow                                           9331

                                                                    uid sample was aerosolized into an airflow by a concentric
                                                                    pneumatic nebulizer, and the resulting droplets were dehy-
                                                                    drated by a heating–cooling cycle (110–5 ◦ C). Finally, the
                                                                    dry aerosol (relative humidity below 30 %; Katich et al.,
                                                                    2017) was transported via tubing to the aerosol-measuring
                                                                    instruments. The mass nebulization efficiency varied be-
                                                                    tween 0.58 and 0.66 (see Sect. 3.3 for more details). A
                                                                    more detailed description of the Marin-5 nebulizer can be
                                                                    found in Mori et al. (2016). The liquid (70 µL min−1 ) and
                                                                    air (1 L min−1 ) flow rates were selected to maximize the sus-
                                                                    pension of rBC mass, following Katich et al. (2017), and kept
                                                                    constant during all experiments. No surfactants were added
                                                                    to the snow samples or to the test suspensions and/or solu-
                                                                    tions. In this work, the aerosolized particles were directed
Figure 1. Schematic of the instrumental setup deployed to analyze
                                                                    to a single particle soot photometer (SP2; Droplet Measure-
the PASCAL snow samples and to perform the laboratory test ex-      ment Technologies, Longmont, USA), a scanning mobil-
periments. ALABAMA (aircraft-based laser ablation aerosol mass      ity particle sizer (SMPS; TSI, Shoreview, MN, USA), and
spectrometer) was not available for laboratory test experiments.    a single-particle mass spectrometer ALABAMA (aircraft-
                                                                    based laser ablation aerosol mass spectrometer; Brands et al.,
                                                                    2011; Köllner et al., 2017; Clemen et al., 2020). Our SP2
and 81.7–82◦ N at a distance between 0.5 and 1 km from              sampled the aerosol directly from the Marin-5 exhaust and
open leads. These samples were collected in the first 5 cm          provided a number concentration (NrBC ), mass mixing ratio
of the snowpack and stored frozen at −20 ◦ C in polypropy-          (MrBC ) and size distribution of rBC in the mass equivalent
lene tubes (Fisher Scientific GmbH, Schwerte, Germany) of           diameter (DrBC ) range of 70–1000 nm. DrBC was calculated
50 mL volume (typically 20–30 g water content) until analy-         from the rBC mass measured in individual particles using a
sis. For each snow sample, the physical properties of the cor-      void-free density of 1800 kg m−3 (Moteki and Kondo, 2010).
responding snow layer were also measured. The specific sur-         The operating principles of the SP2 for atmospheric applica-
face area (SSA) was measured with the IceCube instrument            tions are given by Stephens et al. (2003), while assessments
(A2 Photonic Sensors, Grenoble, France), the snow density           of the performance of the SP2 during snow sample analy-
with a custom-made density cutter and the snow tempera-             sis can be found in Lim et al. (2014), Mori et al. (2016)
ture with a negative temperature coefficient one channel ther-      and Katich et al. (2017). The incandescence detectors of the
mometer (model 101; Testo Ltd, Alton Hampshire, United              SP2 were calibrated with mass-selected fullerene soot (FS;
Kingdom).                                                           Alfa Aesar; lot no. W08A039), as described in Laborde et
                                                                    al. (2012b). The SMPS measured the number concentration
2.2   Instrumental setup during laboratory analysis                 (N ) and size distribution between 14 and 680 nm mobility
                                                                    diameter (DP ). Multiple charges and diffusion losses were
The experimental setup used for the snow sample analy-              corrected with the aerosol instrument manager software is-
sis is schematized in Fig. 1. First, the snow samples were          sued by TSI. The ALABAMA was used to obtain additional
melted in a thermostatic bath at 25 ◦ C. Immediately after          information on the chemical composition of single parti-
melting, the electrical conductivity (κ) of the liquid sample       cles with diameters between approximately 110 and 5000 nm
was measured with a portable conductivity meter (model –            (Clemen et al., 2020). Different chemical species, identified
Cond 3110; WTW, Xylem Analytics, Weilheim, Germany)                 using characteristic marker ions of the mass spectra, include
equipped with a two-electrode conductivity cell (model –            sodium chloride, magnesium, non-sea-salt nitrate, non-sea-
KLE 325; WTW, Xylem Analytics, Weilheim, Germany).                  salt sulfate, organic carbon, levoglucosan–dicarboxylic acids
The probe was immersed in the sample and was rinsed with            and elemental carbon. Both the SMPS and ALABAMA sam-
Milli-Q water before and after each measurement. Consid-            pling line were diluted with air by a factor 10.
ering that the electrical conductivity generally increases by          Transport losses of aerosol particles were calculated using
2 % per 1 ◦ C increase (Hayashi, 2004), we estimate that our        the Particle Loss Calculator software, which treats aerosol
κ measurements had a precision of 10 %. The electrical con-         diffusion and sedimentation as well as turbulent inertial de-
ductivity of Milli-Q water never exceeded 1 µS cm−1 and was         position and inertial deposition in the bends and contractions
considerably lower than that of any snow sample.                    of tubing (von der Weiden et al., 2009). The software was de-
   The sample was then fed via a peristaltic pump and               veloped at the Max Planck Institute for Chemistry in Mainz
through a liquid flow meter (SLI liquid flow meter; Sensirion       (Germany) and is available at https://www.mpic.de/4230607/
AG, Staefa, Switzerland) to a Marin-5 nebulizer (Teledyne           particle-loss-calculator-plc (last access: 8 April 2021).
Technologies, Omaha, NE, USA). In the Marin-5, the liq-

https://doi.org/10.5194/acp-21-9329-2021                                            Atmos. Chem. Phys., 21, 9329–9342, 2021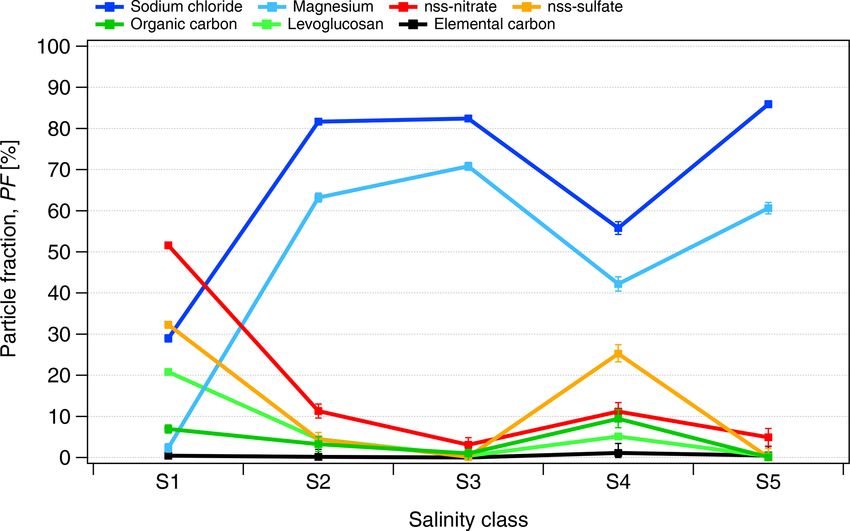
9332 M. Zanatta et al.: Sea salt interference with black carbon quantification in snow
3 Results
3.1 Surface snow properties in the Fram Strait
3.1.1 Snow physical properties
Warm conditions were encountered during the sampling
campaign, with the air temperature increasing from approxi-
mately −4 ◦ C at the beginning of the campaign to approx-
imately −1 ◦ C (with 1 min average values up to 2 ◦ C) at
the end of sampling. As a consequence of the temperature
increase, the snow-specific surface area decreased from 70
to 5 m2 kg−1, , and the snow density increased from 280 to
350 kg m−3 . The electrical conductivity of surface snow de-
creased from values above 1000 µS cm−1 to κ values be-
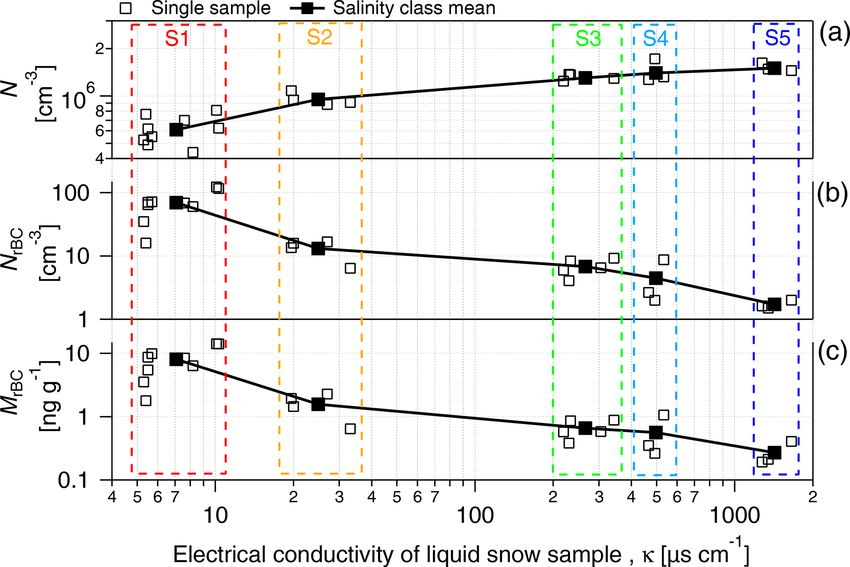
Figure 2. (a) The number concentration of the total particles (N),
low 10 µS cm−1 towards the end of the campaign. The de- (b) number concentration of rBC particles (NrBC ) and (c) mass mix-
crease in SSA and increase in snow density during the drift ing ratio (MrBC ) produced from the nebulization of PASCAL snow
phase of the PASCAL expedition indicates the occurrence of samples as a function of the electrical conductivity of melted snow
melt–refreeze cycles (Haas et al., 2001; Massom et al., 2001; samples. Boxes indicate the salinity classes (Sn). N is measured
Domine et al., 2007), and the downward migration of sol- with the SPMS in the 14–680 nm diameter range. rBC particles are
uble salts with percolating water explains the decrease in κ measured with the SP2 in the 70–1000 nm diameter range. S1, S2,
(Domine et al., 2004; Doherty et al., 2013). Considering the S3, S4 and S5 represent the salinity classes.
wide variability in electrical conductivity, the data set was or-
ganized into five salinity classes (Sn). The samples with the
lowest conductivity (κ ≈ 5–10 µS cm−1 ) accounted for 38 %
of the total samples and were mainly collected after the melt- is expected to be the major solute in seawater. As indicated
ing onset and grouped into S1. S2 includes the samples col- in Table 1, the size of the aerosolized particles (geometric
lected at the snowmelt which showed κ values between ap- mean of the number size distribution – GDP −N ) increased
proximately 20 and 30 µS cm−1 and accounted for 17 % of with κ from 27 nm (S1; κ < 10 µS cm−1 ) to 89 nm (S5; κ >
the samples. The samples characterized by a κ value above 1000 µS cm−1 ). The GDP −N –κ relationship and the absence
200 µS cm−1 and below 2000 µS cm−1 represented 46 % of of multiple modes in the aerosol size distribution (Fig. S1 in
the total number of the collected probes and were organized the Supplement) support the assumption of sea salt control-
into three different salinity classes (S3, S4 and S5). The most ling the aerosol composition. The increase in particle diam-
saline snow sample (κ = 3600 µS cm−1 ) was excluded from eter with the liquid concentration of soluble inorganic salts
further analysis. The mean and boundaries of κ values defin- was already observed (Clifford et al., 1993) and was found
ing the five salinity classes are listed in Table 1. to be mainly caused by the higher concentration of salt in the
primary aerosolized droplets. Additionally, particle growth
3.1.2 Relationship between salinity of snow samples caused by coalescence and promoted by the high number
and particle aerosolization concentration of aerosolized particles might also contribute
to the diameter shift (Olivares and Houk, 1986). The shift of
Here we investigate the potential relationship between elec- the size distribution mode into the size detection range of the
trical conductivity, which is used here as a proxy for salinity, SMPS might also contribute to the N -κ positive correlation
and the aerosolization of particles. Note that N and NrBC are shown in Fig. 2a.
presented in this section without correction for the nebuliza- The ALABAMA measurements confirmed the predom-
tion efficiency of the Marin-5 nebulizer. inant presence of seawater components, such as sodium
Under fixed nebulization conditions (constant liquid sam- chloride (NaCl) and magnesium (Mg), over other chemi-
ple flow and gas flow), a large number of particles (droplet cal species (shown in Fig. 3). The particle fraction (PF) of
residues) were suspended by the nebulization process. N NaCl-containing particles increased from roughly 30 % for
increased with the electrical conductivity of the sample the lowest salinity class to 60 %–80 % of all analyzed parti-
from 6.1 × 105 cm−3 in low conductivity samples (κ < cles for S2, S3, S4 and S5. A similar increase was observed
10 µS cm−1 ) to 1.5 × 106 cm−3 for samples showing con- for Mg-containing particles. Other particle species, e.g., non-
ductivity values above 1000 µS cm−1 (Fig. 2a; Table 1). sea-salt (nss) nitrate and sulfate, were only relatively abun-
A similar trend was recently observed by Rösch and Cz- dant in samples with low conductivity. For salinity class S4,
iczo (2020). The correlation of N with κ suggests that most the fraction of NaCl- and Mg-containing particles is signifi-
of the aerosolized particles are composed of sea salt, which cantly lower compared to other classes with κ > 10 µS cm−1 ,
Atmos. Chem. Phys., 21, 9329–9342, 2021 https://doi.org/10.5194/acp-21-9329-2021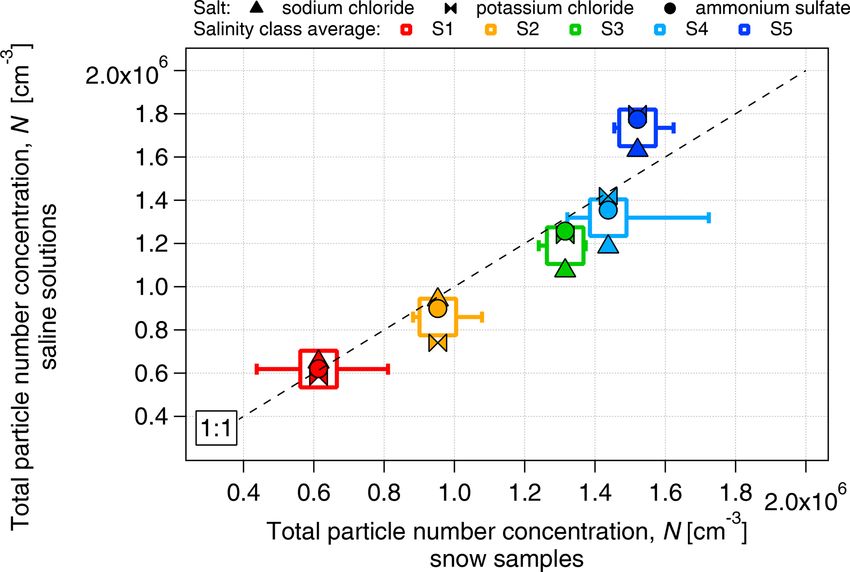
M. Zanatta et al.: Sea salt interference with black carbon quantification in snow                                                               9333

Table 1. Properties of snow samples grouped in conductivity classes. Conductivity of melted samples measured between 20 and 25 ◦ C.
Total aerosolized particles measured in the mobility diameter range 14–685 nm show the number concentration (N) and geometric mean of
the number size distribution (GDP −N ). rBC particles are measured between 60 and 1000 nm of DrBC , showing the number concentration
(NrBC ), mass mixing ratio (MrBC ), geometric mean of the number (GDrBC-N ) and mass (GDrBC-M ) size distribution. The number fraction
of rBC particles (FrBC ) is also given.

 Salinity      Fraction       Conductivity                 N              GDP −N        NrBC          GDrBC−N         FrBC      MrBC        GDrBC-M
 class      sample (%)         (µS cm−1 )                (cm−3 )            (nm)       (cm−3 )            (nm)         (%)     (ng g−1 )       (nm)
                          Min     Max     Mean       Mean           SD               Mean        SD                   Mean    Mean     SD
 S1                 38      5.3    10.3    7.07   6.1 × 10⁵   1.3 × 10⁵      27.3    69.6   34.04         87.6   1.1 × 10⁻²   8.05   4.29       225
 S2                 17     19.6    33.1    24.9   9.5 × 10⁵   1.0 × 10⁵      34.4    13.1    1.64         89.2   1.4 × 10⁻³   1.57   0.41       229
 S3                 21     219     343     266    1.3 × 10⁶   6.2 × 10⁴      57.6    6.81    2.03         94.2   5.2 × 10⁻⁴   0.66   0.21       212
 S4                 13     466     533     497    1.4 × 10⁶   6.7 × 10⁴      72.1    4.45    3.71          106   3.1 × 10⁻⁴   0.56   0.44       246
 S5                 13    1275    1652    1424    1.5 × 10⁶   9.0 × 10⁴      89.0    1.71    0.26          120   1.1 × 10⁻⁴   0.27   0.12       257

                                                                               partially explained by BC redistribution during melting (Do-
                                                                               herty et al., 2013), here the abrupt (factor 12) and sudden
                                                                               (48 h) increase, observed between S3 and S1, in MrBC at the
                                                                               snow surface has never been observed in the Arctic region
                                                                               and is not believed to be physical. The MrBC values presented
                                                                               here are corrected only for the mass nebulization efficiency
                                                                               (see more detail in Sect. 3.3). Similar to GDrBC-N , the rBC
                                                                               geometric mean diameter, calculated from the mass size dis-
                                                                               tribution (GDrBC-M ), increased from 225 to 257 nm from S1
                                                                               to S5 (Table 1). Considering that the melt–freeze cycle pro-
                                                                               motes agglomeration of BC particles (Schwarz et al., 2012;
                                                                               Kinase et al., 2020), the decrease in GDrBC-M at the melt on-
                                                                               set (S1–S2) was unexpected. The respective rBC mass size
                                                                               distributions are shown in Fig. S1c.
Figure 3. The number fraction of analyzed particles (PF) containing
                                                                                  These results make it clear that rBC-containing particles
the given chemical species measured by ALABAMA in the PAS-
CAL snow samples as a function of the salinity classes (Sn). The
                                                                               represent the small minority of the aerosol population nebu-
selected species are sodium chloride (NaCl), non-sea-salt (nss) ni-            lized from the snow samples. In fact, the number fraction of
trate, nss sulfate, magnesium (Mg), levoglucosan and dicarboxylic              detected rBC particles (FrBC ) decreased with salinity from
acids, organic carbon (OC) and elemental carbon (EC). The chem-                1.1 × 10⁻² % in S1 to 1.1 × 10⁻⁴ % in S5 (Table 1). More-
ical composition is measured for particles in the 110–5000 nm di-              over, EC-containing particles were found in less than 1 % of
ameter range.                                                                  all analyzed particles by ALABAMA (Fig. 3). Hence, con-
                                                                               sidering the remarkable concentration of total particles, the
                                                                               minor fraction of rBC particles, the sudden decrease in MrBC
which is due to one sample of S4 containing more of the other                  with conductivity, and the unexpected diameter decrease at
particle species.                                                              the melt onset, laboratory experiments were designed to re-
   SP2 measurements indicated a monotonic decrease in                          produce the salinity conditions of PASCAL snow samples to
NrBC with conductivity (Fig. 2b; Table 1), which is the oppo-                  investigate the potential interference mechanisms of salt on
site to N. Considering only the salinity classes, the rBC num-                 rBC detection by the SP2. We find that the rBC properties
ber concentration decreased from approximately 70 cm−3 in                      presented in this section were prone to high error and are not
S1 to 1.7 cm−3 in S5. Additionally, the number size distri-                    representative of natural processes only. This is particularly
bution of detected rBC particles showed a shift to larger di-                  relevant for the saline samples belonging to S3–S5.
ameters as a function of salinity (Fig. S1b). The resulting
rBC geometric mean diameter calculated from the number                         3.2    Reproducing realistic snow samples conditions in
size distribution (GDrBC-N ) increased from approximately 90                          laboratory experiments
to 120 nm from S1 to S5 (Table 1). The detected rBC mass
mixing ratio (MrBC ) monotonically decreased with κ from                       The laboratory experiments aimed to reproduce BC snow
8.05 ng g−1 in S1 to 0.27 ng g−1 in S5 (Fig. 2c). Although                     concentrations representative of generic Arctic conditions
MrBC concentrations have already been observed in different                    and the specific salinity conditions representative of PAS-
locations and seasons across the Arctic (Sinha et al., 2017;                   CAL snow samples. It is important to note that the salt con-
Jacobi et al., 2019; Mori et al., 2019, 2020) and might be                     centrations explored in the present work do not represent re-

https://doi.org/10.5194/acp-21-9329-2021                                                              Atmos. Chem. Phys., 21, 9329–9342, 2021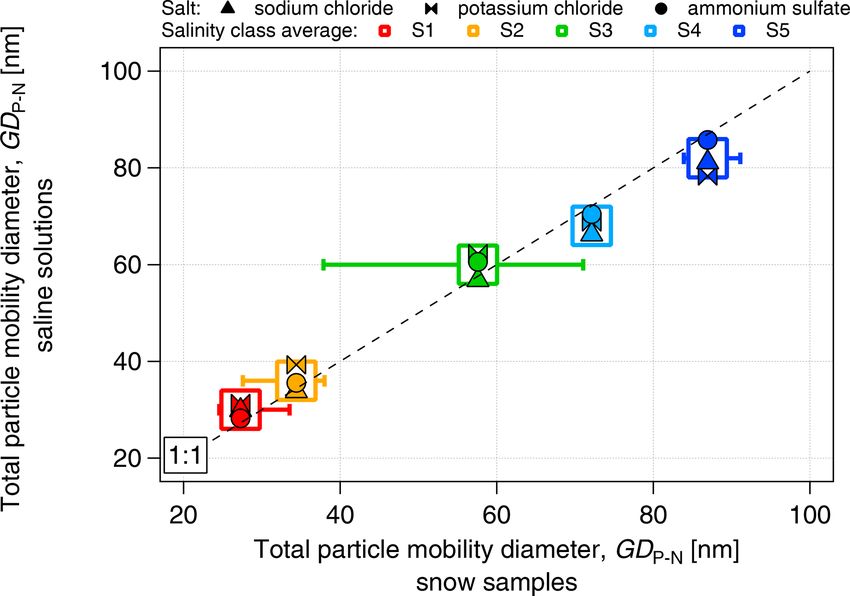
9334                                      M. Zanatta et al.: Sea salt interference with black carbon quantification in snow

alistic conditions encountered in continental or mountain re-
gions where sea salt aerosol deposition is not dominant. The
ability to reproduce such conditions and practical limitations
is presented in the following.

3.2.1   Sample preparation

Fullerene soot (FS; Alfa Aesar; lot no. W08A039) was
used as a proxy for ambient black carbon. FS is a well-
characterized standard for SP2 calibration (Gysel et al., 2011;
Laborde et al., 2012a) and is accepted as the reference stan-
dard for ambient black carbon (Moteki and Kondo, 2010;
Baumgardner et al., 2012). A total of three different inor-
ganic salts were chosen to replicate the conductivity array of
the snow samples, i.e., sodium chloride (NaCl; Honeywell           Figure 4. Comparison of the number concentration of aerosolized
International Inc), potassium chloride (KCl; Honeywell In-         particles produced from inorganic salt solutions (sodium chloride,
ternational Inc) and ammonium sulfate ((NH4 )2 SO4 ; Sigma-        potassium chloride and ammonium sulfate) and snow samples as a
Aldrich).                                                          function of salinity.
   The proportionality between electrical conductivity and
the mass concentration of the salts was assessed (Fig. S2).
All the saline solutions showed a linear relationship between
conductivity and mass concentration, with a high correlation
coefficient (r 2 > 0.98) and no dependence on salt compo-
sition. We have chosen the concentration range of the dis-
solved salt to be between approximately 3 and 870 mg L−1
to match the range of salinity values between the lowest and
the highest boundaries of the S1–S5 classes. As in the case
of snow samples, the number concentration of aerosolized
particles (measured by the SMPS in the size range of 14–
680 nm) increased with salinity (Fig. 4) from approximately
6 × 105 cm−3 at S1 (κ ≈ 7 µS cm−1 ) to approximately 1.7 ×
106 cm−3 at S5 (κ ≈ 1450 µS cm−1 ). The number concentra-
tion of particles produced by nebulization of saline solutions
is similar to that of the snow samples, within 10 % for the
S1–S4 classes and within 15 % for S5. The increase in parti-       Figure 5. Comparison of the diameter of aerosolized particles pro-
cle diameter with conductivity observed in the snow samples        duced from inorganic salt solutions (sodium chloride, potassium
was also closely replicated by the saline solutions (Fig. 5).      chloride and ammonium sulfate) and snow samples as a function
The increase in the concentration and diameter of total sus-       of salinity. The diameter is expressed as the geometric mean di-
pended particles with salinity observed in the snow samples        ameter calculated from the number size distribution of aerosolized
was successfully reproduced with salt standards, justifying        particles.
the use of inorganic salts to simulate the snow saline condi-
tions. Due to the similarity of results between the different
salts, and to the fact that NaCl was the major component of        tration that the SP2 was exposed to was limited, compared
PASCAL samples (Fig. 3), NaCl was chosen as the reference          with ambient conditions, to ensure stable SP2 operation.
salt for all the experiments presented in the rest of the study.
                                                                   SP2 laser beam shadowing

3.2.2   Salt-induced limitations to SP2 operation                  During the snow sample analysis, the large light extinction
                                                                   of the dense aerosol produced from one extremely saline
Although ambient salinity conditions were successfully re-         sample (κ = 3600 µS cm−1 ) caused a marked but tempo-
produced, the SP2 was not able to operate stably under the         rary decrease in the YAG power (approximately 50 % re-
most concentrated salt conditions. For the ambient samples,        duction). The laser power completely and immediately re-
the SP2 was only exposed to the highest concentrations in-         covered after switching to clean air sampling. Despite this
termittently and for short times. However, for more focused        extreme event, in the salinity range of our snow samples
laboratory conditions here, the range of BC and salt concen-       (κ < 1652 µS cm−1 ), the YAG power decreased only by 2 %

Atmos. Chem. Phys., 21, 9329–9342, 2021                                              https://doi.org/10.5194/acp-21-9329-2021
M. Zanatta et al.: Sea salt interference with black carbon quantification in snow 9335
with increasing salinity. This effect on net laser intensity in where MrBC-SP2 is the mass concentration of rBC particles
the cavity might, thus, be important for extremely saline so- quantified by the SP2, and MrBC-smp is the mass concentra-
lutions but is negligible for solutions or samples with κ below tion of rBC particles in the liquid sample. FGas is the gas
1500 µS cm−1 at the rates at which we nebulized the liquid. flow rate applied to the nebulizer, and FLiq is the liquid flow
rate of the sample pumped into the nebulizer. ε may be de-
SP2 flow system composed in three distinct contributions, namely the mass
nebulization efficiency (εNeb ), the transport efficiency (εTrn )
The prolonged sampling of the rich saline solution affected and the mass detection efficiency of the SP2 (εSP2 ). εNeb is
the flow system of the SP2. The sampling time needed to the mass of rBC pumped into the nebulizer per unit of time
acquire a minimum of 30 000 recorded particles substan- divided by the mass of rBC coming out of the nebulizer in
tially increased with decreasing FS concentration (Fig. S3). aerosol form per unit of time. Hence, εNeb depends on the
The prolonged nebulization (longer than 30 min) of 1 and suspension efficiency of the liquid sample in liquid droplets
5 µg L−1 FS suspension, with electrical conductivity equal and on the transport efficiency of the wet and dry aerosol
to and above 600 µs cm−1 , led to the accumulation of salt in within the nebulizer. εTrn is the ratio of the mass of rBC
the SP2 aerosol jet tubing. This finally formed a solid ob- pumped out the nebulizer per unit of time to the mass of rBC
struction and caused the decreased sampling flow rate and reaching the SP2 sampling inlet per unit of time. εTrn is con-
the pressure at the detection chamber. To remove the salt ob- trolled by diffusion, impaction and sedimentation losses and
struction, the full jet assembly was disconnected from the depends on flow rate, particle size and the length, orientation
SP2, the clogged section of the metal tubing was first soaked and bends in the sampling line. εSP2 is the mass of rBC in
in Milli-Q water, sonicated for a few seconds and dried with the aerosol form being introduced to the SP2 laser per unit
compressed air. The formation of the salt obstruction and of time divided by the mass of rBC in aerosol form reported
its removal altered the flow rate sensor accuracy and could by the SP2 per unit of time. Considering the typical atmo-
have modified the alignment of the sample aerosol with the spheric SP2 operation, εSP2 depends on the size distribution
laser. Due to the unknown degree of uncertainty, the first set of rBC particles, the presence of other absorbing–refractory
of experiments at different FS concentrations are not shown. atmospheric components and the SP2 size detection range
Moreover, to shorten the duration of the measurements and configuration (Schwarz et al., 2010). The ideal, but unreal-
minimize the risk of clogging, all of the following experi- istic, ε of 1 indicates that 100 % of rBC particles contained
ments were performed with FS suspensions with a concen- in the liquid sample are nebulized, transported and finally
tration of 10 µg L−1 . Although previous SP2-based studies detected by the SP2. In reality, the ε values obtained for var-
reported lower rBC mixing ratios in the Arctic (Sinha et al., ious soot standards suspended in pure water and nebulized
2017; Jacobi et al., 2019; Mori et al., 2019, 2020), this value with the Marin-5 nebulizer vary between 0.5 and 0.6 (Mori
is fairly comparable to the MrBC observed in the PASCAL et al., 2016; Katich et al., 2017), while ε of 0.75 was calcu-
samples for the less saline samples (8.05 ng g−1 ; Table 1). lated by Lim et al. (2014) using an APEX-Q nebulizer. The
To further reduce the chances of clogging, the upper limit ε calculated in the present work for non-saline suspensions
of FS suspension’s κ was set to 800 µS cm−1 (approximately at different FS mass concentrations varied between 0.57 and
0.4 g L−1 of NaCl). Considering our inability to reproduce 0.66. Our results are in good agreement with the previous
the most extreme sample conditions (low BC and high salt studies, indicating good reproducibility of nebulization con-
concentration), the SP2 results acquired during the analysis ditions during the laboratory experiments. It must be consid-
of S5 samples are affected by unknown bias. However, it is ered that past studies always assumed 100 % εSP2 and εTrn
unlikely that a lower BC concentration contributes to this ad- for rBC particles falling in the size detection range of the
ditional uncertainty. SP2. Therefore, ε (calculated exactly as in this study, ac-
cording to Eq. 1) was usually addressed as nebulization ef-
3.3 Salt impact on the rBC mass quantification by the
ficiency. In this study, ε decreased monotonically down to
SP2
values between 0.33 and 0.21 for the most saline FS suspen-
In this section, we investigate the possible impact of salt on sions (κ = 800 cm−1 ). This decrease clearly indicated a salt-
the SP2 rBC quantification, using the laboratory-generated induced bias on the mass quantification efficiency. Hence,
snow sample proxies. When nebulizing liquid samples, the the assumption of a 100 % εSP2 and εTrn might not be realis-
overall mass quantification efficiency of rBC (ε) can be cal- tic for saline samples. The potential impact of salt presence
culated as the mass of rBC pumped into the nebulizer per on the nebulization and transport efficiency and on the SP2
unit of time divided by the mass of rBC coming out of the detection efficiency will be addressed in the following sub-
nebulizer in aerosol form and detected by the SP2 per unit of sections.
time, as follows (Katich et al., 2017):
MrBC-SP2 FGas
ε= · , (1)
MrBC-smp FLiq
https://doi.org/10.5194/acp-21-9329-2021 Atmos. Chem. Phys., 21, 9329–9342, 20219336 M. Zanatta et al.: Sea salt interference with black carbon quantification in snow
3.3.1 Nebulization and transport efficiency SMPS and ALABAMA. After a two-way flow splitter with a
“Y” joint (model 1100; Brechtel, Hayward, USA), the SP2-
Inorganic salt can alter water’s physical properties, such as specific sampling line was 6 cm long, with an internal diam-
viscosity and surface tension, modifying the size distribu- eter of 1.8 mm and an airflow rate of 0.12 L min−1 . No sharp
tion of droplets produced in the spray chamber and affect- bends or additional flow splitters were present along the sec-
ing the nebulization efficiency of various analytes (Todolí ond section. We assumed spherical particles with a void-free
et al., 2002). High surface tension and viscosity cause an density of 1800 kg m−3 (Moteki and Kondo, 2010). Losses
increase in the mean diameter of the liquid droplets sus- of 2 %–5 % and 2 %–16 % were calculated for smaller (10–
pended by pneumatic nebulizers, decreasing their transport 40 nm) and larger (1–5 µm) particles, respectively. The parti-
efficiency (Sharp, 1988). NaCl concentrations above 1 g L−1 cle losses in the SP2 detection range (70–1000 nm of diam-
cause a significant increase in the droplet diameter (Clifford eter) were estimated to remain well below 2 %; hence, these
et al., 1993) and a decrease in transport efficiency (Sötebier results were not taken into account in forthcoming calcula-
et al., 2016). However, previous studies on pneumatic neb- tions.
ulizers (Dubuisson et al., 1998; Cano et al., 2002) indicated
that the salt matrix effect on the liquid droplet diameter and 3.3.2 SP2 detection efficiency
transport at concentrations below 1 g L−1 is negligible. Note
that, as summarized by Todolí et al. (2002), several studies In this section, we will investigate the consequences of high
have reported different or contradictory results on the im- number particle density transiting the SP2 laser beam in its
pact of matrix effect during the nebulization process with data acquisition system at different acquisition settings. Ad-
pneumatic nebulizers. Thus, the understanding of the pro- ditionally, the potential quenching of incandescence caused
cesses causing the diameter increase and the efficiency de- by the presence of thick salt coatings on rBC cores will be ad-
crease remains uncertain. The viscosity and surface tension dressed. εSP2 is the ratio between reported MrBC of the NaCl-
of our NaCl solutions was extrapolated from Lide (1995) doped suspensions at a certain conductivity (κ > 0 µS cm−1 ;
and Ozdemir et al. (2009), respectively. A total of 0.8 g L−1 κx ), and the MrBC of the non-saline reference suspension
of NaCl, representative of S5 samples (κ = 1400 µS cm−1 ), (κ ≈ 0 µS cm−1 ; κ0 ) is as follows:
causes a small increase of both viscosity (+0.08 %) and sur- MrBC (κx )
face tension (+0.03 %) compared to pure water. Our cal- εSP2 (κx ) = . (2)
MrBC (κ0 )
culations and the results of Dubuisson et al. (1998) and
Cano et al. (2002) indicate a negligible change in water A size-dependent εSP2 is the ratio of the mass size dis-
properties and, thus, nebulization efficiency for the salin- tribution at a specific conductivity (κx ) over the mass size
ity levels tested in the laboratory experiments (κ below distribution of non-saline suspensions (κ0 ) at a certain rBC
800 µS cm−1 ; NaCl concentration below 0.4 g L−1 ). Consid- diameter (DrBC ) as follows:
ering the dominant presence of NaCl in the snow samples
(Fig. 3), our calculations also represent the salt-influenced dMrBC (κx , DrBC )
εSP2 (κx , DrBC ) = , (3)
snow samples. To support our calculations, the mass quan- dMrBC (κ0 , DrBC )
tification efficiency was calculated for NaCl solutions (εNaCl ) where dMrBC represents the mass concentration of rBC par-
at different salt concentrations from SMPS measurements ticles contained in each diameter bin of the rBC mass size
(14 nm < Dp < 680 nm). The aerosolized mass concentra- distribution.
tion of the NaCl was calculated assuming spherical particles
with a density of 2170 kg m−3 (manufacturer data). Consid- Sensitivity of data acquisition to sample salinity
ering the factor 10 dilution, which enabled SMPS operation
below the highest limit of the detection, and the low rel- The frequency of recorded scattering events increased up
ative humidity (RH; < 30 %), we assumed a SMPS detec- to 17 500 counts per second for saline solutions with
tion efficiency of 100 % in the 14–680 nm diameter range. 250 µS cm−1 electrical conductivity (Fig. S4). Considering
Thus, εNaCl should solely be affected by nebulization effi- the high frequency of simultaneous events (multiple parti-
ciency. εNaCl remained very stable (range of 0.57–0.58) from cles passing through the laser beam during one acquisition
low (κ = 25 µS cm−1 ) to high (κ = 800 µS cm−1 ) salinity. In period), this number is most likely lower than the rate of
turn, this suggests that the nebulization efficiency of rBC particles entering the instrument. Operating the SP2 at this
particles is independent of salinity (salt concentration below overloaded condition might lead to data loss caused by the
4 g L−1 or electrical conductivity below 800 µS cm−1 ). limitations of the analogue to digital converter and computa-
The transport losses were estimated for the SP2 sampling tional power of the instrument’s computer. This is possibly
line, which was 30 cm long (distance from the Marin-5 ex- responsible for the observed exponential decrease in the fre-
haust) and composed of two different sections. The first sec- quency of detected scattering events for saline solutions with
tion was 24 cm long, with an internal diameter of 4.82 mm κ values above 250 µS cm−1 . Simultaneous particles and trig-
and an airflow rate of 1 L min−1 and carried flow to SP2, ger hysteresis (used to reduce some types of data artifacts in
Atmos. Chem. Phys., 21, 9329–9342, 2021 https://doi.org/10.5194/acp-21-9329-2021M. Zanatta et al.: Sea salt interference with black carbon quantification in snow 9337
the SP2) issues do not only reduce the acquisition of scat-
tering events but also cause the decrease in the detected fre-
quency of incandescence events (Fig. S4). Considering the
low concentration of rBC particles with the high concentra-
tion of non-rBC particles, the acquisition settings become ex-
tremely important to avoid non-detection of individual incan-
descence signals. The importance of triggering choices was,
hence, tested with 10 µg L−1 FS concentration and increasing
NaCl concentration (conductivity range of 0–800 µS cm−1 ).
The mass detection efficiency was then measured with either
the signal acquisition triggering off only the high-gain scat-
tering channel (εSP2-Tsc ) or only off the broadband high-gain
incandescence channel (εSP2-Tin ).
First, the result obtained by triggering on the scattering Figure 6. Mass detection efficiency of the SP2 for different SP2 set-
detector (the typical setup when operating the SP2 for atmo- tings and increasing electrical conductivity. Data are acquired from
spheric observations) will be discussed. εSP2-Tsc steadily de- the analysis of a fullerene soot suspension at 10 µg L−1 .
creased with conductivity to 0.34 at 800 µS cm−1 , while the
rBC mean diameter increased from 180 at 0 µS cm−1 nm to
207 nm at 800 µS cm−1 (Fig. 6). The increasing rBC mean Incandescence quenching
diameter indicates size dependency in εSP2-Tsc (see rBC size
distribution in Fig. S5). Indeed, εSP2-Tsc systematically in- Very thick coatings encapsulating rBC cores might not per-
creased with DrBC across the entire salinity range tested mit the SP2 laser to penetrate the coating, warm the rBC
in the present study (Fig. 7a). At lower conductivity (κ < core, evaporate the coating and, finally, allow correct detec-
200 µS cm−1 ), εSP2-Tsc increased from approximately 0.4– tion by bringing the rBC to vaporization temperature. This
0.6 for rBC components smaller than 100 nm to values above phenomenon will be called incandescence quenching. Dur-
0.7 for rBC components larger than 200 nm. The difference ing the nebulization of saline samples, the salt contained in
in εSP2-Tsc across the rBC size distribution was remarkable each droplet will remain on the rBC component after the wa-
at higher conductivity (κ > 600 µS cm−1 ), where εSP2-Tsc in- ter is evaporated and create thick coatings encapsulating the
creased from 0.1–0.2 for DrBC below 100 nm to 0.4–0.6 for rBC.
DrBC above 300 nm. It is, thus, evident that not only the mass As a rough estimation, we calculated that the theoretical
concentration but also the size distribution of rBC might be coating thickness and coating–rBC mass ratio of spherical
strongly biased when the standard atmospheric configuration rBC cores have a diameter of 100, 200, 300, 400 and 500 nm
of the SP2 is implemented for measurements of liquids with as a function of salinity. We assumed the presence of a single
significant salt content. Below 200 µS cm−1 , no significant rBC core per droplet, a concentric core shell geometry and
difference could be identified between εSP2-Tsc and εSP2-Tin . NaCl density of 2170 kg m−3 . No direct measurements of the
This result indicates that triggering settings are not crucial droplet size distribution are available for the Marine-5 nebu-
for snow samples with up to 0.1 g L−1 water salt content in lizer, but Mori et al. (2016) calculated a hypothetical droplet
the absence of contaminants. diameter of 2.5 µm based on the size distribution of total par-
Triggering only off the incandescence signal reported ticles nebulized with the Marin-5 from an ammonium sulfate
20 %–50 % more rBC mass compared to triggering only off solution at a known concentration of 13.4 mg L−1 . By using
the scattering signal at higher salinity (κ > 200 µS cm−1 ). the same equation, we calculated a droplet diameter of ap-
Similar to εSP2-Tsc , εSP2-Tin showed an increasing trend with proximately 20 µm for a NaCl solution at a similar concentra-
DrBC at all considered electrical conductivities (Fig. 7b). tion of 13.1 mg L−1 (κ = 25 µS cm−1 ; representative of S2).
Note here that, for DrBC larger than 400 nm, low rBC con- Considering the marked difference with the result of Mori et
centration resulted in statistical uncertainty that caused un- al. (2016), most probably due to an oversimplification of the
realistic εSP2 values above 1. These results indicate that the nebulization process, we assumed a droplet diameter of 8 µm.
triggering setting does not appear to substantially modify the This value represents the peak of the primary droplet number
size dependency of the SP2 detection efficiency. Neverthe- size distribution suspended by various concentric pneumatic
less, the use of the scattering trigger should be avoided in nebulizers working with a gas flow rate of 1 L min−1 and a
future studies when analyzing rBC in snow samples. Dilut- liquid flow range of 11–20 µL min−1 (Burgener and Makon-
ing these saline samples to achieve only single particles per nen, 2020). The calculated coating thickness and coating–
detection in the SP2 (Katich et al., 2017) would likely re- rBC mass ratio can be found in Tables S1 and S2, respec-
duce the detection problem, even for samples with κ above tively. The thickest coatings are expected for the smallest
200 µS cm−1 (NaCl concentration above 0.1 g L−1 ). rBC cores (100 nm in diameter) with values increasing from
47 nm at 50 µS cm−1 to 182 nm at 800 µS cm−1 . The coat-
https://doi.org/10.5194/acp-21-9329-2021 Atmos. Chem. Phys., 21, 9329–9342, 20219338 M. Zanatta et al.: Sea salt interference with black carbon quantification in snow Figure 7. rBC mass detection efficiency as a function of DrBC for different SP2 settings. Panel (a) shows the acquisition triggered on the scattering detector with standard YAG laser output power, εSP2-Tsc . Panel (b) shows the acquisition triggered on the incandescence detector with standard YAG laser output power εSP2-Tin . Panel (c) shows the acquisition triggered on the incandescence detector with maximum YAG laser output power, εSP2-Ymax . Results are given for FS suspensions with a concentration of 10 µg L−1 . ing thickness of the largest cores considered here (500 nm) High YAG laser power is expected to speed up the vapor- was significantly smaller, having values below 55 nm for ization of thicker coatings and to increase the mass detec- the considered NaCl concentration. Similarly, the mass frac- tion efficiency of rBC (Schwarz et al., 2010). During stan- tion of coating material decreased with the rBC core diame- dard operating conditions, and for the previous results, the ter. Laboratory experiments showed that relatively thin coat- pump laser was operated below peak power. For the follow- ings (coating–rBC mass ratio below 3.5) do not have any ing experiments, the laser power was increased to its upper significant negative impact on the SP2 detection efficiency limit (leading to an increase in the YAG laser power output (Schwarz et al., 2010). According to the coating calcula- from 5.2 to 6 V. The mass detection efficiency, and its size tion presented above (droplet diameter 8 µm), a coating–rBC distribution, here called εSP2-Ymax , was calculated according mass ratio above 3.5 is expected for rBC particles with a to Eqs. (1) and (2), respectively. εSP2-Ymax decreased mono- diameter below 300 nm. For 100 nm particles, the coating– tonically from 0.83 at 50 µS cm−1 to 0.55 at 800 µS cm−1 rBC mass ratio was calculated to exceed a value of 7 at a (Fig. 6). Although the negative correlation between εSP2 and salinity of 50 µS cm−1 . The mass of salt associated with each κ was still present, εSP2-Ymax was systematically (10 % on av- core is assumed to be constant, but the absorption cross sec- erage) higher than εSP2-Tin across the full salinity range (κ > tion scales approximately linearly with the mass of the rBC 0 µS cm−1 ). The size-dependent efficiency shown in Fig. 7c core as the cube of the rBC diameter. Hence, the potential for indicates that the higher laser power did not improve the de- salt to quench incandescence is highest for the smallest rBC tection efficiency in the 70–100 nm DrBC range. An improve- cores. This phenomenon could explain the measured εSP2 ment in εSP2-Ymax was observed for rBC particles with DrBC values’ diameter dependence (shown in Fig. 7). Considering larger than 100–150 nm compared εSP2-Tin . It is evident that our calculation, and the size-dependent detection results ob- operating the pump laser at the maximum performance we tained by Schwarz et al. (2010), incandescence quenching is could achieve does not impact the overall decreasing trend of likely particularly important for the smallest rBC particles. It εSP2 with κ and does not ensure homogeneous size detection must be noted that the calculated coating thickness and mass of rBC particles in the typical SP2 size range. These results ratio is only a rough assumption since its value strongly de- are consistent with quenching of incandescence due to coat- pends on the size and mass of the nebulized droplets. Assum- ings, stronger reductions in smaller and more thickly coated ing 12 and 5 µm droplet diameter (upper and lower mode of rBC cores and explain the size shift observed in the snow the droplet size distribution shown in Burgener and Makon- samples, where the GDrBC-M increases by approximately nen, 2020) the coating–rBC mass ratio increases by, approx- 14 % from S1 to S5 samples (Table 1). A similar increase was imately, a factor of 10. observed in the laboratory test (SP2 operated at maximum To further investigate the potential quenching effect of salt, YAG laser power), where GDrBC-M increases from 183 nm at FS suspensions (FS concentration of 10 µg L−1 ) with increas- ∼ 0 µS cm−1 to 211 nm at 800 µS cm−1 (15 % increase). This ing NaCl concentrations were nebulized and analyzed with similarity suggests that incandescence quenching might have the SP2 operating at maximum YAG laser power and sig- completely masked the diameter increase caused by particles nal acquisition triggered only with the incandescence signal. agglomeration during melting–freezing cycles that may have Atmos. Chem. Phys., 21, 9329–9342, 2021 https://doi.org/10.5194/acp-21-9329-2021
M. Zanatta et al.: Sea salt interference with black carbon quantification in snow                                              9339

existed in the snow samples (Schwarz et al., 2012; Kinase et      the SP2 directly and affect its performance. Extremely saline
al., 2020). Diluting these samples to electrical conductivity     samples can cause a temporary drop in the YAG laser output
values below 50 µS cm−1 (salt concentration of 0.03 g L−1 ),      power, and prolonged sampling of even low salinity samples
when εSP2 is higher than 80 %, might significantly reduce         can clog the SP2 internal airflow tubing. All told, these ef-
incandescence quenching. However, the dilution factor will        fects, when unrecognized and uncorrected, can alter the in-
linearly increase with conductivity up to a factor of 16 for      terpretation of natural processes. The work demonstrates the
very saline samples (κ = 800 µS cm−1 ). Considering the low       influences of sea salt on the performances of the SP2 sys-
BC concentration generally observed in Arctic snow, dilution      tem during the analysis of snow samples containing a notable
will strongly increase analysis time.                             amount of inorganic salt. This technical analytical issue has
                                                                  never been explicitly addressed before and should be con-
                                                                  sidered in the analysis of future studies conducted in marine
4   Conclusions                                                   regions. Additional work needs to be performed to minimize
                                                                  the impact of the matrix effect and to address the potential
Laboratory experiments were conducted to assess the inter-        interference of salt on other BC measuring techniques.
ference caused by inorganic salt on SP2 quantification of
rBC mass and size distribution in saline snow samples neb-
ulized with a Marin-5. These experiments were designed to         Code availability. The SP2 data were analyzed with PSI Toolkit
reproduce the salinity conditions of snow samples collected       single particle soot photometer (SP2), version 4.110. Contact
over the sea-ice-covered Fram Strait in summer 2017 during        Droplet Measurement Technologies to download the software.
the PASCAL drift shipborne campaign. Such salt concentra-
tions might be exclusively encountered in snow collected in
coastal areas or over sea ice in the vicinity of open water.      Data availability. Data are available upon request.
The total mass quantification efficiency (ε), which consists
of the nebulization efficiency (εNeb ) and the SP2 detection
                                                                  Supplement. The supplement related to this article is available on-
efficiency (εSP2 ), was strongly influenced by the salinity of
                                                                  line at: https://doi.org/10.5194/acp-21-9329-2021-supplement.
the FS suspension. Compared to ε of 0.58–0.66 for a non-
saline FS suspension, high salinity (electrical conductivity of
800 µS cm−1 and NaCl concentration of 0.4 g L−1 ) caused ε
                                                                  Author contributions. MZ collected the snow samples and per-
drop to 0.2–0.3. The sensitivity of εSP2 to different SP2 set-    formed the SP2, SMPS and physical measurements. OE performed
tings was also tested to verify (1) the impact of high number     the ALABAMA measurements. MZ drafted the paper, with contri-
concentration of non-rBC particles on the SP2 signal acquisi-     butions from all co-authors.
tion, and (2) the incandescence quenching produced by thick
coatings. Different SP2 settings were tested, but none of them
allowed unbiased detection of rBC mass, with maximum              Competing interests. The authors declare that they have no conflict
εSP2 of approximately 0.85 and 0.55 for low and high saline       of interest.
samples, respectively. The SP2 detection efficiency was also
found to strongly depend on the rBC core diameter. Over-
all, rBC cores below 100 nm were substantially undetected,        Special issue statement. This article is part of the special
showing εSP2 below 0.2 for the most saline samples (elec-         issue “Arctic mixed-phase clouds as studied during the
trical conductivity of 800 µS cm−1 and NaCl concentration         ACLOUD/PASCAL campaigns in the framework of (AC)3
of 0.4 g L−1 ) compared to values above 0.6 for rBC particles     (ACP/AMT/ESSD inter-journal SI)”. It is not associated with a
                                                                  conference.
larger than 200 nm. As a consequence of these interactions,
the measured rBC mass concentration in the PASCAL snow
samples was affected by a high degree of uncertainty and sig-
                                                                  Acknowledgements. We gratefully acknowledge the funding by
nificantly biased to have low values depending on snow salin-
                                                                  the Deutsche Forschungsgemeinschaft (DFG – German Research
ity. By operating the SP2 in its optimal triggering setup and     Foundation; project ID 268020496 – TRR 172) within the Transre-
maximum YAG laser power, the rBC mass concentrations              gional Collaborative Research Center project of “ArctiC Amplifi-
in the less saline samples, collected after melting (electrical   cation: Climate Relevant Atmospheric and SurfaCe Processes, and
conductivity below 50 µS cm−1 ) and representing 55 % of to-      Feedback Mechanisms (AC)3 ”. Oliver Eppers acknowledges fund-
tal probes, the bias was limited to a maximum of 17 %. In the     ing by the Max Planck Graduate School (MPGC).
most saline samples collected before melting (electrical con-
ductivity above 800 µS cm−1 and NaCl concentration above
0.4 g L−1 ) the measured rBC mass concentrations might have       Financial support. This research has been supported by the
been biased to have low values by at least 45 %. Note that the    Deutsche Forschungsgemeinschaft (DFG, German Research
nebulization and sampling of saline samples might damage          Foundation) (grant no. Projektnummer 268020496 – TRR 172).

https://doi.org/10.5194/acp-21-9329-2021                                            Atmos. Chem. Phys., 21, 9329–9342, 2021
You can also read


