Protocol for Comparative Evaluation of Blood Sampling Methods and Analytical Devices in the Measurement of Hemoglobin in Population Surveys - A ...
←
→
Page content transcription
If your browser does not render page correctly, please read the page content below
Protocol for Comparative Evaluation of
Blood Sampling Methods and Analytical
Devices in the Measurement of Hemoglobin
in Population Surveys –
A Laboratory Study
Developed by the HEmoglobin MEasurement (HEME)
Working Group

February 2021
About USAID Advancing Nutrition
USAID Advancing Nutrition is the Agency’s flagship multi-sectoral nutrition project, led by JSI Research
& Training Institute, Inc. (JSI), and a diverse group of experienced partners. Launched in September
2018, USAID Advancing Nutrition implements nutrition interventions across sectors and disciplines for
USAID and its partners. The project’s multi-sectoral approach draws together global nutrition
experience to design, implement, and evaluate programs that address the root causes of malnutrition.
Committed to using a systems approach, USAID Advancing Nutrition strives to sustain positive
outcomes by building local capacity, supporting behavior change, and strengthening the enabling
environment to save lives, improve health, build resilience, increase economic productivity, and advance
development.
Disclaimer
This protocol was produced for the U.S. Agency for International Development. It was prepared under
the terms of contract 7200AA18C00070 awarded to JSI Research & Training Institute, Inc. The contents
are the responsibility of JSI, and do not necessarily reflect the views of USAID or the U.S. Government.
Recommended Citation
USAID Advancing Nutrition. 2021. Protocol for Comparative Evaluation of Blood Sampling Methods and
Analytical Devices in the Measurement of Hemoglobin in Population Surveys—A Laboratory Study. Arlington,
VA: USAID Advancing Nutrition.

Photo: Daniel Cothran, USAID Advancing Nutrition

USAID Advancing Nutrition
JSI Research & Training Institute, Inc.
2733 Crystal Drive
4th Floor
Arlington, VA 22202

Phone: 703–528–7474
Email: info@advancingnutrition.org
Web: advancingnutrition.org
Contents
Contents ............................................................................................................................................................ iii
Acknowledgments ........................................................................................................................................... iv
Introduction .......................................................................................................................................................1
Aim of the Study ...............................................................................................................................................2
Research Questions .........................................................................................................................................2
Materials and Methods.....................................................................................................................................2
    Setting .............................................................................................................................................................2
    Population ......................................................................................................................................................2
    Laboratory Studies .......................................................................................................................................3
    Sample Size Calculations .............................................................................................................................4
    Analytical Devices ........................................................................................................................................6
    Central Laboratory Requirements ...........................................................................................................6
    Biological Sampling .......................................................................................................................................6
    Data Management ........................................................................................................................................7
    Data Analysis .................................................................................................................................................7
Outcomes ...........................................................................................................................................................9
Appendix A. Questionnaire for Identifying the Subjects for the HEME Study and a sample
consent form................................................................................................................................................... 12
Appendix B. Sample Size Calculations....................................................................................................... 15
    Laboratory Validation ............................................................................................................................... 15
Appendix C. Characteristics of an Internal Quality Assessment and Control ................................ 18
Appendix D. Characteristics of an External Quality Assessment Program ...................................... 20
Appendix E. Biological Sampling ................................................................................................................. 24

                                               Blood Sampling Methods and Analytical Devices in the Measurement of Hemoglobin | iii
Acknowledgments USAID Advancing Nutrition developed this protocol under the guidance of the HEmoglobin MEasurement (HEME) working group. HEME is a multi-institutional, USAID-supported research collaborative initiative that is convening researchers and experienced practitioners working on hemoglobin measurement in different countries and institutions. The aim of the research collaborative initiative is to improve the reliability and validity of hemoglobin measurements in large-scale population surveys. USAID Advancing Nutrition, the current USAID flagship multi-sectoral nutrition project, is the secretariat of the HEME working group. HEME members include: Sorrel Namaste (Demographic and Health Survey, ICF-Macro, USA); Maria Elena Jefferds (Centers for Disease Control and Prevention, USA); Ralph (Donnie) Whitehead (Centers for Disease Control and Prevention, USA); James Wirth (GroundWork LLC, Switzerland); Saskia Osendarp (Micronutrient Forum, USA); Kamija Phiri (University of Malawi College of Medicine, Malawi); David Killilea (Children's Hospital Oakland Research Institute, USA); Sant Rayn-Pasricha (The Walter and Eliza Hall Institute of Medical Research, Australia); Teresa Shamah (Centro de Investigación en Nutrición y Salud, Instituto Nacional de Salud Pública, Mexico); Lynnette Neufeld (Global Alliance for Improved Nutrition, USA); Omar Dary (USAID); Lindy Fenlason (USAID); Erin Milner (USAID); Silvia Alayon (USAID Advancing Nutrition); and Denish Moorthy (USAID Advancing Nutrition). Jorge Matute and Eric Ohuma contributed to the development of the research methods and statistical analysis. Jennifer Yourkavitch participated in the review of the protocol. iv | HEME Protocol for Comparative Evaluation – Laboratory Study
Introduction
Anemia is diagnosed by measuring hemoglobin (Hb) concentration in blood. Anemia prevalence is
determined by the percent of cases below a pre-determined reference value of the Hb concentration.
When necessary, the threshold is adjusted for altitude and smoking status, as these have been shown
to influence Hb concentration (WHO 2001). Automated hematology analyzers used with venous blood
are considered an appropriate standard for hemoglobin measurement (Karakochuk et al. 2019).
However, for field studies, portable devices have been used. The HemoCue device (HemoCue®,
Angelholm, Sweden) with its 201+ and 301 models are commonly used (Whitehead et al. 2019).
HemoCue measures Hb concentration using either reagent-driven changes (HemoCue 201+) or
physical properties associated to hemoglobin (HemoCue 301). The amount of blood is small, and is
loaded into a holding accessory called a microcuvette.
Either a venous or capillary blood sample is used for Hb determination. Studies have shown that the
mode of blood collection can result in different Hb measurements, especially in field settings where
quality of the blood collection can be difficult to ensure (Karakochuk et al. 2015; Neufeld et al. 2002;
Gwetu and Chhagan 2015; Boghani et al. 2017; Conway et al. 1998). Other factors that can influence
measurement of Hb concentration include deterioration of the microcuvette’s reagent due to humidity
(especially seen in HemoCue 201+ model) and operational factors such as long lapse of time between
loading the blood into the microcuvette and taking a reading with the equipment (seen with HemoCue
301 model). Several studies describe discrepancies in Hb concentration that are mainly due to factors
such as use of capillary versus venous blood (Chen et al. 1992; Patel et al. 2013; Karakochuk et al.
2015; Neufeld et al. 2002; Adam et al. 2012; Sari et al. 2001; de A. Paiva et al. 2004; Wendt et al. 2020)
or use of different HemoCue device models (Hinnouho et al. 2017). However, the studies have not
been able to clearly determine if the different results are from differences of capillary and venous
blood, or errors in the blood-collection process, or environmental factors like heat and humidity, or
the type of the field instrument.
These discrepancies found in the determination of hemoglobin concentration could have a substantial
effect in the estimation of anemia prevalence, especially in population surveys. In low- and middle-
income countries, anemia data are most commonly obtained from field surveys. The DHS program
determines Hb concentration on a drop of blood obtained through finger prick, and using a HemoCue
201+ (ICF International 2012), while micronutrient surveys have collected either a venous or capillary
blood sample and used HemoCue 201+ or the 301 model. If capillary blood is used, it may be collected
from a single blood drop or a pooling of several drops from finger pricking. The venous or the pooled
capillary blood samples can be analyzed immediately using the HemoCue device or stored for
assessment in an automated hematology analyzer.
Whitehead et al. 2019 reported inconsistencies in Hb concentrations estimated in single-drop capillary
samples when compared to pooled capillary samples, as well as variations in Hb values coming from
HemoCue devices when compared to autoanalyzers. In studies that include use of HemoCue devices,
internal testing is conducted in a controlled setting as part of standardized operating procedures
before the devices are used in the field. However, despite the use of these standardized procedures,
differences in the field setting have been reported. A comparative study that examined hemoglobin
distributions between surveys done by the DHS program and the Biomarkers Reflecting Inflammation
and Nutritional Determinants of Anemia project reported lower prevalence in the latter (by 2 to 31
percentage points for children and 1 to 16 percentage points for women) as compared to DHS, We
also see a trend of decreasing anemia prevalence as the age of the children increases (comparing
children aged 6-11, 12-23, and 24-59 months) (Hruschka et al. 2020); while this is due to metabolic
differences, the challenges in obtaining a blood sample from the children less than two years of age
cannot be understated. Therefore, there is a need to make a systematic comparison on the

                                 Blood Sampling Methods and Analytical Devices in the Measurement of Hemoglobin | 1
determination of Hb concentration using different types of blood samples from the same individuals
and analyzed using different instruments (either the laboratory or the field). This is needed for
establishing the proper conditions to attain reasonable accurate results in population surveys.
Aim of the Study
The aim of the study is to identify the best procedures and methods for determining Hb concentration
in a population survey.
Research Questions
We identified several questions to examine the differences in Hb concentration in two settings: a
laboratory validation of the methodology; and field validation that refers to a comparison of methods
under field settings. This protocol refers to the laboratory component (questions A1 and A2, below).
A protocol for a follow-up study, complementary to this one, will consider the results of the
laboratory study.
A1. HemoCue Validation: What is the performance of three HemoCue device models (201+, 301
and, if possible, 801) in a controlled laboratory setting compared to a certified autoanalyzer
when measuring Hb concentration using venous blood from women of reproductive age
(WRA) and children 12-59 months of age?
A2. Sample Validation: What is the performance of three HemoCue device models (201+, 301 and,
if possible, 801) in a controlled laboratory setting compared to a certified autoanalyzer when
measuring Hb concentration using pooled capillary or capillary blood drop (third drop) against
venous blood in samples from WRA and children 12-59 months of age?
Materials and Methods
In the methods section, we describe the inclusion criteria for the study population, the epidemiological
and biological data sampling, and the analysis plan.
Setting
The study will be conducted in at least three different countries. Each country will follow the same
process of recruitment, collection, and analysis and test, at a minimum, the HemoCue 201+ and 301,
with the option to also test the 801. The selection of the country will depend on the presence of an
accredited laboratory with a certified autoanalyzer that participates in an external quality assurance
program for the determination of hemoglobin. These laboratories will serve as the reference
laboratory in the follow up study in the field, to conduct Hb measurements in venous blood using the
autoanalyzer.
Population
We will conduct the study in two groups of apparently healthy volunteers of WRA that may include
pregnant and non-pregnant women, and children 12-59 months of age. We will exclude volunteers
exhibiting symptoms of any underlying pathology (and who have not been febrile or sick in the past
week). We will also exclude volunteers with a previous diagnosis of hypertension, diabetes, or blood
disorders. The screening will include a broad questionnaire (draft version enclosed in Appendix A to
be refined by the bidders on the request for applications) to identify the study population. Among
children aged 12-59 months, we will recruit equal number of participants from two age strata - 12-23
months and 24-59 months. This is to ensure that there is equal contribution of these two groups to
the variability in Hb measurement.
2 | HEME Protocol for Comparative Evaluation – Laboratory StudyParticipants will be selected from a population in a clinical setting. Upon screening, parents of children
with Hb below 7 g/dL and WRA with Hb below 8 g/dL, as per the venous blood measurement from
the autoanalyzer, will be referred for follow-up care as per national guidelines. All subjects will have
consented to participate in the study (we will take consent from parents for children 12-59 months of
age), willing to provide both a venous blood and either a capillary single-drop or pooled sample.
Information on anemia will be provided, describing its importance, and the need for accurate diagnosis
and management.
Separate cohorts of individuals will be recruited for single-drop and pooled capillary samples, with each
cohort also providing venous blood – we will not obtain two types of capillary samples from the same
individual. The reference comparison group for all these studies is the Hb estimated from venous
blood samples in an autoanalyzer in an accredited laboratory.
Laboratory Studies
Study A1 (HemoCue Validation) and Study A2 (Sample Validation)
These studies will compare Hb measurements on blood samples collected in a laboratory setting from
volunteer subjects (WRA and children) and measured by laboratory staff on autoanalyzers and
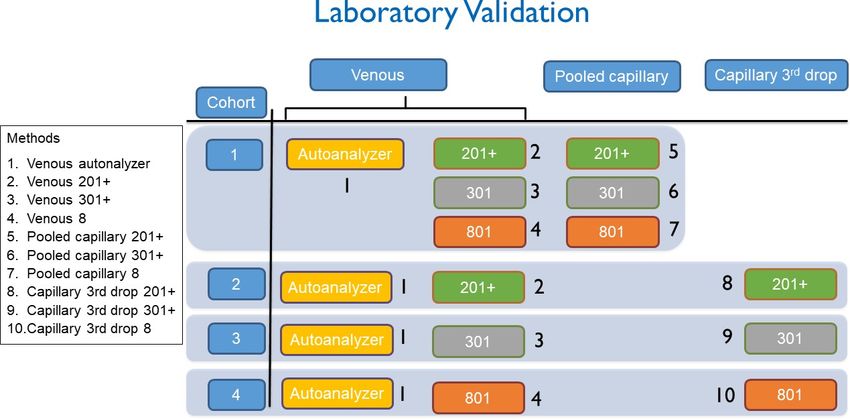
HemoCue machines. As seen in Figure 1, there will be four cohorts of volunteers. Each person in
cohort 1 will provide a single venous blood sample and a pooled capillary sample; each person in
cohort 2, 3, and 4 will provide a single venous blood sample and a single-drop capillary sample. Venous
and capillary blood samples will be extracted by experienced phlebotomists. The determination of
hemoglobin in the autoanalyzer will be done by following the usual laboratory procedure and as per
the device manufacturer’s instructions. HemoCue devices will be used by the same personnel who is
going to extract the venous and capillary blood samples.
In Cohort 1, the venous sample will result in up to four sets of Hb measurements– one on the
autoanalyzer and one each on the HemoCue devices (201+, 301, and 801). This will allow us to
compare the performance of the HemoCue devices against the autoanalyzer (Study A1).
The pooled capillary sample will result in three sets of Hb measurements–one on each of the
HemoCue devices (201+, 301, and 801) (Study A2 with pooled capillary blood). These will be pair
matched and compared against the Hb measurement using venous blood on the autoanalyzer (as
measured in Study A1). This study will allow us to compare the performance of pooled capillary blood
in the different HemoCue devices against venous blood in autoanalyzer.
In Cohort 2, 3, and 4, the Hb from a single-drop (the third) of capillary blood will compared against the
Hb measurement on the autoanalyzer using venous blood from the same person in each cohort. This
will allow us to compare the performance of single-drop capillary blood in the different HemoCue
devices against venous blood in autoanalyzer (Study A2 with a drop of capillary blood). The
phlebotomists are going to keep an aliquot of the venous samples, place in microtubes, and determine
the concentration of hemoglobin in the corresponding HemoCue. The phlebotomists are also going to
determine the concentration of hemoglobin in the single-drop of capillary blood samples using the
corresponding HemoCue. This will allow to compare the performance of single-drop capillary blood
against venous blood both in the same HemoCue devices, and comparing with the results of the
autoanalyzer using venous blood. The reason for three separate cohorts is to promote more
participation by ensuring that each volunteer undergoes a single finger prick and one phlebotomy for
venous blood sampling.
We will include 18 WRA and 18 children (Cohort1, of which we will recruit 9 children each from the
6-23 and 24-59 month age groups), and 54 WRA and 54 children in Study A2 (Cohorts 2, 3, and 4, and
in each cohort, we will recruit 9 children each from the 6-23 and 24-59 month age groups). Study A2
also includes Cohort 1 as the sample of pooled capillary blood will come from that Cohort. A total of
72 WRA and 72 children (36 children each from the 6-23 and 24-59 month age group) will be studied.
Blood Sampling Methods and Analytical Devices in the Measurement of Hemoglobin | 3If a sample is lost or insufficient for the cases of venous and pooled capillary samples, another individual will be recruited until completed the required number of results. The number of people who were dropped from the study due to failure of sample collection, and the reason for that failure, will be documented for all cohorts. For all cohorts, the venous, pooled capillary, and single-drop capillary samples are going to be collected by the same phlebotomist. For both cohorts, it would be ideal if the measurement on the autoanalyzer and HemoCue devices are separated by no more than two hours. Results for each type of blood sample analyzed in each HemoCue device will be compared per average and variation values, receiver operating characteristic (ROC) curves, and area under the curve (AUC), as well as correlation and concordance against the results of the autoanalyzer. Figure 1. Studies A1 and A2 – Study A1 (HemoCue validation) and Study A2 (Sample validation) Sample Size Calculations We calculated sample sizes for a comparison of two instrument types—Autoanalyzer and HemoCue— using venous blood samples; and for a comparison of venous blood with capillary blood, using a HemoCue device. Since the source of the blood sample is an individual in the study, we indicate the total number of individuals in the sample size table. We also include the number of results that will be conducted per individual in each one of the four studies (Table 1). Hemoglobin concentration is a continuous numerical variable, therefore to test agreement on the results coming from the different methods, we used statistical tools that measure concordance or agreement. The sample size calculation was based on measures of concordance correlation coefficient. (CCC) (L. I. Lin 1989; L. I. Lin et al. 2002; L. Lin 1992) (see Appendix B for details of the calculations). 4 | HEME Protocol for Comparative Evaluation – Laboratory Study
Table 1. Sample Size Requirements for Each Comparison in Children and WRA (using three HemoCue device models).
        Comparison                          Children 12-59 months                                        WRA                                       Total
                                                                                                                                                participants
                                                                                                                                                 (results)
                                Venous                  Capillary                 Venous                           Capillary

   HemoCue                      18 children (4          NA                        18 WRA (4 results                NA                       18 children and
   Validation: Study A1         results: 3 for each                               each: 3 for each                                          18 WRA (108
   (venous blood from           HemoCue and 1                                     HemoCue and 1 for                                         HemoCue and 36
   cohort 1)                    for the                                           the Autoanalyzer) for a                                   autoanalyzer
                                Autoanalyzer) for a                               total of 72 results.                                      results) for a
                                total of 72 results.                                                                                        total of 144
                                                                                                                                            results
   Sample validation –          18 children             18 children (analysis     18 WRA                      18 WRA (analysis              18 children and
   Study A2- pooled             (determination of       of each sample of         (determination of Hb in     of each sample of             18 WRA, for a
   capillary                    Hb in the venous        pooled capillary          the venous sample has       pooled capillary              total of 108
   (comparison of               sample has been         blood in each three       been done in Study A1)      blood in each                 HemoCue
   pooled capillary with        done in Study A1)       HemoCue device) for                                   three HemoCue                 results.
   venous blood in                                      a total of 54 results.                                device) for a total
   cohort 1)                                                                                                  of 54 results.
   Sample validation –          54 children (for        54 children (one           54 WRA (for one            54 WRA (one           54 children and
   Study A2-single-             one result for the      result with single-        result for the             assay with single-    54 WRA (108
   drop capillary               Autoanalyzer and        drop capillary blood       Autoanalyzer and one       drop capillary        autoanalyzer
   (comparison of               one each for            in single HemoCue          each for different         blood in single       results and 216
   single-drop capillary        different HemoCue       devices) for a total of    HemoCue machines)          HemoCue               HemoCue
   with venous blood in         machines) for a         54 results.                for a total of 108         devices) for a        results) for a
   cohort 2, 3, and 4)          total of 108 results.                              results.                   total of 54           total of 324
                                                                                                              results.              results.
   Total laboratory validation                          144 participants- 72 children and 72 WRA for a total of 576 results (144 autoanalyzer results
                                                        and 432 HemoCue results)
WRA=Women of reproductive age

                                                                             Blood Sampling Methods and Analytical Devices in the Measurement of Hemoglobin | 5
Analytical Devices
We will evaluate three models of HemoCue devices (201+, 301, and 801) against a laboratory
autoanalyzer. The study sites will procure the HemoCue machines to be used in the study.
HemoCue Models
We will use the Hb201+, Hb 301, and the newly released Hb 801 models of HemoCue. Researchers will
decide to use either one, two, or the three HemoCue models. We will follow standardized protocols
for minimizing errors associated to improper practices.
Quality Control and Assurance
Study sites will perform daily quality control by measuring and recording the results from the use of
HemoTrol (liquid controls for HemoCue) at the low, normal and high range for the device. This will be
done at the beginning of a day before blood collection and at the end of the day, after blood collection is
complete.
Hematology Autoanalyzer
Hematology autoanalyzers are considered reference standards for measuring Hb and we will use venous
blood samples to measure Hb. The technology underpinning the measurement of Hb by these devices
varies by manufacturing company. The samples are run in batches in these devices.
Internal quality control samples of two levels will be run with each batch of samples. Details of the
internal quality assessment are provided in Appendix C.
Central Laboratory Requirements
We will select a laboratory, whose hemoglobin determination by autoanalyzer has been certified, and
that participates in an external quality assurance program, with pre-specified criteria established in the
Micronutrient Survey Toolkit. Briefly, it will include the following:
1) Testing of quality control samples several times a year, with results sent to a reference
laboratory.
2) Documentation of equipment monitoring.
3) Documentation of policies and procedures.
4) Training and evaluation of field staff.
5) Method validation and verification.
6) Laboratory audits.
Please see Appendix D for details of the external quality assurance program.
The autoanalyzers and HemoCue device models will be standardized using quality control and assurance
procedures in each setting.
Biological Sampling
Data collection methods will be standardized across sites and will incorporate demographic information.
We will follow the guidelines laid down by the Centers for Disease Control and Prevention (CDC) in its
Micronutrient Survey Toolkit (Centers for Disease Control and Prevention (CDC) 2020).
We will use three methods for collecting the biological samples (i.e., venous, single-drop capillary, and
pooled capillary). We will follow the steps in the CDC toolkit referenced above. The procedure for
collection of the blood samples are briefly described below. Details for collection of blood samples andthe materials that will be needed for the procedures are available in Appendix E. All samples will be
collected with an observance of universal precautions for handling and disposing of biological materials
or in contact with biological materials.
Venous Sample
Venous samples will be collected by an authorized phlebotomist. In the laboratory, the venous samples
will be stored under appropriate conditions and run in batches in the autoanalyzer. Three to four
milliliters of the venous sample will be collected in a Dipotassium Ethylenediaminetetraacetic acid (K2-
EDTA) containing vacutainer tube. For the hemoglobin determination in the HemoCue devices:
Transfer a few drops of blood onto special wax paper using a small plastic transfer pipette and the
appropriate amount of the sample will be loaded into the HemoCue microcuvette.
Single-Drop Capillary Sample
Single-drop capillary samples will be collected by finger prick from WRA and children under 59 months
of age with the type of lancet that allows good flow of capillary blood. HemoCue manual instructions
will be followed. Briefly, the first and second drops of capillary blood are wiped away, and a sample from
the third drop is collected by capillary action into a microcuvette without touching the finger.
Pooled Capillary Sample
The pooled capillary sample will be collected by a finger stick puncture similar to the single-drop
capillary using a high-flow lancet. The first drop of blood will be wiped away. The phlebotomist will
collect subsequent blood drops (approximately 8-15 drops) to obtain a volume of at least 250 µL up to
500 µL in a 250-500 µL K2-EDTA microtube. The number of blood drops will be recorded in each case.
After mixing the pooled sample, a few drops of blood will be placed onto special wax paper using a
small plastic pipette, and the sample will be drawn into the HemoCue microcuvette.
Data Management
The study protocol will be registered in the ClinicalTrials.gov database.
Ethical Clearance
Ethical clearance will be obtained from the JSI institutional review board and from a recognized
institutional review board in countries where the study will be conducted.
Data Analysis
For each information coming from each country, the laboratory validation, all blood samples would be
compared with the gold standard (hemoglobin determination in an autoanalyzer using venous blood), to
estimate concordance correlation coefficient (CCC), which is the agreement and concordance between
the a new test and a gold standard or reference test that are measuring the same variable. Agreement
among the methods will also be evaluated. We will use Hb as a continuous variable in assessment of
agreement; we will also carry out receiver operating characteristics curve analysis (graphical ROC
curves and AUC) using Hb concentration in venous blood measured on an autoanalyzer to assess the
optimal cutoff to use for comparing the various groups.
Blood Sampling Methods and Analytical Devices in the Measurement of Hemoglobin | 7Laboratory Validation
There are currently 10 methods that combine both device and type of blood sampling that will be used
in the analysis, as follows:
1) Venous autoanalyzer
2) Venous 201+
3) Venous 301
4) Venous 801
5) Pooled capillary 201+
6) Pooled capillary 301
7) Pooled capillary 801
8) Capillary 3rd drop 201+
9) Capillary 3rd drop 301
10) Capillary 3rd drop 801
The estimation of CCC and Kappa statistic would be done for the following pairs of methods:
A. Agreement with reference standard
1) “1” vs “2”
2) “1” vs “3”
3) “1” vs “4”
4) “1” vs “5”
5) “1” vs “6”
6) “1” vs “7”
7) “1” vs “8”
8) “1” vs “9”
9) “1” vs “10”
B. Agreement among methods (not reference standard)
10) “2” vs “3”
11) “2” vs “4”
12) “2” vs “5”
13) “2” vs “6”
14) “2” vs “7”
15) “2” vs “8”
16) “3” vs “4”
17) “3” vs “5”
18) “3” vs “6”
19) “3” vs “7”
20) “3” vs “9”
21) “4” vs “5”
22) “4” vs “6”
23) “4” vs “7”
24) “4” vs “10”
25) “5” vs “6”
26) “5” vs “7”
27) “6” vs “7”
Also, Overall CCC could be estimated using the 7 methods (1 to 7) from cohort 1. All contrasts
mentioned above for each country could be pooled in a meta-analysis using information from the three
or more countries participating in the study. This could give us agreement values to be used as a
8 | Protocol for Comparative Evaluationreference. In the case of the children, while the 6-23 and 24 to 59 months age groups are equally
represented, the results are going to be pooled together for both age groups for analysis.
Furthermore, bias (location and scale shifts) with respect to the reference standard will be estimated. In
this regard, we will perform a Bland-Altman analysis (i.e., display the differences between the two
methods versus the average of each pair of measurements [(Bland and Altman 1999). This will show
how large the differences are and whether they vary by the ‘true’ values (as, for example, represented
by the average). The Bland-Altman approach assumes constant variance. The assumption of constant
variance will be checked by visual inspection of the Bland–Altman plot. In our graphical ROC curves and
AUC calculation, we will use the Hb concentration in venous blood measured on an autoanalyzer and
consider various cutoffs that maximize the AUC, including those cutoffs that are currently being used to
determine whether an individual is anemic (WHO 2001). The latter will be done only for determining
sensitivity and sensibility, and comparative predictive value of the different methods, and not for
diagnosis of anemia.
Outcomes
Study results will inform use of standardized sampling procedures and appropriate field devices in
population surveys.
Blood Sampling Methods and Analytical Devices in the Measurement of Hemoglobin | 9References
A. Paiva, Adriana de, Patrícia H C Rondó, Silmara de B. Silva, and Maria do R.D.O. Latorre. 2004. “Comparison
between the HemoCue® and an Automated Counter for Measuring Hemoglobin.” Revista de Saude Publica
38 (4): 585–587. https://doi.org//S0034-89102004000400017.
Adam, Ishag, Samah Ahmed, Mahmoud H Mahmoud, and Mohammed I Yassin. 2012. “Comparison of HemoCue®
Hemoglobin-Meter and Automated Hematology Analyzer in Measurement of Hemoglobin Levels in
Pregnant Women at Khartoum Hospital, Sudan.” Diagnostic Pathology 7 (30). https://doi.org/10.1186/1746-
1596-7-30.
Bland, J. M., and D. G. Altman. 1999. “Measuring Agreement in Method Comparison Studies.” Statistical Methods in
Medical Research 8 (2): 135–60. https://doi.org/10.1177/096228029900800204.
Boghani, Safia, Zuguo Mei, Geraldine S. Perry, Gary M. Brittenham, and Mary E. Cogswell. 2017. “Accuracy of
Capillary Hemoglobin Measurements for the Detection of Anemia among U.S. Low-Income Toddlers and
Pregnant Women.” Nutrients 9 (3). https://doi.org/10.3390/nu9030253.
Centers for Disease Control and Prevention (CDC). 2020. “Micronutrient Survey Toolkit.” 2020.
http://surveytoolkit.micronutrient.org/.
Chen, P. P., T. G. Short, D. H. Leung, and T. E. Oh. 1992. “A Clinical Evaluation of the Hemocue
Haemoglobinometer Using Capillary, Venous and Arterial Samples.” Anaesthesia and Intensive Care 20 (4):
497–500.
Conway, A. M., R. F. Hinchliffe, J. Earland, and L. M. Anderson. 1998. “Measurement of Haemoglobin Using Single
Drops of Skin Puncture Blood: Is Precision Acceptable?” Journal of Clinical Pathology 51 (3): 248–50.
De la Salle, Barbara. 2019. “Pre- and Postanalytical Errors in Haematology.” International Journal of Laboratory
Hematology 41 Suppl 1 (May): 170–76. https://doi.org/10.1111/ijlh.13007.
Gwetu, T. P., and M. K. Chhagan. 2015. “Evaluation of the Diagnostic Accuracy of the HemoCue Device for
Detecting Anaemia in Healthy School-Aged Children in KwaZulu-Natal, South Africa.” South African
Medical Journal 105 (7): 596–599. https://doi.org/10.7196/SAMJnew.7919.
Hinnouho, Guy-Marino, Maxwell A. Barffour, K. Ryan Wessells, Kenneth H. Brown, Sengchanh Kounnavong,
Bigphone Chanhthavong, Kethmany Ratsavong, Chidchamai Kewcharoenwong, and Sonja Y. Hess. 2017.
“Comparison of Haemoglobin Assessments by HemoCue and Two Automated Haematology Analysers in
Young Laotian Children.” Journal of Clinical Pathology, December. https://doi.org/10.1136/jclinpath-2017-
204786.
Hruschka, Daniel J., Anne M. Williams, Zuguo Mei, Eva Leidman, Parminder S. Suchdev, Melissa F. Young, and
Sorrel Namaste. 2020. “Comparing Hemoglobin Distributions between Population-Based Surveys
Matched by Country and Time.” BMC Public Health 20 (1): 422. https://doi.org/10.1186/s12889-020-08537-
4.
ICF International. 2012. “MEASURE DHS Biomarker Field Manual.” Calverton, Maryland, U.S.A.: ICF International.
https://dhsprogram.com/pubs/pdf/DHSM7/DHS6_Biomarker_Manual_9Jan2012.pdf.
Karakochuk, Crystal D., Sonja Y. Hess, Denish Moorthy, Sorrel Namaste, Megan E. Parker, Aviva I. Rappaport, Rita
Wegmüller, Omar Dary, and HEmoglobin MEasurement (HEME) Working Group. 2019. “Measurement
and Interpretation of Hemoglobin Concentration in Clinical and Field Settings: A Narrative Review.”
Annals of the New York Academy of Sciences 1450 (1): 126–46. https://doi.org/10.1111/nyas.14003.
Karakochuk, Crystal D, Amynah Janmohamed, Kyly C Whitfield, Susan I Barr, Suzanne M Vercauteren, Hou
Kroeun, Aminuzzaman Talukder, Judy McLean, and Timothy J Green. 2015. “Evaluation of Two Methods
to Measure Hemoglobin Concentration among Women with Genetic Hemoglobin Disorders in
Cambodia: A Method-Comparison Study.” Clinica Chimica Acta 441: 148–155.
https://doi.org/10.1016/j.cca.2014.12.021.
Lin, L. 1992. “Assay Validation Using the Concordance Correlation Coefficient.” Biometrics 48 (2): 599–604.
https://doi.org/10.2307/2532314.
Lin, L. I. 1989. “A Concordance Correlation Coefficient to Evaluate Reproducibility.” Biometrics 45 (1): 255–68.
Lin, L. I., A. S. Hedayat, Bikas Sinha, and Min Yang. 2002. “Statistical Methods in Assessing Agreement: Models,
Issues, and Tools.” Journal of the American Statistical Association 97 (457): 257–70.
Neufeld, Lynnette, Armando García-Guerra, Domingo Sánchez-Francia, Oscar Newton-Sánchez, María Dolores
Ramírez-Villalobos, and Juan Rivera-Dommarco. 2002. “Hemoglobin Measured by Hemocue and a
Reference Method in Venous and Capillary Blood: A Validation Study.” Salud Publica De Mexico 44 (3):
219–27.
10 | Protocol for ComparativePatel, A. J., R. Wesley, S. F. Leitman, and B. J. Bryant. 2013. “Capillary versus Venous Haemoglobin Determination
in the Assessment of Healthy Blood Donors.” Vox Sanguinis 104 (4): 317–23.
https://doi.org/10.1111/vox.12006.
Plebani, Mario. 2010. “The Detection and Prevention of Errors in Laboratory Medicine.” Annals of Clinical
Biochemistry 47 (Pt 2): 101–10. https://doi.org/10.1258/acb.2009.009222.
Sari, Mayang, Saskia De Pee, Elviyanti Martini, Susilowati Herman, Sugiatmi, Martin W. Bloem, and Ray Yip. 2001.
“Estimating the Prevalence of Anaemia: A Comparison of Three Methods.” Bulletin of the World Health
Organization 79 (6): 506–511.
Wendt, Amanda, Jillian Waid, Anna Müller-Hauser, Nicholas Kyei, Shafinaz Sobhan, and Sabine Gabrysch. 2020.
“Do Hemoglobin Concentration and Anemia Prevalence Differ Between Capillary and Venous Blood and
Between Analysis Methods?” Current Developments in Nutrition 4 (Supplement_2): 922–922.
https://doi.org/10.1093/cdn/nzaa053_127.
Whitehead, Ralph D., Zuguo Mei, Carine Mapango, and Maria Elena D. Jefferds. 2019. “Methods and Analyzers for
Hemoglobin Measurement in Clinical Laboratories and Field Settings.” Annals of the New York Academy of
Sciences 1450 (1): 147–71. https://doi.org/10.1111/nyas.14124.
WHO. 2001. Iron Deficiency Anaemia: Assessment, Prevention and Control. A Guide for Programme Managers. World
Health Organization. WHO/NHD/01.3.
http://www.who.int/nutrition/publications/micronutrients/anaemia_iron_deficiency/WHO_NHD_01.3/en/.
Blood Sampling Methods and Analytical Devices in the Measurement of Hemoglobin | 11Appendix A. Questionnaire for Identifying
the Subjects for the HEME Study and a
sample consent form
Consent obtained from caregiver of child?
Consent obtained from non-pregnant WRA?
Elements to be included:
1) Sex
2) Date of birth
3) Location (by GPS)
4) Altitude (smart phone or public databases)
5) Temperature and humidity
6) Date of sample collection
7) Time of sample collection
8) Pregnancy status
9) (For WRA): What date was the first day of your last menstrual period?
10) (for children): Has your child been suffering from any febrile illness in the past week (yes/no)
11) Do you currently smoke cigarettes every day, some days, or not at all? (every day/some
days/not at all)
12) On average how many cigarettes do you currently smoke each day?
Other elements in study questionnaire
1) Venous Hb (which arm)
2) Capillary Hb (which hand and finger)
We also include a Sample consent form that was adapted from the template provided in the
Micronutrient Survey Toolkit (Centers for Disease Control and Prevention (CDC) 2020)]
HEME Validation Study – Consent for participation
(PLEASE NOTE THAT THE CONSENT FORM SHOULD BE AN INDEPENDENT DOCUMENT AND IT
NEEDS TO BE MODIFIED TO MEET THE MINIMUM GCP REQUIREMENTS. THIS IS PROVIDED AS A
SAMPLE)
Household Consent
We are conducting a study to find out if the measurement of hemoglobin that is done in laboratories and
surveys is accurate. By you permitting members of your household to participate in the study, you are
helping us to improve the health of the people in XX and around the world. This study will also help us
address the problem of anemia in a meaningful way in XX and around the world. We would like to collect
two samples of blood from a non-pregnant woman of reproductive age and/or child 12-59 months from
your household. The sample will be collected by using a needle to obtain blood from your veins and also
through a finger prick blood specimen. Testing the blood will also help us to determine if the two readings
are the same, and thus help us know if the current methods of measuring hemoglobin are accurate.
Do you agree that a woman of reproductive age of the same household can participate in this study?
Do you agree that a child 12-59 months of age of the same household can participate in this study?
12 | Protocol for ComparativeRECORD WHETHER OR NOT CONSENT IS PROVIDED ON THE QUESTIONNAIRE
Consent for primary caregivers of children 12-59 months are selected
(Read consent information to the primary caregiver of each child)
We would like to collect two samples of blood from your child 12-59 month. The sample will be collected
by using a needle to obtain blood from your veins and also through a finger prick blood specimen. Testing
the blood will also help us to determine if the two readings are the same, and thus help us know if the
current methods of measuring hemoglobin are accurate.
Do you agree that we can take two blood samples from your child?
RECORD WHETHER OR NOT CONSENT IS PROVIDED ON THE QUESTIONNAIRE
Consent for non-pregnant women 15-49 years
We would like to collect two samples of blood from you. The sample will be collected by using a needle
to obtain blood from your veins and also through a finger prick blood specimen. Testing the blood will
also help us to determine if the two readings are the same, and thus help us know if the current methods
of measuring hemoglobin are accurate.
Do you agree that we can take two blood samples from you?
RECORD WHETHER OR NOT CONSENT IS PROVIDED ON QUESTIONNAIRE
Blood Sampling Methods and Analytical Devices in the Measurement of Hemoglobin | 13Appendix B. Sample Size Calculations
Laboratory Validation
The study design of the laboratory validation is shown in Figure B1.
Figure B1. Comparison of tests within cohorts
There are 10 different methods, distributed to be tested accordingly with figure 1. Each person of a
cohort will provide:
a) Venous blood sample
b) Capillary blood, either:
b.1 Pooled capillary blood (drop by drop, fill a purple cap microtube test (at least to the first
line), or
b.2 Third drop
Among these:
• venous blood sample is considered the gold standard,
• both venous blood sample and a capillary blood measurement are taken from the same person
within each cohort
Hence, the comparison of the data must be done with statistical tools that measure concordance or
agreement.
The hemoglobin measurement is a continuous numerical variable, therefore to test agreement on the
results coming from the different methods, CCC will be used (L. I. Lin 1989; L. I. Lin et al. 2002; L. Lin
1992).
14 | Protocol for ComparativeThe CCC is calculated using pairs of observations (coming from the same person), where one of these is
a gold standard (venous sample); but further analysis could be done comparing the different methods
among them, which would also give us information on how these methods agree among them.
Proposed sample sizes are given based on different precision and bias, and the selected sample size should
be the highest one. The selected sample size will be used for each of the four cohorts.
We will define the following terms that serve as the inputs to calculate the sample size (L. Lin 1992):
1) Precision: Precision refers to the “closeness of agreement between test results”. Pearson correlation
coefficient (r) evaluates how far the observation deviate from the best-fit linear line.
2) Bias: Bias refers to “The measure of accuracy evaluates how far the best fit line deviates from the
concordance line in the scale of 1 (no deviation) to (but not including) 0 (very far away). This bias consists
of a scale shift (ratio of 2 standard deviations) and a location shift (square difference in means relative to
the product of 2 standard deviations).”
Scale shift and location shift allow us to estimate bias. Assume the following values from a hypothetical
study:
1. Gold standard: Mean= 12 mg, standard deviation= 8 mg
2. New method: Mean= 11 mg, standard deviation= 7 mg
Scale shift: explains the relationship between the variability of the new method in relation to the gold
standard:
Location shift: estimates how far the mean value of the “new” method is from mean of the gold standard,
but related to the variability from both methods. In our example:
Sample sizes for CCC were calculated based on the assumption that the within-sample variation
among methods is small (assays would be under ideal conditions). We calculated sample sizes for
different levels of precision, location shift, and scale shift, as presented below;
1. 41 paired samples, based on
a. Precision of r2 = 0.95 (r = 0.98)
b. 1% loss of precision
c. Bias: location shift of 12.5% and a 10% scale shift
2. 31 paired samples, based on
a. Precision of r2 = 0.95 (r = 0.98)
b. A 2% loss of precision
c. Bias: location shift of 12.5% and a 10% scale shift
3. 17 paired samples, based on
a. Precision of r2 = 0.95 (r = 0.98)
b. A 1% loss of precision
c. Bias: location shift of 25% and a 10% scale shift
4. 16 paired samples, based on
a. Precision of r2 = 0.95 (r = 0.98)
b. A 2% loss of precision
c. Bias: location shift of 25% and a 10% scale shift
Blood Sampling Methods and Analytical Devices in the Measurement of Hemoglobin | 15Note: Paired samples are venous blood and capillary blood from the same person; Paired sample = 1 person A location shift of 35% and scale shift of 10% translates to about a 0.6 g/dL in mean difference and a 0.2 g/dL difference in standard deviation of Hb measurements by the two methods. We assume those to be the variation between the results and select the third assumption in the sample size calculations. Therefore, the recommended sample size is going to be 17 for each cohort. As three persons are going to be asked to take the capillary samples, each one of them is going to work with 6 WRA and 6 children, for a total of 18 WRA and 18 children per cohort. 16 | Protocol for Comparative
Appendix C. Characteristics of an Internal
Quality Assessment and Control
Characteristics of an Internal Quality Assessment and Control
[Quoted from the Micronutrient Survey Toolkit (Centers for Disease Control and Prevention (CDC)
2020)]
Quality Assessment
Quality assessment (QA) ensures that the final results reported by the analyst for all the analytes
measured in the laboratory are accurate and of the highest quality. To achieve high-quality results, full
staff participation is required. All laboratory personnel should be aware of the necessity for quality
performance to ensure that the laboratory retains its accreditation. QA ensures that all of the following
items are addressed: 1) avoidance of mistakes; 2) consistency of performance; 3) data integrity; and 4)
opportunities for training.
The basic components of a QA system include: 1) internal quality control (QC) through the use of
bench and blind QC samples; 2) external QA via participation in proficiency testing programs; 3)
equipment monitoring and maintenance; 4) documentation of policies and procedures; 5) proper staff
training; and 6) laboratory audits. However, before the quality and consistency of any laboratory
method can be monitored, prospect methods must be validated (for accuracy, precision, sensitivity, and
ruggedness) and verified periodically (verification of calibration, verification of accuracy of pipettes,
instruments, etc.).
Internal Quality Control
Bench QC: Bench QC pools are typically prepared in-house by the laboratory in quantities sufficient to
last for a few years (depending on the stability of the material) and they are incorporated after
characterization into each assay in an open way (analyst knows the identity and concentration expected
in the sample).
Usually three levels of bench QC pools—a low, medium, and high pool—are prepared. During each
assay, these three levels of bench QCs are analyzed together with unknown subject samples by placing
them at the beginning and the end of the run.
Laboratories should prepare their own bench QC pools and characterize them appropriately
(throughout a 20-day period) before incorporating them into the analysis of survey samples. Separate
documents provide guidance about how to prepare bench QC pools, including how to determine and
apply acceptability limits for each pool. No samples should be analyzed without using bench QC
samples in every run (ideally at the beginning and end of each run). If the QC pools are not within the
acceptability limits, the results of the assay or the complete run should not be accepted; the analyst
should determine the cause of the QC failure, and address the problem appropriately, and repeat the
run.
Blind QC: Blind QC pools also typically are prepared in-house by the laboratory in quantities sufficient to
last for a few years (depending on the stability of the material) and incorporated after characterization
into each assay in a blinded way (analyst does not know the identity and concentration of the samples).

                             Blood Sampling Methods and Analytical Devices in the Measurement of Hemoglobin | 17
Two levels of blind QCs samples (e.g., a low and high pool) are typically prepared by the laboratory. The blind QC samples labels are very similar to the survey subject’s labels, and only the supervisor or someone not involved with the analysis should know which samples are blind. Also, only the supervisor or someone not involved with the analysis should insert the blind QC samples into the survey samples to ensure the analyst does not know the position of the blind QC samples in the box. Using blind QC samples helps the survey coordinator or the external party evaluating the laboratory results better judge the laboratory performance and, therefore, builds confidence in the data. Ideally, similar variability (CV) on bench and blind QC samples is expected. Using blind QC samples also helps identify potential errors that may occur when the samples are misidentified during the assay because the supervisor knows the position of the blind QC and its concentration. Note: If it is not possible to prepare stable samples of the “Bench QC” and “Blind QC” pools that can be kept over a long span of time, please use the methods described in Appendix D on use of stabilized quality control materials and frequent external quality control testing. 18 | Protocol for Comparative
Appendix D. Characteristics of an External
Quality Assessment Program

Characteristics of an External Quality Assessment/ Proficiency
Testing Program
[Quoted from the Micronutrient Survey Toolkit (Centers for Disease Control and Prevention (CDC)
2020)]
External Quality Assessment (EQA) is a valuable and important tool for laboratories to assess how their
values compare to other methods and laboratories and, therefore, to assess the quality of their results.
The Centers for Medicare & Medicaid Services (CMS) maintains a list of official, proficiency testing (PT)
programs approved by Clinical Laboratory Improvement Act (CLIA)
(http://www.cms.hhs.gov/CLIA/14_Proficiency_Testing_Providers.asp). In these programs, laboratory
performance is rated according to pass/fail criteria. EQA programs are not regulatory in nature, but
they do provide valuable feedback to laboratories.
Some common EQA/PT programs for nutritional indicators are available at:
    •    College of American Pathologists (CAP) (http://www.cap.org/apps/cap.portal)
    •    United Kingdom Vitamin D External Quality Assessment Scheme (UK DEQAS)
         (http://www/deqas.org)
    •    United Kingdom National External Quality Assessment Service (UK NEQAS)
         (http://www.ukneqas-haematinics.org.uk/)
    •    National Institute of Standards and Technologies Micronutrients Measurement Quality
         Assurance Program (NIST MMQAP) (http://www.cstl.nist.gov/acd/839.02/qa.html)

These programs provide QC samples to participating laboratories several times per year (the number of
samples and frequency may vary with different programs). The unknown samples are analyzed by
participating laboratories and the results are reported to the organizer within a predefined reporting
period for performance assessment. The organizer compiles all results and generates reports that are
distributed to the participating laboratories. The EQA program sets criteria for acceptability of the
participating laboratory’s results based on different criteria. Typically, laboratory results are compared
to an all laboratory trimmed mean (ALTM) or a method-specific mean (if method differences exist),
therefore the interpretation of results is not necessarily accuracy based. However, if a particular analyte
has been standardized and/or if target values for the EQA materials have been assigned by an accuracy-
based method, the EQA program can check for accuracy of results. The laboratory results are
considered acceptable if they fall within the range of acceptability. Typically, 80% of laboratory results
must fall within predefined acceptability limits for the laboratory to pass an EQA challenge.

Equipment Monitoring and Maintenance

Laboratory equipment should be checked regularly to ensure acceptable performance. Each analytical
procedure outlines the maintenance and function tests that must be conducted on the equipment to
ensure proper method performance and acceptable results. These checks must be made at the interval

                             Blood Sampling Methods and Analytical Devices in the Measurement of Hemoglobin | 19
specified in the procedure documentation. Maintenance and function checks should be documented in
the equipment log. Failure of a function check, and remedial action taken, also should be documented in
the equipment log. It is also important to regulate the temperature of instruments with temperature-
dependent components or functions. Stable temperatures must be maintained in freezers in which assay
materials requiring low temperatures (e.g., -20ºC or -70ºC) are kept. Freezer and refrigerator
temperatures should be checked weekly and results should be recorded in maintenance logs. Freezers
and refrigerators should be monitored regularly for excessive ice deposits and inoperative cooling fans.
Eye-wash stations should be flushed weekly. Deionized water systems and fire extinguishers should be
checked monthly. Problems should be reported to the laboratory chief for action.
Equipment monitoring maintenance logs: The calibration of pipettes and pipetting devices should be
verified regularly (at least every 6 months) and results should be recorded in maintenance logs; pipettes
should be recalibrated if they do not meet performance specifications. The calibration of balances and
centrifuges should be verified at least annually and results should be recorded in maintenance logs;
balances and centrifuges should be recalibrated if necessary. Other equipment such as
spectrophotometers should be calibrated regularly to ensure that they provide accurate readings and
results should be recorded in maintenance logs. Date, finding, and person conducting the procedure
should be recorded in the maintenance log for any calibration, calibration verification, or maintenance
procedure. Dates of replacement of parts, such as inline filters, columns, and guard columns, should be
noted. For chromatographic methods, test chromatograms for each column should be kept. Each new
column should be compared to the column it is replacing by analyzing a set of QC pools to ensure that
the column gives acceptable separation before it is used for routine analyses.
Documentation of Policies and Procedures
Documentation is a written procedure to be followed by all the staff working on the analyses.
Safety precautions for all methods and procedures should be well documented. The laboratory chief
ensures that the primary laboratory analyst has read and is familiar with safety precautions involved in
each procedure.
A written Methods Procedure Manual for performing all analytical methods used by the laboratory
must be readily available and followed by laboratory personnel. It must be approved, signed, and dated
by the laboratory director. Any changes must also be approved, signed, and dated by the laboratory
director. To assure uniformity and minimize differences between analysts, all staff performing analyses
must be aware of any changes so that everyone follows the same procedures.
For analytical runs, the run date, calibration results, QC results, and the analyst who prepared the
specimens should be kept. Ideally, records of everything that might affect the results of the analyses
should be kept. These records will make it simpler to determine the source of analytical problems and
correct them.
Labeling is a key component for staff both in the laboratory and in the field:
• Laboratory: Reagents, solutions, and other supplies must be labeled appropriately to indicate
the identity of contents, concentration, preparation and expiration date, name of preparer,
recommended storage requirements, and any other pertinent information required for
proper use. Chemicals should also be labeled to indicate a receipt date and open date.
• Field: The field and laboratory staff involved in the surveys should be well trained to
properly label Vacutainers/vials used for blood or urine collection and sample storage, and
slides used to prepare malaria smears. The cryovial boxes used for storing samples should
be labeled appropriately and stored in freezers. All samples collected and stored should be
documented using electronic lists. Bar-code labeling of tubes, vials and boxes is preferred
whenever possible.
20 | Protocol for ComparativeYou can also read