Machine Vision based Sample-Tube Localization for Mars Sample Return - Renaud Detry
←
→
Page content transcription
If your browser does not render page correctly, please read the page content below
To appear in IEEE AeroConf, 2021. This copy is for
                                        personal use only. c 2021 IEEE. Prints shortly available at http://ieeexplore.ieee.org.

        Machine Vision based Sample-Tube Localization for
                      Mars Sample Return
                 Shreyansh Daftry, Barry Ridge, William Seto, Tu-Hoa Pham, Peter Ilhardt⇤ , Gerard Maggiolino⇤ ,
                      Mark Van der Merwe⇤ , Alex Brinkman, John Mayo, Eric Kulczyski and Renaud Detry
                                  Jet Propulsion Laboratory, California Institute of Technology
                                                      Pasadena, CA, USA
                                            Shreyansh.Daftry@jpl.nasa.gov

Abstract—A potential Mars Sample Return (MSR) architecture
is being jointly studied by NASA and ESA. As currently envi-
sioned, the MSR campaign consists of a series of 3 missions:
sample cache, fetch and return to Earth. In this paper, we
focus on the fetch part of the MSR, and more specifically
the problem of autonomously detecting and localizing sample
tubes deposited on the Martian surface. Towards this end, we
study two machine-vision based approaches: First, a geometry-
driven approach based on template matching that uses hard-
coded filters and a 3D shape model of the tube; and second, a
data-driven approach based on convolutional neural networks
(CNNs) and learned features. Furthermore, we present a large
benchmark dataset of sample-tube images, collected in rep-
resentative outdoor environments and annotated with ground
truth segmentation masks and locations. The dataset was ac-
quired systematically across different terrain, illumination con-
ditions and dust-coverage; and benchmarking was performed to
study the feasibility of each approach, their relative strengths
and weaknesses, and robustness in the presence of adverse
environmental conditions.

                                                                                                          Figure 1. NASA’s Mars Perseverance rover, which serves as
                          TABLE OF C ONTENTS                                                              the first stage of the MSR campaign, will store rock and soil
                                                                                                            samples in sealed tubes on the planet’s surface for future
1. I NTRODUCTION . . . . . . . . . . . . . . . . . . . . . . . . . . . . . . . . . . . . . . 1                    missions to retrieve, as seen in this illustration.
2. R ELATED W ORK . . . . . . . . . . . . . . . . . . . . . . . . . . . . . . . . . . . . 2
3. S AMPLE - TUBE L OCALIZATION . . . . . . . . . . . . . . . . . . . . . 2
4. T EMPLATE - BASED O BJECT D ETECTION . . . . . . . . . . . 3                                           the geological history of Mars. Even if an orbital or in situ
5. DATA - DRIVEN S EGMENTATION . . . . . . . . . . . . . . . . . . . . . 3                                mission were to discover putative evidence for the existence
                                                                                                          of past or present life on Mars, confirming these results would
6. B ENCHMARKING DATASET . . . . . . . . . . . . . . . . . . . . . . . . . . 4                            necessitate that samples be collected, returned to Earth, and
7. E XPERIMENTS AND R ESULTS . . . . . . . . . . . . . . . . . . . . . . . 5                              verified by multiple rigorous laboratory analyses on Earth.
8. C ONCLUSION AND F UTURE W ORK . . . . . . . . . . . . . . . . . 7                                      As a result, returning samples from Mars back to Earth was
ACKNOWLEDGMENTS . . . . . . . . . . . . . . . . . . . . . . . . . . . . . . . . . . 9                     identified as the highest priority planetary science objective
R EFERENCES . . . . . . . . . . . . . . . . . . . . . . . . . . . . . . . . . . . . . . . . . . . 9       in the Planetary Science Decadal Survey [3].
B IOGRAPHY . . . . . . . . . . . . . . . . . . . . . . . . . . . . . . . . . . . . . . . . . . 11         In response to that, a potential concept for a Mars Sample
                                                                                                          Return (MSR) architecture is being jointly studied by NASA
                                                                                                          and ESA [4]. As currently envisioned, the MSR campaign
                             1. I NTRODUCTION                                                             consists of a series of 3 missions: sample cache, fetch and
                                                                                                          return to Earth. First, NASA’s Perseverance Rover, launched
Determining the habitability of past and present martian                                                  in 2020, will collect scientifically selected samples and store
environments continues to be the focus of current and future                                              them in sealed tubes on the planet’s surface (see Figure1), for
missions to Mars. Indeed, studying the geological history of                                              possible return to Earth. Then, a potential future mission,
Mars holds the key to both understanding the origins of life                                              with a Sample Retrieval Lander (SRL), would collect the
on Earth and in the Solar System. While recent and ongoing                                                sample tubes and load them into an Orbiting Sample (OS)
robotic missions have revolutionized our understanding of the                                             payload in a Mars Ascent Vehicle (MAV). The MAV would
red planet [1], [2], the results from orbital and in-situ surface                                         release the OS into Martian orbit. The third mission, an Earth
robotic missions alone are not sufficient to fully answer the                                             Return Orbiter (ERO), would rendezvous with the samples in
major questions about the potential for life, past climate, and                                           Mars orbit and ferry them back to Earth.
⇤ P. Ilhardt, G. Maggiolino and M. Merwe were interns at JPL during
this work, and are currently affiliated with Capgemini, Carnegie Mellon
                                                                                                          This work focuses on the SRL mission concept [5] to collect
University and University of Michigan, respectively.                                                      and retrieve the sample tubes. The SRL mission would deploy
978-1-7281-7436-5/21/$31.00 c 2021 IEEE                                                                   a lander in the vicinity of Jezero Crater, where the Mars
                                                                                                      1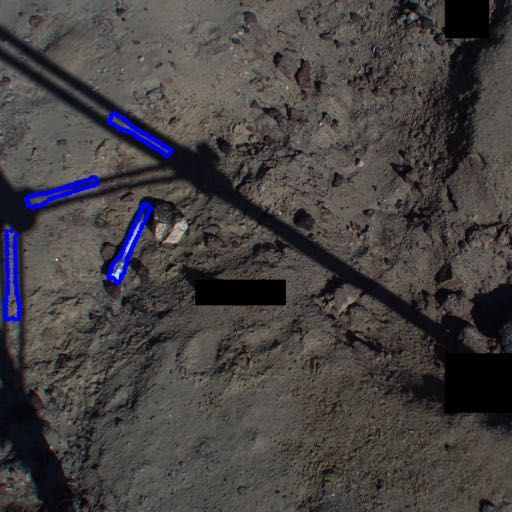
Perseverance rover plans to land and collect and cache sam-             is tackled by matching feature points between 3D models and
ples during its 1.25-Mars-year primary surface mission. Key             images [23], [24]. However, these methods require that there
payloads on SRL would include an ESA-provided Sample                    are rich textures on the objects in order to detect features for
Fetch Rover (SFR) and Sample Transfer Arm (STA), and                    matching. As a result they are unable to handle texture-less
a NASA-provided OS and MAV. Once on the surface, the                    objects like sample-tubes. More recently, with the advent of
SFR would egress from SRL and begin its surface mission                 deep learning, CNNs by comparison, have made significant
to retrieve samples previously cached by Mars Perseverance              progress in object classification [25], detection [26], [27],
Rover at one or more depot locations. The solar-powered                 semantic segmentation [28] and instance segmentation [29],
SRL mission would then carry out its surface activities during          including their application to Mars rover autonomy [30], [31].
Martian spring and summer, maximizing available power, and
would complete its surface mission and launch the retrieved             For texture-less object detection, the taxonomy of approaches
samples into orbit before start of northern hemisphere fall,            can be broadly classified into three categories: feature-based,
prior to significant decrease in available solar power and in           view-based and shape-based. The feature-based approaches
advance of the potential for global dust storms. According to           [32], [33], [34] match 2D image features like edges or line
the currently envisioned surface mission timeline, this would           segments to the corresponding 3D model points. The view-
allocate ⇠ 150 sols for SFR to complete this retrieval and              based approaches [35], [36], [37] compare a given image of
return to SRL. With a nominal 4-km SRL landing dispersion,              the object with its pre-computed 2D views. Lastly, shape-
this drives the need for high levels of SFR autonomy and                based approaches [38], [39], [40], [41], [42] are based on
mobility, with support for drive distances of up to ⇠ 500               template matching of edge-segments. Furthermore, end-
m/sol, and with efficient operations during tube pickup at the          to-end learning based methods [43], [44], [45] have also
depot site(s) and tube transfer to SRL.                                 been proposed that utilize deep learning for the task of 6D
                                                                        pose estimation directly from RGB images as the only input
In this paper, we study the problem of autonomously de-                 modality.
tecting and localizing sample tubes deposited on the Martian
surface directly from camera images. In Section 4 we discuss
the first of two machine-vision approaches that we studied,                     3. S AMPLE - TUBE L OCALIZATION
a geometry-driven approach based on template matching that
uses hard-coded filters and a 3D shape model of the tube; and           The operational context assumed is as follows. The Persever-
in Section 5 we discuss the second, a data-driven approach              ance rover will place sample tubes on the ground at one or
based on convolutional neural networks (CNNs) and learned               multiple (presently-unknown) sites referred to as tube depots.
features. In Section 6, we present a large benchmark dataset            Within each tube depot, the sample-tubes will be placed
of sample-tube images, collected in representative outdoor              several meters apart in areas where sand is not abundant
environments and annotated with ground truth segmentation               and that have a relatively flat ground with slopes less than
masks and locations. The dataset was acquired systematically            25 . It is to be noted that Perseverance has little control
across different terrain, illumination conditions and dust-             over precise tube placement: tubes will be released from the
coverage. Finally, in Section 7, we describe the bench-                 rover’s underbelly, and may bounce and roll on the ground
marking evaluations that were performed using well-known                before coming to a halt. Furthermore, it is anticipated that
metrics to compare and assess the two methods using this                SFR is capable of autonomously driving from tube to tube – a
data.                                                                   capability addressed in a separate paper [46]. For the context
                                                                        of this paper, this implies that SFR can drive itself to a pose
                                                                        that places a tube within its field of view.
                  2. R ELATED W ORK                                     Based on these assumptions, our understanding of the Mar-
Mars Sample Return                                                      tian conditions (weather, geology, etc.) and through qualita-
Several studies have been conducted over the last few decades           tive observation of past lander and rover images, we can con-
with the goal of defining science objectives for Mars Sam-              servatively hypothesize the following constraints: (a) tubes
ple Return [3], [6], [7], [8] and potential mission concept             will not move, (b) sand or dust may, with low probability,
architectures [9], [10], [11], [12]. Furthermore, to enable             pile up next to tube or rocks, forming drifts, and (c) dust will
this vision, several research and technology development                deposit everywhere, creating a dust layer that will not exceed
efforts [13] have been under way - from autonomous rover                0.25 mm in thickness. Rovers typically operate between
technology [14], [15] to OS design and capture-systems [16],            10am and 4pm, yielding a large range of lighting conditions,
[17]. Our work is closely related to, and a continuation of,            including shadows incurred by rocks or by the rover itself.
the efforts to demonstrate robust localization and autonomous
retrieval of sample-tubes from a Mars-like environment for              Our goal is to then to study the robustness for image-based
potential Mars Sample Return. While [18] served as an                   detection and localization of sample-tubes under these con-
initial proof-of-concept, subsequent work [19], [20], [21]              straints. More specifically, we quantify the performance of
                                                                        two object localizers for sample-tube detection in a variety of
further studied the problem of direct and indirect sample-tube          of conditions that include clear, non-occluded tubes, partial
localization in an analog indoor testbed. In this work, we do
a comprehensive study on the performance of sample-tube                 occlusions by rocks or sand, or partial or complete shadows.
detection algorithms on a benchmark dataset collected in a              We focus on the detection and localization only from a
representative outdoor environment.                                     single images for two reasons: first, it allows the proposed
                                                                        algorithms to be applicable to a diverse set of scenarios (e.g.
Image-based Object Detection and Localization                           if we want to detect using either a mast-mounted stereo
                                                                        camera or a wrist-mounted monocular camera), and second,
Object detection and localization, as of one the most fun-              based on our preliminary analysis we expect depth data on the
damental and challenging problems in machine vision, has                sample-tubes to be noisy and thereby not very helpful for the
received great attention in recent years - see [22] for a review.       detection task. Extensive analysis on the usefulness of stereo
Traditionally, the problem of object detection and localization         range data is beyond the scope of this paper.

                                                                    2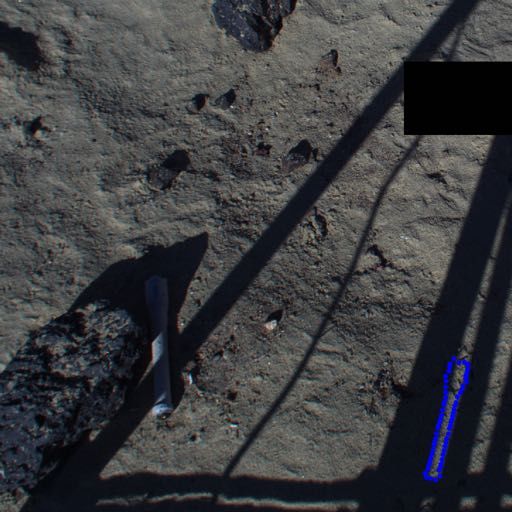
more discriminant than other forms of representation [49].
                                                                       Additionally, image gradients are often the only reliable im-
                                                                       age cue when it comes to texture-less objects. Furthermore,
                                                                       considering only the orientation of the gradients and not their
                                                                       norms makes the measure robust to contrast changes, and
                                                                       taking the absolute value of cosine between them allows it
                                                                       to correctly handle object occluding boundaries: It will not
                                                                       be affected if the object is over a dark background, or a bright
                                                                       background.

                                             ……
                                                                       Template Matching
        T=                                                             Template matching is done by measuring the similarity be-
                                                                       tween an input image I, and a reference image O of the
                                                                       sample-tube centered on a location c in the image I by
                                                                       comparing the gradient orientation features. A model or
   Figure 2. Sample set of templates T generated using                 template T is defined as a pair T = (O, P), where P specifies
   different viewpoints sampled around the sample-tube.                a region in O. The template can then be compared with a
                                                                       region at location c in a test image I based on a modified
                                                                       version of the similarity measure proposed by Steger [50]:
The two localizers considered in this paper are a template-
based object detector [38], and a region-proposal network                         X⇣                                            ⌘
[29]. Template-based object detection has more industrial                    "=           max      cos ori(O, r)    ori(I, t)       (1)
                                                                                        t2R(c+r)
maturity, and it shares building blocks with methods that ran                     r2P
on spacecrafts [47], [48]. Template matching lends itself to
introspection and ad-hoc treatment of edge cases. By con-              where ori(O, r) is the gradient orientation at location r and
trast, convolutional networks have almost no flight heritage,          R(c + r) defines the neighbourhood of size T centered on
and their design is harder to validate, but their performance is       location c + r.
often substantially better than template matching.
                                                                       In order to avoid evaluating the max operator in Equation
                                                                       1 every time a new template must be evaluated against an
  4. T EMPLATE - BASED O BJECT D ETECTION                              image location, a binary representation of the feature space is
                                                                       used [51]. First, the gradient orientation map is quantized by
Our approach is based on Line2D [38], [39], an efficient               dividing it into n0 equal spacing. To make the quantization
template-matching based method that exploits color images              robust to noise, we assign to each location the gradient whose
to capture the appearance of the object in a set of templates          quantized orientation occurs most often in a 3x3 neighbor-
covering different views. Because the viewpoint of each                hood. Next, the possible combination of orientation spreads
template is known, it also provides a coarse estimate of the           to a given location m is encoded using a binary string. These
6D pose of the object when it is detected. In the remainder of         strings are then used as indices to access lookup tables for fast
this section, we give an overview of the Line2D method and             pre-computation of the similarity measure. Since the lookup
how we use it to detect and localize sample-tubes.                     tables are computed offline and shared between the templates,
                                                                       matching several templates against the input image can be
Generating Templates using a 3D Model                                  done very fast once the maps are computed.
Given a 3D CAD model of the sample-tube, a library of
2D templates are automatically generated that covers a full
view hemisphere by regularly sampling viewpoints of the                        5. DATA - DRIVEN S EGMENTATION
3D model, as illustrated in Figure 2. During the generation
of template library, it is important to balance the trade-off          Region Proposal CNNs
between the coverage of the object for reliability and the             Modern CNNs are powerful models that leverage large la-
number of templates for efficiency. This is solved by re-              beled datasets in order to automatically derive visual feature
cursively dividing an icosahedron, the largest convex regular          hierarchies directly from the data such that a learning task,
polyhedron. The vertices of the resulting polyhedron give              e.g. object classification, can be solved. In this section we
us the two out-of-plane rotation angles for the samples pose           describe our use of the popular CNN-based object instance
with respect to the coordinate center. In our experiments, two         segmentation model known as Mask R-CNN [29] for tube
adjacent vertices are set to be approximately 10 degrees apart.        localization. The “R” in “R-CNN” stands for “region-based”
In addition to the these two out of plane rotations, templates         and refers to a class of CNN networks that typically extend
for different in-plane rotations are also created. Furthermore,        the classification capabilities of their forebears (e.g. [52],
templates at different scales are generated by using different         [53], [54]) by adding a regression head to the architecture
sized polyhedrons, using a step size of 10 cm.                         such that they can predict continuous values for object region
                                                                       proposal as well as object class labels. This can be used
Gradient Orientation Features                                          to predict bounding box parameters of the objects under
For each sampled pose generated by the method described                consideration, for example, such that the objects may be
above, the sample-tube’s silhouette is first computed by pro-          localized within images as opposed to solely having their
jecting its 3D model under this pose. The silhouette contour           presence detected [55].
is then quickly obtained by subtracting the eroded silhouette
from its original version. Next, all the color gradients that          Instance Segmentation with Mask R-CNN
lie on the silhouette contour are computed. Image gradients            Mask R-CNN builds on its predecessors Fast R-CNN [26]
are chosen as features because they have been proved to be             and Faster R-CNN [27], which were limited to bounding
                                                                   3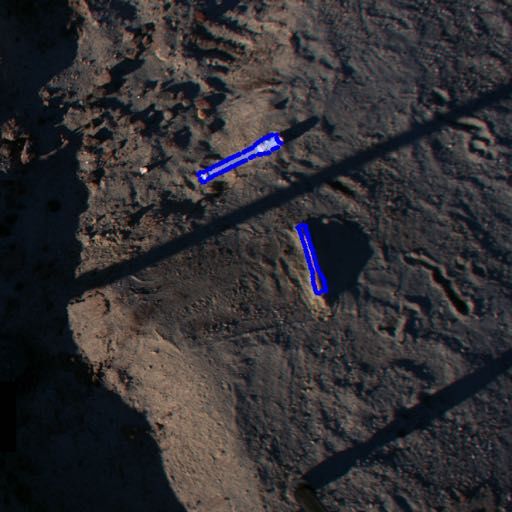
box prediction, by additionally allowing for segmentation
masks to be predicted. While related models like the Fully
Convolutional Network (FCN) [28] have dealt with semantic
segmentation, that is segmenting an image and associating the
segments to the object classes to which they belong, Mask
R-CNN tackles the more challenging problem of instance
segmentation whereby individual instances of objects from
those classes must be identified and segmented. For our
purposes in solving the task of sample tube localization,
all of these methods are viable candidates, but the instance
segmentation provided by Mask-RCNN enables candidate
tube instances to be directly identified and segmented without         (a) Camera setup at the             (b) Camera positioning around tubes.
needing to further process the bounding box or segmentation            Mars Yard at JPL.
results provided by the other methods.
Mask-RCNN uses the architecture of Faster R-CNN to both
predict the class label and to regress the bounding box
parameters, but it augments this with an FCN-based mask
prediction branch in order to additionally predict the regional
segmentation masks in parallel. There is some generality
to the architecture in that a number of possible CNN back-
bones can be used for the convolutional feature detection
component of the Faster R-CNN branch, e.g. ResNet [52],                       (c) Sample images on flagstone (left) and CFA 6 rocks (right).
ResNeXt [53] or Feature Pyramid Networks (FPN) [54]. In
our experiments for this work we used ResNet-50 exclusively
[52]. For training, Mask R-CNN makes use of a multi-
task loss L = Lcls + Lbox + Lmask that is comprised of the
classification loss Lcls and the bounding-box loss Lbox from
[26], as well as a segmentation mask loss Lmask . Lmask is
defined by taking the average binary cross-entropy loss over
the per-pixel sigmoid-activated output of the mask prediction
branch which is made up of K m⇥m resolution output masks
for each predicted region of interest, where K is the number                      (d) Sample images on ditch (left) and riverbed (right).
of ground-truth classes.
Using Mask R-CNN for Tube Localization
As is typical, the Mask R-CNN model we employ uses model
weights pre-trained on the ImageNet dataset [25], [56] and
transfer learning is used to fine-tune the weights for our
particular task. The tube localization problem presented here
is relatively simple in terms of the classification component
since we need only detect the presence or absence of tubes in
the scene, so we make use of only a single “tube” class label          (e) Sample images with tag-mounted tube: flagstone (left) and CFA 2 (right).
alongside the background class. With regard to localizing the
tube, given the fetch rover grasping requirements, as well as            Figure 3. Outdoor dataset: (a) testbed, (b) capture grid,
for a direct comparison with the template matching method                               (c-d) sample images.
described in the previous section, we are less interested in the
bounding box output than we are in obtaining the segmen-
tation masks. Thus, although we annotate the training data
with each of the class, bounding box and segmentation mask             of 1m and 2m to simulate images acquired by HazCams and
ground truth labels and train our Mask R-CNN model with                NavCams, respectively. Also, the cameras were covered by
all three of them, for the purposes of this paper, at inference        an aluminum plate serving as heat shield for extended use
time we discard the bounding box output and we restrict our            under sunlight (as shown in Fig 3a).
subsequent experimental analyses to the segmentation masks.
                                                                       Data Collection
                                                                       To evaluate the performance and robustness of our methods,
                                                                       we captured a dataset of outdoor images in JPL’s Mars
           6. B ENCHMARKING DATASET                                    Yard. The curated set of images represents both nominal
                                                                       and adverse environmental conditions we expect SFR to face
Camera Acquisition Setup                                               on Mars. An outdoor dataset provides us images of realistic
We constructed a camera acquisition setup made up of four              scenes that contain: 1) diverse and varying terrain, informed
FLIR BlackFly S cameras (5472 ⇥ 3648, color, 77 field of               by discussions with Mars geologists who plan where sample
view) that form two stereo pairs with baselines of 20cm and            tubes could be dropped; 2) natural shadows and lighting that
40cm. The cameras, optics and the overall acquisition setup            create appearance variation for the tube we are detecting. Ad-
(baselines and heights) are representative of the Perseverance         ditionally, we further vary the tube appearance by considering
rover’s onboard cameras - EECAMs [57]. During image                    another adverse condition, object occlusion. Specifically, we
acquisition, we set the camera tripod at two different heights         achieve this by positioning tubes next to rocks or terrain fea-
                                                                       tures to induce varying levels of occlusion, and also covering
                                                                   4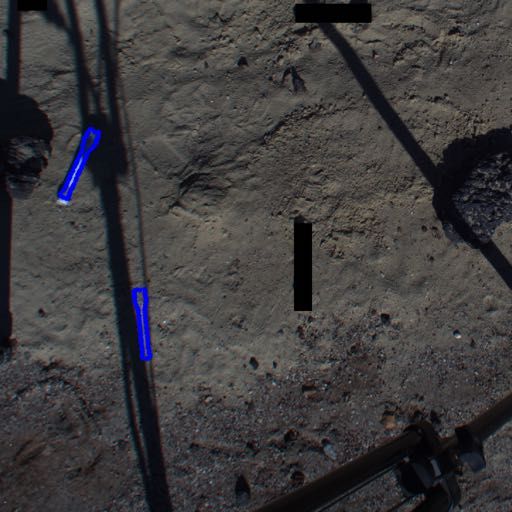
tubes with dust. We vary the amount of dust coverage in a
few ways: 1) sprinkling a light layer of dust; 2) building up
a “dune” on the side of a tube; 3) totally covering a partial
section of the tube with a mound of sand.

Ground Truth Annotations—Finally, we enable quantitative
evaluation of detection results against the dataset by provid-
ing ground truth segmentation masks with associated bound-
ing boxes for 2D object detection benchmarking and 6DOF
poses for a subset of the data, for pose estimation evaluation.
The segmentation masks are manually annotated using the
coco-annotator tool [58]. Ground truth 6D poses are obtained
by rigidly mounting a pair of AprilTags [59] to one of the
tubes. Two tags (see Fig-3e) were chosen for robustness
since the occurrence of shadows sometimes hindered the tag
detection algorithm. The tags are also mounted a sufficient
distance away from the tube to not interfere with detection.
During construction of the scene, care was also taken to cover
the mount with sand so the tube appears as an isolated object.
The dataset comprises the following:

•  One subset of images that does not contain the ground-
truth tube with the mounted AprilTags (no-tags dataset). This
set of images contains four terrain types: two terrain types
constructed with consultation from the Mars geologists, and
two extra ones we created based on other interesting features
we saw in the Mars Yard to add more scene diversity (see
Figs. 3c and 3d):
  – “Flagstone”: broken stone slabs covered with a thin layer
of dust emulating fractured bedrock on Mars.
  – “CFA6”: a rock distribution of cumulative fractional area
(CFA – a measure of rock density) equal to 6%. These are
the smallest rocks that are still visible from orbit to guide
the choice of depot location. Rocks encountered in practice
would only be this big or smaller.
  – “Ditch”, and “Riverbed”: These 2 terrain types were
simply named for the varying levels of surface depression we          Figure 4. Precision Recall curves for the (a) no-tags and (b)
observed in the terrain.                                                  with-tags datasets using the Line2D object detector.
• Another of subset of images that contains the tube mounted                                     [5pt]
with AprilTags (with-tags dataset). This set of images con-
tains the three terrain types we expect to experience on Mars:
  – “Flagstone” and “CFA6”: same as in the other set.                    Dataset       Method       AP [.5]      AR [.5:.05:.95]
  – “CFA2”: small pebbles that are only visible from rover               no-tags       Line2D        0.345            0.184
surface imagery and not orbit.
• Capture conditions common to both sets of images:                     with-tags      Line2D        0.255            0.153
  – images taken in one of two different capture times: “am”
(10am to 12pm), or “pm” (3pm to 5pm)                                     Table 1. Quantitative results using the Line2D object
  – 5 or 6 sample tubes with variable visibility: unoccluded,           detector. AP and AR IoU thresholds are shown in square
or partially occluded by rocks and/or sand and dust.                                           brackets.
  – images taken in one of 8 camera tripod positions on a
circle around the scene, see Fig. 3b)
  – 2 camera heights at each stop (1m and 2m)
  – 4 cameras: 2 stereo pairs of baseline 20 and 40 cm                vironment. All the experiments were conducted using the
                                                                      benchmark dataset described in Section 6.
The dataset in total contains 824 images (256 with the tag-           Evaluation Metrics
mounted tube and 568 without), and 4852 annotated instances
of tubes, out of which 256 of those have an associated 6D             In order to evaluate and compare the template matching
pose. These images were collected over 2 separate days.               and data-driven segmentation methods presented here, we
                                                                      make use of some of the de facto standard statistical metrics
                                                                      popularized in the literature and in computer vision contests,
                                                                      namely average precision (AP) and average recall (AR) val-
         7. E XPERIMENTS AND R ESULTS                                 ues and precision-recall (PR) curves.
In this section, we present experiments for both quantita-
tive and qualitative performance analysis of the two object           Average Precision—Various interpretations of the AP met-
localizers for sample-tube localization on a Mars-like en-            ric have been proposed over the years, particularly in the
                                                                  5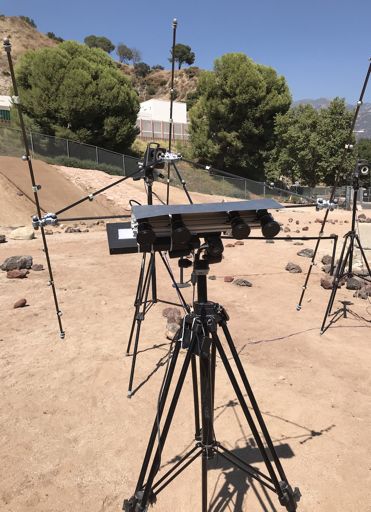
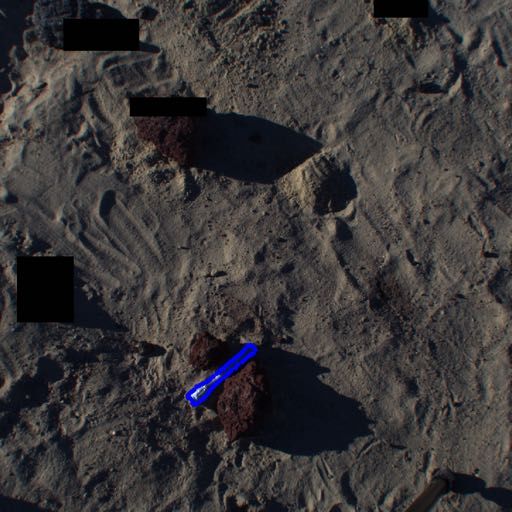
Figure 5. Example true positive results for sample-tube detection using the Line2D detector.

                 Figure 6. Examples of failure cases for sample-tube detection using the the Line2D detector.

PASCAL VOC [60] and MS COCO [61] challenges. In all                     Performance Analysis of Template Matching
cases, given an intersection-over-union (IoU) threshold for             The Line2D detector was trained using 7000 templates
determining whether a prediction should be scored as a true             generated from the 3D model of the sample-tube. The
positive (TP) or a false positive (FP) based on the amount
of overlap between the predicted mask and the ground truth              test data consisted of images from the benchmark dataset,
                                                                        down-scaled to half-resolution and randomly cropped to
mask, cumulative precision and recall values are collated in            1024x1024. The reasons to generate cropped images were
a confidence-score-ranked PR table. These values may then
either be used to produce PR curves or to calculate the AP.             two-fold. First, to match the input dimensions of the learning-
The variation between the PASCAL VOC and MS COCO                        based localizer for a fair comparison. Second, larger image
metrics lies in how the AP is calculated using these values.            size also increases the computational complexity of the al-
                                                                        gorithm. Table 1 shows the quantitative performance of the
The PASCAL VOC 2008 AP metric divided the recall di-                    template matching based object localizer on the benchmark
mension into 11 points, interpolated the precision values and           dataset using the AP and AR metrics. Furthermore, we also
                                                                        plot the PR curve in Figure 4 to demonstrate the inherent
averaged them, whereas PASCAL VOC 2010-2012 estimated                   tradeoff between the precision and recall of our detector
the area under the curve. The MS COCO metric by com-
parison, which we use for our evaluations here, takes a 101-            as a function of different threshold values. The overall
                                                                        quantitative performance of the template-based matching is
point AP interpolation while also evaluating the AP across              encouraging, especially given the challenging and adversarial
multiple IoU threshold values and/or averaging over a range
of thresholds. Unless otherwise stated, in the analyses below,          scenarios presented in our dataset. The low AP and AR values
                                                                        can be explained by the large number of false positives and
we use the MS COCO AP at IoU = 0.5 with all area sizes                  false negatives, typical of most model-based algorithms.
and maximum 100 detections, and we use the MS COCO
AR averaged over a range of 10 IoU thresholds between 0.5               Next, we qualitatively analyze the the performance of the
and 0.95 with a step size of 0.05 with the same area and
max detection criteria. With regard to the mission goals,               detector as a function of different terrain types and environ-
since we plan to use a 6D pose estimator to refine the tube             mental conditions. Some example results from successful
localization post-detection, we can afford to use a looser AP           detections using the Line2D detector are presented in Figure
overlap criterion so long as precision is maximized: we would           5. It can be observed that the template matching algorithm
                                                                        is able to robustly detect sample-tubes in a wide variety of
rather avoid falsely labeling tubes on the first pass than highly       terrain (flat ground vs. cracks of bedrock) and illumina-
accurately segmenting those tubes that we do correctly detect.
                                                                        tion conditions (well-lit vs partial-shadow vs completely in
                                                                        shadow). The shape-based similarity measure also allows
Precision-Recall Curves—In the figures presented below, PR              the template matching to be robust to partial occlusions (see
curves are shown where the interpolated precision values are
used for the 101 recall points used by the MS COCO AP                   examples where tubes are places next to a rock).
metric. Plots are shown for PR curves for a range of 10 IoU             Finally we also look at some of the systematic failure cases
thresholds between 0.5 and 0.95 with a step size of 0.05.
                                                                        where the template matching based detector’s performance

                                                                    6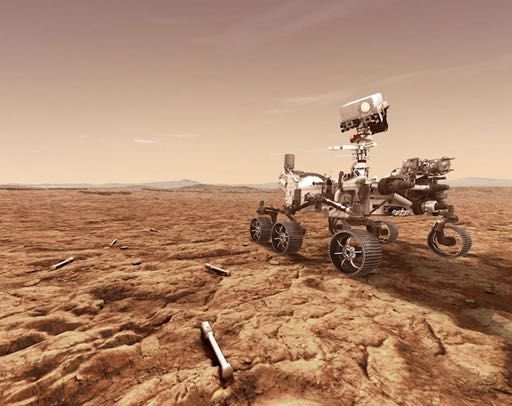
while the other was trained on the no-tags dataset and eval-
                                                                     uated on the with-tags dataset. In each case the training
                                                                     data consists of 1200 ⇥ 1200 images that are converted to
                                                                     grayscale, box-filtered and randomly cropped to 1024 ⇥ 1024
                                                                     to match the input size expected by the network and to allow
                                                                     for data augmentation. Our decision to use grayscale images
                                                                     reflects the intuition that color is less important for this task
                                                                     than edge and texture features and that the network might
                                                                     struggle to learn color invariance. In addition, the likelihood
                                                                     that the tubes would be coated with a thin layer of dust on
                                                                     Mars would mean that the tubes may acquire a more yellow
                                                                     hue than their original grey coloring that the network would
                                                                     be trained on. As for the box filtering, given the limited
                                                                     quantity of training data available, it may be helpful to prime
                                                                     the input to de-emphasize intensity over edge features. The
                                                                     test data consisted of 1024 ⇥ 1024 images, also converted
                                                                     to grayscale and box filtred, in which a whole single tube is
                                                                     present within the image boundaries. When the no-tags data
                                                                     was used for training, the with-tags data was used for testing,
                                                                     and vice versa.
                                                                     Quantitative AP and AR results are presented in Table 2,
                                                                     PR curves are presented in Figure 7, and qualitative results
                                                                     samples are presented in Figures 8 and 9. As was ex-
                                                                     pected, the data-driven learning approach of Mask R-CNN
                                                                     provides a substantial average increase in performance over
                                                                     the template-matching method both in terms of precision and
                                                                     recall. The PR curves also demonstrate that if we can tolerate
                                                                     detection overlap with ground-truth in the 0.5        0.6 IoU
                                                                     threshold range, we can expect reasonably optimal precision-
                                                                     recall. The results samples in Figures 8 and 9 show that Mask
                                                                     R-CNN can cope well even in difficult situations where object
                                                                     shadows overlap the tubes. Conversely, it can also produce
                                                                     false positives in cases where there is not enough overlap
                                                                     between the detection and the ground-truth or sometimes fail
                                                                     completely in cases where features from non-tube objects
                                                                     seem tube-like.
Figure 7. Precision-recall curves for the (a) no-tags and (b)
 with-tags datasets using the Mask R-CNN object detector.            Performance Analysis of 6D Pose Estimation
                                                                     Using the with-tags dataset with ground-truth 6D pose infor-
                                                                     mation, we can evaluate the pose estimation accuracy of the
    Train          Test        AP [.5]      AR [.5:.05:.95]          Line2D detector. Figure 10 shows histograms of the orienta-
                                                                     tion and translation error magnitudes. Since the detector does
  with-tags       no-tags       0.911            0.555               not know which is the tag-mounted tube, we only consider
   no-tags       with-tags      0.918            0.575               detections with IOU > 0.5 for evaluation of the 6D pose
                                                                     accuracy. If there is indeed a detection in the neighborhood,
Table 2. Quantitative results using the Mask R-CNN object            there should only be one since additional ones will have been
 detector. AP and AR IoU thresholds are shown in square              removed by non-max suppression. Moreover, we consider
                         brackets.                                   the orientation error in a couple of ways. First, we focus
                                                                     on in-plane rotation and report error along the main axis of
                                                                     the tube since this is the most relevant for the downstream
                                                                     task of tube pickup. Also, from the histograms, we see that
                                                                     there are a few outliers with large orientation errors. These
degrades. The most notable failure mode that degrades                are likely detections where the matched template is “flipped”
the performance of template matching was observed in the             180 due to the most prominent object features being the two
presence of other entities in the scene that have similar            parallel edges that define the body of the tube. Ignoring these
contour features compared to the sample-tubes. Two specific          instances allows us to observe the nominal orientation errors.
examples of this that can be observed in Figure 6, where             Furthermore, in practice an orientation flip should not affect
object shadows and bedrocks - both have long edges with              ability for tube pickup.
similar feature response to that of the long edges of the
sample-tube. Another failure mode is related to occlusions.
Template matching based algorithms perform poorly in the
presence of significant occlusions - either from dust coverage             8. C ONCLUSION AND F UTURE W ORK
or object occlusions.                                                Autonomous localization and retrieval of sample-tubes for
                                                                     the Mars Sample Return mission is a challenging task, but
Performance Analysis of Data-driven Segmentation                     one that is necessarily to accommodate the mission time-
Two Mask R-CNN models were trained. One was trained                  line for the Sample Fetch Rover. In this work, we stud-
on the with-tags dataset and evaluated on the no-tags dataset,       ied two machine-vision based approaches to autonomously

                                                                 7
Figure 8. Example true positive results for sample-tube detection using the Mask R-CNN detector. The top row shows results
from the no-tags test set; the bottom row shows results from the with-tags test set.
Figure 9. Example false positive cases for the Mask R-CNN detector. The first three images are from the no-tags test set; the
last two images are from the with-tags test set.
Figure 10. 6D pose estimation results using Line2D
detect and localize sample-tubes. Our top-level goal was presents a major challenge for Verification and Validation
to understand the trade-off between the different classes of (V&V) and difficulty in flight infusion. On the other hand,
algorithms: model-based and data-driven. Towards this end, classical methods such as Template matching do not match
we also collected a large benchmark dataset of sample-tube the performance of their learning based counterparts, but are
images, in a representative outdoor environment and anno- easier to design, implement and V&V. In future work, we
tated it with ground truth segmentation masks and locations plan to validate the performance of autonomous tube-pickup
for performance analysis. In summary, both methods have through end-to-end demonstration on an analog Fetch rover.
complimentary advantages. While, learning-based methods
are considerably superior in terms of performance, they are
fundamentally black-box from a design perspective. This
8ACKNOWLEDGMENTS IEEE Aerospace Conference. Proceedings (Cat. No.
00TH8484), vol. 7. IEEE, 2000, pp. 247–257.
The research described in this paper was carried out at the
Jet Propulsion Laboratory, California Institute of Technology, [14] R. Weisbin, G. Rodriguez, S. Schenker, H. Das, S. Hay-
under a contract with the National Aeronautics and Space Ad- ati, T. Baumgartner, M. Maimone, I. Nesnas, and
ministration. Note: The information provided about possible A. Volpe, “Autonomous rover technology for mars
Mars sample return architectures and concepts is for planning sample return,” in Artificial Intelligence, Robotics and
and discussion purposes only. NASA and ESA have made no Automation in Space, vol. 440, 1999, p. 1.
official decisions to implement Mars Sample Return. [15] G. R. Osinski, M. Battler, C. M. Caudill, R. Francis,
T. Haltigin, V. J. Hipkin, M. Kerrigan, E. A. Pilles,
A. Pontefract, L. L. Tornabene et al., “The canmars
R EFERENCES mars sample return analogue mission,” Planetary and
Space Science, vol. 166, pp. 110–130, 2019.
[1] S. W. Squyres, R. E. Arvidson, D. L. Blaney, B. C.
Clark, L. Crumpler, W. H. Farrand, S. Gorevan, K. E. [16] P. Younse, C. Y. Chiu, J. Cameron, M. Dolci, E. Elliot,
Herkenhoff, J. Hurowitz, A. Kusack et al., “Rocks of A. Ishigo, D. Kogan, E. Marteau, J. Mayo, J. Munger
the columbia hills,” Journal of Geophysical Research: et al., “Concept for an on-orbit capture and orient
Planets, vol. 111, no. E2, 2006. module for potential mars sample return,” in 2020 IEEE
Aerospace Conference. IEEE, 2020, pp. 1–22.
[2] J. P. Grotzinger, “Analysis of surface materials by the
curiosity mars rover: Introduction,” Science, vol. 341, [17] S. Perino, D. Cooper, D. Rosing, L. Giersch, Z. Ous-
no. 6153, pp. 1475–1475, 2013. namer, V. Jamnejad, C. Spurgers, M. Redmond, M. Lob-
bia, T. Komarek et al., “The evolution of an orbiting
[3] S. S. Board, N. R. Council et al., Vision and voyages for sample container for potential mars sample return,” in
planetary science in the decade 2013-2022. National 2017 IEEE Aerospace Conference. IEEE, 2017, pp.
Academies Press, 2012. 1–16.
[4] B. K. Muirhead, A. K. Nicholas, J. Umland, O. Suther- [18] K. Edelberg, J. Reid, R. McCormick, L. DuCharme,
land, and S. Vijendran, “Mars sample return mission E. Kulczycki, and P. Backes, “Autonomous localization
concept status,” Acta Astronautica, 2020. and acquisition of a sample tube for mars sample re-
[5] B. Muirhead, C. Edwards, A. Eremenko, A. Nicholas, turn,” in AIAA SPACE 2015 Conference and Exposition,
A. Farrington, A. Jackman, S. Vijendran, L. Duvet, 2015, p. 4483.
F. Beyer, and S. Aziz, “Sample retrieval lander concept [19] J. Papon, R. Detry, P. Vieira, S. Brooks, T. Srinivasan,
for a potential mars sample return campaign,” LPICo, A. Peterson, and E. Kulczycki, “Martian fetch: Finding
vol. 2089, p. 6369, 2019. and retrieving sample-tubes on the surface of mars,” in
[6] M. N. D. S. A. Group, “Science priorities for mars IEEE Aerospace Conference, 2017.
sample return,” 2008. [20] B. Lee, R. Detry, J. Moreno, D. D. Lee, and E. Kul-
[7] S. McLennan, M. Sephton, D. Beaty, M. Hecht, czycki, “Monocular visual pose estimation via online
B. Pepin, I. Leya, J. Jones, B. Weiss, M. Race, J. Rum- sampling for mars sample-tube pickup,” in 2018 IEEE
mel et al., “Planning for mars returned sample science: Aerospace Conference. IEEE, 2018, pp. 1–8.
final report of the msr end-to-end international science [21] T.-H. Pham, W. Seto, S. Daftry, A. Brinkman, J. Mayo,
analysis group (e2e-isag),” Astrobiology, vol. 12, no. 3, Y. Cheng, C. Padgett, E. Kulczycki, and R. Detry,
pp. 175–230, 2012. “Rover localization for tube pickup: Dataset, methods
[8] D. Beaty, M. Grady, H. McSween, E. Sefton-Nash, and validation for mars sample return planning,” in 2020
B. Carrier, F. Altieri, Y. Amelin, E. Ammannito, IEEE Aerospace Conference. IEEE, 2020, pp. 1–11.
M. Anand, L. Benning et al., “The potential science [22] Z. Zou, Z. Shi, Y. Guo, and J. Ye, “Object detection in
and engineering value of samples delivered to earth by 20 years: A survey,” arXiv preprint arXiv:1905.05055,
mars sample return,” Meteoritics and Planetary Sci- 2019.
ence, vol. 54, no. 3, 2019.
[23] D. G. Lowe, “Object recognition from local scale-
[9] B. Sherwood, D. B. Smith, R. Greeley, W. Whit- invariant features,” in Proceedings of the seventh IEEE
taker, G. R. Woodcock, G. Barton, D. W. Pearson, international conference on computer vision, vol. 2.
and W. Siegfried, “Mars sample return: Architecture Ieee, 1999, pp. 1150–1157.
and mission design,” in Proceedings, IEEE Aerospace
Conference, vol. 2. IEEE, 2002, pp. 2–536. [24] F. Rothganger, S. Lazebnik, C. Schmid, and J. Ponce,
“3d object modeling and recognition using local affine-
[10] R. Mattingly, S. Matousek, and F. Jordan, “Continu- invariant image descriptors and multi-view spatial con-
ing evolution of mars sample return,” in 2004 IEEE straints,” International journal of computer vision,
Aerospace Conference Proceedings (IEEE Cat. No. vol. 66, no. 3, pp. 231–259, 2006.
04TH8720), vol. 1. IEEE, 2004.
[25] A. Krizhevsky, I. Sutskever, and G. E. Hinton, “Ima-
[11] R. Mattingly and L. May, “Mars sample return as a genet classification with deep convolutional neural net-
campaign,” in IEEE Aerospace Conference, 2011. works,” in Advances in Neural Information Processing
[12] B. K. Muirhead, A. K. Nicholas, J. Umland, O. Suther- Systems, 2012, pp. 1097–1105.
land, and S. Vijendran, “Mars sample return campaign [26] R. Girshick, “Fast R-CNN,” in Proceedings of the IEEE
concept status,” Acta Astronautica, vol. 176, pp. 131– International Conference on Computer Vision, 2015,
138, 2020. pp. 1440–1448.
[13] R. Volpe, E. Baumgartner, P. Scheaker, and S. Hay- [27] S. Ren, K. He, R. Girshick, and J. Sun, “Faster R-CNN:
ati, “Technology development and testing for en- Towards Real-Time Object Detection with Region Pro-
hanced mars rover sample return operations,” in 2000 posal Networks,” in Advances in Neural Information
9Processing Systems 28, C. Cortes, N. D. Lawrence, European Conference on Computer Vision, 2010, pp.
D. D. Lee, M. Sugiyama, and R. Garnett, Eds. Curran 356–369.
Associates, Inc., 2015, pp. 91–99. [42] C.-Y. Tsai, C.-C. Yu et al., “Real-time textureless ob-
[28] J. Long, E. Shelhamer, and T. Darrell, “Fully convolu- ject detection and recognition based on an edge-based
tional networks for semantic segmentation,” in Proceed- hierarchical template matching algorithm,” Journal of
ings of the IEEE Conference on Computer Vision and Applied Science and Engineering, vol. 21, no. 2, pp.
Pattern Recognition, 2015, pp. 3431–3440. 229–240, 2018.
[29] K. He, G. Gkioxari, P. Dollar, and R. Girshick, “Mask [43] T.-T. Do, M. Cai, T. Pham, and I. Reid, “Deep-6dpose:
R-CNN,” in Proceedings of the IEEE International Recovering 6d object pose from a single rgb image,”
Conference on Computer Vision, 2017, pp. 2961–2969. arXiv preprint arXiv:1802.10367, 2018.
[30] M. Ono, B. Rothrock, K. Otsu, S. Higa, Y. Iwashita, [44] W. Kehl, F. Manhardt, F. Tombari, S. Ilic, and N. Navab,
A. Didier, T. Islam, C. Laporte, V. Sun, K. Stack “Ssd-6d: Making rgb-based 3d detection and 6d pose
et al., “Maars: Machine learning-based analytics for estimation great again,” in Proceedings of the IEEE
automated rover systems,” in 2020 IEEE Aerospace International Conference on Computer Vision, 2017,
Conference. IEEE, 2020, pp. 1–17. pp. 1521–1529.
[31] N. Abcouwer, S. Daftry, S. Venkatraman, T. del Sesto, [45] Y. Xiang, T. Schmidt, V. Narayanan, and D. Fox,
O. Toupet, R. Lanka, J. Song, Y. Yue, and M. Ono, “Posecnn: A convolutional neural network for 6d object
“Machine learning based path planning for improved pose estimation in cluttered scenes,” arXiv preprint
rover navigation (pre-print version),” in 2021 IEEE arXiv:1711.00199, 2017.
Aerospace Conference. IEEE, 2021. [46] T.-H. Pham, W. Seto, S. Daftry, B. Ridge, J. Hansen,
[32] M. S. Costa and L. G. Shapiro, “3d object recognition T. Thrush, J. Mayo, Y. Cheng, C. Padgett, E. Kulczy-
and pose with relational indexing,” Computer Vision cki, and R. Detry, “Rover Navigation for Mars Sample
and Image Understanding, vol. 79, no. 3, pp. 364–407, Return Planning: Relocalization in Changing Environ-
2000. ments by Virtual Template Synthesis and Matching,” in
[33] P. David and D. DeMenthon, “Object recognition in 2021 IEEE International Conference on Robotics and
high clutter images using line features,” in Tenth Automation (ICRA), Xi’an, China, May 2021 (Under
IEEE International Conference on Computer Vision Review).
(ICCV’05) Volume 1, vol. 2. IEEE, 2005, pp. 1581– [47] R. Francis, T. Estlin, G. Doran, S. Johnstone, D. Gaines,
1588. V. Verma, M. Burl, J. Frydenvang, S. Montaño,
[34] I. Weiss and M. Ray, “Model-based recognition of 3d R. Wiens et al., “Aegis autonomous targeting for chem-
objects from single images,” IEEE Transactions on Pat- cam on mars science laboratory: Deployment and re-
tern Analysis and Machine Intelligence, vol. 23, no. 2, sults of initial science team use,” Science Robotics,
pp. 116–128, 2001. vol. 2, no. 7, 2017.
[35] C. M. Cyr and B. B. Kimia, “A similarity-based aspect- [48] W. Kim, R. Steele, A. Ansar, K. Ali, and I. Nesnas,
graph approach to 3d object recognition,” International “Rover-based visual target tracking validation and mis-
Journal of Computer Vision, vol. 57, no. 1, pp. 5–22, sion infusion,” in Space 2005, 2005.
2004. [49] D. G. Lowe, “Distinctive image features from scale-
[36] D. W. Eggert, K. W. Bowyer, C. R. Dyer, H. I. Chris- invariant keypoints,” International journal of computer
tensen, and D. B. Goldgof, “The scale space aspect vision, vol. 60, no. 2, pp. 91–110, 2004.
graph,” IEEE Transactions on Pattern Analysis and [50] C. Steger, “Occlusion, clutter, and illumination invari-
Machine Intelligence, vol. 15, no. 11, pp. 1114–1130, ant object recognition,” International Archives of Pho-
1993. togrammetry Remote Sensing and Spatial Information
[37] M. Ulrich, C. Wiedemann, and C. Steger, “Combining Sciences, vol. 34, no. 3/A, pp. 345–350, 2002.
scale-space and similarity-based aspect graphs for fast [51] R. Rios-Cabrera and T. Tuytelaars, “Discriminatively
3d object recognition,” IEEE transactions on pattern trained templates for 3d object detection: A real time
analysis and machine intelligence, vol. 34, no. 10, pp. scalable approach,” in Proceedings of the IEEE interna-
1902–1914, 2011. tional conference on computer vision, 2013, pp. 2048–
[38] S. Hinterstoisser, C. Cagniart, S. Ilic, P. Sturm, 2055.
N. Navab, P. Fua, and V. Lepetit, “Gradient response [52] K. He, X. Zhang, S. Ren, and J. Sun, “Deep Residual
maps for real-time detection of textureless objects,” Learning for Image Recognition,” in Proceedings of
IEEE transactions on pattern analysis and machine the IEEE Conference on Computer Vision and Pattern
intelligence, vol. 34, no. 5, pp. 876–888, 2011. Recognition, 2016, pp. 770–778.
[39] S. Hinterstoisser, V. Lepetit, S. Ilic, S. Holzer, G. Brad- [53] S. Xie, R. Girshick, P. Dollar, Z. Tu, and K. He,
ski, K. Konolige, and N. Navab, “Model based training, “Aggregated Residual Transformations for Deep Neural
detection and pose estimation of texture-less 3d objects Networks,” in Proceedings of the IEEE Conference on
in heavily cluttered scenes,” in Asian conference on Computer Vision and Pattern Recognition, 2017, pp.
computer vision. Springer, 2012, pp. 548–562. 1492–1500.
[40] H. Cai, T. Werner, and J. Matas, “Fast detection of [54] T.-Y. Lin, P. Dollar, R. Girshick, K. He, B. Hariharan,
multiple textureless 3-d objects,” in International Con- and S. Belongie, “Feature Pyramid Networks for Object
ference on Computer Vision Systems. Springer, 2013, Detection,” in Proceedings of the IEEE Conference on
pp. 103–112. Computer Vision and Pattern Recognition, 2017, pp.
[41] F. Tombari, S. Salti, and L. Di Stefano, “Unique sig- 2117–2125.
natures of histograms for local surface description,” in [55] R. Girshick, J. Donahue, T. Darrell, and J. Malik, “Rich
10Feature Hierarchies for Accurate Object Detection and a focus on robotic learning of object affordances, he defended
Semantic Segmentation,” in 2014 IEEE Conference on his Ph.D. in 2014. His research interests include cognitive
Computer Vision and Pattern Recognition (CVPR), Jun. robotics, computer vision, and machine learning, and at JPL
2014, pp. 580–587. he is currently working on robot vision and simulation capa-
[56] O. Russakovsky, J. Deng, H. Su, J. Krause, S. Satheesh, bilities for the Mars Sample Return and InVADER missions.
S. Ma, Z. Huang, A. Karpathy, A. Khosla, M. Bernstein,
A. C. Berg, and L. Fei-Fei, “ImageNet Large Scale
Visual Recognition Challenge,” International Journal
of Computer Vision, vol. 115, no. 3, pp. 211–252, Dec. William Seto is a Robotics Technologist
2015. at NASA’s Jet Propulsion Laboratory.
He joined JPL in 2017 after receiving his
[57] J. Maki, C. McKinney, R. Sellar, D. Copley-Woods, M.S. in Robotic Systems Development
D. Gruel, D. Nuding, M. Valvo, T. Goodsall, from Carnegie Mellon’s Robotics Insti-
J. McGuire, and T. Litwin, “Enhanced engineering cam- tute. He develops software to enable au-
eras (eecams) for the mars 2020 rover,” LPICo, vol. tonomous capabilities in maritime and
1980, p. 4132, 2016. terrestrial environments. His outside in-
[58] J. Brooks, “COCO Annotator,” terests include soccer and chicken ten-
https://github.com/jsbroks/coco-annotator/, 2019. ders.
[59] E. Olson, “Apriltag: A robust and flexible visual fidu-
cial system,” 2011 IEEE International Conference on
Robotics and Automation, 2011.
Tu-Hoa Pham is a Robotics Technol-
[60] M. Everingham, L. V. Gool, C. K. I. Williams, J. Winn, ogist at the NASA Jet Propulsion Lab-
and A. Zisserman, “The Pascal Visual Object Classes oratory, Caltech Institute of Technol-
(VOC) Challenge,” International Journal of Computer ogy, currently working on machine vi-
Vision, vol. 88, no. 2, pp. 303–338, Jun. 2010. sion for Mars Sample Return. He holds
[61] T.-Y. Lin, M. Maire, S. Belongie, J. Hays, P. Perona, a Diplôme d’Ingénieur in Aerospace En-
D. Ramanan, P. Dollár, and C. L. Zitnick, “Microsoft gineering from ISAE-SUPAERO (2013),
COCO: Common Objects in Context,” in Computer an M.Sc. in Applied Mathematics from
Vision – ECCV 2014, ser. Lecture Notes in Computer Université Paul Sabatier (2013) and a
Science, D. Fleet, T. Pajdla, B. Schiele, and T. Tuyte- Ph.D. in Robotics from Université de
laars, Eds. Springer International Publishing, 2014, Montpellier (2016), which he conducted at the CNRS-AIST
pp. 740–755. Joint Robotics Laboratory on the topic of force sensing from
vision. Prior to joining JPL in 2018, he spent two years
as a research scientist at IBM Research Tokyo, where he
worked on deep reinforcement learning for robot vision and
B IOGRAPHY [ manipulation in the real-world.
Shreyansh Daftry is a Robotics Tech-
nologist at NASA Jet Propulsion Labora-
tory, California Institute of Technology. Peter Ilhardt received his B.A. in Earth
He received his M.S. degree in Robotics and Planetary Sciences from Northwest-
from the Robotics Institute, Carnegie ern University in 2013 and M.S. in Geo-
Mellon University in 2016, and his B.S. sciences from Penn State University in
degree in Electronics and Communica- 2016. He is currently a data science
tion Engineering in 2013. His research consultant at Capgemini and M.C.S. stu-
interest lies is at intersection of space dent at the University of Illinois. His
technology and autonomous robotic sys- previous work focused on spectroscopic
tems, with an emphasis on machine learning applications analysis and chemical imaging of com-
to perception, planning and decision making. At JPL, he plex biogeochemical systems at Pacific
has worked on mission formulation for Mars Sample Return, Northwest National Laboratory and Penn State University.
and technology development for autonomous navigation of Before starting his current role, Peter interned with the
ground, airborne and subterranean robots. Perception Systems Group at NASA JPL working on machine
vision for Mars Sample Return.
Barry Ridge is a postdoctoral scholar
at the NASA Jet Propulsion Laboratory
(JPL), California Institute of Technol-
ogy. He has previously held postdoctoral
positions at the Advanced Telecommuni-
cations Research Institute International,
Kyoto, Japan, and the Jožef Stefan In-
stitute, Ljubljana, Slovenia. He received
a B.Sc. in Computer Applications from
Dublin City University, Ireland, in 2002
and went on to study pure mathematics at the University of St
Andrews, Scotland, where he received an M.Phil. in 2006.
After being awarded a Marie Curie Fellowship to pursue
doctoral studies at the University of Ljubljana, Slovenia, with
11Gerard Maggiolino received a B.S. in Renaud Detry is the group leader for
Math-Computer Science from the Uni- the Perception Systems group at NASA’s
versity of California, San Diego in 2020 Jet Propulsion Laboratory (JPL). De-
and will be attending Carnegie Mel- try earned his Master’s and Ph.D. de-
lon University for a Masters in Com- grees in computer engineering and robot
puter Vision in 2021. He has previ- learning from ULiege in 2006 and 2010.
ously interned at NASA JPL (Pasadena), He served as a postdoc at KTH and
Accel Robotics (San Diego), and Ele- ULiege between 2011 and 2015. He
mentary Robotics (Los Angeles) working joined the Robotics and Mobility Section
on primarily Computer Vision, Machine at JPL in 2016. His research interests
Learning, and Software Development projects. are perception and learning for manipulation, robot grasp-
ing, and mobility, for terrestrial and planetary applications.
At JPL, Detry leads the machine-vision team of the Mars
Mark Van der Merwe is a Robotics PhD Sample Return surface mission, and he conducts research
student at the University of Michigan, in autonomous robot manipulation and mobility for Mars,
Ann Arbor. He received his B.Sc. degree Europa, Enceladus, and terrestrial applications.
in Computer Science from the University
of Utah in 2020. He interned at NASA
JPL during the Summer of 2020, where
he worked with the Perception Systems
team on tube and rover localization for
Mars Sample Return. His current re-
search interests lie at the intersections of
perception and action for robot manipulation.
Alexander Brinkman received his M.S
in Robotic Systems Development from
Carnegie Mellon’s Robotic Institute,
then joined the Robotic Manipulation
and Sampling group at Jet Propulsion
Laboratory in 2017. He develops ma-
nipulation software and autonomous ca-
pabilities to enable future sampling mis-
sions to Europa, Enceladus, Mars, and
comets.
John Mayo is a robotics mechanical
engineer in the Robotic Climbers and
Grippers Group at JPL. John received a
Bachelor of Science in Mechanical En-
gineering from Texas A&M in 2014 and
Master of Science of the same from the
Massachusetts Institute of Technology in
2016. As part of his graduate stud-
ies, John worked on hardware for the
HERMES humanoid robot, developing a
hybrid hand-foot device under direction of Sangbae Kim.
Additionally, John co-founded and led the MIT Hyperloop
Team to design and build a magnetically levitated vehicle and
participated as a mentor in the new student-led shop, MIT
Makerworks.
Eric Kulczycki received a dual B.S
degree in Mechanical Engineering and
Aeronautical Science and Engineering
from the University of California, Davis,
in 2004. He received his M.S. degree in
Mechanical and Aeronautical Engineer-
ing also from the University of Califor-
nia, Davis in 2006. He is a member of
the engineering staff at the Jet Propul-
sion Laboratory, California Institute of
Technology, where he is currently involved in Mars sample
transfer chain technology development, sampling technology
development for extreme environments, Mars 2020 Sample
Caching Subsystem, and mechanical design of various mo-
bility platforms. He has worked at JPL for over 15 years.
12You can also read