The interrelation of sleep and mental and physical health is anchored in grey-matter neuroanatomy and under genetic control - Nature
←
→
Page content transcription
If your browser does not render page correctly, please read the page content below
ARTICLE
                  https://doi.org/10.1038/s42003-020-0892-6                 OPEN

                  The interrelation of sleep and mental and physical
                  health is anchored in grey-matter neuroanatomy
                  and under genetic control
1234567890():,;

                  Masoud Tahmasian 1, Fateme Samea1, Habibolah Khazaie2, Mojtaba Zarei1,
                  Shahrzad Kharabian Masouleh 3,4, Felix Hoffstaedter3,4, Julia Camilleri3,4, Peter Kochunov5,
                  B. T. Thomas Yeo6,7,8,9, Simon Bodo Eickhoff3,4 & Sofie Louise Valk3,4 ✉

                  Humans need about seven to nine hours of sleep per night. Sleep habits are heritable,
                  associated with brain function and structure, and intrinsically related to well-being, mental,
                  and physical health. However, the biological basis of the interplay of sleep and health is
                  incompletely understood. Here we show, by combining neuroimaging and behavioral genetic
                  approaches in two independent large-scale datasets (HCP (n = 1106), age range: 22–37, eNKI
                  (n = 783), age range: 12–85), that sleep, mental, and physical health have a shared neuro-
                  biological basis in grey matter anatomy; and that these relationships are driven by shared
                  genetic factors. Though local associations between sleep and cortical thickness were
                  inconsistent across samples, we identified two robust latent components, highlighting the
                  multivariate interdigitation of sleep, intelligence, BMI, depression, and macroscale cortical
                  structure. Our observations provide a system-level perspective on the interrelation of sleep,
                  mental, and physical conditions, anchored in grey-matter neuroanatomy.

                  1 Institute of Medical Science and Technology, Shahid Beheshti University, Tehran, Iran. 2 Sleep Disorders Research Center, Kermanshah University of Medical

                  Sciences, Kermanshah, Iran. 3 Institute of Neuroscience and Medicine (INM-7: Brain and Behaviour), Research Centre Jülich, 52425 Jülich, Germany.
                  4 Institute of Systems Neuroscience, Heinrich Heine University Düsseldorf, 40225 Düsseldorf, Germany. 5 Maryland Psychiatric Research Center, University

                  of Maryland School of Medicine, Baltimore, MD 21201, USA. 6 Department of Electrical and Computer Engineering, Clinical Imaging Research Centre, N.1
                  Institute for Health and Memory Networks Program, National University of Singapore, Singapore 119077, Singapore. 7 Athinoula A. Martinos Center for
                  Biomedical Imaging, Massachusetts General Hospital, Charlestown, MA 02114, USA. 8 Centre for Sleep and Cognition, National University of Singapore,
                  Singapore 119077, Singapore. 9 NUS Graduate School for Integrative Sciences and Engineering, National University of Singapore, Singapore 119077,
                  Singapore. ✉email: svalk@fz-juelich.de

                  COMMUNICATIONS BIOLOGY | (2020)3:171 | https://doi.org/10.1038/s42003-020-0892-6 | www.nature.com/commsbio                                                1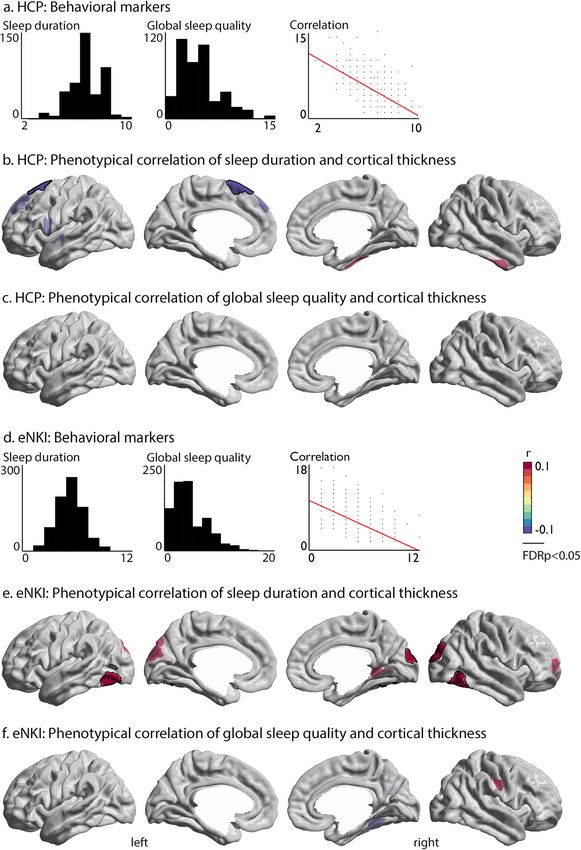
ARTICLE                                                             COMMUNICATIONS BIOLOGY | https://doi.org/10.1038/s42003-020-0892-6

S
        leep plays an active role in providing adaptive physiological     complete HCP sample (n = 1105), which included twins and sib-
        functions1, consolidating and retaining new memories2,            lings. Sleep variation was assessed using the Pittsburg Sleep Quality
        metabolite clearance3, hormones’ secretion4, and synaptic         Index (PSQI)11, a widely used questionnaire summarizing self-
hemostasis5. The National Sleep Foundation suggests 7–9 h                 reported indices of sleep. Our main measures of interest were sleep
of sleep per night for adults (18–64) and 7–8 h for older adults          quantity (self-reported sleep duration) and global sleep quality
(65+). For school aged children (6–13 years) this is 9–11 h, and          (total PSQI) score, as previous work has associated these factors
for teenagers 8–10 h6. However, people in modern societies are            with brain structure44,45 and genetic variation46. Based on previous
suffering from inadequate sleep and its consequences6. Sleep loss         literature7,8,25–28 and data-driven phenotypic correlations in the
is associated with impairment in cognitive performance, motor             HCP sample, we selected BMI, intelligence and depression scores
vehicle accidents and poor quality of life7,8; and contributes to         to evaluate the potential existence of a shared neuroanatomical
heightened socioeconomic burden9,10. Beyond the quantity of               basis of sleep and mental and physical aptitudes. In the HCP
sleep (sleep duration), quality of sleep includes sleep onset latency     sample, intelligence was summarized as Total Cognitive Score,
(i.e., time between going to bed and falling asleep), sleep efficiency     based on the NIH Toolbox Cognition47, whereas in the eNKI
(i.e., the percentage of time in bed during which someone is              sample, intelligence was measured using the Wechsler Abbreviated
asleep), sleep disturbances, use of sleeping medication, and day-         Scale of Intelligence (WASI-II)48. Depression was measured using
time dysfunction, all interacting with individual health and well-        the ASR depression DSM-oriented scale for Ages 18–5949 in the
being11,12. Of note, it has been revealed that poor sleep quality is      HCP sample. In the eNKI sample the Beck Depression Inventory
associated with higher rate of depressive symptoms in healthy             (BDI–II) was used. BMI was calculated at weight/squared (height)
subjects13,14; and sleep disturbances are common in mood                  in both datasets. Based on previous knowledge, we expected to
(e.g., major depression) and cognitive disorders15,16.                    observe phenotypic relationships between sleep duration/quality
   Individual differences in sleep behaviors are heritable17–19; and      and markers of mental and physical health. Moreover, we expected
various genetic, metabolic, behavioral, and psychological risk fac-       to observe a phenotypic relation between sleep and local gray
tors have been suggested for the development and maintenance of           matter structure.
poor sleep quality and sleep disorders20–22. For example, genome              Our analyses revealed a phenotypic relationship between sleep
wide association studies have associated insomnia disorder to             and depression, BMI, and intelligence in both the HCP and the
structure of the striatum, hypothalamus, and claustrum, where             eNKI sample. Subsequently, we demonstrated our sleep markers,
gene expression profiles show association with the genetic risk            depression, BMI, and intelligence were heritable and we observed
profile of such individuals23,24. Moreover, sleep can have a bidir-        a genetic correlation between sleep quantity and quality, BMI, and
ectional relation with health. Not only is sleep disturbance linked       intelligence in the twin-based HCP sample, indicating that sleep
with hypertension, diabetes, and obesity25,26, but also depressive        hygiene displays pleiotropy with these factors in the mentioned
symptoms, physical illness, and fatigue were reported as associated       sample. Analysis of heritability and genetic correlation were per-
factors for both poor sleep quality and short sleep duration27,28.        formed with maximum likelihood variance-decomposition meth-
A meta-analysis reported that insomnia disorder is associated with        ods using Sequential Oligogenic Linkage Analysis Routines (www.
alterations in widespread brain structure and function29. In addi-        solar-eclipse-genetics.org; Solar Eclipse 8.4.0.). Heritability (h2) is
tion, other neuroimaging meta-analyses have implicated structural         the total additive genetic variance and genetic (ρg) correlations
and functional abnormalities in the hippocampus, amygdala, and            were estimated using bivariate polygenic analysis. Using an atlas-
insula in patients with sleep apnea30 and have indicated convergent       based approach to summarize cortical thickness50, we observed
functional brain alterations in the inferior parietal cortex and          local associations between sleep duration and cortical structure in
superior parietal lobule, following acute sleep deprivation31.            both samples which were, in part, driven by additive genetic
Moreover, white matter integrity underlying prefrontal areas has          factors. Post-hoc analysis indicated that variance in intelligence
been associated with sleep duration and sleep quality32–34. Lastly,       and BMI also related to thickness in areas associated with sleep
lower prefrontal gray matter volume has been associated with              duration. Subsequently, based on our observation that sleep relates
greater sleep fragmentation in older individuals35.                       to BMI, intelligence, and depression, as well as to cortical thick-
   Importantly, it has been demonstrated that macroscale gray             ness, we performed partial least squares (PLS) analysis, in order to
matter neuroanatomy is heritable36–38, indicating part of the var-        identify latent relationships between these factors. PLS is a mul-
iance in brain structure can be related to additive genetic effects.      tivariate data-driven approach, enabling simultaneous linking of
Indeed, genetic factors influence cortical thickness in a systematic       behavioral measures to brain structure. We identified two robust
fashion where both functional and geometric constraints influence          latent factors, spanning distinct neurocognitive dimensions. Using
genetic correlation between and within brain systems39,40. Recent         the twin-structure of HCP, we observed these factors were heri-
studies have indicated that phenotypic correlation between cortical       table and their relation driven by shared genetic effects. Taken
thickness and intelligence, as well as BMI, is driven by additive         together, the current study highlights the interrelation of sleep,
genetic factors41–43 suggesting a shared genetic basis of cortical        mental and physical health, which is reflected by shared neuro-
thickness and non-brain traits. This raises the question whether the      biological signatures.
interrelation of sleep, mental, and physical health can be linked to
the shared neurobiological mechanisms; and whether these rela-
tionships are driven by shared genetic factors.                           Results
   To answer this question, we combined structural neuroimaging           Data samples. We studied two independent samples from
data from two independent samples: the Human Connectome                   openly-shared neuroimaging repositories: HCP and eNKI. HCP
Project (HCP unrelated sample n = 424) and the enhanced NKI               (http://www.humanconnectome.org/) comprised data from 1105
Rockland sample (eNKI: n = 783) to explore whether the inter-             individuals (599 females), 285 MZ twins, 170 DZ twins, and
relation of sleep, mental, and physical health can be linked to           650 singletons, with mean age 28.8 years (SD = 3.7, range =
a shared macroscale neurobiological signature. The HCP sample             22–37). For phenotypic analysis, we selected unrelated indivi-
consists of young adults only, whereas the eNKI sample consists           duals, resulting in a sample of 424 (228 females) individuals with
of adolescents, younger and older adults, enabling us to evaluate         a mean age of 28.6 years (SD = 3.7, range = 22–36). Our second
the generalizability of the interrelation of sleep, health and local      sample was based on the eNKI sample, made available by the
brain structure. We conducted genetic correlation analysis in the         Nathan-Kline Institute (NKY, NY, USA)51. This sample consisted

2                                           COMMUNICATIONS BIOLOGY | (2020)3:171 | https://doi.org/10.1038/s42003-020-0892-6 | www.nature.com/commsbio
COMMUNICATIONS BIOLOGY | https://doi.org/10.1038/s42003-020-0892-6 ARTICLE
Table 1 Phenotypic and genetic correlations between sleep and depression, BMI, and IQ.
Sleep duration (h2 = 0.24 ± 0.06)
Sample Depression (h2 = 0.24 ± 0.06) BMI (h2 = 0.68 ± 0.04) IQ (h2 = 0.66 ± 0.04)
HCP (unrelated sample) (n = 419) −0.09 [−0.19 0.00], p = 0.06 (n = 424) −0.11 [−0.21 −0.02], p < 0.025* (n = 418) 0.11 [0.01 0.19], p < 0.05*
eNKI (n = 782) −0.16 [−0.24 −0.09], p < 0.001** (n = 757) −0.17 [−0.24 −0.09], p < 0.001** (n = 783) 0.11 [0.04 0.18], p < 0.005*
HCP (total sample) (n = 1105) −0.07 [−0.13 −0.02], p < 0.025* (n = 1112) −0.14 [−0.19 −0.08], (n = 1096) 0.09 [0.03 0.15], p < 0.005*
p < 0.0001**
Genetic correlation (HCP) 0.17(0.20), p > 0.1 −0.33 (0.11), p < 0.005* 0.42 (0.11), p < 0.0001**
Environmental correlation (HCP) −0.16(0.06), p < 0.01* 0.01 (0.07), p > 0.1 0.19 (0.06), p < 0.003**
Global sleep quality (h2 = 0.12 ± 0.06)
Sample Depression BMI IQ
HCP (unrelated sample) (n = 419) 0.37 [0.29 0.45], (n = 424) 0.14 [0.04 0.23], (n = 418) −0.07 [−0.16 0.03], p > 0.1
p < 0.0001** p < 0.005*
eNKI (n = 782) 0.31 [0.25 0.38], (n = 757) 0.09 [0.02 0.17], (n = 419) −0.09 [−0.16 −0.02],
p < 0.0001 ** p < 0.01* p < 0.01*
HCP (total sample) (n = 1112) 0.35 [0.30 0.40], (n = 1112) 0.10 [0.04 0.16], (n = 1096) −0.10 [−0.16 −0.04],
p < 0.0001** p < 0.001** p < 0.002*
Genetic correlation (HCP) 0.32(0.26), p > 0.1 0.41 (0.16), p < 0.025* −0.59 (0.20), p < 0.0001**
Environmental correlation (HCP) 0.38(0.05), p < 0.0001** 0.03 (0.07), p > 0.1 0.17 (0.06), p < 0.007**
We performed phenotypic (HCP unrelated sample, eNKI sample, HCP total sample) and genetic correlation (HCP total sample) analysis of the association between sleep duration and global sleep quality
on the one hand, and depression, BMI, and IQ on the other, including 95% confidence intervals. Asterisks (**) indicates FDR q < 0.05 and asterisk (*) indicates association at trend−level p < 0.05. Sample
sizes are reported for each analysis.
of 783 (487 females) individuals with mean age of 41.2 years sleep duration. Phenotypic correlations were paralleled by genetic
(SD = 20.3, range = 12–85), enabling us to identify life-span correlations, were poor sleep quality were genetically correlated
relations between sleep, brain structure and behavior. Details on with lower IQ (ρg = −0.59, p < 0.0001) and higher BMI (ρg = 0.41,
the sample characteristics can be found in the Methods section. p < 0.025). Again, depression only showed environmental correla-
tion with global sleep quality (ρe = 0.38, p < 0.0001) (Table 1).
Relation between sleep, mental and physical health. First, we
sought to evaluate whether our measures of mental and physical Phenotypic correlation between sleep and brain structure in
status are related to sleep quantity and quality. Here, we corre- two independent samples. Next, we evaluated the phenotypic
lated sleep duration and global sleep quality to phenotypic var- relation between sleep indices (global sleep quality and sleep
iation in cognition, mental, and physical health (for selection of duration) and cortical thickness in both the unrelated subsample
markers see Supplementary Table 1). This data-driven analysis in from HCP (n = 424) and eNKI (n = 783). Behaviorally, we
the HCP phenotypic data revealed that cognitive, mental and observed a strong negative correlation (Spearman r = −0.51
physical phenotypic variation have a strong relation to variation [−0.59 −0.44], p < 0.0001) between global sleep quality and sleep
in sleep (Supplementary Table 2 and Supplementary Table 3). duration (Fig. 1a). Correlation of sleep indices with brain struc-
Given the marked role of both depression and BMI on both sleep ture demonstrated a negative link between left superior frontal
duration and global sleep quality, we selected these as phenotypes thickness (area 6d2 and pre-supplementary motor area) and sleep
of interest for further analyses. As several cognitive factors were duration (Spearman r = −0.1, FDR q < 0.02, Fig. 1b), that
related to sleep duration and sleep quality, we selected general remained significant when controlling for self-reported depressive
intelligence in this study, as this marker has been shown to be symptoms, as well as intake of sleep medications, intelligence, and
highly heritable and consistently relates to brain structure42. Next, BMI. Global sleep quality did not relate to local variations in
we demonstrated that depression, IQ, and BMI have moderate cortical thickness (Fig. 1c). When evaluating the relationship in
phenotypic inter-correlations in unrelated HCP, eNKI, as well as the complete HCP sample, including twins and siblings, we
full HCP samples (Supplementary Table 4). Evaluating the rela- observed only a trending relation between sleep duration and
tion between sleep and our selected markers in eNKI, in addition cortical thickness (Supplementary Fig. 1).
to HCP, we observed that, sleep duration had a consistent In eNKI, we replicated the negative behavioral correlation
negative phenotypic relation to both BMI and depression, and a between sleep duration and global sleep quality (Spearman r =
positive relation to IQ (Table 1). −0.53 [−0.58 −0.47], p < 0.0001) (Fig. 1d). Though we again
Taking advantage of the pedigree-structure of the full HCP found no relation between global sleep quality and cortical brain
sample, we observed that depression, IQ, and BMI were all structure (Fig. 1f), sleep duration showed a positive link between
heritable (Table 1); and we observed a negative genetic correlation bilateral inferior temporal regions (left: Spearman r = 0.13, FDR
between BMI and IQ (ρg = −0.27, p < 0.0001) (Supplementary q < 0.02, right: Spearman r = 0.12, FDR q < 0.02) and right
Table 4). Moreover, sleep duration was heritable (h2 = 0.24, p < occipital cortex (Spearman r = 0.14, FDR q < 0.02) (Fig. 1e).
0.001), and phenotypic correlations were mirrored by genetic Findings remained significant when controlling for self-reported
correlations. We observed sleep duration to show a positive depressive symptoms, as well as intake of sleep medications,
genetic correlation with IQ (ρg = 0.42, p < 0.0001), but negative intelligence, and BMI.
with BMI (ρg = −0.33, p < 0.005) (Table 1). Depression showed a In both samples, most individuals (>65%) slept less than the
weak environmental correlation with sleep duration (ρe = −0.16, recommended 7–9 h (Supplementary Table 5) and only a small
p < 0.01). proportion of both samples (ARTICLE COMMUNICATIONS BIOLOGY | https://doi.org/10.1038/s42003-020-0892-6 Fig. 1 Patterns of phenotypic correlation between sleep duration and cortical thickness in HCP and eNKI samples. a Distribution of variables in the unrelated HCP subsample; b, c. Phenotypic correlation of sleep duration/global sleep quality and cortical thickness; d Distribution of variables in the eNKI sample, as well as the correlation between sleep duration and global sleep quality score; e, f Phenotypic correlation of sleep duration/global sleep quality and cortical thickness. Red indicates a positive relationship, whereas blue indicates a negative phonotypical relationship between sleep and brain structure. Whole-brain findings were corrected for multiple comparisons using FDR correction (q < 0.05, black outline). Significant associations between sleep indices and brain structure have black outline, whereas trends (p < 0.01) were visualized at 60% transparency. the eNKI sample had a broad age range from 12 to 85 years of age, Replication analysis of correspondence between sleep duration we performed several stability analyses to evaluate the relationship and cortical thickness. As we found divergent local phenotypic between sleep duration and brain structure in youths, adults and correlations between sleep duration and cortical thickness in two elderly populations (Supplementary Table 6). Here, we did not large-scale independent samples, we evaluated the inconsistencies observe differential sleep duration effects in each sub-group, as across samples more precisely. Indeed, post-hoc analysis indi- well as differences between age-groups (Supplementary Fig. 3). cated that local effects of phenotypic correlations varied strongly 4 COMMUNICATIONS BIOLOGY | (2020)3:171 | https://doi.org/10.1038/s42003-020-0892-6 | www.nature.com/commsbio
COMMUNICATIONS BIOLOGY | https://doi.org/10.1038/s42003-020-0892-6                                                                                                                      ARTICLE

 Table 2 Inconsistency of associations between sleep                                                     Table 3 Phenotypic associations between sleep indices and
 duration and cortical thickness across samples and                                                      cortical thickness are mirrored by genetic correlations.
 analyses.
                                                                                                         Phenotypic correlation, Fig. 1b (HCP)
 Phenotypic correlation, Fig. 1b (HCP)                                                                   Left superior frontal gyrus                                                        p
 Left superior frontal gyrus                                                        p                    HCP (total sample) (n = 1113)                            r = −0.10                 0.0013*
 HCP (unrelated sample) (n = 424)                         r = −0.19                 0.00007**            Genetic correlation (HCP)                               ρg = −0.27                 0.035*
 eNKI (n = 783)                                           r = −0.03                 0.40                 Environmental correlation (HCP)                         ρe = 0.02                  0.97
 HCP (total sample) (n = 1113)                            r = −0.10                 0.0013*
 Genetic correlation (HCP)                               ρg = −0.27                 0.035*               Phenotypic correlation, Fig. 1e (eNKI)
 Environmental correlation (HCP)                         ρe = 0.02                  0.97
                                                                                                         Left inferior temporal cortex                                                      p
                                                                                                         HCP (total sample) (n = 1113)                            r = 0.04                  0.14
 Phenotypic correlation, Fig. 1e (eNKI)                                                                  Genetic correlation (HCP)                               ρg = −0.09                 0.67
 Left inferior temporal cortex                                                      p                    Environmental correlation (HCP)                         ρe = 0.06                  0.27
 HCP (unrelated sample) (n = 424)                         r = 0.09                  0.07                 Right occipital cortex                                                             p
 eNKI (n = 783)                                           r = 0.13                  0.0001**             HCP (total sample) (n = 1113)                            r = 0.04                  0.20
 HCP (total sample) (n = 1113)                            r = 0.04                  0.14                 Genetic correlation (HCP)                               ρg = 0.28                  0.03*
 Genetic correlation (HCP)                               ρg = −0.09                 0.67                 Environmental correlation (HCP)                         ρe = −0.08                 0.19
 Environmental correlation (HCP)                         ρe = 0.06                  0.27                 Right inferior temporal cortex                                                     p
 Right occipital cortex                                                             p                    HCP (total sample) (n = 1113)                            r = 0.004                 0.90
 HCP (unrelated sample) (n = 424)                         r = 0.07                  0.13                 Genetic correlation (HCP)                               ρg = 0.38                  0 .02*
 eNKI (n = 783)                                           r = 0.14                  0.0001**             Environmental correlation (HCP)                         ρe = −0.11                 0.06
 HCP (total sample) (n = 1113)                            r = 0.04                  0.20
                                                                                                         Genetic and environmental correlation between sleep and thickness in FDR-corrected ROIs from
 Genetic correlation (HCP)                               ρg = 0.28                  0.03*                phenotypic correlational analysis in Fig. 1. Asterisks (**) indicates to significant correlation (q <
 Environmental correlation (HCP)                         ρe = −0.08                 0.19                 0.05) and asterisk (*) indicates association at trend-level p < 0.05.
 Right inferior temporal cortex                                                     p
 HCP (unrelated sample) (n = 424)                         r = 0.05                  0.30
 eNKI (n = 783)                                           r = 0.12                  0.0006**
 HCP (total sample) (n = 1113)                            r = 0.004                 0.90                Fig. 1). Findings were robust when controlling for intelligence,
 Genetic correlation (HCP)                               ρg = 0.38                  0.02*               BMI or depression score (Supplementary Table 10). Frontal
 Environmental correlation (HCP)                         ρe = −0.11                 0.06                regions showing genetic correlation with sleep in the HCP sample
 Cross-sample replication of FDR-corrected ROIs from phenotypic correlational analysis in Fig 1.
                                                                                                        did not show an association with sleep in the eNKI sample
 Asterisks (**) indicates to significant correlation (q < 0.05) and asterisk (*) indicates association   (Supplementary Table 11). At the same time, we observed pat-
 at trend-level p < 0.05. Sample sizes are reported for each analysis.
                                                                                                        terns of genetic correlation to reflect phenotypic correlation at the
                                                                                                        whole brain level within the HCP sample and sub-sample, and in
                                                                                                        the eNKI sample (Supplementary Table 7). Last, though we did
in magnitude across samples in phenotypic analysis (Table 2). At                                        not observe a genetic correlation between global sleep quality and
the same time, we observed a high overlap between spatial dis-                                          brain structure, we identified an environmental relation between
tribution of phenotypic correlations between sleep duration, but                                        global sleep quality and left precentral thickness (Spearman r =
not global sleep quality, and cortical thickness across samples and                                     0.01, ρe = 0.22, p < 0.0002, ρg = −0.64, p < 0.0003) (Supplemen-
sub-samples, indicating that the direction of sleep thickness                                           tary Fig. 5).
associations is similar across both samples (Supplementary
Table 7). This suggests that the relation between sleep and cortical                                    Latent relation between sleep, brain and behavior. As we
thickness might be robust at the inter-regional level rather than in                                    observed (1) phenotypic and (2) genetic correlations between
local effects only. In addition, we observed that both intelligence                                     sleep, intelligence, BMI, and, in part, depression, as well as (3) an
and BMI related to local thickness associated with sleep duration                                       inconsistent relation between sleep duration and cortical thick-
(Supplementary Table 8), suggesting that sleep, intelligence and                                        ness, we utilized a multivariate data-driven approach to evaluate
BMI are dependent on overlapping macro-anatomical structures.                                           the latent relationship between sleep, intelligence, BMI and
                                                                                                        depression on the one hand, and cortical thickness on the other
Phenotypic correlations between sleep and cortical thickness                                            (Fig. 2). Indeed, it has been suggested multiple comparison cor-
are driven by additive genetic effects. Next, we explored whether                                       rections in mass univariate analysis may result in missing effects
phenotypic correlations between sleep duration and cortical                                             and thus inconsistencies in the results and a more comprehensive
thickness were mirrored by additive genetic effects using the                                           picture of the associations could be gained by a multivariate
twin-structure of the HCP dataset. First, we confirmed that cor-                                         approach52. Here, our primary analysis sample is the eNKI
tical thickness was heritable in this sample (Supplementary Fig. 4,                                     sample, as this enables us to replicate and evaluate phenotypic
Supplementary Table 9). Second, we assessed whether phenotypic                                          and genetic correlations between latent structures using the full
correlations observed in Fig. 1 were driven by shared additive                                          HCP sample.
genetic effects. We found that both frontal cortex (based on                                               In the eNKI sample, we observed two latent relations between
HCP), as well as right occipital cortex and right inferior temporal                                     our behavioral phenotypes and cortical thickness, controlling for
cortex (based on eNKI) showed a trend-level genetic correlation                                         effects of age, sex and global thickness, explaining, respectively, 41%
(p < 0.05) with sleep duration (Table 3). Using a whole-brain                                           of the shared variance (first latent component; p < 0.001, association
approach, we identified a negative genetic correlation between                                           between behavior and brain saliencies: Spearman r = 0.38), and
sleep duration and bilateral frontal cortices thickness, mainly in                                      25% of the shared variance (second latent component; p < 0.01,
the bilateral superior frontal gyrus and frontal pole, areas p32 and                                    association between behavior and brain saliencies: Spearman r =
Fp2 (left: ρe = 0.12, p < 0.06, ρg = −0.46, FDR q < 0.025; right:                                       0.29). The first component had a positive relation with both sleep
ρe = 0.15, p < 0.01, ρg = −0.46, FDR q < 0.025) (Supplementary                                          duration (Spearman r = 0.49) and intelligence (Spearman r =

COMMUNICATIONS BIOLOGY | (2020)3:171 | https://doi.org/10.1038/s42003-020-0892-6 | www.nature.com/commsbio                                                                                                      5
ARTICLE COMMUNICATIONS BIOLOGY | https://doi.org/10.1038/s42003-020-0892-6 Fig. 2 Two latent dimensions of cortical macrostructure and components of sleep,mental, and physical health. a Bootstrap ratio of the first brain saliency that showed significant robustness, where parcel-wise saliencies of BSR > 2 are highlighted. Red indicates a positive association whereas blue indicates a negative association; Loadings of the individual traits (SD: Sleep duration, D: Depression, B: BMI, I: Intelligence, SQ: Sleep quality); Relative distribution of positive(P) and negative (N) -2>BSR > 2 scores per functional networks102, and average BSR in functional networks102 (V = visual, SM = sensorimotor, Da = dorsal-attention, Va = ventral attention, L = limbic, FP = frontopolar, DMN = default mode network); Replication of brain–behavior saliency association in the HCP sample; and b Relation between brain and behavioral saliencies in HCP sample of the second brain saliency; Loadings of the individual traits; Relation to functional networks102 and; Relation between brain and behavioral saliencies of second factor in the HCP sample. 0.83), and a negative relation with sleep quality (Spearman r = axis of behavior, relating high sleep quantity to positive behaviors −0.43), BMI (Spearman r = −0.46) and depression (Spearman whereas low sleep quality related negatively to this factor r = −0.21). The brain saliency loadings were positively (bootstrap (Fig. 2a). ratio > 2) associated sensory-motor areas, as well as superior The second component related positively to depression (Spear- temporal areas, and parahippocampal structures, and negatively man r = 0.70), BMI (Spearman r = 0.50), intelligence (Spearman with lateral and medial frontal cortex, as well as inferior temporal r = 0.16), and reduced sleep quality (Spearman r = 0.69), and lobe, precuneus, and posterior parietal cortex. Further qualifying negatively to sleep duration (Spearman r = −0.43). Positive brain the brain saliency, we observed that positive relations were mainly loadings (bootstrap ratio>2) were located in the left sensorimotor in visual, sensorimotor and limbic functional networks, whereas areas, right precuneus, and right parietal areas. Negative loadings negative relations were predominantly located in the dorsal- (bootstrap ratio < −2) were located in left dorsolateral areas, left attention, fronto-parietal and default-mode networks. Replicating mid-cingulate, right dorsolateral frontal cortex, and left anterior- the association in HCP using the behavioral and brain loadings, mid cingulate. Qualitative analysis revealed positive loading were we identified a relation between latent brain and behavioral predominantly in sensorimotor, visual, dorsal attention and default factors in this sample as well (component 1: Spearman r = 0.25, networks, whereas negative loadings were associated with the p < 0.001). Moreover, both brain and behavioral latent factors fronto-parietal, ventral attention, limbic and default networks. were heritable (brain saliency: h2 ± std = 0.63 ± 0.04; behavior Again, we replicated this association in HCP using the behavioral saliency: h2 ± std 0.76 ± 0.03) and showed genetic correlation and brain loadings (Spearman r = 0.10, p < 0.002). Both brain and (ρe = −0.07 ± 0.07, p = ns, ρg = 0.38 ± 0.05, p < 0.0001). The first behavioral saliency of the second component were heritable (brain brain-behavior component seems to reflect a positive-negative saliency: h2 ± std = 0.72 ± 0.03; behavior saliency: h2 ± std 0.51 ± 6 COMMUNICATIONS BIOLOGY | (2020)3:171 | https://doi.org/10.1038/s42003-020-0892-6 | www.nature.com/commsbio
COMMUNICATIONS BIOLOGY | https://doi.org/10.1038/s42003-020-0892-6                                                                ARTICLE

0.05) and showed genetic correlation (ρe = −0.11 ± 0.07, p = ns,               phenotypic relationship between amount of sleep and domain-
ρg = 0.22 ± 0.07, p < 0.0001). This time, sleep quality, depression,           general cognitive skill in both the HCP sample, consisting of
BMI, and intelligence showed positive latent relations, but duration           young healthy adults, and in the eNKI sample, which included a
had a negative relation to the behavioral saliency, suggesting that            broad age-range with children, adults and elderly. Of note,
sleep quality has both positive and negative relationships to                  though the measurement of domain-general cognition was not
intelligence (Fig. 2b).                                                        consistent across two samples, as we used NIH Toolbox Cogni-
                                                                               tion in HCP and the WASI-II in eNKI, both tests have been
                                                                               validated for different age-ranges47,48. Further studies are needed
Discussion                                                                     to uncover the causal and longitudinal relationship between sleep
Sleep is key for normal human functioning and associated with                  and cognitive skill across the life-span.
brain structure and function. At the same time, individual dif-                   At the same time, our work highlights that inadequate sleep is
ferences in sleeping behavior are heritable and have substantial               linked with increased BMI. Previously, it has been shown that
overlap with cognition, physical, and mental health. This raises               high BMI is associated with abnormal sleep duration and vice
the question whether shared variance in sleep, intelligence, BMI,              versa61. Short term sleep restriction is associated with impaired
and depression could be due to a shared relationship to macro-                 glucose metabolism, dysregulation of appetite, and increased
scale gray-matter anatomy. Here, we combined computational                     blood pressure, and prospective studies found increased risk of
approaches from behavioral genetics and big-data neuroimaging                  weight gain associated with inadequate sleep62,63. In the same
to evaluate the interrelation between sleep, macroscale brain                  vein, various studies have related BMI to brain structure and
structure, and mental and physical health. Indeed, in two large-               function41, suggestive of a bidirectional relation between sleep,
scale independent samples, we observed that sleep duration, as                 BMI, and the brain.
well as global sleep quality, had a phenotypic relation with                      Last, we observed a relation between sleep and depressive
intelligence and BMI, which was mirrored by additive genetic                   symptoms. A recent meta-analysis implicated both long and short
effects. Depression showed only a phenotypic correlation with                  sleep to be associated with increased risk of depression in
sleep. Following, we demonstrated that sleep duration, but not                 adults64. Though the mechanisms underlying this association are
global sleep quality, had a (inconsistent) relation with local var-            not fully understood, daytime tiredness, resulting in increased
iance in cortical thickness in two samples. Three out of four                  negative events and emotions, has been shown to be predictive of
phenotypic relations between sleep duration and local cortical                 poor outcome of depression. Next to this, sleep abnormalities
thickness were driven by additive genetic factors. At the same                 relate also to low physical activity, which in turn modulates risk
time, both intelligence and BMI related to variance in cortical                of depression. Importantly, sleep factors can predispose, pre-
thickness in these regions, suggesting that these factors might                cipitate, and perpetuate depression and in our multivariate model,
have an overlapping neuroanatomical basis. Consistent with these               we observed both neutral and positive associations between
results, a comprehensive multivariate analysis revealed two robust             depression and unhealthy sleep behaviors, highlighting the
and heritable signatures, highlighting shared relationships                    complex relation between sleep and mental health.
between macroscale anatomy and sleep, intelligence, BMI and                       Though we could establish phenotypic and genetic correlations
depression. Both components featured brain structures in both                  between sleep duration and local cortical thickness in two inde-
unimodal and heteromodal association areas, and underlined the                 pendent samples, findings were inconsistent. In the HCP sample,
embedding of nocturnal behavior in daytime functioning. Col-                   but not in the eNKI sample, sleep duration was linked to thick-
lectively, our multi-sample approach provides evidence that sleep              ness in the frontal areas. The important role of frontal cortex in
is intrinsically interrelated with macroscale gray matter structure,           sleep is previously well-documented. For example, sleep depri-
mental, and physical health.                                                   vation influences frontal executive functions in both healthy
    Our observations highlight the key relation between intelli-               individuals and patients with insomnia disorder65–67. In addition,
gence, mental and physical health and sleep profile in healthy                  sleep deprivation leads to lower metabolism in the frontal cortex,
subjects. Previous work has implicated the important role of sleep             while sleep recovery moderately restores frontal lobe functions68.
on life functioning, such as cognitive performance and quality of              Function abnormalities are also mirrored by abnormalities in
life7,8, as well as higher rate of depressive symptoms13,14, hyper-            macro-anatomical structure, where cortical thinning in bilateral
tension, diabetes, and obesity25,26. Indeed, clear associations of             precentral cortex and the superior/mid frontal cortex related
sleep, cognitive performance and behavioral problems have been                 to insomnia symptoms69 and patients with insomnia disorder
observed in children53, adults54, and elderly44. It has been revealed          showed gray matter abnormalities in the frontal cortices70,71. On
that short-term sleep deprivation has a deleterious effect on a                the other hand, phenotypic analyses in the eNKI sample
broad range of cognitive domains54 and short sleep duration is                 demonstrated that sleep duration had a positive link with thick-
associated with poor overall IQ /cognitive performance in healthy              ness in bilateral inferior temporal regions and right occipital
children55.                                                                    cortex. Also function and structure of temporal and occipital
    There are various hypotheses on the biological processes                   areas has been associated with sleep patterns. For instance, older
underlying the important role of sleep in the neuronal processing              adults with short or long sleep duration had higher rates of
of information and consequently mental processing. The trace                   cortical thinning in the frontal and temporal regions, as well as
reactivation or replay hypothesis56,57 suggests that sleep helps               the inferior occipital gyrus72 relative to older adults with normal
memory consolidation through reactivation of traces of neuronal                sleep duration. Also, insomnia disorder has been related to
activity patterns, encoding information. The synaptic homeostasis              functional abnormalities in the temporal and occipital areas,
hypothesis proposes that sleep is necessary to counterbalance the              beside the frontal regions73,74. These activations have been
increase of synaptic connectivity5. Converging evidence suggests a             associated with excessive hyperarousal, impaired alertness,
role of sleep in maintaining functional integrity of the fronto-               auditory-related and vision-related inattention, and experiencing
parietal networks, that support sustained attention58,59, as well as           negative moods in such patients. Possible causes for divergence
default mode network60, which is a brain network, implicated in                could be sample characteristics, as well as confounding effects.
task-unrelated thought. Indeed, in our multivariate analysis, we               However, even when controlling for age, intelligence, BMI, and
observed a shared relation of intelligence and sleep with cortical             depression, findings remained dissimilar between samples. Only
thickness in these networks. Importantly, we observed a positive               when evaluating spatial patterns of relationships between sleep

COMMUNICATIONS BIOLOGY | (2020)3:171 | https://doi.org/10.1038/s42003-020-0892-6 | www.nature.com/commsbio                                      7
ARTICLE COMMUNICATIONS BIOLOGY | https://doi.org/10.1038/s42003-020-0892-6 duration and cortical thickness, we observed cross-sample con- and memory consolidation80. Similarly, other studies applying sistency, suggesting that the degree of impact of sleep duration on multivariate methods to understand the relation between system- local brain structure varied across samples, but that the direction level brain function and complex behavior also have implicated of the relation between sleep and cortical thickness was com- alterations of inter-network relationships between somatosensory parable across the cortex. Of note, though we observed diverging and heteromodal association cortices in mental function and phenotypic relationships across samples, three out of four local dysfunction81,82. It is possible that such disruptions are due to relationships between sleep and cortical thickness were observed dissociable neurodevelopmental as well as genetic effects affecting driven by additive genetic factors, suggestive of a system-level the hierarchical interrelation of these brain systems77. Future impact of sleep on brain structure, with modest but robust research on the neurobiology of sleep requires to be conducted underlying local genetic associations. Nevertheless, local, uni- with functional and structural connectivity data enabling more variate, associations between sleep and cortical thickness should direct analysis of the relation between system-level connectivity, be interpreted with caution, as they were not consistent across sleep, and behavior. samples. It is of note that detrimental effects of both short and In addition to providing evidence for a shared neurobiological long sleep have been reported previously46,75 and in the current basis of sleep, mental and physical health, we observed that, in study, the large majority of individuals (>65% for all samples) line with previous literature17,18,46, variance in global sleep reported less than 7h of sleep whereas only a small proportion quality and sleep duration was in part driven by additive genetic (
COMMUNICATIONS BIOLOGY | https://doi.org/10.1038/s42003-020-0892-6                                                                                     ARTICLE

 Table 4 Behavioral characteristics of the HCP unrelated                                Table 5 Behavioral characteristics of the complete HCP
 sample.                                                                                sample including twins and siblings.

 Measure                                  n           Mean ± SD (range)                 Measure                                 n            Mean ± SD (range)
 Males/females                            196/228           –                           Males/females                           507/              –
 Age                                      424         28.6 ± 3.7 (22–36)                                                        606
 Sleep duration (hours)                   424           6.8 ± 1.2 (2.5–10)              Age                                     1113         28.8 ± 3.7 (22–37)
 Total sleep quality                      424           4.9 ± 2.8 (0–15)                Sleep duration (hours)                  1113           6.8 ± 1.1 (2.5–12)
 BMI                                      424         26.6 ± 5.3 (16.7–44.5)            Total sleep quality                     1113           4.8 ± 2.8 (0–19)
 Intelligence (total cognitive score)     418         121.5 ± 14.7 (84.6–153.4)         BMI                                     1112         26.5 ± 5.2 (16.5–47.8)
 Depression (DSM-scale)                   419          54.1 ± 6.1 (50–87)               Intelligence (total                     1096         121.8 ± 14.6 (84.6–153.4)
                                                                                        cognitive score)
                                                                                        Depression (DSM scale)                  1105         53.9 ± 5.7 (50–87)

   Notably, we refrain from interpreting environmental correla-
tions, as the environmental component includes environmental
factors, but also measurement errors. In a previous work87, we                          Table 6 Behavioral characteristics of the eNKI sample.
have shown that a model based on genetic and environmental
factors only was more parsimonious compared to a model                                  Measure                            n                   Mean ± SD (range)
including common household effects in extended family samples                           Males/females                      296/487                   –
such as the HCP sample. Nevertheless, as individual variance in                         Age                                783                  41.2 ± 20.3 (12–85)
sleep duration and quality was only in part explained by genetic                        Sleep duration (hours)             783                   6.9 ± 1.3 (3–12)
factors, future longitudinal models might help uncover relevant                         Total sleep quality                783                   4.6 ± 3.2 (0–17)
familial and non-familial environmental effects relating sleep to                       BMI                                757                  27.1 ± 5.9 (15.7–50.0)
mental and physical health.                                                             Intelligence (WASI)                783                 101.9 ± 13.3 (65–141)
   Taken together, our study on the interrelation between sleep,                        Depression (BDI)                   782                  4.21 ± 6.3 (0–40)
mental, and physical health and brain structure was made pos-
sible by the open HCP and eNKI neuroimaging repositories.
These initiatives offer cognitive neuroimaging communities a                           (https://www.ncbi.nlm.nih.gov/pmc/articles/PMC3472598/). All approvals
unique access to large datasets for the investigation of the brain                     regarding human subjects’ studies were sought following NKI procedures. Images
basis of individual difference. The use of multiple datasets has                       were acquired from the International Neuroimaging Data Sharing Initiative (INDI)
                                                                                       online database https://fcon_1000.projects.nitrc.org/indi/enhanced/studies.html.
enabled us to highlight variability across samples, and allowed us                        For our phenotypic analyses, we selected individuals with complete sleep and
to preform validation experiments to verify stability of our                           imaging data. Our sample for phenotypic correlations consisted of 783 (487
observations. Given that reproducibility is increasingly important                     females) individuals with mean age of 41.2 years (SD = 20.3, range = 12–85). See
nowadays, our study illustrates the advantages of open data to                         Table 6 for demographic characteristics.
increase our understanding of complex traits.
                                                                                       Structural imaging processing: NKI Rockland sample. 3D magnetization-
                                                                                       prepared rapid gradient-echo imaging (3D MP-RAGE) structural images91
Methods                                                                                were acquired using a 3.0 T Siemens Trio scanner with TR = 2500 ms, TE =
Participants and study design: human connectome project. We studied the                3.5 ms, Bandwidth = 190 Hz/Px, field of view = 256 × 256 mm, flip angle = 8°,
publicly available Human Connectome Project dataset (HCP; http://www.                  voxel size = 1.0 × 1.0 × 1.0 mm. More details on image acquisition are available
humanconnectome.org/), which included data from 1206 individuals (656                  at https://fcon_1000.projects.nitrc.org/indi/enhanced/studies.html. All T1 ima-
females), 298 monozygotic twins (MZ), 188 dizygotic twins (DZ), and 720 single-        ges were visually inspected to ensure the absence of gross artefacts and subse-
tons, with mean age 28.8 years (SD = 3.7, range = 22–37). Participants for whom        quently pre-processed using the FreeSurfer software library (http://surfer.nmr.
the images and data had been released (humanconnectome.org) after passing the          mgh.harvard.edu/) Version 5.3.092.
HCP quality control and assurance standards were included. The full set of
inclusion and exclusion criteria are described elsewhere88. All participants signed
an informed consent document at the beginning of day 1 of testing.                     Parcellation-summaries of cortical thickness. We used a parcellation scheme50
   For our phenotypic analyses, we selected an unrelated subsample with complete       based on the combination of a local gradient approach and a global similarity
behavioral data (n = 457). After removing individuals with missing structural          approach using a gradient-weighted Markov Random models. The parcellation has
imaging our sample for phenotypic correlations consisted of 424 (228 females)          been comprehensively evaluated with regards to stability and convergence with
individuals with mean age of 28.6 years (SD = 3.7, range = 22–36), see further         histological mapping and alternative parcellations. In the context of the current
Table 4. For our twin-based genetic analyses, we used the complete sample of           study, we focused on the granularity of 200 parcels. In order to improve signal-to-
individuals with complete structural imaging for structural gray matter and            noise and improve analysis speed, we opted to average unsmoothed structural data
behavioral data for sleep genetic correlation analyses including 1105 individuals      within each parcel and cortical thickness of each region of interest (ROI) was
(599 females), 285 MZ twins, 170 DZ twins, and 650 singletons, with mean age           estimated as the trimmed mean (10 percent trim).
28.8 years (SD = 3.7, range = 22–37), see further Table 5. Environmental
correlations were also derived in this sample as a by-product of analysis of genetic   Selection of behavioral markers based on HCP phenotypic traits. First, to
correlation analysis.                                                                  constrain analyses, we selected primary markers for cognition, mental and physical
                                                                                       health based on the relation of sleep to these traits in HCP. The selected traits
Structural imaging processing: human connectome project. MRI protocols of              include 38 emotional, cognitive, NEO-FFI personality, as well as the 7 PSQI sleep
the HCP are previously described89,90. In particular, the applied pipeline to obtain   markers for reference, based on the unrestricted phenotypic data, as well as 46
the FreeSurfer-segm entation is described earlier89 and is recommended for the         mental and physical health markers based on the restricted phenotypic data. For
HCP data. The pre-processing steps included co-registration of T1 and T2 images,       more information on available phenotypes, see: https://wiki.humanconnectome.
B1 (bias field) correction, and segmentation and surface reconstruction using           org/display/PublicData.
FreeSurfer version 5.3-HCP to estimate cortical thickness89.
                                                                                       Behavioral markers: HCP. Inter-individual difference in sleep quality was derived
Participants and study design: eNKI sample. To evaluate the cross-sample               from information of the self-reported Pittsburg Sleep Questionnaire (PSQI)11,
reproducibility of observations, we additionally investigated correspondence           which is a common measure of sleep quality with significant item-level reliability
between sleep and cortical brain structure in the enhanced Nathan Kline Institute-     and validity.
Rockland Sample (NKI). The sample was made available by the Nathan-Kline                  For markers of life function, we used BMI (703 × weight/(height)2) and the ASR
Institute (NKY, NY, USA), as part of the ‘enhanced NKI-Rockland sample’                depression DSM-oriented scale for ages 18–5949 (https://aseba.org/). The ASR is a

COMMUNICATIONS BIOLOGY | (2020)3:171 | https://doi.org/10.1038/s42003-020-0892-6 | www.nature.com/commsbio                                                              9
ARTICLE COMMUNICATIONS BIOLOGY | https://doi.org/10.1038/s42003-020-0892-6
self-administered test examining diverse aspects of adaptive functioning and matrices for a phenotypic (neuroimaging or behavioral) measure with the structure
problems. Scales are based on 2020 referred adults and normed on 1767 non- of the covariance matrix predicted by kinship. Heritability analyses were conducted
referred adults. The test-retest reliability of the ASR was supported by 1-week test- with simultaneous estimation for the effects of potential covariates. For this
retest that were all above 0.71. The ASR also has good internal consistency (0.83), study, we included covariates of age, sex, age × sex interaction, age2, age2 × sex
and in the current study we focused on depression sub-score. interaction. When investigating cortical thickness, we additionally controlled
As a proxy for intelligence, we used the NIH Toolbox Cognition47, ‘total for global thickness effects, as well as depression score, BMI, and intelligence in
composite score’. The Cognitive Function Composite score is derived by averaging post-hoc tests. Heritability estimates were corrected for multiple comparisons at
the normalized scores of each of the Fluid and Crystallized cognition measures, FDR q < 0.05, controlling for the number of parcels in case of analysis of brain
then deriving scale scores based on this new distribution. Higher scores indicate structure.
higher levels of cognitive functioning. Participant score is normed to those in the We performed genetic correlation analysis to determine if variations in sleep
entire NIH Toolbox Normative Sample (18 and older), regardless of age or any and cortical thickness were influenced by the same genetic factors. Specifically,
other variable, where a score of 100 indicates performance that was at the national bivariate polygenic analyses were conducted to estimate genetic (ρg) and
average and a score of 115 or 85, indicates performance 1 SD above or below the environmental (ρe) correlations, based on the phenotypic correlation (ρp), between
national average. brain structure and
sleep with the following formula:
ρp ¼ ρg p h21 h22 þ ρe p½ð1 h21 Þð1 h22 Þ, where h21 and h22 are the heritability’s
Behavioral markers: NKI. Sleep markers were derived from the Pittsburg of the parcel-based cortical thickness and the sleep parameters. The significance of
Sleep Questionnaire (see further the section on this question in the HCP these correlations was tested by comparing the log likelihood for two restricted
sample). models (with either ρg or ρe constrained to be equal to 0) against the log likelihood
Depression was measured using the Beck Depression Inventory (BDI–II). The for the model in which these parameters were estimated. A significant genetic
BDI-II is a 21-item self-report questionnaire assessing the current severity of correlation (using a FDR q < 0.05) is evidence suggesting that both phenotypes are
depression symptoms in adolescents and adults (ages 13 and up). It is not designed influenced by a gene or set of genes98.
to serve as an instrument of diagnosis, but rather to identify the presence and
severity of symptoms consistent with the criteria of the DSM-IV. Questions assess Partial least squares. PLS is a multivariate data-driven statistical technique that
the typical symptoms of depression such as mood, pessimism, sense of failure, self- aims to maximize the covariance between two matrices by deriving latent com-
dissatisfaction, guilt, punishment, self-dislike, self-accusation, suicidal ideas, crying, ponents (LCs), which are optimal linear combinations of the original
irritability, social withdrawal, insomnia, fatigue, appetite, and loss of libido. matrices99,100. We applied PLS to the cortical thickness and sleep, BMI, depression
Participants are asked to pick a statement on a 4-point scale that best describes the and IQ measures of all participants. In short, PLS performs data normalization,
way they have been feeling during the past two weeks93. Body-mass-index was cross-covariance, and singular value decomposition. Following, brain and beha-
calculated using weight and height. These vitals are obtained and recorded by study vioral scores are created and permutation testing is performed to assess significance
staff. Height was recorded in centimeters. Weight was recorded in kilograms. Body of each latent factor solution. Last, bootstrapping is performed to test the stability
Mass Index (BMI) was automatically calculated. of the brain saliencies.
Intelligence was measured using the Wechsler Abbreviated Scale of Intelligence Each LC has a distinct cortical thickness pattern (called brain saliences) and a
(WASI-II). The WASI is a general intelligence, or IQ test designed to assess specific distinct behavioral profile (called behavioral saliences). By linearly projecting the
and overall cognitive capabilities and is individually administered to children, cortical thickness and behavioral measures of each participant onto their
adolescents and adults (ages 6-89). It is a battery of four subtests: Vocabulary corresponding saliences, we obtain individual-specific brain and behavioral
(31-item), Block Design (13-item), Similarities (24-item) and Matrix Reasoning composite scores for each LC. PLS seeks to find saliences that maximize across-
(30-item). In addition to assessing general, or Full Scale, intelligence, the WASI is participant covariance between the brain and behavioral composite scores. The
also designed to provide estimates of Verbal and Performance intelligence number of significant LCs was determined by a permutation (1000 permutations).
consistent with other Wechsler tests. Specifically, the four subtests comprise the full The p-values (from the permutation test) for the LCs were corrected for multiple
scale and yield the Full-Scale IQ (FSIQ-4). The Vocabulary and Similarities subtests comparisons using a false discovery rate (FDR) of p < 0.05. For the brain saliencies,
are combined to form the Verbal Scale and yield a Verbal IQ (VIQ) score, and the though all regions contributed to the latent brain score, we highlighted regions with
Block Design and Matrix Reasoning subtests form the Performance Scale and yield a bootstrap ratio > 2, approximately p < 0.05. Findings where summarized at the
a Performance IQ (PIQ) score48. level of macroscale function networks101, by averaging the BSR score per network,
as well as summarizing the relative contribution of each functional network to
positive (BSR > 2), as well as negative (BSR < −2) relations. Here we controlled for
Statistics and reproducibility the size of the network.
Phenotypic analysis. For our phenotypic analysis in the HCP sample, we selected an
unrelated subsample to overcome possible bias due to genetic similarity of indi-
viduals. In eNKI the complete sample with available data was used. To assess Functional decoding. All significant parcels were functionally characterized, using
phenotypic relationships between sleep parameters and behavior/brain structure, the Behavioral Domain meta-data from the BrainMap database using forward
we used Spearman’s correlation test to account for outliers, while controlling for inference (www.brainmap.org)102,103. To do so, volumetric counterparts of the
age, sex, age × sex interaction, age2, age2 × sex interaction. In our structural whole- surface-based parcels were identified. In particular, we identified those meta-data
brain analysis, we additionally controlled for global thickness. Findings were labels (describing the computed contrast [behavioral domain]) that were sig-
similar when additionally controlling for depression, BMI or intelligence. We nificantly more likely than chance to result in activation of a given parcel105–106.
controlled for multiple comparisons at FDR q < 0.05, per analysis step of univariate That is, functions were attributed to the identified effects by quantitatively deter-
behavior and univariate brain analysis, and report FDR q thresholds for reference. mining which types of experiments are associated with activation in the respective
We used the Robust Correlation Toolbox for Matlab to define confidence intervals parcellation region. Significance was established using a binomial test (p < 0.05,
in our post-hoc phenotypic correlations94. corrected for multiple comparisons using false discovery rate (FDR)) (Supple-
mentary Fig. 6).
Heritability and genetic correlation analysis. To investigate the heritability and
genetic correlation of sleep parameters and brain structure, we analyzed sleep Reporting summary. Further information on research design is available in
parameters and 200 parcels of cortical thickness of each subject in a twin-based the Nature Research Reporting Summary linked to this article.
heritability analysis. As previously described95, the quantitative genetic analyses
were conducted using Sequential Oligogenic Linkage Analysis Routines (SOLAR)96.
SOLAR uses maximum likelihood variance-decomposition methods to evaluate the Data availability
relative importance of familial and environmental influences on a phenotype by All data, analyzed in this manuscript, were obtained from the open-access HCP young
modeling the covariance among family members as a function of genetic proximity. adult sample (http://www.humanconnectome.org/)90 and enhanced NKI-Rockland
Coefficient of relationship (genetic proximity) between individuals in the HCP sample (https://www.ncbi.nlm.nih.gov/pmc/articles/PMC3472598/)51. Brain images were
sample was computed based on self-reported data and was highly similar to other acquired from the International Neuroimaging Data Sharing Initiative (INDI) online
approaches based on genotyped data of the HC97. This approach can handle ped- database http://fcon_1000.projects.nitrc.org/indi/enhanced/studies.html. The raw data
igrees of arbitrary size and complexity and thus is optimally efficient with regard to may not be shared by third parties due to ethics requirements, but can be downloaded
extracting maximal genetic information. To ensure that neuroimaging traits, parcels directly via the above weblinks. Spearman correlations and confidence intervals were
of cortical thickness, conform to the assumptions of normality, an inverse normal computed using the Robust Correlation toolbox https://github.com/CPernet/
transformation was applied95. robustcorrtool94.
Heritability (h2) represents the portion of the phenotypic variance (σ 2p ) Genetic analyses were performed using solar eclipse 8.4.0 (http://www.solar-eclipse-
accounted for by the total additive genetic variance (σ 2g ), i.e., h2 ¼ σ 2g =σ 2p . genetics.org), and data on the KING pedigree analysis is available here: https://www.
nitrc.org/projects/se_linux/96,97. We performed partial least square analysis using https://
Phenotypes exhibiting stronger covariances between genetically more similar
individuals than between genetically less similar individuals have higher miplab.epfl.ch/index.php/software/PLS.99,100. BrainMap analysis were performed using
heritability. Within SOLAR, this is assessed by contrasting the observed covariance http://www.brainmap.org102,103.
10 COMMUNICATIONS BIOLOGY | (2020)3:171 | https://doi.org/10.1038/s42003-020-0892-6 | www.nature.com/commsbioYou can also read