Vestibular agnosia in traumatic brain injury and its link to imbalance
←
→
Page content transcription
If your browser does not render page correctly, please read the page content below
doi:10.1093/brain/awaa386                                                                                                               BRAIN 2021: 144; 128–143              | 128

Vestibular agnosia in traumatic brain injury
and its link to imbalance
Elena Calzolari,1,† Mariya Chepisheva,1,† Rebecca M. Smith,1 Mohammad Mahmud,1
Peter J. Hellyer,2 Vassilios Tahtis,1,3 Qadeer Arshad,4 Amy Jolly,5 Mark Wilson,6

                                                                                                                                                                                          Downloaded from https://academic.oup.com/brain/article/144/1/128/6050089 by guest on 18 July 2021
Heiko Rust,1 David J. Sharp5 and Barry M. Seemungal1,6

†
    These authors contributed equally to this work.

Vestibular dysfunction, causing dizziness and imbalance, is a common yet poorly understood feature in patients with TBI. Damage
to the inner ear, nerve, brainstem, cerebellum and cerebral hemispheres may all affect vestibular functioning, hence, a multi-level
assessment—from reflex to perception—is required. In a previous report, postural instability was the commonest neurological fea-
ture in ambulating acute patients with TBI. During ward assessment, we also frequently observe a loss of vertigo sensation in
patients with acute TBI, common inner ear conditions and a related vigorous vestibular-ocular reflex nystagmus, suggesting a ‘ves-
tibular agnosia’. Patients with vestibular agnosia were also more unbalanced; however, the link between vestibular agnosia and im-
balance was confounded by the presence of inner ear conditions. We investigated the brain mechanisms of imbalance in acute TBI,
its link with vestibular agnosia, and potential clinical impact, by prospective laboratory assessment of vestibular function, from re-
flex to perception, in patients with preserved peripheral vestibular function. Assessment included: vestibular reflex function, ves-
tibular perception by participants’ report of their passive yaw rotations in the dark, objective balance via posturography, subjective
symptoms via questionnaires, and structural neuroimaging. We prospectively screened 918 acute admissions, assessed 146 and
recruited 37. Compared to 37 matched controls, patients showed elevated vestibular-perceptual thresholds (patients 12.92 /s versus
3.87 /s) but normal vestibular-ocular reflex thresholds (patients 2.52 /s versus 1.78 /s). Patients with elevated vestibular-perceptual
thresholds [3 standard deviations (SD) above controls’ average], were designated as having vestibular agnosia, and displayed worse
posturography than non-vestibular-agnosia patients, despite no difference in vestibular symptom scores. Only in patients with
impaired postural control (3 SD above controls’ mean), whole brain diffusion tensor voxel-wise analysis showed elevated mean dif-
fusivity (and trend lower fractional anisotropy) in the inferior longitudinal fasciculus in the right temporal lobe that correlated with
vestibular agnosia severity. Thus, impaired balance and vestibular agnosia are co-localized to the inferior longitudinal fasciculus in
the right temporal lobe. Finally, a clinical audit showed a sevenfold reduction in clinician recognition of a common peripheral
vestibular condition (benign paroxysmal positional vertigo) in acute patients with clinically apparent vestibular agnosia. That ves-
tibular agnosia patients show worse balance, but without increased dizziness symptoms, explains why clinicians may miss treatable
vestibular diagnoses in these patients. In conclusion, vestibular agnosia mediates imbalance in traumatic brain injury both directly
via white matter tract damage in the right temporal lobe, and indirectly via reduced clinical recognition of common, treatable ves-
tibular diagnoses.

    1 Brain and Vestibular Group, Neuro-Otology Unit, Department of Brain Sciences, Charing Cross Hospital, Imperial College London,
      London, W6 8RF, UK
    2 Centre for Neuroimaging Sciences, King’s College London, London WC2R 2LS, UK
    3 King’s College Hospital NHS Foundation Trust, SE5 9RS, UK
    4 InAmind Laboratory, Department of Neuroscience, Psychology and Behaviour, University of Leicester, Leicester, LE1 7RH, UK
    5 C3NL, Department of Brain Sciences, Hammersmith Hospital, Imperial College London, London, W12 0NN, UK
    6 St Mary’s Hospital Major Trauma Centre, Imperial College Healthcare NHS Trust, London, W2 1NY, UK

Received June 19, 2020. Revised August 21, 2020. Accepted September 5, 2020. Advance access publication December 26, 2020
C The Author(s) (2020). Published by Oxford University Press on behalf of the Guarantors of Brain.
V
This is an Open Access article distributed under the terms of the Creative Commons Attribution License (http://creativecommons.org/licenses/by/4.0/), which permits unrestricted reuse,
distribution, and reproduction in any medium, provided the original work is properly cited.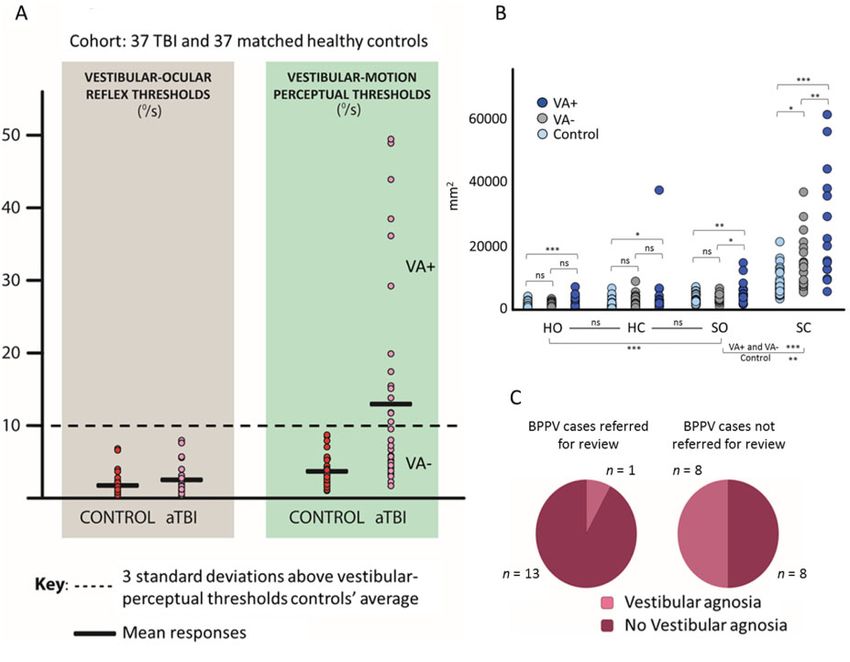
Vestibular agnosia                                                                              BRAIN 2021: 144; 128–143    | 129

Correspondence to: Dr Barry M. Seemungal
Brain and Vestibular Group, Neuro-Otology Unit, Department of Brain Sciences, Imperial College London, Room
10L17, Charing Cross Campus, London W6 8RF, UK
E-mail: bmseem@ic.ac.uk

Keywords: vestibular agnosia; traumatic brain injury; self-motion perception; vestibular cognition; vertigo
Abbreviations: ABC = Activity-Specific Balance Confidence Scale; BPPV = benign paroxysmal positional vertigo; DTI = diffusion
tensor imaging; FA = fractional anisotropy; MD = mean diffusivity; TBI = traumatic brain injury; VOR = vestibular ocular reflex

                                                                    were also those with worse balance function. This observa-
Introduction                                                        tion was confounded, however, by the clinical situation
Traumatic brain injury (TBI) is the commonest cause of              where the stimulus to the peripheral vestibular apparatus

                                                                                                                                      Downloaded from https://academic.oup.com/brain/article/144/1/128/6050089 by guest on 18 July 2021
chronic disability in young adults (Langlois et al., 2006) and      required to reveal both a prominent nystagmus and simul-
imbalance post-TBI is a key predictor of failure to return to       taneous lack of vertigo sensation, could only occur in the
work (Chamelian and Feinstein, 2004; Maskell et al., 2006).         setting of a co-existing inner ear disorder, such as BPPV (or
Indeed, even in mild TBI patients, return-to-work rates at 6        an acute vestibular nerve injury that affected 19% of acute
months are reduced from 75% in those without vestibular             TBI cases; Marcus et al., 2019). In inner ear conditions, in
features, to 33% in those with vestibular dysfunction               addition to a reflex vestibular nystagmus, patients with a
(Chamelian and Feinstein, 2004). TBI is an independent pre-         healthy brain (i.e. not acute TBI cases), complain of severe
dictor of falls (Maskell et al., 2006, 2007), even in young         vertigo. To assess whether vestibular agnosia was directly
adults, perhaps explaining why imbalance in TBI also predicts       linked to imbalance required the formal testing of vestibular
return-to-work rates. Despite its importance in recovery from       reflex and perceptual function in acute TBI patients in whom
TBI, the mechanisms underlying chronic post-TBI imbalance           there was no inner ear dysfunction, along with laboratory as-
and vestibular functioning in general are poorly understood,        sessment of balance function. Our general hypothesis linking
with one large study unable to identify any specific cause in       vestibular agnosia and imbalance was simply that reduced
25% of chronic TBI patients (Hoffer et al., 2007).                  vestibular signalling at cerebral cortical level would manifest
   One reason for a relative lack of understanding of imbal-        both in a vestibular agnosia as well as imbalance (given the
ance in TBI is that there are no acute prospective studies          cortical dominance of postural control in humans). An add-
(mechanistic or otherwise) assessing vestibular dysfunction         itional question was whether there are cortical regions that
in acute TBI. There has been one cross-sectional study              colocalise the functions of vestibular perception and vestibu-
assessing instrumented measures of balance, in the subacute         lar-mediated balance control, which is of potential interest to
stage (Klima et al., 2019) confirming manifest imbalance in         the understanding of the brain’s control of balance, since bal-
subacute TBI. We also recently reported two separate cross-         ance control mechanisms in humans are poorly understood,
sectional clinical studies in ambulant acute TBI patients; one      particularly compared to that in quadrupeds.
showing that 62% were unbalanced (Marcus et al., 2019) of              The bedside observation of a loss of vertigo sensation in
whom half did not report feeling unbalanced, and the other          patients with preserved inner ear functioning (vestibular ag-
(Sargeant et al., 2018), confirming the lack of correlation be-     nosia) has received scant attention but has hitherto been
tween objective signs of imbalance and vestibular symptom           only empirically reported in elderly patients, typically with
scores.                                                             cerebral small vessel disease (Seemungal, 2005; Imbaud
   Another common diagnosis in acute TBI patients is benign         Genieys, 2007; Chiarovano et al., 2016). Conversely, pro-
paroxysmal positional vertigo (BPPV), affecting 40% of             spective laboratory assessment in acute (within 2 weeks),
cases in our acute cross-sectional series (Marcus et al.,           focal stroke patients (Kaski et al., 2016), found no evidence
2019). Consistent with our documented observation of a dis-         of a vestibular agnosia. The mechanism linking vestibular
sociation between objective and subjective features of ves-         agnosia with elderly small vessel disease and young patients
tibular dysfunction in acute TBI (Sargeant et al., 2018;            with acute TBI may relate to the hypothesis that the vestibu-
Marcus et al., 2019), we noted several acute TBI patients           lar sensation of self-motion is mediated by a distributed cor-
who denied vertigo sensation despite an obvious vestibular          tical network (Seemungal, 2014; Nigmatullina et al., 2015)
ocular reflex (VOR) response (e.g. during the positional            that becomes disconnected, potentially explaining why acute
manoeuvre used to diagnose BPPV), i.e. a loss of the vestibu-       TBI cases may be susceptible to vestibular agnosia since this
lar perception of self-motion or ‘vestibular agnosia’               patient group exhibit cognitive deficits that often relate to
(Supplementary Video 1). Our empirical observation in               the disruption of cortical networks (Ham and Sharp, 2012).
acute TBI patients on the major trauma ward suggested that             Given our aim to link vestibular agnosia with imbalance
those patients with a clinically apparent vestibular agnosia        both behaviourally and by neuroanatomical substrate, we
(i.e. a vestibular agnosia that is sufficiently severe to be vis-   therefore prospectively screened patients admitted to a major
ible on bedside testing as seen in the above clinical video),       trauma ward eligible for recruitment, and in whom we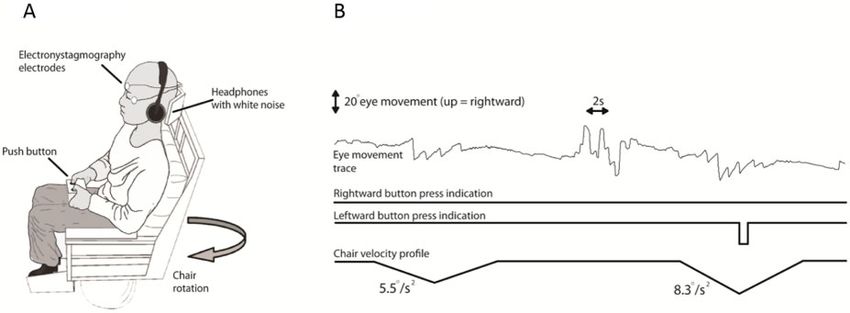
130   | BRAIN 2021: 144; 128–143                                                                                         E. Calzolari et al.

assessed: (i) VOR and vestibular-perceptual thresholds                musculoskeletal condition impairing ability to balance; (iii) sub-
(Seemungal et al., 2004); (ii) posturography; and (iii)               stance abuse history; (iv) pregnancy; and (v) inability to obtain
patients’ whole brain white matter microstructure with diffu-         consent or assent.
sion tensor imaging (DTI) via fractional anisotropy (FA) and             Thirty-seven matched healthy controls were recruited follow-
mean diffusivity (MD), and then correlated DTI parameters             ing written informed consent. The study was conducted in ac-
                                                                      cordance with the principles of the Declaration of Helsinki and
with our behavioural parameters of interest (vestibular-mo-
                                                                      was approved by the local Research Ethics Committee.
tion perceptual thresholds, and posturography).
   Finally, given our prospective screening of all acute TBI
cases presenting to the major trauma ward, we could also              Procedure
assess whether clinically apparent vestibular agnosia affected        All participants completed assessment of peripheral and reflex
referral patterns to our clinical ‘dizzy’ service from clinicians     vestibular function, vestibular perceptual testing, reaction times,
managing acute TBI patients. Hence a secondary more clin-             posturography, and neuroimaging. Patients additionally were
ically related hypothesis was that clinically apparent vestibu-       assessed with symptom questionnaires assessing perceived dizzi-
                                                                      ness and imbalance, and a cognitive battery (Addenbrooke’s

                                                                                                                                               Downloaded from https://academic.oup.com/brain/article/144/1/128/6050089 by guest on 18 July 2021
lar agnosia masks symptoms and hence reduces the
likelihood of patients with vestibular diagnoses being                Cognitive Examination Revised, ACE-R) (Table 1).
referred for treatment. Thus, untreated inner ear disorders
could explain, at least in part, the empirical observation of         Clinical assessment on the acute
worse balance in vestibular agnosia cases.                            ward
   Thus using a combination of laboratory testing and com-
prehensive clinical screening facilitating clinical audit of          The clinical assessment of a patient with an acute TBI included
                                                                      a general physical and neurological examination, including a
acute TBI cases, we assessed our hypotheses that imbalance
                                                                      cognitive assessment and the patient’s capacity to understand
in acute TBI is due to: (i) specific damage to cortical circuits
                                                                      the process of informed consent. We also assessed patients for
that mediate imbalance may show neuroanatomical overlap               signs of peripheral vestibular loss. This included: (i) the doll’s
with circuits mediating vestibular agnosia; and (ii) an indir-        eyes and head impulse manoeuvre; (ii) assessing for nystagmus
ect effect of vestibular agnosia leading to the loss of clinical      in the primary position including via fundoscopy both with an
recognition, and hence a failure to treat common vestibular           without visual fixation; and (iii) fundoscopic examination whilst
diagnoses in acute TBI cases.                                         passively oscillating the head at 2 Hz to assess for the preserva-
                                                                      tion of the VOR in right- and leftward directions. Clinical as-
                                                                      sessment also included a general oculomotor exam and gait
Materials and methods                                                 assessment including assessing for the Romberg sign, tandem
                                                                      standing with eyes open and closed, each for 20 s and, checking
                                                                      for the number of mistakes during 10 tandem steps.
Participants and recruitment
Patients admitted to the St Mary’s Hospital Major Trauma              Laboratory assessment of
Centre (London, UK) were systematically screened twice weekly
via consultant-led ward rounds for inclusion into our study.          peripheral and reflex vestibular
Importantly, the criteria for inclusion did not include complaints    function
of vestibular dysfunction, but the main inclusion criterion (see
below for the complete inclusion/exclusion criteria) was that the     To exclude end-organ dysfunction as a cause for impaired ves-
patient had sustained a blunt head injury requiring admission to      tibular perception, all participants had VOR assessment
the major trauma ward. Patients were also assessed following          (Table 2). Testing included video head impulse testing and rota-
referral by admitting clinicians (neurosurgery, emergency medi-       tional chair testing with eye movement assessment of VOR gain
cine and neuro-physiotherapy) for imbalance and/or dizziness.         for the stopping response from 90 /s constant rotation. We also
Patient recruitment occurred between August 2017 and January          recorded VOR gain for whole body oscillations in the dark be-
2020, with the first 9 months clinically audited. Acute TBI           tween 0.1 Hz to 0.4 Hz (not reported here). The laboratory
patients were also recruited from King’s College Hospital in the      measures (Table 2) were within the normal limits for all patients
final 6 months. Patients without capacity were recruited via a        included in the study.
consultee and informed patient consent obtained at a subse-
quent follow-up. Before testing, and typically whilst patients        Vestibular perceptual and vestibular
were on the ward, any BPPV was treated by repositioning
manoeuvres, and residual migraine-phenotype headaches treated
                                                                      ocular reflex thresholds
medically with 3–5 days of naproxen and prochlorperazine.             Figure 1 shows the apparatus and method used to objectively
Hence, on the day of laboratory testing, patients were free of ac-    quantify vestibular perception of self-motion during passive,
tive vestibular problems due to BPPV or migraine.                     yaw-plane, whole-body rotations in darkness (Seemungal et al.,
   Inclusion criteria were: (i) blunt head injury resulting in ad-    2004). This task requires: (i) preserved peripheral vestibular func-
mission to the major trauma ward; (ii) age 18–65; and (iii) pre-      tion indicated by evoked VOR nystagmus whose threshold is
served peripheral vestibular function. Exclusion criteria were: (i)   indicated by the angular velocity at which it was first observed;
additional active pre-morbid medical, neurological, or psychi-        and (ii) the cognitive ability to perceive this vestibular-mediated
atric condition (unless inactive or controlled); (ii)                 signal of self-motion (Seemungal et al., 2004). Participants sat on
Vestibular agnosia BRAIN 2021: 144; 128–143 | 131
Table 1 Demographic and clinical details of patients tested
Pt Gender: GCS MOI Days PTA, Severity CT brain Skull DAI on BPPV ACE-R
Age from days MAYO lesions fracture MRI
injury
01 M : 65 12 RTA 9 9 Mod-Sev R, L SDH, SAH + – + 82
02 M : 22 14 RTA 7 7 Mod-Sev R, L SDH + – + 77
03 M : 49 14 Fall 14 6b Mod-Sev R, L SDH, SAH + + + 80
04 F : 48 15 RTA 2 0 Mod-Sev L SAH – – – 77
05 F : 41 14 RTA 3 0 Mild-Prob None – – + 97
06 M : 40 13 Fall 20 20 Mod-Sev R, L SDH, SAH + – – 51
07 F : 43 15 RTA 12 0 Mild-Prob No deficit – – – 100
08 M : 23 13 Assault 10 0 Mod-Sev R, L SDH, SAH + + – 78
09 F : 54 15 RTA 5 0 Mod-Sev R SDH – – – 90
10 F : 59 14 Fall 2 0 Mod-Sev R, L SDH – + + 76
Downloaded from https://academic.oup.com/brain/article/144/1/128/6050089 by guest on 18 July 2021
11 M : 65 14 Fall 21 13 Mod-Sev R SDH, L SAH + – – 76
12 M : 37 14 RTA 11 20 Mod-Sev None + + – 67
13 F : 62 15 Fall 13 0 Mild-Prob None – – + 99
14 M : 40 15 Fall 4 0 Mod-Sev R SAH + – + 96
15 M : 35 15 RTA 15 0 Mod-Sev R, L SAH + + + 86
16 M : 26 15 Fall 2 0 Mod-Sev None + – – 83
17 M : 58 15 Fall 6 0 Mod-Sev L SAH – + + 90
18 M : 42 15 RTA 7 0 Mod-Sev R, L SDH, SAH + + – 86
19 M : 30 15 Fall 11 0 Mod-Sev None – – + 100
20 M : 43 14 Fall 17 0 Mod-Sev R, L SAH + – – 94
21 F : 60 15 Fall 4 0 Mod-Sev R, L SDH, SAH + – – 96
22 M : 47 15 Fall 12 0 Mod-Sev L SDH, SAH – – – 98
23 M : 49 14 Fall 19 10 Mod-Sev R, L SDH, SAH + – + 93
24 M : 41 13 RTA 19 20 Mod-Sev R, L SDH, SAH – – – 70
25 M : 47 15 Fall 15 12 Mod-Sev R, L SDH + – + 95
26 F : 34 14 Fall 34 31 Mod-Sev R, L SDH, SAH + – + 69
27 M : 24 8 Assault 20 9 Mod-Sev R, L SDH, SAH + + – 93
28 F : 33 14 RTA 10 12 Mod-Sev R SDH, SAH – – – 65
29 F : 40 13 Fall 33 0 Mod-Sev L SDH, SAH + + – 90
30 M : 56 14 Fall 15 0 Mod-Sev R, L SDH – – + 94
31 M : 39 15 Fall 29 0 Mod-Sev R, L SDH, SAH + + + 99
32 M : 18 15 RTA 16 9b Mod-Sev None – + – 77
33 M : 34 3a Assault 28 24b Mod-Sev R, L SDH + – – 89
34 M : 48 14 Fall 14 14b Mod-Sev R, L SDH, SAH + – + 100
35 M : 59 15 Fall 22 0 Mild-Prob None – + + 90
36 M : 36 12 RTA 77 61b Mod-Sev L SDH, SAH + – + np
37 F : 20 15 RTA 24 12 Mod-Sev R, L SDH, SAH + + – 84
+ /– = present/absent; ACE-R = The Addenbrooke’s Cognitive Examination Revised; DAI = diffuse axonal injury; GCS = Glasgow Coma Scale (in Accident and Emergency);
L = left; Mod/Sev/Prob = moderate/severe/probable; MOI = mechanism of injury; np = not performed; PTA = post traumatic amnesia; R = right; RTA = road traffic accident; SAH
= subarachnoid haemorrhage; SDH = subdural haemorrhage.
a
Actual GSC unattainable as the patient was intubated at scene.
b
Estimated minimum.
a rotating chair in total darkness and were instructed to press a vestibular perceptual threshold. Therefore, all participants per-
button (right or left) as soon as they perceived their movement formed a visual reaction time task to control for this confound.
and its direction (Fig. 1A and B). After each rotation, the lights Participants were required to press a ‘right’ or ‘left’ button as
were turned on to allow post-rotatory vestibular effects to decay. quickly as possible and in congruent fashion, to a right or left
White noise via earphones masked auditory cues. All participants pointing arrow that appeared on a PC screen (see Supplementary
were also tested with a modified threshold technique to ensure material for details). Mean reaction times were measured from
consistent results for VOR thresholds as explained further in the stimulus onset to the time of a correct button press.
Supplementary material.
Posturography
Reaction time and vigilance Postural sway using a force platform (further details in the
Slowed reaction times and impaired vigilance, common after TBI Supplementary material) was measured under four conditions
(Bonnelle et al., 2011), could result in a spuriously elevated each of 60-s duration: hard surface with eyes open, hard surface132 | BRAIN 2021: 144; 128–143 E. Calzolari et al.
Table 2 Peripheral and reflex vestibular function of patients
vHIT Caloric 90 /s rotation gain
Patient Asymmetry L gain R gain RC SPV LC SPV R - rot L - rot R - stop L- stop
01a 4%b 1.29 1.21 – – 0.94 0.96 0.64 0.60
02a 6%b 0.96 1.09 – – 0.57 0.56 0.45 0.43
03a – – – 64 /s –80 /s 1.02 1.02 0.58 0.40
04a 4%b,c 0.84 0.91 – – 0.61c 0.62c 0.47c 0.50c
05 – – – – – 0.71 0.58 0.51 0.50
06a 3%b,c 1.02 1.09 – – 1.01c 0.72c 0.48c 0.50c
07 4%d 0.89 0.93 – – 0.74 0.78 0.54 0.48
08a 2%d 0.91 0.93 – –
09 1%d 0.97 0.98 – – 0.66 0.71 0.52 0.61
10a 4%d 1.00 0.96 – – 0.76 0.61 0.47 0.54
Downloaded from https://academic.oup.com/brain/article/144/1/128/6050089 by guest on 18 July 2021
11a 2%b 0.78 0.81 – – 0.78 0.61 0.58 0.55
12a 13%d 0.82 0.71 – – 0.64c 0.63c 0.60c 0.63c
13 3%d 1.15 1.18 – – 0.59 0.55 0.51 0.48
14 – – – 47 /s –38 /s 0.55 0.54 0.54 0.54
15 1%b,e 1.11 1.09 – – 0.70e 0.53e 0.45e 0.44e
16 3%b 1.27 1.34 – – 0.77 0.62 0.61 0.62
17 2%b 1.23 1.28 – – 1.02 0.91 1.08 1.08
18a 2%b 0.88 0.92 – – 0.98 0.86 0.82 0.79
19 – – – – – 0.66 0.67 0.65 0.67
20a 5%b 0.98 1.09 – – 0.89 0.71 0.72 0.68
21 6%b 1.10 0.90 – – 0.63 0.58 0.54 0.52
22 6%b 0.89 1.00 – – 0.71 0.59 0.55 0.64
23a 3%b 1.14 1.07 – – 0.81 0.88 0.68 0.61
24a 3%b 0.97 1.03 – – 0.66e 0.80e 0.44e 0.38e
25 6%b 1.11 0.98 – – 0.75 0.67 0.58 0.53
26 – – – – – 0.71 0.85 0.83 0.74
27 7%b 1.44 1.25 – – 0.38 0.66 0.30 0.29
28 4%b 0.96 1.04 – – 0.74 0.72 0.41 0.45
29 10%b 1.32 1.08 – – 0.27 0.34 0.31 0.36
30 7%b 0.93 1.06 – – 0.55 0.53 0.50 0.40
31 7%b 0.84 0.96 – – 0.63 0.63 0.66 0.67
32 9%b 1.12 0.93 – – 0.88 0.90 0.64 0.69
33a 2%b 1.05 1.10 – – 0.63 0.79 0.57 0.75
34 6%b 0.98 1.10 – – 0.87 0.86 0.82 0.82
35 2%b 1.07 1.12 – – 0.75 0.80 0.71 0.64
36a 3%b 1.31 1.23 – – 0.98 0.92 0.86 0.87
37 – – – – – 1.01 0.89 0.76 0.76
To rule out the presence of peripheral vestibular deficit, participants underwent VOR assessment via video head impulse test, or via other VOR assessment techniques appropriate
for the patient’s clinical findings (e.g. bithermal caloric irrigation or electronystagmography with rotational chair testing was performed if a video head impulse test was not possible
due to neck injury). The assessment was performed according to the standard clinical procedures of the Vestibular Neurology laboratory (Charing Cross Hospital, Imperial College
London NHS Trust). L = left; LC = left canal; R = right; RC = right canal; SPV = slow phase velocity; vHIT = video head impulse test. A dash indicates where the test was not com-
pleted, or adequate recordings obtained.
a
Elevated vestibular perceptual thresholds.
b
Interacoustic.
c
Examination performed at follow-up 3 months.
d
Otometrics.
e
Examination performed at follow-up 6 months.
with eyes closed, soft surface with eyes open and soft surface was calculated for each condition, and expressed in square
with eyes closed, in counterbalanced order (Latin square). millimetres. The four conditions varied in sensory feedback. In
Participants stood on a soft rectangular foam pad (50 41 6 the hard surface-eyes open condition, visual, proprioceptive and
R
cm, AirexV) for the soft conditions. Participants were required vestibular input were available for use in postural control. In
to stand with their arms hanging loosely by their sides, and the hard surface-eyes closed condition, only proprioception and
heels 8-cm apart, and told to maintain their balance as best they vestibular input was available. The soft surface conditions
could. For security, participants wore a chest harness secured to impaired proprioceptive input, thus the soft surface-eyes open
the ceiling. The area of the 95% bivariate confidence ellipse, condition, used primarily visual and vestibular input, and the
which encloses 95% of the points on the centre of pressure path soft surface-eyes closed condition was primarily vestibular-
along the anteroposterior and mediolateral planes combined, dependent.Vestibular agnosia BRAIN 2021: 144; 128–143 | 133
Downloaded from https://academic.oup.com/brain/article/144/1/128/6050089 by guest on 18 July 2021
Figure 1 Vestibular thresholds. Apparatus and methods. (A) Participants sat on a computer-controlled rotating chair (earth-vertical axis).
Horizontal eye movements were recorded with electro-nystagmography. Participants indicated their perceived direction of motion by pressing a
button to indicate leftward or rightward motion. White noise was delivered through earphones. (B) Raw traces for two subsequent rotations
for Patient 08. The top trace shows the electro-nystagmography signal. The middle and bottom traces show the patient’s button press to indicate
perceived motion direction, right and left. In this example, the chair rotated from rest to the left, at constant acceleration. The chair continues to
accelerate until a correct button response is made or if 5 s has elapsed without a correct button press, or no button press, as here. As no re-
sponse was made during the test period over 5 s, the chair underwent a controlled deceleration to a stop over 5 s. The second rotation, here
also to the left (the rotation directions are randomized), was of increased angular acceleration as determined by the Modified Binary Search
(MOBS) algorithm (Tyrrell and Owens, 1988; see Supplementary material for further details). In general, for a given direction (left versus right), a
non-perceived rotation is followed by a rotation of higher acceleration, while a perceived rotation is followed by a lower acceleration rotation.
Further detail on how the test terminates, and hence thresholds obtained for left and right rotations, can be found in the Supplementary
material.
Dizziness Handicap Inventory and Statistical analysis
Activity-Specific Balance Confidence Vestibular-perceptual and vestibular-ocular
Scale thresholds
A repeated-measures ANOVA tested the differences between
Acute TBI patients completed two questionnaires estimating patients and healthy controls for vestibular-ocular versus ves-
their perceived disability caused by vertigo sensations [Dizziness tibular-perceptual thresholds, expressed in angular velocity ( /s).
Handicap Inventory (DHI); Jacobson and Newman, 1990], and Patients were classified as having vestibular agnosia if their ves-
confidence in their balance [Activity-Specific Balance Confidence tibular-perceptual thresholds were 3 standard deviations (SD)
Scale (ABC); Powell and Myers, 1995]. above the controls’ average.
Reaction times
Reaction time differences (s) of patients versus controls were
tested using univariate ANOVA, reaction times of patients with
and without vestibular agnosia were tested using an independent
Clinical audit of benign paroxysmal sample t-test.
positional vertigo and patient Posturography
referral source Differences in sway area (see above for detail) expressed in
square millimetres, in the four conditions, between acute TBI
From the initiation of the study in August 2017 to May 2018 (a with vestibular agnosia, without vestibular agnosia and controls
9-month period) we prospectively audited the presence or ab- were tested with a repeated measures ANOVA. Patients were
sence of BPPV in the patients we assessed. We noted whether classified as balance impaired if their average sway in the ves-
the patient had been referred to our clinical vestibular referral tibular-mediated condition (soft surface-eyes closed) was 3 SD
service by the therapy team, or if the BPPV was picked up by above the controls’ average.
our screening approach. We asked patients if they felt dizzy dur-
ing a BPPV-evoked positional nystagmus. We specifically asked: Dizziness Handicap Inventory and Activity-Specific
Do you feel dizzy, yes or no? If yes, is it a severe, moderate or Balance Confidence Scale
mild feeling of movement? Patients who answered no to ‘are Differences in dizziness symptoms between TBI patients with
you dizzy?’ were classified as having a clinically apparent ves- and without vestibular agnosia were tested via independent sam-
tibular agnosia. ple t-test. Linear correlations assessed whether dizziness134 | BRAIN 2021: 144; 128–143 E. Calzolari et al.
symptom scores (DHI) predicted vestibular-perceptual thresh- material. Raw data that support the findings of this study are
olds and whether the balance confidence (ABC) score predicted available from the corresponding author, upon reasonable
objective balance via posturography. Differences in balance con- request.
fidence between groups were tested via independent sample t-
test.
For all analyses, the alpha-level was set at 0.05. Differences in Results
the means for the significant effects and interactions were
We screened 918 patients via the medical notes, clinically
explored with Bonferroni post hoc correction. To quantify the
assessed 146 and recruited 37 acute TBI patients. Table 1
magnitude of the effects we report, we provide partial eta
squared (gp2) values for F-tests. shows patients’ demographics and clinical measures includ-
ing the Mayo TBI severity classification (Malec et al., 2007).
Table 2 shows assessments of reflex vestibular function. We
Neuroimaging also tested 37 age matched healthy controls (mean ± SD:
In a previous study we found that acute, unilateral hemispheric 40.8 ± 15 years, 21 females).
stroke did not cause vestibular agnosia (Kaski et al., 2016). In The 146 patients were composed of patients who poten-
Downloaded from https://academic.oup.com/brain/article/144/1/128/6050089 by guest on 18 July 2021
our current acute TBI cohort, some of the patients with severe tially met our inclusion/exclusion criteria, as well as some
vestibular agnosia had no observable contusions on structural patients who potentially did not meet our criteria but who
neuroimaging on admission (CT and MRI; see the we were asked to review by the therapy team for imbalance
Supplementary material for link to all images), obviating a le-
and/or dizziness. From this core group of patients, we then
sion-mapping approach. We therefore investigated differences in
aimed to recruit only those patients who fulfilled our selec-
white matter microstructure in a group of acute patients with
TBI and an age-matched control group. tion criteria. Of the 146 patients we assessed, the two com-
monest reasons for non-recruitment were: (i) unwillingness
White matter structural imaging or inability to obtain consent or assent, including because of
DTI sequences were acquired on a 3 T Siemens Verio (Siemens) language barriers or no identifiable next of kin (22%); and
scanner, using a 32-channel head coil. Diffusion-weighted vol- (ii) medically unstable, obviating laboratory assessment
umes were acquired using a 64-direction protocol: 64 slices, in- (14%). Signs of an acute unilateral peripheral vestibular loss
plane resolution = 2 2 mm, slice thickness = 2 mm, field of (see ‘Clinical assessment’ section) was found on bedside
view = 256 256 mm, matrix size = 128 128 (voxel size = examination in 7% of assessed patients. A full list of the rea-
2 2 2 mm3), repetition time = 9500 ms, echo time = 103 sons for non-recruitment in examined cases is given in
ms, b-value = 1000 s/mm2. Four images with no diffusion Supplementary Table 1.
weighting were also acquired (b-value = 0 s/mm2). DTI images
We recruited 37 acute TBI patients in total for whom all
were then preprocessed and analysed according to a pipeline
behavioural and MRI data were acquired in the acute phase.
used previously in the group, in order to obtain FA and MD
maps. Detailed information about DTI preprocessing (Smith, We only used 30 patients in our MRI analysis since after the
2002; Behrens et al., 2003; Smith et al., 2004; Woolrich et al., first seven MRI scans were performed, we began to use a
2009) and data analysis pipeline (Nichols and Holmes, 2002; different scanner for logistical reasons (scanner access) and
Smith et al., 2004, 2006; Smith and Nichols, 2009), can be hence, to avoid difficulties of comparing results between
found in the Supplementary material. In general, after TBI, FA scanners, we only analysed MRI data for 30 patients. We
decreases and MD increases relative to control values recruited 37 matched controls who had behavioural and
(Kinnunen et al., 2011). MRI scan data acquired except for one control who did not
We first compared FA and MD values between two groups: have an MRI. We were not able to perform this because of
(i) controls; and (ii) acute TBI patients, with whole brain voxel- the COVID19 pandemic; hence, we analysed 36 control
wise analysis. MRI scans.
Using our criteria to classify patients as having impaired or
preserved balance (described above), we assessed a voxel-wise
whole brain analysis, with a three-level between-group factor, Laboratory testing
i.e. (i) controls; (ii) impaired balance acute TBI; and (iii) pre- Vestibular threshold testing: vestibular agnosia in
served balance acute TBI. acute traumatic brain injury
Using our criteria to classify TBI patients as with/without ves-
Figure 2A shows the elevated vestibular-perceptual thresh-
tibular agnosia (described above), we ran a voxel-wise whole
brain analysis with a three-level between-groups factor: (i) con- olds in acute TBI. An ANOVA showed a significant main ef-
trols; (ii) TBI patients with vestibular agnosia; and (iii) TBI fect of: (i) threshold [F(1,68) = 30.25, P 5 0.001; gp2 =
patients without vestibular agnosia. 0.31]; (ii) group [F(1,68) = 14.56, P 5 0.001; gp2 = 0.18];
We also correlated vestibular-mediated posturography, ves- and (iii) their interaction [F(1,68) = 13.40, P 5 0.001; gp2
tibular-perceptual thresholds, and vestibular-ocular reflex = 0.16]. Post hoc comparisons showed that patients’ vestibu-
thresholds with FA and MD values. lar-perceptual thresholds (12.92 ± 14.14 /s) were higher
(P 5 0.001) than the vestibular-ocular thresholds
Data availability (2.52 ± 2.03 /s). Controls’ perceptual (3.87 ± 2.13 /s) and
The authors confirm that the data supporting the findings of vestibular-ocular (1.78 ± 1.49 /s) thresholds were not differ-
this study are available within the article and its Supplementary ent (P = 0.19). Although vestibular-ocular thresholds wereVestibular agnosia BRAIN 2021: 144; 128–143 | 135
Downloaded from https://academic.oup.com/brain/article/144/1/128/6050089 by guest on 18 July 2021
Figure 2 Vestibular threshold testing. (A) Vestibular agnosia in acute TBI. Vestibular-ocular (left) and vestibular-perceptual (right) thresholds
to angular acceleration, in healthy controls (dark red) and acute TBI patients (light pink): the acceleration thresholds are displayed in terms of the
equivalent instantaneous angular velocity at the time of the threshold detection. Vestibular-ocular thresholds (expressed in degrees per second),
correspond to the minimum angular velocity needed to elicit a vestibular-ocular response (first slow-phase of a nystagmus with minimum of two
slow and fast phase components). Perceptual thresholds (expressed in degrees per second), correspond to the minimum angular velocity needed
to induce the perception of self-motion in the correct direction as assessed by the MOBS procedure. (B) Imbalance in acute TBI assessed via pos-
turography. Sway expressed in square millimetres as the area of the 95% bivariate confidence ellipse of the total displacement of the centre of
pressure, in the four posturography conditions (HO = hard surface with eyes open; HC = hard surface with eyes closed; SO = soft surface with
eyes open; SC = soft surface with eyes closed), in controls (light blue), acute TBI patients without vestibular agnosia (VA-, grey), and acute TBI
patients with vestibular agnosia (VA + , blue). ns = not significant. *P 5 0.05; **P 5 0.01; ***P 5 0.001. (C) Clinically apparent vestibular agnosia
masks the presence of BPPV in acute TBI. Left: Patients with BPPV, diagnosed after being referred by the ward clinical staff (n = 14). Right: Patients
with BPPV, who were not referred by the ward clinical staff, but diagnosed by our systematic screening on the trauma ward (n = 16). The dark
red sectors represent the proportions of patients who reported dizziness during manoeuvres, i.e. they did not have vestibular agnosia. The light
pink sectors represent the patients with vestibular agnosia, i.e. they denied dizziness on direct questioning, during manoeuvres that triggered a
vestibular nystagmus indicative of BPPV.
marginally elevated in the acute TBI group (P = 0.08; above the control group average (to ensure clear demarca-
Fig. 2A), acute TBI patients’ vestibular-perceptual thresholds tion between impaired and non-impaired patients), 15 of 37
were dramatically elevated compared to controls patients with acute TBI had a vestibular agnosia.
(P 5 0.001; Fig. 2A) (similar results were obtained in a pilot
study whose data are reported in the Supplementary mater- Reaction time testing, cognitive scores and
ial). A perceptual threshold above 10.26 /s (3 SDs above the vestibular agnosia
controls’ mean vestibular-perceptual threshold) indicated the Patients were significantly slower than controls in the visual
patient was classified as having a vestibular agnosia, versus reaction time task, albeit by only 0.05 s [acute TBI
those with a value below 10.26 /s classified as not having 0.41 ± 0.08 s versus controls 0.36 ± 0.06 s; F(1,62) = 10.37,
vestibular agnosia. Using a conservative value of 3 SDs P 5 0.01; gp2 = 0.14], consistent with previous findings in136 | BRAIN 2021: 144; 128–143 E. Calzolari et al.
TBI patients (Bonnelle et al., 2011). Notably, reaction times The impact of vestibular agnosia upon clinical
were not different between TBI patients with and without recognition of benign paroxysmal positional vertigo
vestibular agnosia [0.44 ± 0.09 s versus 0.40 ± 0.07 s; t(28) = Between 30 August 2017 and 15 May 2018, 67 patients
1.14, P = 0.26]. Overall, these findings show that slower re- were clinically assessed either for inclusion in the study or
action times are insufficient to explain elevated vestibular- were clinically assessed following referral to the clinical ves-
perceptual thresholds in TBI patients with vestibular tibular team from the ward therapists. Of these 67 patients,
agnosia. 30 had BPPV (45%), (Fig. 2C). Of these BPPV cases, a third
Although we found modest albeit significant correlations had an attenuated vertigo perception (i.e. a vestibular agno-
between vestibular perceptual threshold values and three sia) during diagnostic or treatment manoeuvres
ACE-R subscale scores (attention r = –0.39, P = 0.018; flu- (Supplementary Video 1). Of the 30 patients (of 67) with
ency r = –0.373, P = 0.025; language r = –0.367, BPPV, 16 were diagnosed by our screening process and 14
P = 0.028), none survived correction for multiple were referred for dizziness or imbalance by the therapy
comparisons. team. Only 7% of BPPV cases referred to us by the thera-
Downloaded from https://academic.oup.com/brain/article/144/1/128/6050089 by guest on 18 July 2021
pists had a clinically apparent vestibular agnosia, whereas,
of BPPV cases we diagnosed by screening, 50% had a clinic-
Imbalance in acute traumatic brain injury assessed ally apparent vestibular agnosia (Fig. 2C). Thus, vestibular
via posturography agnosia reduces the probability of BPPV being identified by
clinical staff (v2 = 6.53, df = 1, P 5 0.02).
Figure 2B shows that TBI patients with vestibular agnosia
were more unstable than controls in all conditions, while Vestibular thresholds and posturography in patients
TBI patients without vestibular agnosia were more unstable with and without benign paroxysmal positional
than controls only in the vestibular-mediated condition (soft vertigo
surface with eyes closed). Moreover, TBI patients with ves- Patients with BPPV compared to those without, did not
tibular agnosia were more unstable than those without ves- show any significant differences (i.e. P 4 0.05; two-tailed t-
tibular agnosia on both soft surface conditions. Specifically, tests) in vestibular perceptual thresholds [t(35) = 0.16,
the ANOVA showed a significant effect of condition P = 0.87], VOR thresholds [t(32) = –0.15, P = 0.88] or pos-
[F(3,213) = 137.43, P 5 0.001; gp2 = 0.66], of group tural sway [t(35) = –1.11, P = 0.27], indicating that a BPPV
[F(2,71) = 15.94, P 5 0.001; gp2 = 0.31] and of the inter- diagnosis, which was treated prior to any testing, had no
action condition by group [F(6,213) = 16.04, P 5 0.001; functional impact on reflex or perceptual vestibular meas-
gp2 = 0.31]. ures nor postural stability.
The link between vestibular symptoms and
Neuroimaging
objective deficit in acute traumatic brain injury DTI comparison between all patients and controls
Acute TBI patients with and without vestibular agnosia A voxel-wise whole brain comparison showed significantly
reported moderate dizziness symptoms, with DHI scores of lower FA in acute TBI patients (n = 30) compared to con-
22.53 ± 17.05 for TBI patients with vestibular agnosia and trols (n = 36) in a widespread bilateral network (detailed in
29.73 ± 22.49 for those without vestibular agnosia. Fig. 3A and Table 3). Areas of significantly higher MD were
Importantly, the DHI did not differ between TBI patients also found, albeit in a less extensive network.
with and without vestibular agnosia [t(35) = –1.05,
Comparing white matter microstructure between
P = 0.30], and DHI scores did not correlate with vestibular-
groups according to balance performance
perceptual thresholds in acute TBI (r = –0.16, P = 0.33).
A voxel-wise whole brain analysis with a three-level be-
Similarly, the ABC scale, did not discriminate between
tween-group factor (controls, acute TBI impaired balance,
patients with objectively impaired balance (via posturogra-
acute TBI preserved balance), showed that acute TBI
phy) versus those with preserved balance [ABC scores for
patients with impaired balance (n = 11) displayed significant-
impaired versus preserved balance: 77.19 ± 17.28 versus
ly lower FA and significantly higher MD compared to acute
72.91 ± 23.81; t(32) = 0.51, P = 0.61]. The ABC score was
TBI patients with preserved vestibular-mediated balance
not correlated with posturography performance in the ves- (n = 19) in a left anterior network comprising the genu of
tibular-mediated condition (r = –0.05, P = 0.80). These data the corpus callosum, the left anterior corona radiata, and
confirm our earlier reports (Sargeant et al., 2018; Marcus the left external capsule (Fig. 3B and Table 3). See Table 3
et al., 2019) that symptoms and signs are typically for other significant contrasts.
uncoupled in patients with acute TBI. Thus acute TBI
patients with signs of an active peripheral vestibular condi- Correlating balance with DTI parameters
tion (e.g. BPPV) may have no vertigo, and conversely, those Vestibular-mediated balance performance (i.e. soft surface-
with overt imbalance on examination may not complain of eyes closed condition) was negatively correlated with FA val-
imbalance. ues across all participants (acute TBI and controls together)Vestibular agnosia BRAIN 2021: 144; 128–143 | 137
Downloaded from https://academic.oup.com/brain/article/144/1/128/6050089 by guest on 18 July 2021
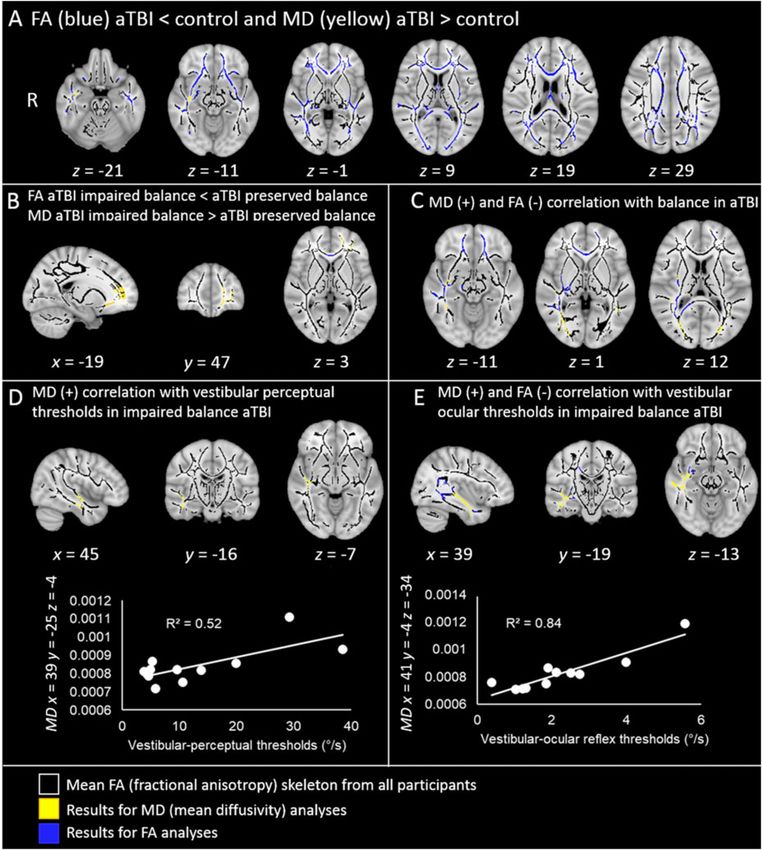
Figure 3 Widespread white matter disruption following TBI and correlations with behavioural measures. All contrasts are over-
laid upon a standard MNI 152 T1 1 mm brain atlas and the mean FA skeleton (black) with display thresholds set to range from 0.2 to 0.8. The
results of FA tract-based spatial statistics contrasts (blue) and the results of MD tract-based spatial statistics contrasts (yellow), are thresholded
at P 5 0.05, corrected for multiple comparisons. (A) Axial slices of the results of the FA contrast acute TBI 5 control (blue), and of the MD con-
trast between acute TBI 4 control groups (yellow). (B) Sagittal, coronal and axial slices of the results of the FA contrast between patients with
impaired balance 5 patients with preserved balance (blue), and of the MD contrast between patients with impaired balance 4 patients with pre-
served balance (yellow). (C) Axial slices of the results of the contrast where MD values positively correlate with balance performance (yellow),
and where FA values negatively correlate with balance performance in acute TBI patients (i.e. the higher the MD values, the more instability in
acute TBI; the lower the FA values, the more instability in acute TBI). (D) Top: Orthogonal view of the areas in the inferior longitudinal fasciculus
where patients with impaired balance (but not patients with preserved balance and controls) showed significant positive correlations between
MD and vestibular-perceptual thresholds (i.e. the higher the MD value, the more severe the vestibular agnosia, in acute TBI with impaired bal-
ance). Bottom: The plot shows the positive correlation between MD and vestibular-perceptual thresholds ( /s) in the significant voxel in the infer-
ior longitudinal fasciculus with the highest correlation with vestibular-perceptual thresholds (x = 39, y = –25, z = –4). (E) Top: Orthogonal view
of the areas where patients with impaired balance (but not patients with preserved balance and controls) showed significant correlations be-
tween vestibular-ocular reflex thresholds and MD (positive correlation, in yellow) and between vestibular-ocular thresholds and FA (negative cor-
relations, in blue). Bottom: For illustrative purposes, the plot shows the positive correlation between MD and vestibular-ocular reflex thresholds
( /s), in the voxel with the highest correlation with vestibular-ocular reflex thresholds (x = 41, y = –4, z = –34).138 | BRAIN 2021: 144; 128–143 E. Calzolari et al.
Table 3 Contrasts
Contrasts differences between groups (P peak voxel) Areas with significant Z-value threshold 0.05
**
FA aTBI 5 control (0.003) CC (genu, body, splenium); fornix (column, body); retrolenticular internal cap-
sule R, L; ant corona radiata R, L; sup corona radiata R, L; post corona radiata
R, L; post thalamic radiationa R, L; sagittal stratumb R, L; external capsule R, L;
cingulum (cingulate gyrus) R, L; fornix (cres) / stria terminalis R, L; sup long
fasc R, L; uncinate fasc R, L; tapetum R
MD aTBI 4 control* (0.04) Ant corona radiata L; sagittal stratumb R; external capsule R
Contrasts differences between subgroups
FA VA + 5 control* (0.02) CC (genu, body, splenium); ant limb internal capsule R; ant corona radiata R, L;
sup corona radiata R, L; post corona radiata R; post thalamic radiationa R; sa-
gittal stratumb R; external capsule R, L; fornix (cres) / stria terminalis R; sup
long fasc R, L; sup front-occ fasc R; uncinate fasc R
MD VA + 4 control* (0.03) Sagittal stratumb R
FA VA- 5 control* (0.02) CC (genu, body, splenium); ant corona radiata R, L; sup corona radiata R, L; post
Downloaded from https://academic.oup.com/brain/article/144/1/128/6050089 by guest on 18 July 2021
corona radiata L; sagittal stratumb R, L; external capsule R, L; cingulum (cingu-
late gyrus) L; sup long fasc R, L; uncinate fasc R, L
FA impaired balance aTBI 5 control** (0.001) CC (genu, body, splenium); fornix (column, body); cerebral peduncle R; ant limb
internal capsule L; post limb internal capsule R; retrolenticular internal capsule
R, L; ant corona radiata R, L; sup corona radiata R, L; post corona radiata R, L;
post thalamic radiationa R, L; sagittal stratumb R, L; external capsule R, L; cin-
gulum (cingulate gyrus) R; fornix (cres) / stria terminalis R, L; sup long fasc R,
L; uncinate fasc R, L; tapetum R
MD impaired balance aTBI 4 control** (0.008) CC (genu, body, splenium); ant limb internal capsule R, L; retrolenticular internal
capsule R, L; ant corona radiata R, L; sup corona radiata R, L; post corona radi-
ata R, L; post thalamic radiationa R, L; sagittal stratumb R, L; external capsule
R, L; fornix (cres) / stria terminalis R, L; sup long fasc R, L; sup front-occ fasc
R; uncinate fasc R, L; tapetum R, L
FA impaired balance aTBI 5 preserved balance aTBI* (0.04) CC (genu); ant corona radiata L
MD impaired balance aTBI 4 preserved balance aTBI* (0.03) CC (genu); ant corona radiata L; external capsule L
Whole brain correlation contrasts
Vestibular-mediated balance
All participants FA to balance (–)** (0.005) CC (genu, body, splenium); fornix (column, body); cerebral peduncle R, L; ant
limb internal capsule R; post limb internal capsule R, L; retrolenticular internal
capsule R, L; ant corona radiata R, L; sup corona radiata R, L; post corona radi-
ata R, L; post thalamic radiationa R, L; sagittal stratumb R, L; external capsule
R, L; cingulum (cingulate gyrus) R; fornix (cres) / stria terminalis R, L; sup long
fasc R, L; sup front-occ fasc R; uncinate fasc R; tapetum R, L
All participants MD to balance ( + )* (0.02) CC (genu, body, splenium); ant limb internal capsule R, L; retrolenticular internal
capsule R, L; ant corona radiata R, L; sup corona radiata R, L; post corona radi-
ata R, L; post thalamic radiationa R, L; sagittal stratumb R, L; external capsule
R, L; fornix (cres) / stria terminalis R, L; sup long fasc R, L; sup front-occ fasc
R; uncinate fasc R; tapetum R, L
aTBI FA to balance (–)* (0.04) CC (genu, body, splenium); cerebral peduncle R; post limb internal capsule R;
retrolenticular internal capsule R; ant corona radiata R, L; sup corona radiata
R; post corona radiata R; post thalamic radiationa R; sagittal stratumb R; exter-
nal capsule R; sup long fasc R; tapetum R
aTBI MD to balance ( + )* (0.04) CC (splenium); retrolenticular internal capsule R; sup corona radiata R; post cor-
ona radiata R, L; post thalamic radiationa R; sagittal stratumb R; external cap-
sule R; fornix (cres) / stria terminalis R; sup long fasc R, L
#
VA + MD to balance ( + ) (0.063) Post thalamic radiationa R; #sagittal stratumb R; #external capsule R
Vestibular-perceptual thresholds
All participants MD to VPT ( + )* (0.04) Sagittal stratumb R
$
Impaired balance aTBI FA to VPT (–) (0.07) Post thalamic radiationa R; $sagittal stratumb R
Impaired balance aTBI MD to VPT ( + )* (0.05) Sagittal stratumb R
Vestibular-ocular reflex thresholds
Impaired balance aTBI FA to VOR (–)* (0.02) CC (genu, body, splenium); ant limb internal capsule R; retrolenticular internal
capsule R; ant corona radiata R; sup corona radiata R; post corona radiata R;
post thalamic radiationa R; sagittal stratumb R; external capsule R; Fornix
(cres) / stria terminalis R; sup long fasc R; sup front-occ fasc R; uncinate fasc R
Impaired balance aTBI MD to VOR ( + )** (0.007) Retrolenticular internal capsule R; sagittal stratumb R; external capsule R
–/ + = negative/positive correlation contrast between DTI parameter and behavioural measure; ant = anterior; CC = corpus callosum; fasc = fasciculus; front-occ = fronto-occipi-
tal; L = left; long = longitudinal; post = posterior; R = right; sup = superior; VA + /– = patients with/without vestibular agnosia; VPT = vestibular-perceptual thresholds.
a
Post thalamic radiation, includes optic radiation.
b
Sagittal stratum, includes inferior longitudinal fasciculus and inferior front-occipital fasciculus.
*P 5 0.05.
**P 5 0.01.
#
Tendency, threshold set at 0.065.
$
Tendency, threshold set at 0.075.Vestibular agnosia BRAIN 2021: 144; 128–143 | 139
in a widespread bilateral white matter network (Table 3). in acute TBI patients, vestibular-mediated postural instabil-
Similar findings were found for increased MD albeit in a less ity, most prominent when standing in the dark and on an
extensive network (Table 3). uneven (or soft) surface, is mediated by damage to brain
These results were primarily driven by the acute TBI areas that are also involved in mediating the vestibular per-
group, such that when running the correlations with group ception of self-motion.
(acute TBI versus control) as a covariate, acute TBI patients
showed significant correlations between DTI and vestibular- Correlating vestibular-ocular reflex thresholds with
mediated sway performance (correlations were negative for DTI parameters
FA and positive for MD) in numerous, albeit predominantly In patients with impaired balance only, VOR thresholds cor-
right hemisphere, white matter tracts (Fig. 3C and Table 3), related negatively with FA and positively with MD in a right
whereas the control group alone showed no DTI-balance white matter network, which included voxels in the right in-
performance correlations for either MD or FA. ferior longitudinal fasciculus (Fig. 3E and Table 3) that par-
A voxel-wise whole brain correlation analysis with three- tially overlapped those that correlated with vestibular
level between-group covariate (controls, imbalanced and pre- perceptual thresholds (and again, only in impaired balance
Downloaded from https://academic.oup.com/brain/article/144/1/128/6050089 by guest on 18 July 2021
served balance patients) showed no significant correlations patients). No other correlations were found between FA and
between vestibular-mediated balance task and FA or MD in MD values and vestibular-ocular reflex in controls or
neither preserved or impaired balance patient group patients with preserved balance.
(Table 3).
When running a voxel-wise whole brain correlation ana-
lysis with three-level between-group covariate (controls, TBI Discussion
patients with and without vestibular agnosia), a trend to-
wards significance was found in TBI patients with vestibular Our main findings were: (i) the balance impairment in acute
agnosia when correlating DTI parameters (both MD and TBI is primarily of a vestibular-dependent pattern and the
FA) with vestibular-mediated sway performance (Table 3; degree of imbalance correlates with widespread bilateral and
MD, P-value in the peak voxel = 0.06; FA P-value in the predominantly frontal white matter microstructural parame-
peak voxel = 0.09). No such correlation was found for the ters on DTI; (ii) vestibular agnosia (the attenuation of ves-
TBI without vestibular agnosia patient group. These findings tibular sensation of self-motion, despite intact peripheral and
(Table 3) suggest that damage in the right posterior thalamic reflex vestibular function) is frequent in acute TBI patients,
radiation, right sagittal stratum, and right external capsule at least in our cohort, where one-third of cases were
are implicated in imbalance in vestibular agnosia patients. affected; (iii) acute TBI patients with vestibular agnosia were
more unbalanced than patients without vestibular agnosia;
Correlating vestibular perception with DTI (iv) in those patients with impaired balance, DTI metrics of
parameters and its link to imbalance white matter microstructure in the right inferior longitudinal
We correlated vestibular-perceptual thresholds in all patients fasciculus correlated with the degree of vestibular agnosia;
with DTI parameters (FA and MD; Table 3). This showed and (v) vestibular agnosia markedly reduces clinician aware-
that higher MD values (i.e. impaired white matter micro- ness of the presence of active balance disorders given that
structure) in the right inferior longitudinal fasciculus corre- acute TBI patients with BPPV were seven times less likely to
lated with higher vestibular perceptual thresholds (worse be referred for treatment if there was concurrent vestibular
performance) across all participants. Importantly, however, agnosia.
this correlation was driven by patients with impaired ves-
tibular mediated balance (sway in condition soft surface Imbalance in acute traumatic brain
with eyes closed, Fig. 2B). In fact, when running the correla-
tions with group as a covariate (controls, impaired and pre-
injury
served balance patients), only impaired balance patients Remarkably, this is the first prospective study to assess bal-
showed significant correlations between MD values in the ance and vestibular function in patients with acute TBI. We
right inferior longitudinal fasciculus and vestibular percep- confirm with laboratory analyses, our previous cross-section-
tual thresholds (Fig. 3D and Table 3). A trend towards sig- al clinical-bedside studies’ findings (Sargeant et al., 2018;
nificance in the same region was found when correlating Marcus et al., 2019) that postural imbalance in acute TBI is
vestibular perceptual thresholds and FA, but again only in both common (affecting over 80% of ambulant acute TBI
impaired balance patients (negative correlation, FA P-value patients) and displays a vestibular-dependent pattern. Our
in the peak voxel = 0.07). There were no correlations be- previous clinical report (Marcus et al., 2019) showed that
tween MD or FA and vestibular-perceptual thresholds in examination of acute TBI patients with intact peripheral ves-
controls or patients with preserved balance. Finally, no sig- tibular functioning, follows a pattern reported by Brandt in
nificant correlations with vestibular parameters (perception acute peripheral vestibulopathy patients (Brandt et al.,
or reflex) were found in the left inferior longitudinal fascic- 1999), i.e. patients were more stable walking than standing
ulus, confirming the right lateralized vestibular cortical rep- still. In our current acute TBI cohort, our data imply patients
resentation (Dieterich et al., 2003). This result suggests that, manifest a central vestibular ataxia.You can also read