Genetic diversity and population structure of Alternaria species from tomato and potato in North Carolina and Wisconsin
←
→
Page content transcription
If your browser does not render page correctly, please read the page content below
www.nature.com/scientificreports
OPEN Genetic diversity and population
structure of Alternaria species
from tomato and potato in North
Carolina and Wisconsin
Tika B. Adhikari1*, Norman Muzhinji2, Dennis Halterman3 & Frank J. Louws1,4*
Early blight (EB) caused by Alternaria linariae or Alternaria solani and leaf blight (LB) caused by A.
alternata are economically important diseases of tomato and potato. Little is known about the genetic
diversity and population structure of these pathogens in the United States. A total of 214 isolates of
A. alternata (n = 61), A. linariae (n = 96), and A. solani (n = 57) were collected from tomato and potato
in North Carolina and Wisconsin and grouped into populations based on geographic locations and
tomato varieties. We exploited 220 single nucleotide polymorphisms derived from DNA sequences
of 10 microsatellite loci to analyse the population genetic structure between species and between
populations within species and infer the mode of reproduction. High genetic variation and genotypic
diversity were observed in all the populations analysed. The null hypothesis of the clonality test based
on the index of association (r d ) was rejected, and equal frequencies of mating types under random
mating were detected in some studied populations of Alternaria spp., suggesting that recombination
can play an important role in the evolution of these pathogens. Most genetic differences were found
between species, and the results showed three distinct genetic clusters corresponding to the three
Alternaria spp. We found no evidence for clustering of geographic location populations or tomato
variety populations. Analyses of molecular variance revealed high (> 85%) genetic variation within
individuals in a population, confirming a lack of population subdivision within species. Alternaria
linariae populations harboured more multilocus genotypes (MLGs) than A. alternata and A. solani
populations and shared the same MLG between populations within a species, which was suggestive
of gene flow and population expansion. Although both A. linariae and A. solani can cause EB on
tomatoes and potatoes, these two species are genetically differentiated. Our results provide new
insights into the evolution and structure of Alternaria spp. and can lead to new directions in optimizing
management strategies to mitigate the impact of these pathogens on tomato and potato production
in North Carolina and Wisconsin.
The genus Alternaria has been divided into 24 sections based on morphological and molecular d ata1. Among
them, the Alternaria sect. porri produces long beaks and large conidia and includes A. porri, A. solani, and A.
tomatophila1. Early blight (EB) is caused by A. solani sensu stricto (Ellis and Martin) Jones and Grout in tomato
(Solanum lycopersicum L.) and potato (Solanum tuberosum L.)2,3. Alternaria tomatophila has also been reported to
cause EB in tomatoes3,4. Based on a concatenated multigene phylogeny, A. linariae (Neerg.) (syn. A. tomatophila)
Simmons, A. solani, and A. grandis cluster together in one c lade1. Under conducive environments, yield losses
attributed to these pathogens on tomato and potato range from 40 to 80%5,6. Alternaria spp. have been known
to cause EB and leaf blight (LB) in tomato and potato, and these disease epidemics have increased r ecently5–10.
Members of the Alternaria genus are haploid and heterothallic f ungi11. The asexual cycle produces conidia that
are mainly dispersed by rain splash and dew over short distances6,7,11. The relative importance of these pathogens
has increased recently, and they pose a serious threat to tomato and potato production in North Carolina (NC)6,7
and Wisconsin (WI)5,8.
1
Department of Entomology and Plant Pathology, North Carolina State University, Raleigh, NC 27695,
USA. 2Department of Applied and Natural Sciences, Namibia University of Science and Technology, Private Bag
13388, Windhoek, Namibia. 3United States Department of Agriculture-Agricultural Research Service (USDA-ARS),
Vegetable Crops Research Unit, Madison, WI 53706, USA. 4Department of Horticultural Science, North Carolina
State University, Raleigh, NC 27695, USA. *email: tbadhika@ncsu.edu; fjlouws@ncsu.edu
Scientific Reports | (2021) 11:17024 | https://doi.org/10.1038/s41598-021-95486-6 1
Vol.:(0123456789)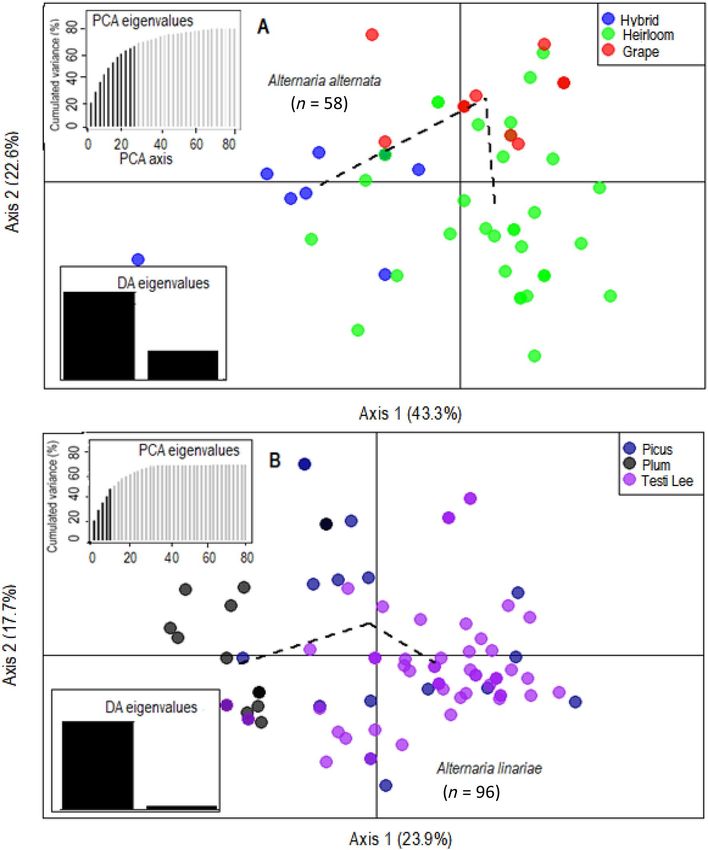
www.nature.com/scientificreports/
Several fungicides are currently available to control Alternaria spp. Due to its short life cycle and rapid growth
rates via asexual r eproduction12, the reduced sensitivity of strains of Alternaria spp. to quinone outside inhibitor
(QoI) and succinate dehydrogenase inhibitor (SDHI) fungicides has been r eported10,13. The planting of resistant
varieties is the most economical, sustainable, and environmentally friendly approach to controlling these plant
pathogens. However, the effectiveness of resistant varieties and fungicides inextricably depends on knowledge of
the evolutionary potential and population genetic structure of Alternaria spp.14,15. Furthermore, investigating the
population biology of plant pathogens can help us understand the origin, sources of inoculum, migration, and
phylogeography of the pathogen15. It also provides useful insights into the patterns of genetic diversity, which
can assist in selecting target pathogen isolates for screening germplasm for resistance and developing durable
resistant tomato and potato varieties14,16. Information on the genetic diversity, genetic structure, and reproduc-
tive biology of Alternaria spp. populations are necessary to understand the impact of evolutionary forces, such
as mutation, selection, genetic drift, recombination, and migration, on the evolutionary trajectory of pathogen
populations over t ime16,17. Understanding the factors that are responsible for creating pathogen variability and
structure is of practical significance in epidemiological studies and in optimizing pathogen management strate-
gies. For example, plant pathogenic fungi with a mixed reproduction system of clonality and recombination have
a higher potential for mutation and gene flow than asexually reproducing f ungi16. The recombination process
creates genetic diversity and enhances the propensity of pathogens to evolve rapidly in response to changes in
management strategies14,16.
Currently, the genetic variation and reproductive strategy of Alternaria spp. in tomato and potato are unknown
in NC and WI. Alternaria alternata, A. solani, and A. linariae are excellent candidates for investigating the model
of genetic divergence and speciation because of their intimate association with tomato and potato. Alternaria
spp. are known to reproduce primarily by asexual reproduction, and a high degree of clonality is dominated by a
few genotypes, low gene diversity, and a significant degree of nonrandom association among unlinked a lleles15,16.
Although no sexual stage has been found in Alternaria spp., signatures of recombination in clonal lineages of A.
alternata (the citrus brown spot pathogen) and high levels of genetic and genotypic diversity have been reported
in a few Alternaria spp.18–20. Sexual reproduction in most plant pathogenic fungi, including Alternaria spp., are
controlled by two mating type (MAT) idiomorphs: MAT1-1 and MAT1-221,22. Using a polymerase chain reaction
(PCR)-based approach, the MAT1-1 and MAT1-2 idiomorphs of approximately 1.9 and 2.2 kb, respectively, were
cloned and sequenced in A. alternata21. Subsequently, MAT1-1 and MAT1-2 idiomorphs have been identified in
several Alternaria spp.15,21–23. This has prompted the analysis of population genetics using molecular markers to
indirectly infer the hypothesis of clonality or recombination15,16,24–26.
To assess genetic diversity, molecular markers such as amplified fragment length polymorphisms (AFLPs),
isozymes, random amplified polymorphic DNA (RAPD), and random amplified microsatellites (RAMSs) have
been used in A. alternata and A. solani from tomato and p otato8,18,19,27,28. However, these markers have limited
discriminatory power to differentiate closely related isolates within populations of the pathogen. Microsatellite
loci or simple sequence repeats (SSRs) and single nucleotide polymorphisms (SNPs) are preferred m arkers17
because they are co-dominant, reproducible, and are located in known sequences in the genome compared to
RAPDs, AFLPs, and other markers. SSRs are tandem repeat motifs29 that occur mostly in the intergenic and
non-coding regions of the genome30,31. Microsatellite loci have been widely used in population genetic studies
to analyse the genetic structure and evolutionary biology of several pathogenic f ungi32–35. The use of SNPs and
high-throughput sequencing to investigate the genetic diversity of plant-pathogen populations has gained atten-
tion in recent years, partly owing to the reduced cost of DNA sequencing, the proliferation of tools for assembly
and annotation, and the possibility of simultaneously genotyping thousands of molecular markers in multiple
individuals36,37. Importantly, several limitations of gel electrophoresis and capillary-based methods37,38 can be
overcome by the sequencing of microsatellite loci (SSR-seq). Subsequently, SSR-seq offers a more precise and
statistically powerful tool to resolve the genetic diversity and population structure of pathogen populations38,39.
In this study, we examined SNPs from 10 microsatellite loci to detect genetic variation in three Alternaria spp.
sampled from tomato and potato in NC and WI. We tested the hypothesis of population subdivision to determine
whether local populations are genetically structured by geographic location or tomato variety and the evolution-
ary factors that shape the population structures of different populations. We further tested the hypothesis of
recombination within Alternaria spp. to discern evolutionary relationships among isolates in each population
and to examine the role of random mating in creating diversity in these species. Stratified by geographic location
or by tomato variety, we conducted analyses to answer the following biological questions. Do SNPs from micros-
atellite loci detect the genetic structure within a species and are the populations of Alternaria spp. from NC and
WI genetically differentiated? If so, which of the species is more diverse? What are the main factors (geographic
location or tomato variety) structuring populations within a species? Is there genotype sharing between species
and between populations within a species, which could be an indicator of gene flow? What is the implication of
the observed high genetic and genotypic diversity in disease epidemics? We also explored evidence of random
mating by examining MAT idiomorphs distributed between species and between populations within a species.
Does clonal or random mating occur or is there a mixed reproductive system? What are the implications of
investigating this for pathogen management strategies?
Results
Morphological characteristics. Based on the characteristics of single spores developed on acidified
potato dextrose agar (A-PDA) (Difco Laboratories, Detroit, MI) plates that were amended with two antibiot-
ics, ampicillin (0.06 g/L of medium) and rifampicin (0.024 g/L of medium), to minimize bacterial growth, all
Alternaria isolates were classified into two groups. The isolates of group I were characterized by the formation of
obclavate, dark brown, and short septate conidia with a short beak and branched chains. These morphological
Scientific Reports | (2021) 11:17024 | https://doi.org/10.1038/s41598-021-95486-6 2
Vol:.(1234567890)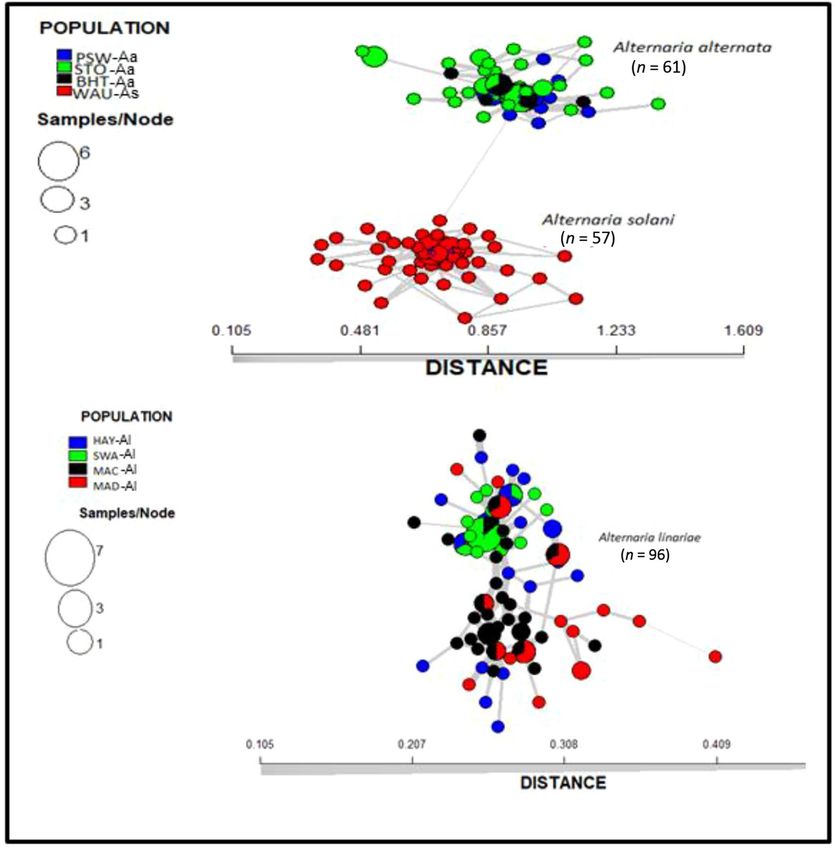
www.nature.com/scientificreports/
Figure 1. Map showing geographic locations in Wisconsin and North Carolina (https://d-maps.com), where
Alternaria alternata, A. solani, and A. linariae were collected from potato and tomato and analysed in this study.
The colour reflects the precise location from which isolates were collected. The number (sample size) of isolates
collected from each location is indicated.
features of 61 isolates were similar to those of A. alternata described previously4. Group II isolates produced large
conidia with long beak(s) and developed brownish-black pigment on A-PDA. These isolates were identified as
either A. linariae or A. solani. Alternaria linariae isolates also tended to produce some conidia with branched
beaks. In our observations, approximately 30 to 50% of them were branched.
Molecular determination of species. Neither PCR assay amplified genomic DNA isolates of A. alter-
nata. The primer pairs OAsF7 and OasR6 amplified a 164 bp PCR product from all DNA samples specific to
A. solani, whereas the primer pairs OatF4O and atR2 produced a 483 bp amplicon from all A. linariae isolates.
In all, 61, 96, and 57 isolates were confirmed as A. alternata, A. linariae, and A. solani, respectively, and were
included in genetic analyses (Fig. 1 and Supplementary Table S1).
Microsatellite locus sequence variability. Missing data were minimal, and thus, there was no variabil-
ity in the dataset. Comparatively, A. linariae populations had more variations in each microsatellite locus than A.
alternata and A. solani populations. In all, 220 SNPs were identified from 10 microsatellite loci across Alternaria
spp. The number of SNPs per locus varied from nine for SSR534 to 38 for SSR271 (Supplementary Table S2). The
genotype rarefaction curve showed a linear increase as the number of microsatellite loci increased, signifying
that these loci were polymorphic and useful to assess the genetic diversity between species and between popula-
tions within species (Supplementary Fig. S1).
Nucleotide diversity and neutrality test. Statistics of nucleotide diversity and neutrality tests varied
with microsatellite loci and populations within a species (Supplementary Table S3). In general, the values for S,
h, Hd, Pi, and θw were greater in A. solani than in A. alternata or A. linariae. Most nucleotide diversity estimates in
three microsatellite loci, SSR271, SSR400, and SSR511, were high across populations. For example, the numbers
of h detected in each microsatellite locus across populations varied from one to 20, with an average number of h
per locus of 5.0. Similarly, Hd values ranged from 0 to 0.87, with an average of 0.36; Pi estimates ranged from 0.0
to 0.07, with an average of 0.02, and θw values varied from 0.0 to 0.17, with an average of 0.04. (Supplementary
Table S3). The four microsatellite loci SSR201, SSR327, SSR391, and SSR534 yielded low (0.0 to 0.01) Pi and θw
in A. linariae, whereas microsatellite loci SSR186, SSR201, and SSR457 showed low (0.0 to 0.01) Pi and θw in A.
alternata. Tajima’s D values were negative for most of the microsatellite loci across populations (Supplementary
Table S3), indicating population expansion. The neutrality test of the loci SSR186 and SSR201 (PSW-Aa popula-
tion) and SSR457 (BHT-Aa population) showed very low Tajima’s D values (0.00 to 0.01), indicating no DNA
sequence variation within A. alternata. Similarly, SSR201 (SWA-Al population), SSR391 (MAD-Al population
Scientific Reports | (2021) 11:17024 | https://doi.org/10.1038/s41598-021-95486-6 3
Vol.:(0123456789)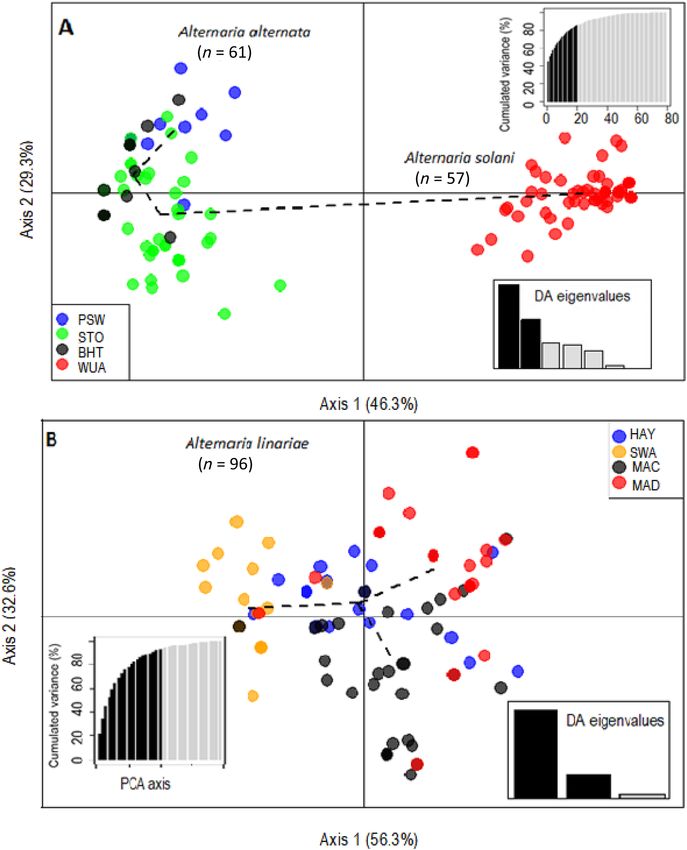
www.nature.com/scientificreports/
Strata Populationa nb MLGsc eMLGd SEe Hf Gg λh E5i Hexpj
A. alternata (Aa) 61 46 43.50 0.94 3.69 32.90 0.97 0.82 0.41
A. solani (As) 57 46 46.00 0.00 3.68 30.40 0.97 0.76 0.41
Alternaria species
A. linariae (Al) 96 70 45.80 2.10 4.10 48.00 0.98 0.78 0.36
Total 214
BHT-Aa 10 8 8.00 0.00 2.03 7.14 0.86 0.93 0.23
PSW-Aa 11 9 8.27 0.45 2.10 7.12 0.86 0.86 0.37
STO-Aa 40 33 9.51 0.65 3.42 27.59 0.96 0.90 0.44
WAU-As 57 46 46.0 0.00 3.68 30.40 0.97 0.76 0.41
Geographic location populations HAY-Al 21 19 9.57 0.56 2.91 17.64 0.94 0.96 0.38
MAC-Al 33 30 9.68 0.54 3.35 26.56 0.96 0.93 0.32
MAD-Al 21 17 9.14 0.74 2.78 15.21 0.93 0.94 0.37
SWA-Al 21 14 7.58 1.09 2.38 7.74 0.87 0.69 0.19
Total 214
Hybrid-Aa 10 8 8.00 0.00 1.97 6.25 0.84 0.85 0.36
Heirloom-Aa 38 31 9.45 0.68 3.35 25.79 0.96 0.90 0.43
Grape-Aa 10 8 8.00 0.00 2.03 7.14 0.86 0.93 0.23
Tomato variety populations Picus-Al 21 19 9.57 0.56 2.91 17.64 0.94 0.96 0.38
Plum Regal-Al 21 14 7.58 1.09 2.38 7.74 0.87 0.69 0.19
Tasti Lee-Al 54 42 9.52 0.65 3.64 33.91 0.91 0.89 0.35
Total 154
Table 1. Indices of genotypic diversity on clone-corrected datasets for Alternaria alternata (Aa), A. solani (As),
and A. linariae (Al) populations collected from tomato and potato in North Carolina and Wisconsin analyzed
using 220 single nucleotide polymorphisms (SNPs) from 10 microsatellite loci. a Populations of Alternaria
species were defined in the methods. b n = Number of individual samples. c MLG = Number of multilocus
genotypes (MLG) observed. d eMLG = The number of expected MLG at the smallest sample size 10 based on
rarefaction. e SE = Standard error based on eMLG. f H = Shannon–Wiener genotypic diversity77. g G = Stoddart
and Taylor’s genotypic diversity79. h λ = Simpson’s diversity index78. i E5 = Evenness, E575,76. j Hexp = Nei’s expected
heterozygosity74.
and SWA-Al population), SSR457, SSR534 (HAY-Al population), and SSR534 (SWA-Al population) also yielded
very low Tajima’s D values (0.0 to 0.01) within populations of A. linariae.
Genotypic diversity. In general, all genotypic diversity statistics were higher in A. linariae than in A. alter-
nata and A. solani (Table 1). The highest genotypic diversity based on three metrics (H, G, and λ) was in popula-
tions WAU-As and STO-Aa, whereas the lowest diversity was in populations BHT-Aa and PSW-Aa (Table 1).
Similarly, the Tasti Lee-Al population had the highest H (3.64) and G (33.91), whereas the Heirloom-Aa popula-
tion had the highest λ value (0.96). The remaining populations had λ > 0.84. The evenness of genotypes (E5) was
high for all Alternaria spp. For both geographic populations and tomato variety populations, E5 ranged from
0.69 (SWA-Al population and Plum-Regal-Al population) to 0.96 (HAY-Al and Picus-Al population) (Table 1).
In the remaining populations, E5 values were > 0.69. The average H exp in the eight geographic populations ranged
from 0.19 in the SWA-Aa population to 0.44 in the STO-Aa population, whereas for tomato variety populations,
the Plum Regal-AI population had the lowest (Hexp = 0.19), and the Heirloom-Aa population had the highest
(Hexp = 0.43).
Of the 214 isolates analysed, 162 unique MLGs were identified in three Alternaria spp. with 46/61, 70/96, and
46/57 MLGs of A. alternata, A. linariae, and A. solani, respectively (Table 1). Approximately 60% of the MLGs
were represented by a single isolate in most populations within a species (Fig. 2A). The number of MLGs also
varied between populations within a species. For example, 8, 9, and 33 MLGs were found in the BHT-Aa, PSW-
Aa, and STO-Aa populations, respectively. Similarly, 19, 30, 17, and 14 MLGs were detected in the HAY-Al, MAC-
Al, MAD-Al, and SWA-Al populations, whereas 46 MLGs were found in the WUA-A population. A few MLGs
were also shared between populations within a species in NC. For example, MLG161 was shared between the
BHT-Aa and STO-Aa populations; MLG144 was shared between the BHT-Aa and STO-Aa populations; MLG70
was shared between the HAY-Al and SWA-Al populations; and MLG 63 was shared between HAY-AI, MAD-AI,
and SWA-AI (Supplementary Table S1 and Fig. S2). MLG56 and MLG88 were found seven and six times within
the SWA-Al and WUA-As populations, respectively. At least 15 MLGs were detected withinpopulations, but they
were also found in another population of three species of Alternaria in NC and WI (Supplementary Figs. S2 and
S3). Interestingly, no MLGs were shared between species or between tomato and potato hosts.
According to populations based on the tomato varieties, 122 unique MLGs were identified in A. alternata
and A. linariae (Table 1 and Fig. 2B). MLGs ranged from 8 (Hybrid-Aa and Grape-Aa populations) each to 42
(Tasti Lee-Al population). The most frequent MLG56 was found in six isolates in the Plum Regal-Al population.
Only a few MLGs were also shared between tomato variety populations within a species (Supplementary Fig. S3).
Scientific Reports | (2021) 11:17024 | https://doi.org/10.1038/s41598-021-95486-6 4
Vol:.(1234567890)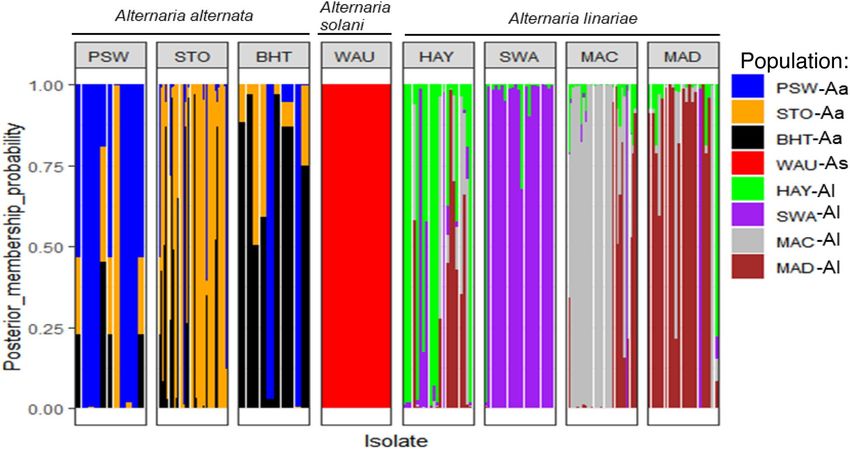
www.nature.com/scientificreports/
Figure 2. Bar plot showing the abundances of single nucleotide polymorphism (SNP)-based genotypes (MLGs)
shared between geographic location populations of three Alternaria species (A) and tomato variety populations
within a species (B). Each bar represents a unique MLG and the number of isolates in a population, with the
coloured portions of each bar corresponding to the number of isolates with that MLG in each population.
For example, two MLGs (MLG 144 and MLG161) were shared between Heirloom-Aa and Grape-Aa popula-
tions. Similarly, A. linariae MLG63 was detected in three tomato variety populations (Picus-Al, Plum Regal-Al,
and Testi Lee-Al). Comparatively, the eMLG value for A. solani was slightly higher (n = 46.00) than that for A.
linariae (n = 45.00) and A. alternata (n = 43.50). The WAUA population had the highest eMLGs (n = 46.00), and
the SWA-Al population had the lowest eMLGs (n = 7.58). eMLG values in tomato variety populations varied
from 7.58 (Plum Regal-Al population) to 9.57 (Picus-Al population), with an average value of 8.69 (Table 1).
Population differentiation. Comparisons of three Alternaria species showed high levels of genetic differ-
entiation (e.g., WAU-As, Jost’s D = 0.984) (Table 2). Stratification of populations by geographic location revealed
low pairwise differences in genetic differentiation between populations within a species. For example, Jost’s
D values between the BHT-Aa and STO-Aa populations and between the MAC-Al and HAY-Al populations
were closely related (Jost’s D = 0.034 to 0.035). These populations were not significantly differentiated (P < 0.05)
(Table 2). Similarly, stratification of populations based on tomato varieties revealed limited genetic differentia-
tion between populations within the same species, with Jost’s D values ranging from 0.000 to 0.083 (Table 2).
AMOVA analyses revealed that 1 to 5% of genetic variation was observed between populations. In contrast, the
highest (> 85%) genetic variation came from individuals within populations (Table 3).
Population structure. Variation among the genetic clusters was visualized in DAPC using two princi-
pal components (PCs) and two discriminant functions (DA eigenvalues). Three distinct genetic clusters of A.
alternata, A. solani, and A. linariae were positioned in different quadrants, suggesting that these species are
genetically differentiated (Supplementary Figs. S4 to S8). Bayesian Information Criterion (BIC) analysis also
confirmed the placement of populations into three genetic clusters (Supplementary Fig. S9). Furthermore, the
DAPC showed no clear clustering among populations within species based on either geographic location or
tomato variety (Figs. 3A, B and 4A, B).
The membership probability suggested that similar levels of admixture were shared between populations
within a species; however, no admixture was shared between any two species (Fig. 5). The MSN based on Nei’s
genetic distance revealed no clustering of geographic populations within species (Fig. 6). The demographic
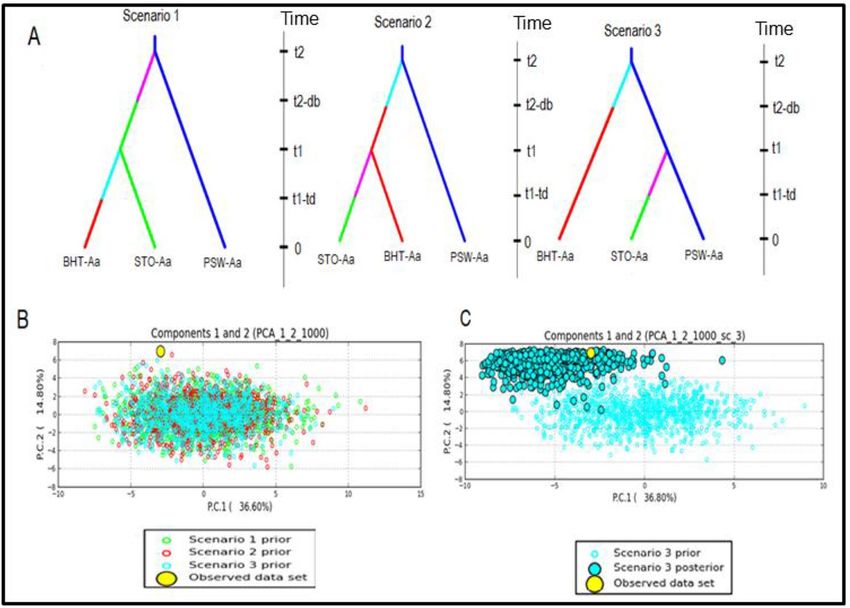
history of A. alternata and A. linariae in the sampled locations was investigated using approximate Bayesian
computation. These scenarios supported our DAPC results, which showed the closeness and lack of clustering
of three A. alternata populations (PSW-Aa, STO-Aa, and BHT-Aa). Scenario 3 was proposed to be the PSW-Aa
population as the most likely progenitor of the STO-Aa and BHT-A populations (Fig. 7A–C). Similarly, A linariae
Scientific Reports | (2021) 11:17024 | https://doi.org/10.1038/s41598-021-95486-6 5
Vol.:(0123456789)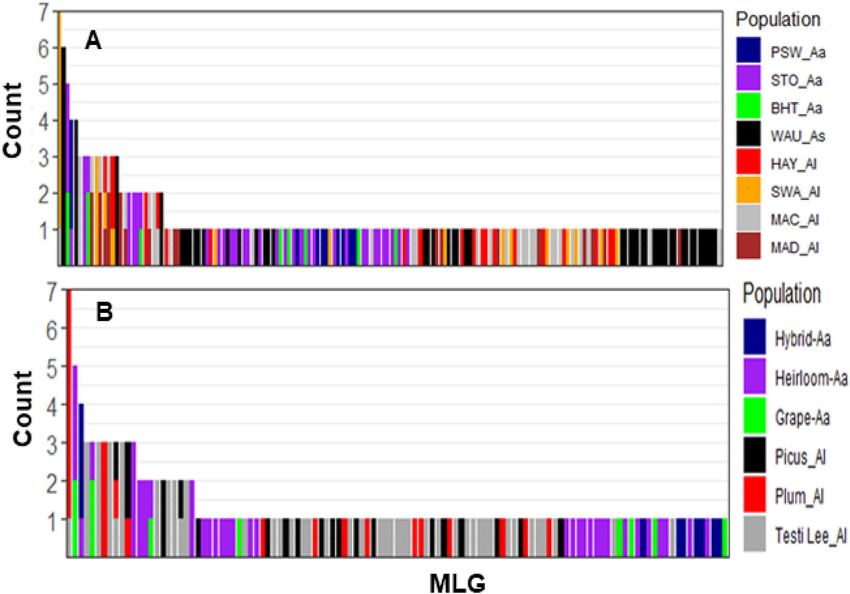
www.nature.com/scientificreports/
Strata Populationb BHT-Aa PSW-Aa STO-Aa HAY-Al MAC-Al MAD-Al SWA-Al WAU-As
BHT-Aa 0.000
PSW-Aa 0.060 0.000
STO-Aa 0.034c 0.076 0.000
Geographic HAY-Al 0.811 0.799 0.801 0.000
location MAC-Al 0.820 0.821 0.811 0.035 0.000
MAD-Al 0.840 0.825 0.830 0.390 0.185 0.000
SWA-Al 0.837 0.826 0.829 0.080 0.156 0.185 0.000
WAU-As 0.984 0.972 0.972 0.840 0.861 0.820 0.856 0.000
Plum
Hybrid-Aa Heirloom-Aa Grape-Aa Picus-Al Regal-Al Testi Lee-Al
Hybrid-Aa 0.000
Heirloom-Aa 0.075 0.000
Grape-Aa 0.053 0.029 0.000
Tomato
variety Picus-Al 0.792 0.806 0.811 0.000
Plum Regal-
0.820 0.830 0.837 0.0803 0.000
Al
Testi Lee-Al 0.816 0.822 0.827 0.0280 0.150 0.000
Table 2. Pairwise comparison of population differentiation Jost’s Da between populations of Alternaria
alternata (Aa), A. linariae (Al), and A. solani (As) collected from different geographic locations and tomato and
potato varieties in North Carolina (NC) and Wisconsin analyzed with 220 single nucleotide polymorphisms
(SNPs) from 10 microsatellite loci. a Jost’s D was computed between pairs of the population82. The statistical
significance of Jost’s D was calculated by a randomization test. b Populations of Alternaria spp. were defined in
the methods. c Bold values indicate populations where the null hypothesis was not rejected (P < 0.05) indicating
no differentiation between populations.
Strata Species Source of variation dfa Variation (%) SSb MSc Est var.d Fixation indicese P valuef
Variations among populations 2 2 2.79 1.4 0.8 FST = 0.006
Variations among isolates within a popula-
A. alternata 3 9 4.01 1.30 3.3 FIS = − 0.704 P = 0.009
tion
Variations within isolates 41 89 211.4 2.37 8.2 FIT = 0.15
Geographic location populations
Variations among populations 3 4 30.1 7.55 0.1 FST = 0.02
Variations among isolates within a popula-
A. linariae 4 6 6.5 1.02 0.05 FIS = 0.73 P = 0.026
tion
Variations within isolates 65 90 260 2.89 5.4 FIT = 0.04
Variations among populations 2 1 3.0 1.5 1.3 FST = 0.004
Variations among isolates within a popula-
A. alternata 3 10 8.4 2.8 1.2 FIS = − 0.69 P = 0.006
tion
Variations within isolates 41 89 173 4.21 3.7 FIT = 0.004
Tomato variety populations
Variations among populations 3 5 7.3 2.4 FST = 0.014
Variations among isolates within a popula-
A. linariae 4 10 20.0 5.0 FIS = − 0.71 P = 0.06
tion
Variations within isolates 67 85 250.0 3.52 FIT = 0.006
Table 3. Analysis of molecular variance (AMOVA) of the clone-corrected datasets of Alternaria alternata and
A. linariae populations collected from different geographic locations and tomato varieties in North Carolina
using 220 single nucleotide polymorphisms (SNPs) from 10 microsatellite loci. a df = Degrees of freedom and
populations of Alternaria species were defined in the methods. b SS = Sum of squared observations. c MS = Mean
squares. d Est. var. = Variance components. e Fst = Variations among locations or tomato varieties; Wright’s
inbreeding coefficient (FIS) = variations among isolates within locations or tomato varieties, and FIT = variations
within isolates. f P = Probability value was estimated based on 1000 permutations.
population SWA-Al was close to HAY-AI and clustered separately from the MAD-AI and MAC-AI populations
(Supplementary Fig. S10).
Linkage disequilibrium. We calculated the standardized index of association (r d ) in clone-corrected data
to infer the LD. We found nonsignificant LD (P > 0.05) between species and most populations within a species
(Table 4 and Supplementary Figs. S11, S12, and S13). Intriguingly, LD values in two populations, STO-Aa and
Heirloom-Aa, significantly (P < 0.05) deviated from the hypothesis of recombination.
Scientific Reports | (2021) 11:17024 | https://doi.org/10.1038/s41598-021-95486-6 6
Vol:.(1234567890)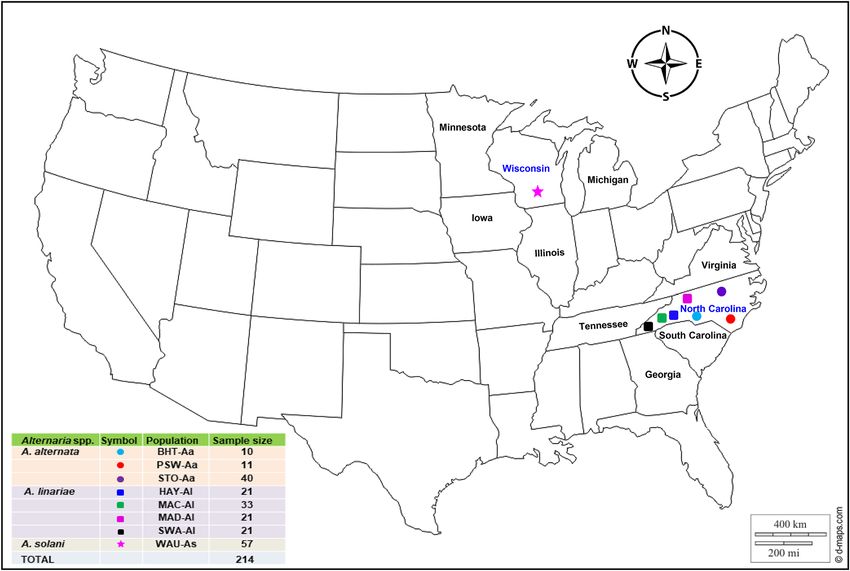
www.nature.com/scientificreports/

                                  Figure 3.  The discriminant analysis of principal components (DAPC) model showing clustering of eight
                                  geographic location populations of three Alternaria spp. as defined in the methods using 220 single nucleotide
                                  polymorphisms (SNPs) from 10 microsatellite loci. For the A. alternata and A. solani populations (A), alleles
                                  contributed more than 5% to the first principal component (Axis 1), and alleles contributed more than 5%
                                  to the second principal component (Axis 2). For A. linariae populations (B), alleles that contributed more
                                  than 5% to the first principal component (Axis 1) and alleles that contributed more than 5% to the second
                                  principal component (Axis 2). Lines and shapes represent individual genotypes, colour-coded by their original
                                  sampling location, and surrounded by ellipses. Discriminant analysis (DA) and principal component analysis
                                  (PCA) eigenvalues represent the amount of genetic variation captured by the analysis. PCA eigenvalues are
                                  the cumulative variance explained by the retained principal components. DA eigenvalues represent which
                                  linear discriminants are compared in each scatter plot, with the height of each bar representing the relative
                                  contribution in explaining total variance.

Scientific Reports |   (2021) 11:17024 |              https://doi.org/10.1038/s41598-021-95486-6                                                   7

                                                                                                                                           Vol.:(0123456789)
www.nature.com/scientificreports/
Figure 4. Discriminant analysis of principal components (DAPC) model showing clustering of tomato variety
populations using 220 single nucleotide polymorphisms (SNPs) from 10 microsatellite loci. For A. alternata
(A), alleles contributed more than 5% to the first principal component (Axis 1) and more than 5% to the
second principal component (Axis 2). For A. linariae populations (B), alleles that contributed more than 5%
to the first principal component (Axis 1) and more than 5% to the second principal component (Axis 2). Lines
and shapes represent individual genotypes, colour-coded by their original host varieties, and surrounded by
ellipses. Discriminant analysis (DA) and principal component analysis (PCA) eigenvalues represent the amount
of genetic variation captured by the analysis. PCA eigenvalues are the cumulative variance explained by the
retained principal components. DA eigenvalues represent which linear discriminants are compared in each
scatter plot, with the height of each bar representing the relative contribution in explaining total variance.
Mating type determination. As expected, the mating-type primers amplified either an 800-bp MAT1-1
fragment or a 280-bp MAT1-2-specific product from any DNA sample (Supplementary Fig. S14a, b). The fre-
quencies of the two mating types were in equilibrium for the A. alternata and A. solani populations (P ≤ 0.05);
Scientific Reports | (2021) 11:17024 | https://doi.org/10.1038/s41598-021-95486-6 8
Vol:.(1234567890)www.nature.com/scientificreports/
Figure 5. A bar plot showing the population membership probability assignments in eight geographic
populations of three Alternaria species collected from tomato and potato in North Carolina and Wisconsin
using 220 single nucleotide polymorphisms (SNPs) from 10 microsatellite loci. Bars of the same colour represent
the likelihood of the same genetic cluster based on analysis. Bars of mixed colours are admixture isolates.
however, skewing towards MAT1-1 was observed in A. linariae (Table 4). The geographic population STO-Aa
within A. alternata and the tomato variety population Heirloom-Aa did not deviate significantly (P ≤ 0.05) from
a 1:1 ratio. The null hypothesis of random mating cannot be rejected for these populations. However, the mating
type ratios deviated from 1:1 for the remaining geographic location populations and tomato variety populations
within a species. The mating type ratios in seven populations (PSW-Aa, HAY-Al, MAC-Al, MAD-Al, Hybrid-
Aa, Picus-Al, and Tasti Lee-Al) were skewed towards MAT-1–1, whereas in two populations (SWA-Al and Plum
Regal-Al), it was skewed towards MAT1-2 (Table 4).
Discussion
Our study aimed to analyse the genetic diversity and population structure of three Alternaria spp. in NC and
WI. To the best of our knowledge, this is the first attempt to use SNPs from 10 SSR-seq in three Alternaria spp.
sampled from populations of tomato and potato to test the hypothesis of population subdivisions and determine
whether they are in linkage equilibrium. Our analyses identified high genotypic diversity and low levels of genetic
diversity in all Alternaria spp. and across populations within a species. To test for clonality, both r d and two
mating types provide evidence for random mating in Alternaria species. Although difficult to observe directly,
the evidence for recombination was unexpected in our haploid organisms11. These findings are consistent with
a pathogen that has a mixed reproductive mode of both clonality and sexuality, which has implications for the
efficacy of fungicides and durability of host plant resistance due to increased pathogen variability.
High gene and genotypic diversity have been reported for A. brassicicola15,40, A. alternata23,41–43 and A.
solani18,28,44. Furthermore, high genetic and genotypic diversity has been ascribed to the random association
between alleles at different loci24, genetic drift, gene flow, and parasexual mating leading to nonrandom asso-
ciation of a lleles16. Our analysis revealed 162 unique MLGs across species, and the same MLGs were shared
between some populations within a species. The presence of the same MLGs between populations within a
species suggests the potential for gene flow16. We hypothesize that gene flow may be attributed to three possible
reasons that have also been demonstrated in other pathosystems45,46. First, conidia of Alternaria spp. can spread
by wind and with s eeds47,48 causing EB and LB epidemics during the growing seasons. Second, these fungi can
overwinter in the plant debris and lesions on shoots, which may serve as inoculum reservoirs in the absence
of hosts47 and subsequently spread to geographically close farms where susceptible varieties are grown. Third,
human-mediated movement through contaminated vehicles and farm machinery, infected tomato transplants,
and potato tubers distributed or shipped to producers could contribute to the short- and long-distance dispersal
of these fungi. However, the potential long-distance dispersal of Alternaria spp. inoculum within the United
States deserves further investigation.
Multilocus linkage disequilibrium (LD) tests suggested potential recombination in two A. alternata geographic
location populations (BHT-Aa and PSW-Aa) and four A. linariae geographic populations (HAY-AI, MAC-AI,
MAD-AI, and SWA-Al). In contrast, the A. solani population (WAU-As) and two A. alternata populations (STO-
Aa and Heirloom-Aa) exhibited clonality. A few geographic location populations (STO-Aa and WAU-As) and
Scientific Reports | (2021) 11:17024 | https://doi.org/10.1038/s41598-021-95486-6 9
Vol.:(0123456789)www.nature.com/scientificreports/
Figure 6. Minimum spanning network tree from the clone-corrected data showing the relationships among
individual multilocus genotypes (MLGs) of eight geographic populations of three Alternaria species collected
from tomato and potato in North Carolina and Wisconsin using 220 single nucleotide polymorphisms (SNPs)
from 10 microsatellite loci. Each node (circle) represents an MLG. Distances between nodes are proportional
to Nei’s genetic distance. Node colours represent population membership, and node sizes correspond to the
number of individuals representing an MLG.
one tomato variety population (Heirloom-Aa) contained the two mating types, and their distributions were not
significantly different from a 1:1 ratio, suggesting random mating. The occurrence of both mating types along
with high levels of genetic diversity, the large number of singleton MLGs, and random mating provide evidence
for most populations undergoing sexual recombination. Our findings corroborate previous studies that also
reported a similar conclusion in asexual and sexual f ungi15,40,49–54. We also found an unequal frequency of mating
types or a biased distribution in some populations within a species. These results could be due to crop manage-
ment practices such as the application of fungicide or the use of resistant cultivars that can favour one or the
other mating type, as demonstrated in other studies23. Alternatively, nonrandom mating15,24,55 and the selective
advantage of the isolate virulence in the host might contribute to causing skewed mating type r atios56,57. The
findings of a mixed reproductive mode and high genetic diversity of Alternaria spp. based on SNPs are parallel
to those of other p athosystems15,50, where the impact of mixed reproduction is well documented.
The assessment of population differentiation using Jost’s D index revealed that genetic differences were found
between species but not between populations within a species. Our findings based on comparative genealogical
analyses using DIYABC indicated that Alternaria spp. are part of a panmictic population due to a lack of popula-
tion clustering based on Bayesian analysis or possibly due to low sequence variations within a species5,30,58. We
found a lack of genetic differentiation between the populations within A. alternata or A. linariae from tomatoes
in NC. This result indicated that these two fungi can coexist in the same agricultural systems and microclimates
Scientific Reports | (2021) 11:17024 | https://doi.org/10.1038/s41598-021-95486-6 10
Vol:.(1234567890)www.nature.com/scientificreports/
Figure 7. Scenarios were tested using DIYABC analysis to infer the demographic history of Alternaria alternata
in North Carolina using 220 single nucleotide polymorphisms (SNPs) from 10 microsatellite loci. The three
scenarios reflect the probable hypotheses of population isolation between the geographic populations in North
Carolina. Scenario 1: PSW-Aa originates from an unknown ancestral population. STO-Aa originates from
an unknown ancestry and gives rise to BHT-Aa. Scenario 2: PSW-Aa originates from an unknown ancestral
population. BHT-Aa originates from an unknown ancestral population and gives rise to STO-Aa. Scenario
3: PSW-Aa originates from an unknown ancestor and gives rise to BHT-Aa and STO-Aa (best scenario) (A).
Posterior probability values are based on logistic regression of all three scenarios (B). Validation of the prior
choices of best scenario 3 using principal coordinate analysis based on summary statistics considering 1000
random simulated datasets. Validation of the prior choices of best scenario 3 using principal coordinate analysis
based on summary statistics considering 1000 random simulated datasets (C).
suitable for tomato production. The development of management strategies and breeding for resistance must
be species-specific. Our analysis further showed that the populations between A. linariae and A. solani did not
follow a pattern of differentiation by geographic distance. Population genetics-based inference of both genetic
diversity and population differentiation of Alternaria spp. may be governed by their effective population sizes,
immigration from other populations and effects exerted by evolutionary processes such as random genetic drift
and mutation rates59,60. The total genome sizes of three Alternaria spp. reported previously were A. alternata = 33.2
mega-bases (Mb); A. linariae = 32.9 Mb, and A. solani = 34 Mb30. Furthermore, these genomes are comparable to
recently sequenced and annotated genomes of several other species of Alternaria30. A larger genome size usually
generates higher genotypic diversity because more alleles could emerge through mutation and random genetic
drift61. One of the limitations of our study is the reliance on small sample sizes of A. alternata populations col-
lected from tomatoes in NC. Similarly, the A. solani population (WAU-As) was collected from a potato from
one location in WI. To overcome these limitations, geographically more diverse and larger samples are needed
to collect and analyse population genetics parameters. We expect that the distribution of sample sizes may not
be representative of the populations being sampled and is likely affected by the accuracy of genotypic diversity
and population differentiation analyses. Our results must be interpreted cautiously when comparing genetic
diversity and population structure with global populations of A. alternata and A. solani.
Our analyses revealed three genetic clusters corresponding to the individual species. The SWA-Al population
from Swain County was slightly different from the other three populations HAY-Al, MAC-Al, and MAD-Al.
Likewise, A. solani populations causing EB on tomato and potato were not differentiated from each o ther2,3.
The hypothesis of a lack of host specialization needs to be confirmed by cross-inoculation of A. linariae and A.
solani isolates on tomato and potato varieties. We also found a few signals of admixed members attributed to the
movement of the common MLGs through the dispersal of airborne conidia and infected planting m aterial16,62.
Although the founder sample history is unknown, our neutrality test showed a signature of population expan-
sion. When populations were stratified by geographic location or tomato variety, > 85% of the genetic variation
Scientific Reports | (2021) 11:17024 | https://doi.org/10.1038/s41598-021-95486-6 11
Vol.:(0123456789)www.nature.com/scientificreports/
LD test Mating types
Strata Species/populationa n r db Ratioc χ2d (P)e
Alternaria alternata (Aa) 61 0.044 (0.004*) 30:31 0.02 (0.69)
Species Alternaria solani (WAU-As) 57 0.036 (0.02*) 27:30 0.16 (0.27)
Alternaria linariae (Al) 96 0.007 (0.725) 59:37 5.04 (0.04)
BHT-Aa 10 − 0.032 (0.7) 4:6 0.40 (0.02)
PSW-Aa 11 − 0.007 (0.50) 7:4 0.82 (0.03)
STO-Aa 40 0.069 (0.001*) 19:21 0.10 (0.71)
Geographic location populations HAY-Al 21 − 0.017 (0.78) 16:5 5.76 (0.023)
MAC-Al 33 0.003(0.399) 26:7 10.94 (0.033)
MAD-Al 21 0.002 (0.46) 16:5 5.76 (0.02)
SWA-Al 21 − 0.037 (0.81) 1:20 17.19 (0.03)
Hybrid-Aa 10 0.004 (0.46) 7:3 1.60 (0.021)
Heirloom-Aa 38 0.072 (0.001*) 19:19 0.00 (0.81)
Grape-Aa 10 − 0.032 (0.70) 4:6 0.40 (0.03)
Tomato variety populations
Picus-Al 21 − 0.017 (0.765) 16:5 5.76 (0.045)
Plum Regal-Al 21 − 0.036 (0.82) 1:20 17.19 (0.04)
Tasti Lee 54 − 0.0001 (0.50) 42:12 16.67 (0.03)
Table 4. The measure of random mating based on linkage disequilibrium (LD) in populations of three
Alternaria species collected from different geographic locations and tomato and potato in North Carolina and
Wisconsin using 220 single nucleotide polymorphisms (SNPs) from 10 microsatellite loci. The clone-corrected
datasets were analyzed using poppr package R. a Populations of Alternaria spp. were defined in the methods.
b
r d = Standardized index of association90. Asterisks (*) indicate populations that are in linkage disequilibrium
(P ≤ 0.05). c Ratio of MAT1-1: MAT1-2. d χ2 = Chi-square values based on a 1:1 ratio and one degree of freedom.
e
P = Probability values in parentheses. P > 0.05 highlighted in bold indicate populations where the null
hypothesis of random mating and mating types of 1:1 ratio was not rejected.
was distributed in individuals within a population. Our findings of high genetic diversity in three Alternaria
spp. were similar to previous s tudies63,64, who also reported little or no evidence of population differentiation
based on geographic origin or host of origin. The centre of origin of any pathogen is likely to possess a popula-
tion with higher genetic variability than recently established populations54. In this study, the A. alternata and
A. linariae populations from tomatoes in NC had higher genotypic diversity than the A. solani population from
potatoes in WI. It appeared that the populations from tomatoes could have been established earlier than the A.
solani population from potatoes.
The A. solani population (WAU-As) was sampled from EB-resistant potato genotypes such as Atlantic, Rus-
set Burbank, a wild relative S. berthaultii, F1 hybrids, advanced breeding lines, and parental g enotypes8. These
genetically diverse potato genotypes might have some effects on the pattern of differentiation within the A.
solani population from WI. All A. alternata populations analysed were sampled from hybrids and heirlooms
with unknown genes for resistance. In contrast, A. linariae populations were collected from commercially grown
tomato varieties such as Picus (U. S. Patent # 7,807,886 B2), Testi Lee65, and Plum Regal66, and these varieties have
some levels of resistance to A. linariae. These resistant varieties could exert selection pressure on the pathogen
populations, thus promoting high genotypic diversity in A. linariae populations in NC. It is worth noting that the
SWA-Al population was more variable than other populations and was collected from ‘Plum Regal’. This variety
was developed from a cross between the EB-resistant tomato breeding lines NC 25P and NC 30P66.
In conclusion, we used SNPs from 10 microsatellite loci to gain insights into Alternaria species diversity and
population structure with respect to species, geographic location, and affected hosts in NC and WI. Our analysis
revealed three distinct genetic clusters that corresponded to each species. The effect of geographic location and
tomato variety on populations within a species was low. We used several population genetics tools to test for the
occurrence of random mating to further infer the mode of reproduction of the studied populations. The presence
of high genotypic diversity, high and diverse MLGs, linkage equilibrium based on the r d and both mating-type
ratios supported the hypothesis of random mating. These findings suggest that Alternaria spp. can maintain the
sexual pathway in the studied populations23. Plant pathogen populations with a mixed reproductive system (i.e.,
both clonal and recombination) are considered the highest r isk16. The process of random mating may increase the
frequency of the evolution of new MLGs through the random association of alleles, whereas asexual reproduction
maintains the propagation of well-adapted MLGs. Thus, gene flow may occur through the movement of these
MLGs between geographic locations or through infected tomato transplants. Importantly, careful intervention
must be exercised when applying different fungicides and deploying single-gene resistance varieties because
pathogen populations with high evolutionary potential are more likely to overcome host genetic r esistance16.
Tomato and potato breeding strategies that combine quantitative resistance should be a valuable approach for
developing durable resistance to these fungal pathogens in NC and WI.
Scientific Reports | (2021) 11:17024 | https://doi.org/10.1038/s41598-021-95486-6 12
Vol:.(1234567890)www.nature.com/scientificreports/
Methods
Field sampling and fungal collection. Tomato and potato leaves with symptoms of EB and LB were
collected from farmer fields, commercial plots, or research plots in NC and WI (Fig. 1 and Supplementary
Table S1). We used three sampling methods to collect samples of Alternaria spp., depending on the size of the
fields and the number of tomato cultivars planted between 2008 and 2014. To isolate the fungi from tomato, all
samples were brought to the Department of Entomology and Plant Pathology, North Carolina State University,
Raleigh, NC. Three segments (~ 4 mm2) were cut from each infected leaf and submerged in 70% ethanol for
30 s. The leaf segments were further sterilized by dipping in 3% Clorox (Clorox Company, Oakland, CA) for
1 min and rinsed three times in sterile distilled water before plating. The segments were transferred with sterile
tweezers into A-PDA plates. The plates were sealed with parafilm and placed under light at 25 °C for 5 days
to induce sporulation. In this study, a ‘sample’ (i.e., isolate) herein is defined as an experimental unit used for
measurement, and ‘population’ comprises groups of isolates defined by geographic locations or tomato varieties.
Geographic locations are defined by an administrative boundary, such as a county or a region within NC and
WI, and represented by prominent features, such as soil type, weather conditions, and cropping patterns in the
vicinity. Tomato genotypes grown in NC are diverse, with different combinations of fruit size and growth habits,
and are resistant to multiple plant pathogens. Tomato types are mainly represented by Cherry, Roma, Grape,
Plum, Heirlooms, and Hybrids. The commercial tomato varieties were Picus, Plum Regal, Red Defender, and
Tasti Lee. In this study, ‘fungal populations’ were grouped into three strata. ‘Species’ refers to isolates identified
based on morphological features and molecular characterization and belonged to A. alternata (Aa), A. linariae
(Al) and A. solani (As). ‘Geographic location populations’ refers to isolates collected from a county or geographic
region within NC and WI. ‘Tomato variety populations’ indicates isolates collected either from a certain tomato
type or variety and were only within the population.
For A. alternata, a haphazard sampling strategy was used in geographic regions and spanned ~ 370 km from
south to north and ~ 650 km from east to west in NC. Alternaria alternata isolates were collected and isolated
(as described above) and grouped according to counties within a similar geographic region and tomato type
(Fig. 1 and Supplementary Table S1). Among them, the BHT-Aa population (n = 10) was collected from grape-
type tomatoes66 from Buncombe, Henderson, and Transylvania (BHT) counties in the western mountain region,
NC. The PSW-Aa population (n = 11) was collected from the commercial hybrid tomato cv. Florida 47 (Fla 47)
and Roma from Pender, Sampson, and Wake (PSW) counties in the inner coastal plain and Piedmont region in
NC. The Stokes (STO)-Aa population (n = 40) was sampled from Stokes county in the northwestern Piedmont
region in NC. The STO-Aa population was collected mainly from heirloom tomatoes such as Aunt Gertie’s Gold,
Cherokee Purple, German Pink, Mortgage Filter, Mr. Stripey, Pink Brandy Wine, Snowstorm, and Verna Orange.
Alternaria alternata populations were grouped according to tomato type and represented by the Grape-Aa popu-
lation (n = 10) from BHT in southwestern NC; the Hybrid-Aa population (n = 10) was from PSW in central and
eastern NC, and the Heirloom-Aa population (n = 38) was from STO in northwestern NC.
We used stratified random s ampling67 to collect A. linariae isolates from four major tomato-growing coun-
ties in NC: Haywood, Macon, Madison, and Swain. These counties spanned 165 km from east to west. Each site
was divided into strata or rows approximately 250 m long. In each row, three-leaf samples were collected ~ 40 m
apart. At least 10 rows were sampled, and up to 60 samples were collected from each county (Supplementary
Table S1). In all, 96 A. linariae isolates were collected and represented by HAY-Al (n = 21), MAC-Al (n = 33),
MAD-Al (n = 21), and SWA-Al (n = 21) from Haywood, Macon, Madison, and Swain counties, respectively (Fig. 1
and Supplementary Table S1). Alternaria linariae isolates collected from western NC were mainly from hybrid
tomatoes, and tomato variety populations were represented by the Picus-Al population (n = 21), Tasti Lee-Al
population (n = 54), and Plum Regal-Al population (n = 21) (Supplementary Table S1).
We used random sampling to collect A. solani isolates (n = 57) between 2008 and 2009 at the Hancock Agri-
cultural Research Station, Waushara County, WI (Fig. 1 and Supplementary Table S1). Potato leaves showing EB
lesions were collected from breeding lines and families. Three tissue samples (4 m m2) were cut from the margin
of EB lesions on the same leaflet and placed onto clarified V-8 (CV8) medium (100 mL of clarified V8 juice, 1.5 g
CaCO3, 900 mL distilled H2O, and 12.7 g agar) amended with streptomycin (25 μg/mL) and kanamycin (50 μg/
mL). Some of the isolates of A. solani from potatoes represented by the WAU-As population were also character-
ized previously by RAPD markers8 and were obtained from the U.S. Department of Agriculture, Agricultural
Research Service, Vegetable Crops Research Unit, Madison, WI under an import permit (USDA-APHIS, USA).
Morphological characteristics. Conidia were taken from sporulating colonies cultured on A-PDA for
7 days using an inoculation loop and then streaked onto 1% water agar plates. The plates were incubated for
24 h at 28 °C to allow for conidial germination. The germinating conidia were transferred under a dissecting
microscope to a new A-PDA plate. All fungal isolates sampled from tomato and potato were cultured on A-PDA
for 7 days and examined for morphological characteristics. For each isolate, two replicates of A-PDA plates were
used. These cultures were incubated at 25 °C under cool white, fluorescent light with an 8 h photoperiod and
16 h darkness. For each of the tested isolates, colony colour, pigment production in A-PDA medium, conidial
shape and size, the presence or absence of beaks on conidia, branching, spore colour, and the presence of hori-
zontal and vertical septa were examined under a compound microscope as described p reviously1,4. To maintain
the fungal isolates, an 8 mm diameter mycelial plug was cut from each A-PDA plate after 7 to 10 days of incuba-
tion using a cork borer. Mycelial plugs were dried under laminar flow overnight, transferred into 2 mL screw-cap
cryogenic vials, and stored at − 80 °C. In total, 214 isolates of three Alternaria spp., A. alternata (n = 61), A. lin-
ariae (n = 96), and A. solani (n = 57) (Fig. 1 and Supplementary Table S1), were analysed to address the biological
hypotheses laid out in the introduction.
Scientific Reports | (2021) 11:17024 | https://doi.org/10.1038/s41598-021-95486-6 13
Vol.:(0123456789)www.nature.com/scientificreports/
DNA extraction. To extract genomic DNA, isolates were revived on A-PDA plates and incubated at 25 °C
for 7 d. Fungal tissues were scraped with a sterile razor blade and placed into 2 mL screw-capped tubes. The tubes
were freeze-dried (Virtis Genesis 25 ES Freeze dryer, Virtis Company, Gardiner, NY) for 72 h with the following
cycle: − 25 °C for 40 min; − 30 °C for 60 min; − 20 °C for 600 min, and − 10 °C for 600 min with a pressure of 400
mTorr. The lyophilized freeze-dried fungal tissues were ground to a fine powder using a microtube homogenizer
(Model D1030-E, Beadbug, Benchmark Scientific Inc., Edison, NJ) at 400 rpm for 3 min. The glass beads were
removed, and genomic DNA was extracted using the DNeasy Plant Mini kit (Qiagen, Valencia, CA) following
the manufacturer’s recommended protocol. The DNA concentration was quantified using a fluorometer (Qubit
2.0, Invitrogen by Life Technology, Carlsbad, CA). The final concentration of DNA at 10 ng/µL was prepared for
each sample for all PCR assays and SSR-seq.
Molecular determination of species. Although A. alternata can be distinguished morphologically from
the other two species, species-specific primers have been used to differentiate between A. linariae and A. solani
and A. alternata55. Alternaria solani-specific primer pairs OAsF7 (5′-CGACGAGTAAGTTGCCCTCA-3′) and
OAsR6 (5′-TGTAGGCGTCAGAGACACCATT-3′) amplified the Alt a1 genomic region in A. solani, whereas
another primer pair, OAtF4 (5′-TGCGGCTTGCTGGCTAAGGT-3′) and OAtR2 (5′-CAGTCGATGCGGCCG
TCA-3′), amplified a DNA fragment from the calmodulin-encoding gene of A. linariae and some other large-
spored Alternaria species excluding A. solani55. To identify the isolates, the genomic DNA of the 214 isolates of
Alternaria spp. was amplified using the two sets of species-specific primer pairs synthesized by Invitrogen Life
Technologies (Carlsbad, CA). Genomic DNA of A. solani isolate # BMP 0185 from p otato30 was kindly provided
by Barry M. Pryor, University of Arizona, and used as a positive control. PCR assays were conducted in a 25
µL reaction volume containing 15.22 µL of sterile deionized water; 2.5 µL of 10 × PCR buffer ( MgCl2; 200 mM
Tris–HCl, pH 8.4, 500 mM KCl; Invitrogen); 1.25 µL of 2 mM dNTP mix, 1.8 µL of 25 mM M gCl2 (Applied
Biosystems, Foster City, CA), 0.1 µL (5 Units/µL) of Taq polymerase (New England Biolabs, Inc., Ipswich, MA),
1 µL of 10 nM each reverse and forward primer, 1 µL (10 ng/µL) of genomic DNA; and 0.125 µL (20 mg/mL) of
bovine serum albumin (BSA, Thermo Fisher Scientific, Waltham, MA). PCR amplification was performed in a
thermal cycler (Model T100 Thermal Cycler and iCylcer, Bio-Rad Laboratories, Inc., Hercules, CA) as described
previously55. Amplification with the primer pairs OAsF7 and OAsR6 had an initial step of 94 °C for 2.5 min,
followed by 30 cycles of 92 °C for 20 s, 68 °C for 30 s, and a final extension of 72 °C for 3 min. The program for
the amplification of primer pairs OAtF4/OAtR2 had the same features except that the final extension was 72 °C
for 40 s. The PCR products were resolved on 1.5% agarose gels in 1 × TAE (40 mM Tris, 20 mM acetic acid, and
1 mM EDTA) buffer stained with GelRed (Biotium, Inc., Union City, CA). Each well was loaded with 6 µl of PCR
product mixed with 3 µL of 5 × loading dye (Thermo Fisher Scientific, Waltham, MA). A 50-bp DNA marker
(Invitrogen, Carlsbad, CA) was loaded at the beginning of each row as a molecular weight marker. The gel was
run under 100 V for 90 min, and an image was captured by a molecular gel imager (Molecular Imager Gel Doc
XR + System, Image Lab 4.0.1, Bio-Rad Laboratories Inc., Hercules, CA).
SSR‑seq. The 13 microsatellite loci developed from the reference genome sequences of A. solani # BMP018530
were kindly provided by Tobin Peerver and Lydia Tymon, formerly at the Department of Plant Pathology, Wash-
ington State University, Pullman, WA, USA (Supplementary Table S2). In our preliminary studies, the genomic
DNA of five representative isolates of each species was arbitrarily selected to examine the utility of the SNPs from
SSR-seq as sequence markers. A 25 µL reaction volume contained 8.5 µL of sterile distilled water, 2 µL of 10 ng/
µL genomic DNA, 1 µL each of 10 µM reverse and forward primers, and 12.5 µL of GoTaq Green PCR mix (Pro-
mega Inc., Madison, WI). The PCR conditions for all microsatellite loci included initial denaturation at 94 °C
for 2 min, followed by 35 cycles of denaturation at 94 °C for 1 min, annealing at 58 °C to 60 °C for 1 min and
extension at 72 °C for 2 min, and a final extension step at 72 °C for 10 min. The quality and expected size of the
PCR product of each sample were confirmed by electrophoresis on a 1.5% agarose gel (w/v). Sanger sequencing
was performed at North Carolina State University, Genomic Sciences Laboratory (GSL), Raleigh, NC. Briefly,
submitted PCR amplicon reactions underwent PCR cleanup using ExoSAP-IT PCR Product Cleanup reagent
(Applied Biosystems, Foster City, CA). For the 10 µL PCR mixture, 10 ng/µL of DNA template, 6.4 µM of each
primer and BigDye Terminator mix (Applied Biosystems) were mixed. Thermal cycling conditions were as fol-
lows: (1 cycle) 96 °C for 1 min; (25 cycles) 96 °C for 10 s, 50 °C for 5 s, and 60 °C for 4 min. Samples were
held at 4 °C until dye-terminator cleanup using Mag-Bind SeqDTR beads with the supplied protocol (Omega
Biotek, Norcross, GA). Following binding, sequence fragments were washed 2 × in 85% ethanol and eluted in
molecular grade water before capillary sequencing on an ABI 3730xl DNA analyser (ABI PRISM 3730xl capil-
lary sequencer, Applied BioSystems, Foster City, CA). Of the 13 microsatellite loci screened, 10 polymorphic loci
(SSR186, SSR201, SSR210, SSR271, SSR327, SSR391, SSR400, SSR457, SSR534, and SSR511) were selected and
used for genotyping 214 isolates of Alternaria spp. (Supplementary Table S2).
Nucleotide variation analysis. Sequences of the 10 microsatellite loci-amplified products obtained from
Platinum Sanger sequencing were assembled and aligned across all isolates of three Alternaria spp. using the
MAFTT algorithm plugin in Geneious ver. 7.1.7 (Biomatters Ltd., Auckland, New Zealand). Reference genome
sequences of A. solani # BMP0185 were u sed30 to identify single nucleotide polymorphisms (SNPs) in each
microsatellite locus using Geneious ver. 7.1.7 (Biomatters Ltd., Auckland, New Zealand). The minimum call rate
per microsatellite locus was estimated to be 0.1 (10% missing data per microsatellite locus × isolate), and such
inferior-quality sequences, if present in a few isolates, were resequenced. Final sequences were further checked
for missing nucleotides and, if there were any, missing values were coded accordingly in the datasets. In total, 220
SNPs were used to analyse the population genetic parameters for three strata and formatted in GenAlEx 6.568
Scientific Reports | (2021) 11:17024 | https://doi.org/10.1038/s41598-021-95486-6 14
Vol:.(1234567890)You can also read