Home range and spawning migration patterns of queen triggerfish Balistes vetula in St. Croix, US Virgin Islands
←
→
Page content transcription
If your browser does not render page correctly, please read the page content below
Vol. 616: 123–139, 2019            MARINE ECOLOGY PROGRESS SERIES
                                                                                                      Published May 9
https://doi.org/10.3354/meps12944                  Mar Ecol Prog Ser

                                                                                                     OPEN
                                                                                                     ACCESS

    Home range and spawning migration patterns of
     queen triggerfish Balistes vetula in St. Croix,
                  US Virgin Islands
        David R. Bryan1, 2,*, Michael W. Feeley3, Richard S. Nemeth4, Clayton Pollock5,
                                         Jerald S. Ault1
1
 University of Miami, Rosenstiel School of Marine and Atmospheric Science, Department of Marine Ecosystems and Society,
                                   4600 Rickenbacker Causeway, Miami, FL 33149, USA
                 2
                  Pacific States Marine Fisheries Commission, 7600 Sand Point Way N.E., Seattle, WA 98115, USA
    3
        National Park Service, South Florida/Caribbean Inventory and Monitoring Network, 18001 Old Cutler Rd Suite 419,
                                                    Palmetto Bay, FL 33157, USA
         4
          University of the Virgin Islands, Center for Marine and Environmental Studies, 2 John Brewers Bay, St. Thomas,
                                                    US Virgin Islands 00802, USA
    5
    National Park Service, Buck Island National Park, 2100 Church St. #100, Christiansted, US Virgin Islands 00820, USA

         ABSTRACT: Queen triggerfish Balistes vetula are an ecologically and economically important spe-
         cies associated with coral reefs throughout the tropical Atlantic Ocean. To better understand spatial
         and temporal movement patterns and help determine the effectiveness of a no-take marine reserve
         (Buck Island Reef National Monument, BIRNM), 55 queen triggerfish were surgically implanted
         with acoustic transmitters and tracked for 434.6 ± 27.3 d (mean ± SE) within a large acoustic array
         in St. Croix, US Virgin Islands. Queen triggerfish displayed high site fidelity within the reserve dur-
         ing non-spawning months. Home range sizes, as measured by 95% minimum convex polygons and
         kernel utilization distributions, averaged 2.44 ± 0.30 and 3.34 ± 0.17 km2, respectively. High site
         fidelity was interrupted briefly during full moons from November to March (2015–2017), when 22%
         of the tagged population (n = 12) undertook repeated migrations to a nesting area located approx-
         imately 12 km from BIRNM. During the same-season spawning periods, 5 other fish were exclu-
         sively detected at a receiver station within the reserve, indicating a possible local nesting area and
         resident (non-migratory) contingent of queen triggerfish. The high site fidelity of queen triggerfish
         during non-spawning months coupled with the discovery of a resident spawning population high-
         lights the importance of BIRNM as a potential refuge from local fishing pressures. This study pro-
         vides improved understanding of queen triggerfish movement ecology, an extremely valuable asset
         for the development of spatial management strategies throughout their range.

         KEY WORDS: Movement ecology · Marine reserves · Partial migration · Fisheries management ·
         Acoustic telemetry · Balistidae · Spawning aggregation

                    1. INTRODUCTION                               2011a). For example, the movement ecology of adult
                                                                  fish, including the location and size of home ranges,
  An understanding of the temporal and spatial ex-                migratory pathways, and spawning areas, can in-
tent of reef fish movement patterns is paramount to               fluence the effectiveness of marine protected areas
successful design of spatial management strategies                (Kramer & Chapman 1999, Crossin et al. 2017). Highly
(Sale et al. 2005, Botsford et al. 2009, Grüss et al.             mobile fish with large home ranges and extensive
                                                                  © The authors 2019. Open Access under Creative Commons by
*Corresponding author: david.bryan@noaa.gov                       Attribution Licence. Use, distribution and reproduction are un-
                                                                  restricted. Authors and original publication must be credited.
                                                                  Publisher: Inter-Research · www.int-res.com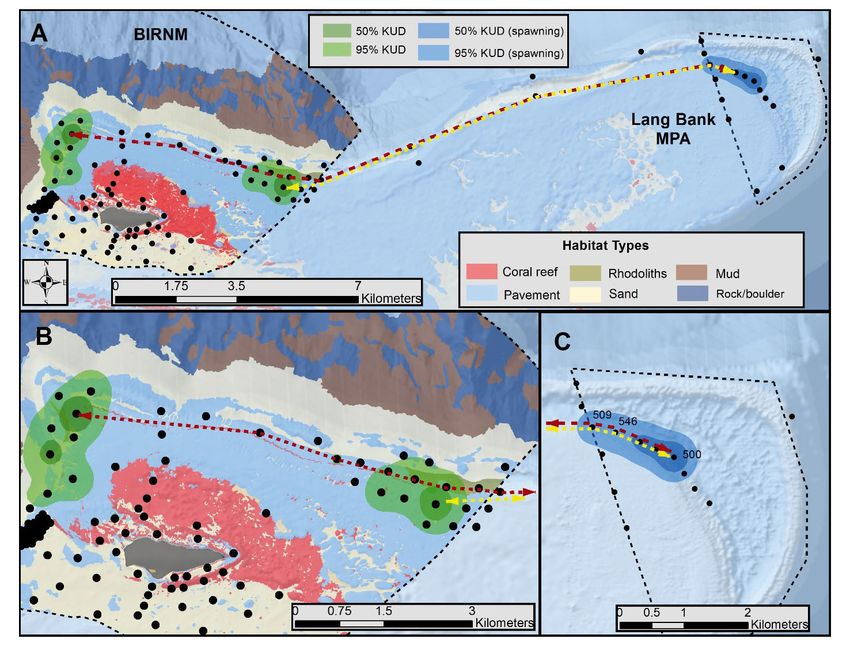
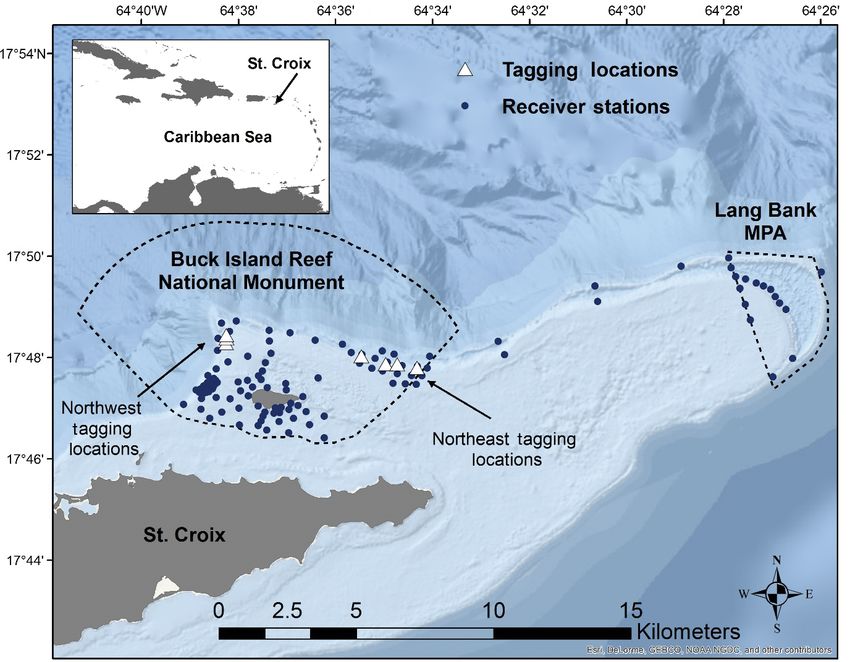
124                                       Mar Ecol Prog Ser 616: 123–139, 2019

migrations require larger protected areas to reduce            and females may spawn up to 5 times a year (Her-
exploitation in comparison to more sedentary species           nández et al. 2019). In the Gulf of Mexico, male gray
(Kramer & Chapman 1999). In recent years, acoustic             triggerfish B. capriscus build, maintain, and guard
tracking of reef fishes has provided great insight into        demersal nests during a summer spawning period
the spatial connectivity within tropical coral reef eco-       while females tend the eggs (Simmons & Szedlmayer
systems and has revealed species-specific differences          2012). Acoustic tracking and conventional tagging
in home ranges and the timing and extent of migra-             studies have indicated that gray triggerfish have
tory movements (Farmer & Ault 2011, Hitt et al. 2011,          high site fidelity and residency rates (Ingram & Pat-
Pittman et al. 2014a, Green et al. 2015, Hussey et al.         terson 2001, Herbig & Szedlmayer 2016). Anecdotal
2015, Crisafulli et al. 2018). This information can be         information also suggests that queen triggerfish ag-
used in the design of marine reserves and to predict           gregate at nesting sites where they reproduce (Kadi-
possible benefits of protected areas (Grüss et al.             son et al. 2009, Kobara et al. 2013, Hernández et al.
2011a,b, Cornejo-Donoso et al. 2017, Weeks et al.              2019), but very little is known about their movement
2017, Farmer & Ault 2018, Krueck et al. 2018).                 behaviors, including home range sizes, spawning
  Queen triggerfish Balistes vetula (Balistidae) are           activity, and migratory pathways.
an important food fish targeted by commercial, re-                St. Croix, United States Virgin Islands (USVI), is a
creational, and artisanal fishers throughout the tropi-        relatively small, isolated, tropical island located in
cal Atlantic (Tyler & Munroe 2015). Despite their              the northern Caribbean Sea, surrounded by coral
wide geographic range and economic importance,                 reefs (Fig. 1). Overexploitation of local reef fish pop-
queen triggerfish movement ecology is not well                 ulations has been reported for decades, yet fishing
understood. Their reproductive strategy includes               remains an important economic activity on the island
paired spawning, demersal eggs, territorial nests,             (Kadison et al. 2017). Queen triggerfish, which are
and parental care (Kawase 2002, Clark et al. 2015).            still relatively common on the shallow reefs (Bryan et
Queen triggerfish are sexually dimorphic, with 50%             al. 2016), are a significant component of the local fish-
of males reaching sexual maturity at significantly             ery with modest annual landings averaging 6750 kg
smaller sizes (21.1 cm fork length, FL) than females           on St. Croix and 20 100 kg on St. Thomas and St.
(24.5 cm FL) (Hernández et al. 2019). In the Carib-            John (Sagarese et al. 2018). Sustainability status of
bean Sea, they are indeterminate batch spawners,               queen triggerfish in the USVI and the effectiveness

Fig. 1. East end of St. Croix, US Virgin Islands, including Buck Island Reef National Monument and the Lang Bank marine
protected area (MPA) boundaries. Receiver stations are shown as dark blue circles and tagging locations as white triangles
Bryan et al.: Queen triggerfish migration patterns                               125

of current catch limits are not well understood (Garcia-      pending on the substrate type. Receivers at deeper
Moliner & Arnold 2013, Carruthers et al. 2014, New-           stations (>15 m) were pointed downward and sus-
man et al. 2015, Sagarese et al. 2018). However, in           pended 5 m off the bottom with a line attached to a
addition to catch limits, there is a large no-take mar-       buoy, whereas those at shallower stations (≤15 m)
ine reserve and several smaller seasonal area clo-            were placed 0.5 m off the bottom and pointed up-
sures in St. Croix that could play an important role in       ward. During the course of the study, individual
sustaining reef fish stocks (Russ & Alcala 2004,              stations were visited every 6 mo to download the
Gaines et al. 2010, Ault et al. 2013, Pittman et al.          data recorded on the receiver, replace batteries, and
2014b). In this study, we used a large acoustic array         to inspect and maintain the anchoring tackle.
to monitor the spatial and temporal movements of
queen triggerfish within and among these marine
reserves. Improved understanding of the movement                                  2.2. Range testing
patterns of queen triggerfish can help evaluate the
efficacy of marine reserves in St. Croix and guide              In 2016, we performed a range test on 6 receiver
spatial management planning throughout their range.           stations in the northwest and northeast regions of
                                                              the BIRNM array, across a variety of habitat types (i.e.
                                                              pavement, sand, rhodolith beds, and spur and groove)
          2. MATERIALS AND METHODS                            (Fig. 2). Range tests were conducted during daylight
                                                              hours with typical weather conditions and sea state
        2.1. Study site and receiver stations                 for BIRNM. Fixed delay V9-2L tags (Vemco) with 60 s
                                                              intervals were used for the range testing. Each tag
   Located off the northeast coast of St. Croix, USVI,        was placed 2 m off the bottom, to replicate the typical
Buck Island Reef National Monument (BIRNM) is a               height queen triggerfish that were observed swim-
no-take marine reserve that encompasses 10% of the            ming off bottom, at 50 m increments up to 350 m from
island’s mapped coral reef habitat (Fig. 1). BIRNM            the targeted station and left for 1 h. A detection rate
contains a wide diversity of reefs ranging from shal-         for each distance from the station was calculated by
low patch reefs to deep mesophotic ridges (Costa et           dividing the total number of observed detections by
al. 2012). To better understand habitat utilization and       the expected number of detections based on the ping
the potential connectivity of a broad range of marine         rate and the duration of the deployment. We modeled
taxa (e.g. sharks, conches, turtles, fishes), within and      the detection rates at each station and distance combi-
outside of BIRNM, the National Park Service, in col-          nation with a logistic regression, specifically a gener-
laboration with 11 partner agencies, established a            alized linear model with a binomial distribution and
relatively large acoustic array in 2014 that consisted        logit link function in R (Welsh et al. 2012, Farmer et al.
of 111 stations equipped with VR2W® passive acoustic          2013, R Core Team 2016). Estimates of the distances
receivers (Vemco) located in a variety of habitats in         (m) for 50, 25, and 10% detection probabilities within
depths ranging from 2 to 40 m (Becker et al. 2016,            the array were calculated.
Selby et al. 2016) (Fig. 1). Thirty of the 111 stations
were specifically located in the northwestern and
northeastern regions of BIRNM, where queen trigger-                               2.3. Acoustic tags
fish are common. In addition to the BIRNM acoustic
array, from 2014 to 2017 researchers at the University          To minimize handling and barotrauma stress and
of the Virgin Islands (UVI) also maintained a sea-            avoid unwanted bycatch, queen triggerfish were tar-
sonal (November−April) array of 10 to 16 VR2W®                geted with underwater hook-and-line methods and
receivers at Lang Bank in depths of 14−48 m. Lang             tagged in situ, which ensures a high survival rate
Bank is a submerged hardbottom platform located               (Tuohy et al. 2015). Fish were captured with small 1/0
12 km east of BIRNM and is a known fish spawning              circle hooks tied to 1 m of 30 lb fluorocarbon leader
aggregation site for queen triggerfish and red hind           attached a spool of abrasion-resistant Dacron line.
Epinephelus guttatus (Nemeth et al. 2007); this area          Hooks were baited with small sections of previously
is closed to all fishing from December 1 until Febru-         frozen ballyhoo Hemiramphus brasiliensis. At each
ary 28 each year and closed to trap fishing all year.         tagging site, scuba divers attracted queen triggerfish
   All receivers in the 2 arrays (BIRNM and Lang              into the area by spreading out pieces of chopped
Bank) were anchored semi-permanently to the sea               bait. Shortly after fish began to aggressively feed, a
floor with either cement blocks or sand screws de-            diver placed a baited hook into the area where fish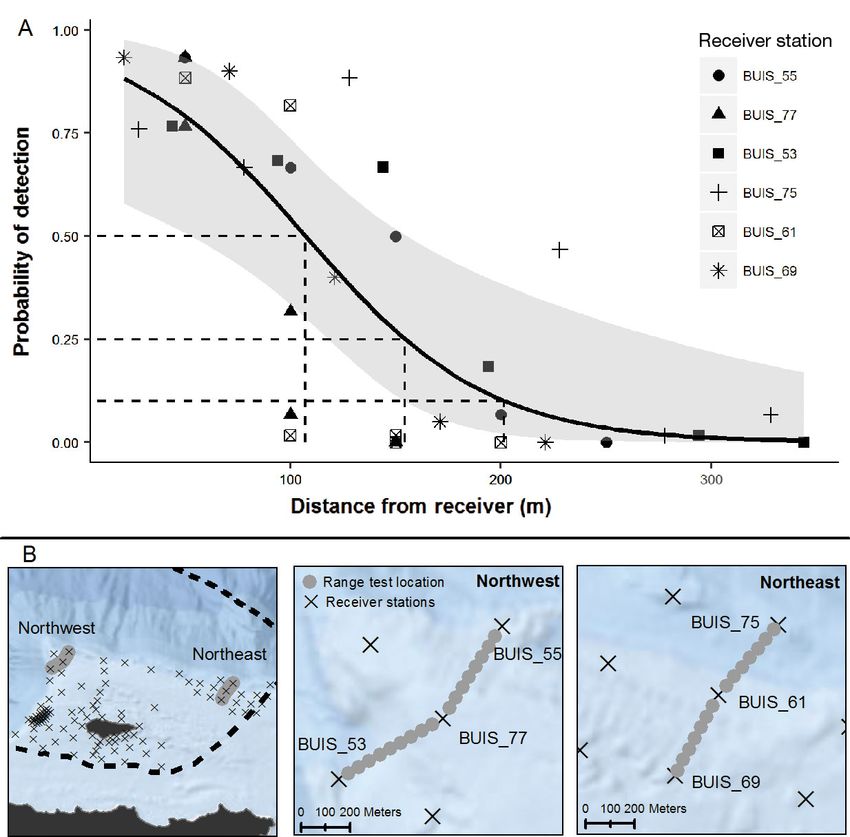
126                                         Mar Ecol Prog Ser 616: 123–139, 2019

                                                                                     Tagging locations were chosen based
                                                                                  on habitat maps and known distribu-
                                                                                  tions of queen triggerfish; these were
                                                                                  typically at 25 m depth. Tagging loca-
                                                                                  tions were divided into 2 general
                                                                                  areas, the northwest and northeast re-
                                                                                  gions of BIRNM (Fig. 1). Tagging took
                                                                                  place in April 2015 and February and
                                                                                  March 2016. Habitat in both locations
                                                                                  was similar and consisted of low-relief
                                                                                  reef pavement mixed with areas of
                                                                                  unconsolidated sediments and rhodo-
                                                                                  lith beds. In the northwest region, the
                                                                                  reef had a patchy distribution with a
                                                                                  high percent of soft coral coverage. In
                                                                                  the northeast region, the reef was lin-
                                                                                  ear with minimal biotic cover.

                                                                                                2.4. Analyses

                                                                                          Acoustic detections from tagged fish
                                                                                       were processed and summarized in the
                                                                                       R programming environment (R Core
                                                                                       Team 2016). An estimate of array fi-
Fig. 2. (A) Probability of detection by distance for all range tests fit with a gen-   delity within BIRNM was calculated by
eralized linear model (black line). Gray shading represents the 95% confi-             dividing the number of days that a fish
dence interval of the model predictions. Dashed lines indicate the predicted           was detected by the total number of
distance at 50% (107 m), 25% (154 m) and 10% (201 m) detection probabili-
ties. (B) Location of range testing sites in the northwest and northeast regions       days between the first and last detec-
           of Buck Island Reef National Monument (dark dashed line)                    tion. The analysis of queen triggerfish
                                                                                       movement and home ranges was di-
were feeding. All fish were hooked in the lip by                       vided into non-spawning (2 April to 12 November)
slowly pulling in the line when fish began to feed on                  and spawning (13 November to 1 April) time periods
the bait. Once hooked, queen triggerfish were                          based on post hoc movement analysis. The spawning
quickly pulled in and confined within a large nylon                    season was defined as starting 1 wk prior to the first
net where the surgery took place.                                      detection of a tagged fish at Lang Bank and ending
   Due to their relatively small abdominal cavity, V9-                 1 wk after the last detection at Lang Bank. Daily activ-
2L coded transmitters (Vemco) with a 9 mm diameter                     ity patterns during non-spawning months were calcu-
and 29 mm length were used to tag all queen trigger-                   lated by averaging the proportion of daily movements
fish. Transmitter power output was set to low, and                     between stations that each fish made by hour.
each tag was programmed with a 90−180 s delay to                          Hourly mean positions were calculated for each
provide an average battery life of 802 d.                              fish following the weighted arithmetic mean formula
   Once confined within the nylon net, fish were posi-                 described by Simpfendorfer et al. (2002). Hourly
tioned ventral side up to provide partial immobiliza-                  mean positions were used to calculate the center of
tion during surgery. The hook was carefully removed                    activity (COA) and to generate the home range esti-
from their lip with a hemostat. A small (< 2 cm) inci-                 mates for each fish as described below (Udyawer et
sion was made just to the side of the ventral axis, and                al. 2018). The COA was calculated by weighting the
the V9 tag was implanted into the abdominal cavity                     hourly mean positions by the number of hours at a
(Fig. 3). An absorbable vicryl suture (Ethicon) was                    position divided by the total number of hours de-
used to evenly place 2 stiches along the incision. Sur-                tected. The maximum linear distance moved during
gery time was typically < 5 min, after which the fish                  the non-spawning season from the COA was calcu-
was turned upright and allowed to immediately swim                     lated. In addition to the COA, a home station (station
away.                                                                  with maximum detections) was identified, and the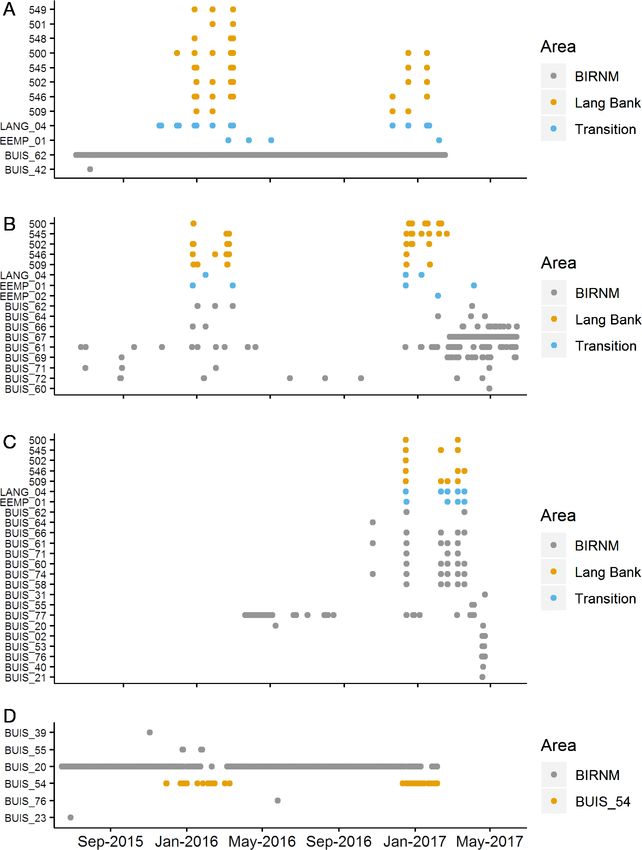
Bryan et al.: Queen triggerfish migration patterns 127
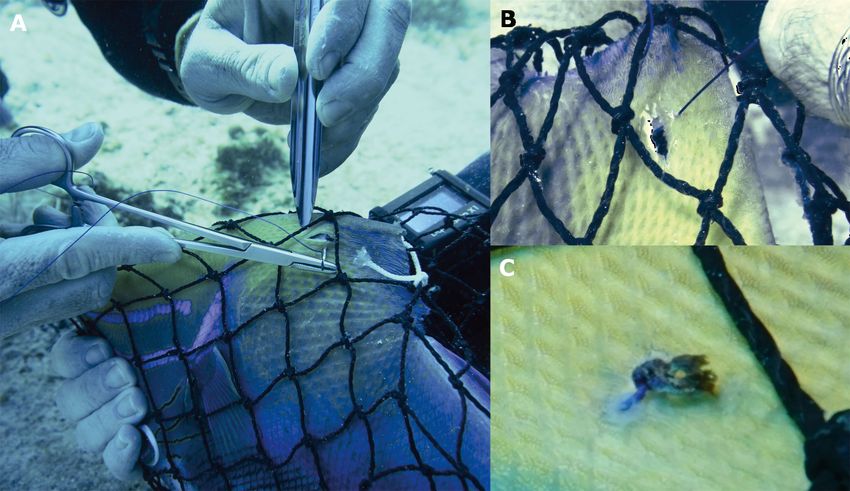
Fig. 3. Underwater surgery methods used for implanting transmitters. (A) Fish were carefully held upside down in a partially
immobilized state within a large mesh net. (B) A small < 2 cm incision was made on the side of the ventral axis allowing for the
transmitter to be placed in the abdominal cavity. Incisions were closed with an absorbable vicryl suture using 2 stitches tied
with an instrument surgeon knot. (C) Within 1 mo, one wound was found to have healed and the suture material had begun
to dissolve
percentage of total detections at the home station 3. RESULTS
was calculated. Home range estimates during the
non-spawning season were made for fish that were 3.1. Range test
detected at a minimum of 5 locations. Minimum con-
vex polygon (MCP) and kernel density estimation of Detection probabilities varied amongst receivers;
utilization distributions (KUD) were computed with for half of the stations, no detections were observed
the ‘adehabitatHR’ package in R (Calenge 2006). We when the transmitters were 150 m away from the sta-
removed 5% of the hourly locations furthest from the tion, while at 1 station there was a 6% detection rate
centroid to calculate 95% MCPs that were used as at 328 m (Fig. 2). Modeled detection probabilities
general estimations of normal home range. Estimates suggested a 50% detection rate at a distance of
of core use (50% KUD) and overall use (95% KUD) 107 m, 25% at 154 m, and 10% at 201 m (Fig. 2).
were made with the bandwidth parameter set to There was considerable variance associated with
201 m, which was the distance of the 10% detection model predictions.
rate estimated from range tests performed within the
array and likely a conservative estimate (Udyawer et
al. 2018). Differences in array fidelity, the percent of 3.2. Home range
detections at a home station, and home range size
between fish tagged in the northwest region versus In total, 60 queen triggerfish were acoustically
the northeast region were tested with a Mann- tagged in 2015 (n = 26) and 2016 (n = 34). Sizes ranged
Whitney-Wilcoxon U-test. Differences in migration from 25.5 to 38.0 cm FL (mean: 32.4 ± 0.4 cm). Two
timing were tested with a Student’s t-test. Swimming tagged fish were never detected within the BIRNM
speed over ground during migrations was calculated array, and 3 fish were tracked for less than 60 d. These
by dividing the linear distance between the last 5 fish were removed from further analyses. The aver-
station detected within BIRNM and the first station age number of days between the first and last detec-
detected at Lang Bank by the timespan between tion for the 55 fish used for this study was 434.6 ± 27.3 d
detections. Mean values throughout are presented (Table 1). Twenty-one fish were tagged in the north-
with ± standard error (SE). west region, and 34 were tagged in the northeast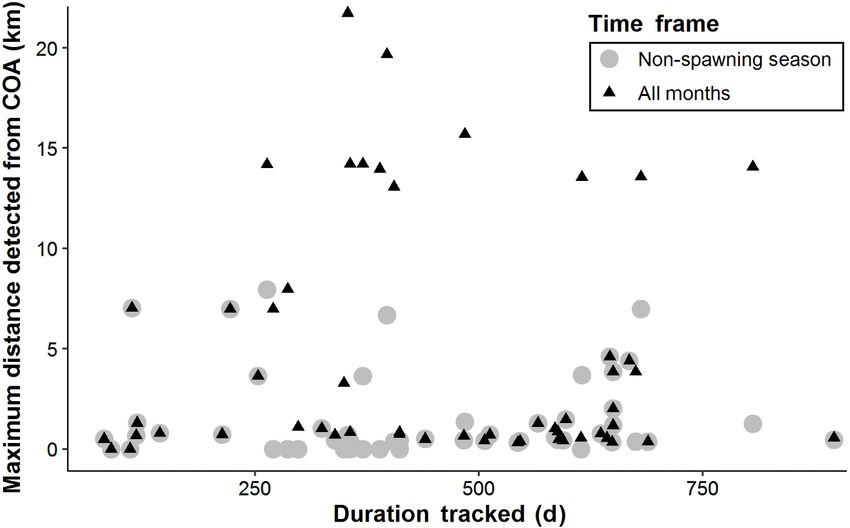
Table 1. Details of 55 queen triggerfish tracked with passive acoustic telemetry in St. Croix, US Virgin Islands, for more than 60 d between April 2015 and November
2017. Home station: station with maximum detections, COA: center of activity; MCP: minimum convex polygon; KUD: kernel density estimation of utilization distribu-
tions. MCP home range estimates were made for 19 fish that were detected at more than 5 locations; KUDs were estimated for 22 fish that were detected at a minimum
of 5 stations and more than 100 total detections. –: insufficient data
128
Fish ID Tag Tag Fork Total Migra- Days be- Total Array Detections Maximum Number of 95% 50% 95%
period location length detec- tion tween first days fidelity at home distance stations (non- MCP KUD KUD
(cm) tions detected and last detected (%) station from COA spawning area area area
detection (%) (km) season) (km2) (km2) (km2)
55223 Feb_2016 Northeast 27 8553 No 650 476 73.20 41.10 3.85 7 0.992 0.575 2.894
55230 Feb_2016 Northeast 27 1239 No 613 230 37.50 91.80 0 1
55233 Feb_2016 Northeast 27 797 – 118 84 71.20 50.30 1.3 6 2.944 0.442 3.835
55231 Feb_2016 Northeast 28 2224 – 649 155 23.90 79.00 0.35 3
59144 Apr_2015 Northeast 29 1194 Yes 364 51 14.00 98.80 0 1
59155 Apr_2015 Northeast 29 3648 Yes 459 366 79.70 93.00 1.36 5
59171 Feb_2016 Northeast 29 8 – 243 5 2.10 25.00 0 1
59556 Apr_2015 Northeast 30 4 – 243 4 1.60 50.00 0 1
55225 Feb_2016 Northeast 30.5 5742 No 649 279 43.00 82.50 2.01 8 0.992 0.308 2.415
59137 Apr_2015 Northeast 30.5 50 Yes 347 15 4.30 34.00 0 1
55229 Feb_2016 Northeast 31 1140 643 179 27.80 54.60 0.54 3
59140 Apr_2015 Northeast 31 23873 No 874 739 84.60 95.50 0.46 4 0.103 0.191 1.206
59149 Apr_2015 Northeast 31 97 Yes 335 45 13.40 61.90 0.36 2
59170 Feb_2016 Northeast 31.5 46 – 284 23 8.10 78.30 0 1
59139 Apr_2015 Northeast 32 24834 – 230 231 100.00 99.70 3.64 5 0.175 0.777
59168 Feb_2016 Northeast 32 281 – 564 94 16.70 99.30 0.49 3
59552 Apr_2015 Northeast 32 127 – 662 56 8.50 96.90 0.37 2
55226 Feb_2016 Northeast 33 2527 No 440 302 68.60 99.10 0.5 3
59148 Apr_2015 Northeast 33 46 – 277 16 5.80 97.80 0 1
59156 Apr_2015 Northeast 33 294 Yes 384 62 16.10 81.60 0.36 2
59554 Apr_2015 Northeast 33 6516 – 196 197 100.00 98.60 6.97 7 0.167 0.853
55227 Feb_2016 Northeast 34 1918 – 650 153 23.50 95.90 1.18 6 1.81 0.351 3.26
59138 Apr_2015 Northeast 34 115094 Yes 658 641 97.40 99.80 6.98 4 0.164 0.779
59150 Apr_2015 Northeast 34.5 1366 Yes 349 250 71.60 89.10 3.63 2
59141 Apr_2015 Northeast 35 789 Yes 729 158 21.70 55.90 1.27 10 3.664 0.35 4.201
59548 Apr_2015 Northeast 35 332 – 83 50 60.20 100.00 0 1
59135 Apr_2015 Northeast 36 774 No 517 250 48.40 88.20 0.31 2
59146 Apr_2015 Northeast 36 13376 Yes 241 230 95.40 99.70 7.95 5 0.167 0.784
59549 Apr_2015 Northeast 36.5 9 – 62 8 12.90 100.00 0 1
55232 Feb_2016 Northeast 37 11510 Yes 615 286 46.50 96.20 3.69 7 1.282 0.275 2.095
59145 Apr_2015 Northeast 37 2012 – 653 136 20.80 99.70 0.37 2
Mar Ecol Prog Ser 616: 123–139, 2019
59136 Apr_2015 Northeast 38 15 – 87 4 4.60 33.30 0.67 5 3.692
59553 Apr_2015 Northeast 38.5 626 – 187 140 74.90 35.60 0.73 6 1.695 0.678 3.695
55222 Feb_2016 Northeast 39 41247 No 646 430 66.60 78.00 4.6 28 4.605 0.188 1.358
55209 Mar_2016 Northwest 25.5 1521 No 411 82 20.00 97.40 0 1
55212 Mar_2016 Northwest 27 4152 – 512 282 55.10 94.60 0.71 3
55213 Mar_2016 Northwest 27 1333 No 356 200 56.20 99.60 0 1
59173 Feb_2016 Northwest 28 436 Yes 350 116 33.10 48.40 0.69 3
55210 Mar_2016 Northwest 29 184 No 546 58 10.60 57.10 0.39 2
55208 Mar_2016 Northwest 31 3229 No 81 82 100.00 99.70 0.5 3
55215 Mar_2016 Northwest 31 845 No 112 91 81.30 72.90 7.03 14 1.083 0.269 3.475
59161 Apr_2015 Northwest 31 15442 Partial 668 607 90.90 99.10 4.4 4
55207 Mar_2016 Northwest 31.5 1371 – 142 126 88.70 89.80 0.79 6 0.887 0.216 2.063
55224 Mar_2016 Northwest 31.5 3876 – 506 321 63.40 99.70 0.42 3
55217 Mar_2016 Northwest 32 510 No 483 47 9.70 78.20 0.45 2
55205 Mar_2016 Northwest 33 3469 Partial 411 361 87.80 98.50 0.41 2
55220 Feb_2016 Northwest 33.5 1640 – 596 254 42.60 78.90 1.47 6 3.4 0.358 3.632
55211 Mar_2016 Northwest 34 1403 Partial 585 162 27.70 42.60 0.59 4 1.813 0.424 2.286
55218 Feb_2016 Northwest 34 2671 No 635 171 26.90 88.10 0.77 4 0.928 0.521 2.948
59163 Apr_2015 Northwest 34 101 Partial 339 44 13.00 69.30 0.43 3
55206 Mar_2016 Northwest 35 3557 – 324 285 88.00 63.60 1.02 6 2.406 0.405 2.494
59165 Feb_2016 Northwest 35 76 Partial 587 43 7.30 68.40 0.46 3
55216 Mar_2016 Northwest 36 901 No 593 67 11.30 77.90 0.43 3 0.265 0.364 1.815
55219 Mar_2016 Northwest 36 4557 – 566 310 54.80 49.80 1.28 15 8.473 0.788 4.978
55214 Mar_2016 Northwest 37 330 Yes 397 59 14.90 35.50 6.68 12 5.288 0.564 6.087Bryan et al.: Queen triggerfish migration patterns 129
region of BIRNM. A total of 32 fish were detected home station between fish tagged in the northwest
for longer than 1 yr. The average array fidelity within or northeast locations (U = 401, p = 0.45). Not only did
BIRNM was 44.1 ± 4.4% and was not significantly dif- the fish spend a majority of their time near a single
ferent between fish tagged in the northwest (46.4%) station, but during non-spawning months (April 2 to
and northeast (43.4%) locations (U = 324, p = 0.57; November 12), they did not travel far (Fig. 4). The
Table 1). Queen triggerfish displayed strong site fi- average maximum distance traveled from their COA
delity, and for most individuals, a majority of detec- was 1.5 ± 0.3 km, and 79% of fish traveled less than
tions came from a single station. The average percent- 2 km. Movements between stations largely (87%)
age of detections at a home station was 77.9 ± 3.1%, took place between 06:00 and 18:00 h (Fig. 5).
and 21 fish had > 95% of their detections recorded at a MCP (95%) home range estimates were made for
single station (Table 1). Similar to array fidelity, there 19 fish that were detected at more than 5 locations,
was no difference in the percentage of detections at a after outlier locations were removed, during non-
Fig. 4. Maximum linear distance (km) that queen triggerfish (n = 55) moved during the non-spawning season (grey circles) and
all months (black triangles) from their center of activity (COA) compared to the number of days they were tracked
Fig. 5. Daily activity for queen triggerfish (n = 55) as measured by the mean percentage of movements by hour. Error bars = SE130 Mar Ecol Prog Ser 616: 123–139, 2019
spawning months (Table 1). The average 95% MCP 3.3. Migration
was 2.44 ± 0.30 km2. Home range estimates using
50% and 95% KUDs were made for 22 fish that were Several queen triggerfish had reduced site fidelity
detected at a minimum of 5 locations and more than during the late fall and winter, when they were
100 total detections, and the average 50% and 95% detected at Lang Bank (Fig. 6). A total of 38 migra-
KUDs were 0.36 ± 0.02 and 2.63 ± 0.19 km2, respec- tions to Lang Bank were observed for 12 individual
tively (Table 1). There was no significant difference fish during the winters of 2015/16 and 2016/17. Ten
in home range estimates (MCP, 50% KUD, and 95% of these individuals were tagged in the northeast
KUD) between fish tagged in the northwest location region of BIRNM, and 2 were tagged in the north-
versus those tagged in the northeast location (U = 70, west region. The earliest detection of a queen trig-
30, and 35, p = 0.53, 0.06, and 0.12). gerfish at Lang Bank was November 19 and the latest
Fig. 6. Daily station locations
of 4 queen triggerfish for 2 yr
(June 15, 2015 − June 15,
2017) with stations ordered
from west on bottom to east
on top and color coded by
area. Transition stations (in
blue) are those outside of
Buck Island Reef National
Monument (BIRNM) along
the northeastern reef edge of
St. Croix. (A) Fish 59138 was
tagged in the northeast re-
gion and had 99.8% of non-
spawning season detections
at its home station (BUIS_62).
(B) Fish 59141 was also
tagged in the northeast re-
gion, but it had a much
larger home range (9 sta-
tions). (C) Fish 55214 was
tagged in the northwest re-
gion, but migrated to Lang
Bank through the northeast
region and then followed the
same pathway as other fish
that were tagged in the north-
east. (D) Fish 59161 was
tagged in the northwest re-
gion and had very high site
fidelity during most of the
year, but during spawning
months it visited Stn BUIS_54,
a possible nesting siteBryan et al.: Queen triggerfish migration patterns 131
detection was March 25. In 2015/16, the greatest first detection at Lang Bank varied, but 42% of mi-
number of detections at Lang Bank occurred during 3 grations to the spawning site and 36% of homeward
full moons in late December, late January, and late migrations took place in less than 12 h. The average
February. Detections during November and March time between BIRNM and Lang Bank for this sub-
were limited to 2 fish with only 16 total detections. In set of fish was 6.74 ± 0.40 h and required a swim-
2016/2017, the greatest number of detections at Lang ming speed of 1.96 ± 0.08 km h−1. The average time
Bank was during the full moon in mid-December, for these swims was not significantly different from
mid-January, and mid-February. Similar to 2015/16, homeward trips, which took 6.34 ± 0.34 h, with an
detections during November and March were also average swimming speed of 2.05 ± 0.09 km h−1. Both
limited to 2 fish with only 11 detections. We recorded fish that migrated from the northwest region of
1 fish making 4 migrations to Lang Bank, but the BIRNM to Lang Bank were also detected in the
mode for all fish was 3 migrations. Of the fish that northeast region of the array during their migration
made migrations to Lang Bank, 60% were detected to and from Lang Bank (Figs. 6 & 7). Fish 55214 was
along the northern reef edge after leaving BIRNM detected at the same stations during repeated out-
and 42% were detected along this same path on their ward and homeward migrations at the same time of
return to BIRNM (Fig. 7). Lang Bank Stn 500, located day (± 2 h).
in 32 m depth just off the reef ridge in an area of col- On average, fish were first detected at Lang Bank
onized reef pavement near the center of the MPA, 1.3 ± 0.5 d after the full moon and were last detected
was the center of spawning activity for queen trigger- 5.3 ± 0.4 d after the full moon (Fig. 8). The arrival
fish (R. Nemeth & D. Bryan unpubl. data). The aver- pathway for most fish was past Stns 509 and 546 at
age linear distance between COAs in BIRNM and the northern end of Lang Bank (Fig. 7). Fish that
Stn 500 in Lang Bank was 15.09 ± 0.64 km (Fig. 4). were recorded during multiple migrations and that
The time between the last detection in BIRNM and were first detected at these stations showed a consis-
Fig. 7. (A,B) Resident home ranges (50 and 95% kernel density estimation of utilization distributions, KUDs) of Fish 55214 in
northwest Buck Island Reef National Monument (BIRNM) and Fish 59141 in northeast BIRNM. The migration and return path-
way for Fish 55214 is shown with a red dashed line and Fish 59141 with a yellow dashed line. (C) Combined spawning areas
(50 and 95% KUDs) for Fish 55214 and 59141 and the pathway used by both fish when entering and exiting the spawning area.
MPA: marine protected area132 Mar Ecol Prog Ser 616: 123–139, 2019 tent preference for the timing of their arrival at Lang sisted of only a single detection. This indicates that Bank. A majority of fish first arrived at Lang Bank some fish passed Stn BUIS_54 and likely spawned between 13:00 and 16:00 h in the afternoon. The pre- nearby, but in an area that was not within our detec- cise timing of departure was more difficult to deter- tion range. The fish made an average of 2.5 trips yr−1 mine, as the last station at which fish were detected to Stn BUIS_54. There was no significant difference was often neither Stn 509 nor 546. For those fish that in the average time of arrival or departure in relation were last detected at these stations, the majority left to the full moon at Stn BUIS_54 when compared to Lang Bank between 08:00 and 10:00 h in the morn- arrival and departure times at Lang Bank (t = 1.47, ing. Individual fish that were tracked at least once to p = 0.15 and t = 0.94, p = 0.35, respectively). Stn Lang Bank made an average of 2.5 ± 0.21 trips per BUIS_54 was very close to the home ranges of these season. During their time at Lang Bank, fish had an fish, and the average linear distance from their COAs average residence time of 4.0 ± 0.7 d, and individuals to Stn BUIS_54 was only 0.7 ± 0.03 km (Fig. 9). Seven were detected on average at 3.0 ± 0.4 stations. other fish that were tagged in the northwest region Two fish (59138 and 59141) that were tagged in the were also detected at Stn BUIS_54 during the spawn- northeast region and tracked for 658 and 729 d, ing season, but they had home ranges that included respectively, returned to Lang Bank in consecutive this station, so it was not possible to categorize those years (Fig. 6). Fish 59138 had extremely high site detections explicitly as an indication of spawning fidelity in BIRNM, with 99.8% of resident detections movements. occurring at a single station. Fish 59141 was detected at a greater number of stations during the non- spawning season in BIRNM, but similar to 59138, 3.4. Tag recovery returned to the same area within BIRNM after migrating to Lang Bank. At Lank Bank, Fish 59141 Two fish that had been tagged in February of 2016 entered the area near Stn 509 and then swam to- were reported captured by a local fisherman in wards Stn 500, where it typically spent most of its March and April of 2018 at Lang Bank with fish traps. time. Most queen triggerfish followed a similar spa- One fish (55227) had been tracked for 650 d in the tial pattern during their migration to Lang Bank and northeastern portion of BIRNM and had never been their time spent at Lang Bank (R. Nemeth & D. Bryan detected on Lang Bank. The other fish (59167), was 1 unpubl. data). of 2 that had never been detected within the BIRNM Despite the detection of several spawning migrations to Lang Bank from both the northeast and north- west region of BIRNM, a majority (79%) of queen triggerfish were never detected at Lang Bank. In the north- west region of BIRNM, 5 fish were exclusively detected at Stn BUIS_54, located on the northwestern corner of the array in 28 m depth, during the same time of the year when fish were detected at Lang Bank. The earliest detection was on November 29 and the latest detection was on March 26. Nineteen trips to Stn BUIS_54 were detected for these 5 fish during this time period. On average, these fish were first detected at this station 0.4 ± 1.0 d prior to the full moon and were last detected 4.3 ± 0.9 d after (Fig. 6). The average duration of a trip to Stn BUIS_54 was 4.7 ± 1.4 d. The average Fig. 8. Frequency of the time of arrival (first detection) and departure (last de- number of detections during these tection) of queen triggerfish compared to the full moon, during their migrations trips was low (7 ± 2.5), and 7 trips con- to (A,B) Lang Bank and (C,D) Stn BUIS_54
Bryan et al.: Queen triggerfish migration patterns                             133

                       Habitat Types                              A                                      B
                                                       100 m                                 100 m
                           Coral Reefs
                           Pavement
                           Rhodoliths
                                                         50 m                                    50 m
                           Sand
                                             BUIS_54                                   BUIS_54
                           Mud

                           Rock/Boulder

                            50% KUD
                            95% KUD

                   .
                   0      0.2     0.4     0.8
                                            Kilometers

Fig. 9. Home range estimates (50 and 95% kernel density estimation of utilization distributions, KUDs) for queen triggerfish
(A) 55211 and (B) 55219 during the non-spawning seasons from April 2016 until November 2017 that were tagged in the north-
west region of BIRNM. Fish 55211 was only detected at Stn BUIS_54 (circled in solid red; 201 m radius represents the predicted
distance for a 10% detection probability) during the spawning season. Fish 55219 was also detected at Stn BUIS_54 during the
spawning season, but the station was within its overall use area (95% KUD). Red dashed line indicates pathway from center
              of activity to potential spawning location. Dark dashed lines represent 50 and 100 m depth contours

or Lang Bank acoustic arrays. The capture of these                    2014, Feeley et al. 2018). High food abundance and
fish represents a minimum 2 yr fishing mortality rate                 the availability of shelter has been hypothesized as
of 3.3% for all tagged fish (n = 60) and a much higher                the reason for high site fidelity and small resident
14.3% fishing mortality rate for queen triggerfish                    home ranges for reef fish (Kramer & Chapman 1999,
known to have migrated to Lang Bank during the                        Grüss et al. 2011a, Green et al. 2015). The interface
study period (n = 14 [12 tracked plus 2 captured]).                   between reef pavement and rhodoliths, along the
                                                                      edge of the reefs near our tagging stations, may pro-
                                                                      vide ideal habitat for queen triggerfish. After the die-
                       4. DISCUSSION                                  off of long-spined sea urchins Diadema antillarum,
                                                                      which were once a main food item, queen triggerfish
   Queen triggerfish displayed persistent and high                    have been reported to feed on a range of organisms
site fidelity along with relatively small home ranges                 including crabs, chitons, polychaetes, and other echi-
during non-spawning months. For part of the tagged                    noids (Randall 1967, Reinthal et al. 1984, Turingan et
population, this movement pattern was interrupted                     al. 1995). These prey items are likely abundant in the
briefly by repeated spawning migrations from late                     diverse and productive rhodolith beds (James 2000,
fall through the winter to a transient nesting site.                  Berlandi et al. 2012), and we observed queen trigger-
High site fidelity is common to many species of reef                  fish tipping over loose rhodoliths, presumably look-
fish (Popple & Hunte 2005, Meyer et al. 2010, Top-                    ing for food. Almost 90% of the movements between
ping & Szedlmayer 2011) and has also been observed                    stations took place between 06:00 and 18:00 h, sug-
in gray triggerfish (Ingram & Patterson 2001, Herbig                  gesting that they are diurnal foragers (Turingan et al.
& Szedlmayer 2016). Home range sizes vary among                       1995). Queen triggerfish are also reported to prey
reef fish (Green et al. 2015), but the 95% KUD                        upon Caribbean spiny lobsters Panulirus argus (Weiss
(0.77−6.09 km2) of queen triggerfish was comparable                   et al. 2006), which we observed in the small ledges
to that of other similarly sized benthic carnivores                   and crevices in the adjacent reef pavement. These
(March et al. 2010, Farmer & Ault 2011, Currey et al.                 small spaces may also provide nighttime shelters
134 Mar Ecol Prog Ser 616: 123–139, 2019 for queen triggerfish. Although it is possible that the queen triggerfish could spawn 4−5 times a year. In sharp decrease in movement among stations at night both the 2015/16 and 2016/17 spawning seasons, is a result of fish moving outside of the range of December, January, and February appeared to be acoustic array, we did not observe any consistent the most active months for our tagged fish at Lang movements either away from or towards their COA Bank, with few detections in November and March. during crepuscular hours. The close proximity of for- The monthly and lunar timing of peak migration and aging grounds and sheltering areas likely explains spawning of queen triggerfish matches very closely the limited movement patterns of the fish during with the red hind (E. guttatus) and seem to aggregate non-spawning months. adjacent to red hind spawning sites, but in deeper The queen triggerfish within BIRNM appeared to sand and rubble habitats suitable for nest building exhibit a partial migration strategy, in which both (Nemeth et al. 2007, Kadison et al. 2009). resident and migratory contingents exist within the Migrating queen triggerfish appear to have a dis- population (Kerr & Secor 2012). In the migratory con- tinct pathway along the northern edge of the reef, tingent, fish with typical high site fidelity migrated to and the majority of fish arrive at Lang Bank in the Lang Bank several times from November until March same area at the same time during each migration. around the full moon. In situ observation of queen Their migratory swimming speeds (1.98 km h−1) are triggerfish nests at Lang Bank (R. Nemeth unpubl. similar to measurements made from acoustic tele- data) suggests that these movements represent metry for other reef fish during migrations. These spawning migrations. Furthermore, an examination include coral trout Plectropomus leopardus (0.66 km of queen triggerfish gonads by Hernández et al. h−1, Zeller 1998), mutton snapper L. analis (2.2 km (2019) in St. Croix indicated a potential spawning h−1, Feeley et al. 2018), Nassau grouper (1.69−1.96 km season from November to August, with the highest h−1, Starr et al. 2007, Rowell et al. 2015, Stump et al. proportion of spawning-capable females in February. 2017), and yellowfin grouper (2.03 km h−1, Rowell et Hernández et al. (2019) also found that spawning al. 2015). The 2 fish that migrated from the northwest activity was associated with the full moon, but their region of BIRNM also had a very distinct pathway sampling design did not allow them to determine the through BIRNM in which certain stations were specific timing. The correlation of migration with the passed at the same time of day, within a few hours, lunar cycle, and in particular, with the full moon, is on repeated migrations. Distinct migratory corridors common among a large number of Caribbean reef have been noted for other reef species (Mazeroll & fishes (Colin 1992, Starr et al. 2007, Heyman & Kjer- Montgomery 1998, Rhodes et al. 2012, Biggs & fve 2008, Schärer et al. 2012, Feeley et al. 2018). In Nemeth 2016). The knowledge of predictable move- the USVI, cubera snapper Lutjanus cyanopterus, dog ment patterns can be exploited by fishers to increase snapper L. jocu, Nassau grouper Epinephelus stria- their efficiency (Claro et al. 2001, Sadovy de Mitche- tus, red hind E. guttatus, and yellowfin grouper Myc- son & Erisman 2012). However, this knowledge can teroperca venenosa have all exhibited peak spawn- also be beneficial if incorporated into spatial man- ing activity directly following a full moon (Kadison et agement (Erisman et al. 2017). al. 2006, Nemeth et al. 2007, Rowell et al. 2015, Biggs A number of individuals that were consistently & Nemeth 2016). Interestingly, all of the spawning tracked were not detected at Lang Bank during the migrations reported above have been for fish with a spawning season. Three possible explanations are: broadcast spawning reproduction strategy. In con- (1) not all tagged fish were sexually mature; (2) not trast, Balistidae spawn in pairs and deposit demersal all tagged fish that migrated to Lang Bank were eggs that are guarded by either a single or both par- detected; and (3) Lang Bank is not the only nesting ents and typically hatch during the first evening or site for queen triggerfish that reside in BIRNM. All of within 24 h (Fricke 1980, Lobel & Johannes 1980, our fish were above the size at 50% sexual maturity Kawase 2002, Simmons & Szedlmayer 2012, Clark et reported by Hernández et al. (2019) in St. Croix. al. 2015). Despite this difference in reproductive However, those authors found that 100% sexual strategy, queen triggerfish also time their spawning maturity for females did not occur until 35.1−37.5 cm migrations with the full moon. Similar to other reef FL. This was close to the size of our largest fish fishes, they make multiple spawning migrations each (38.0 cm), and thus it is probable that some of our year (Kobara et al. 2013). We recorded 1 individual tagged fish were immature females. The presence of making 4 migrations to Lang Bank, but the mode for immature females in our study would help explain all fish was 3 migrations per year. This is similar to the lack of migrations for some individuals. We also the estimate by Hernández et al. (2019) that female know that at least 2 tagged fish, which were caught
Bryan et al.: Queen triggerfish migration patterns                            135

by a local fisherman, had made the migration to Lang          (Selby et al. 2016, Jossart et al. 2017). The predicted
Bank but were not detected by our acoustic array.             distance (107 m) at a 50% detection probability is
The spatial extent of the nesting grounds at Lang             similar to extensive work done by Selby et al. (2016)
Bank is unknown, and given the limited number of              within the same BIRNM array (58% detection proba-
receivers at Lang Bank and their relatively small             bility at 100 m) and that of Kendall et al. (2016) in
detection range, it is highly likely that other fish also     St. John, USVI (50% detection probability at 125 m).
had made the migration but were undetected. It is             Detection ranges can also have diurnal and seasonal
also unlikely that Lang Bank is the only queen trig-          variations which we were not able to incorporate into
gerfish nesting site on the St. Croix shelf. Within           our study due to a lack of standardized controls
BIRNM, we found 5 fish that were only detected at a           (Payne et al. 2010, Mathies et al. 2014). Variation in
station (BUIS_54) near their COAs during the late fall        detection ranges has the potential to introduce a bias
and early winter. The timing of detections and the            into the analysis or cause the misinterpretation of
temporal movement patterns of these fish were not             results (Payne et al. 2010). The increase of fish move-
significantly different from those of fish that under-        ments during daylight hours, which we have associ-
went spawning migrations to Lang Bank. We believe             ated with foraging behavior, has the potential to be
that the area around this station represents a local          an artifact of differences in detection rates. However,
nesting site and that the fish that visited this area         Selby et al. (2016) looked at temporal changes in
during the spawning season make up a resident                 detection rate within the same array in BIRNM and
contingent of queen triggerfish that do not migrate           found mixed results; at one station, detections de-
outside the BIRNM to spawn. The location of Stn               creased at night, at another they increased, and at 2
BUIS_54 in the northwest corner of the reef tract is          stations they were the same. They concluded that the
close to a significant depth drop-off that has been           temporal variability in detection range may not be uni-
considered a possible reef spawning aggregation site          form across BIRNM. Thus, we believe that on aver-
for other species (Weber & Brown 2009, Kobara et              age, detection probabilities across the BIRNM array
al. 2013). Furthermore, the positions of the other re-        are similar during the day and night and that the
ceivers and the frequency of detections for some fish         increase in movement during the day was genuine.
make it unlikely that queen triggerfish were using               Fisheries management strives for sustainable har-
this area as a pathway for a longer migration. In             vest of fish stocks through size, effort, and catch
addition to the fish that were only detected at Stn           limits while simultaneously protecting vulnerable life
BUIS_54 during the spawning season, 7 other fish              stages and essential habitats (Botsford et al. 1997).
were also detected at the station during the spawn-           In regions where harvest control rules are weak to
ing season; however, since the area was part of their         non-existent, additional protection through no-take
home range, it was not possible to definitively clas-         marine reserves can be beneficial (Lauck et al. 1998,
sify those detections as spawning related. Interest-          Hilborn et al. 2004, Ault et al. 2013). However, for
ingly, no fish that were tagged in the northeast re-          marine reserves to work, closed areas must match
gion of BIRNM migrated to the west through our                with spatial distributions and movement patterns of
array during the spawning season. The distance from           fish (Kramer & Chapman 1999, Cornejo-Donoso et al.
the northeast region to Stn BUIS_54 is roughly 6 km,          2017, Weeks et al. 2017). The discovery of both a res-
which is half the distance to Lang Bank. Instead of           ident and migratory contingent of queen triggerfish
migrating west, it is possible that there is also a local     has interesting implications for their management
nesting site in the northwest region of BIRNM that            throughout their range and is very beneficial for the
was either not covered by our receivers or was near a         population around St. Croix. Partial migratory popu-
station that was encompassed by their home ranges             lations have been described for a number of fish
and could not be separated from daily detections.             (Chapman et al. 2012a,b), and as more studies take
   An important aspect of determining residency and           advantage of new technologies to conduct long-term
home range sizes is the accuracy of an acoustic               monitoring of fish, the number of species reported to
telemetry array. Range tests revealed highly variable         use this tactic may increase (Papastamatiou et al.
detection probabilities across 6 receivers in our array       2013, Espinoza et al. 2016, Reid et al. 2018). In St.
during typical weather conditions in St. Croix. These         Croix, the large BIRNM no-take reserve (20 km2) and
results are similar to other acoustic studies on tropical     the Lang Bank seasonal closed area together provide
reefs in the USVI where environmental factors such            a comprehensive level of protection potential for
as depth, current, bottom topography, and tempera-            queen triggerfish if there is adequate enforcement of
ture all influence the detection of acoustic signals          spatial regulations and compliance by fishers (Ken-
136                                     Mar Ecol Prog Ser 616: 123–139, 2019

dall et al. 2017). Migratory queen triggerfish with         Acknowledgements. National Park Service (NPS) staff Tessa
home ranges within BIRNM are potentially only ex-           Code and Jeff Gay were a tremendous help with in situ tag-
                                                            ging operations and led the colossal task of downloading
posed to fishing pressure along their migration path-       and maintaining the acoustic array. NPS Inventory and
way to Lang Bank and in the spawning months prior           Monitoring staff, including Mikey Kent, Jeff Miller, Lee
to and after the December 1 to February 28 closure.         Richter, and Rob Warra, assisted with tagging and the range
The migration between BIRNM and Lang Bank                   testing of receivers. Ian Lundgren was instrumental in
                                                            acquiring NPS funding (PMIS 141633) for establishing the
appears to be direct for a majority of individuals and
                                                            BIRNM acoustic array. We greatly appreciate local fisher-
constitutes a minimal amount of time exposed to fish-       man Tom Daley for reporting the 2 tags that he found. We
ing mortality, since most fish arrive at Lang Bank          also thank our partners at the University of Massachusetts,
within 6 h. However, migratory queen triggerfish            National Marine Fisheries Service’s Galveston Laboratory,
                                                            US Geological Survey, and NOAA National Ocean Services
may make multiple migrations each year, and fish
                                                            Biogeography Branch for sharing acoustic receivers and
traps, which are commonly used to capture queen             data. The installation and maintenance of acoustic receivers
triggerfish, are often placed along this pathway. Dur-      on Lang Bank was assisted by University of the Virgin
ing our study period, 1 out of 12 fish that migrated to     Islands staff and students Chris Biggs, Marcia Taylor, Jona-
Lang Bank did not return to its COA, which could            than Brown, Damon Green, Sarah Heidman, and Elizabeth
                                                            Kadison. Support for this study was partially provided by
indicate fishing mortality. In addition, 2 of our origi-    the National Oceanic and Atmospheric Administration
nal 60 tagged fish were caught by a local fisherman         (MARFIN, project number: NA13NMF4330167) and the Vir-
in Lang Bank during spawning months but after the           gin Islands Experimental Program to Stimulate Competitive
seasonal closure was lifted. The capture of these fish      Research (National Science Foundation, project number:
                                                            1355437). This is contribution number 204 to the University
highlights the potential risks encountered by queen
                                                            of the Virgin Islands Center for Marine and Environmental
triggerfish that migrate outside of BIRNM to a known        Studies.
spawning site. Combined, the capture of these 2 fish
and the potential capture of the tracked fish that was
not detected after leaving Lang Bank represents a                               LITERATURE CITED
21% fishing mortality rate over 2 yr for the fish           Ault JS, Smith SG, Bohnsack JA, Luo J and others (2013)
known to have left BIRNM (n = 14), but only a 5%               Assessing coral reef fish population and community
fishing mortality rate for the entire tagged BIRNM             changes in response to marine reserves in the Dry Tortu-
population.                                                    gas, Florida, USA. Fish Res 144:28−37
                                                            Becker SL, Finn JT, Danylchuk AJ, Pollock CG, Hillis-Starr
   In contrast to the migratory spawners, a majority           Z, Lundgren I, Jordaan A (2016) Influence of detection
of the queen triggerfish that we tagged remained               history and analytic tools on quantifying spatial ecology
within BIRNM during the duration of the study. Some            of a predatory fish in a marine protected area. Mar Ecol
of these fish may have been immature, but others               Prog Ser 562:147−161
                                                            Berlandi RM, Figueiredo MAO, Paiva PC (2012) Rhodolith
likely used local nesting sites to reproduce. Little is
                                                               morphology and the diversity of polychaetes off the
known of the pelagic larval phase of queen trigger-            southeastern Brazilian coast. J Coast Res 28:280−287
fish post hatch, but increment analysis of 70 otoliths      Biggs CR, Nemeth RS (2016) Spatial and temporal move-
collected in April from newly settled juveniles in             ment patterns of two snapper species at a multi-species
Panama revealed that these fish were between 66                spawning aggregation. Mar Ecol Prog Ser 558:129−142
                                                            Botsford LW, Castilla JC, Peterson CH (1997) The manage-
and 86 d old (Robertson 1988). Recruitment patterns            ment of fisheries and marine ecosystems. Science 277:
in St. Croix are likely driven by wake flow eddies             509−515
created as the northward circulation of the Carib-          Botsford LW, Brumbaugh DR, Grimes C, Kellner JB and oth-
bean Sea comes in contact with the island (Chérubin            ers (2009) Connectivity, sustainability, and yield: bridg-
                                                               ing the gap between conventional fisheries management
& Garavelli 2016). The creation of these eddies,
                                                               and marine protected areas. Rev Fish Biol Fish 19:69−95
which could influence the local retention of recruits,      Bryan DR, Smith SG, Ault JS, Feeley MW, Menza CW (2016)
is seasonally variable, and it is unclear how the              Feasibility of a regionwide probability survey for coral
conditions during the winter months would affect               reef fish in Puerto Rico and the US Virgin Islands. Mar
                                                               Coast Fish 8:135−146
the local retention of queen triggerfish from various
                                                            Calenge C (2006) The package adehabitat for the R soft-
spawning sites (Chérubin & Garavelli 2016). It is pos-         ware: a tool for the analysis of space and habitat use by
sible that the larvae of resident queen triggerfish that       animals. Ecol Model 197:516−519
spawn in BIRNM settle outside of the reserve bound-         Carruthers TR, Punt AE, Walters CJ, MacCall A, McAllister
aries and provide an important source of recruits for          MK, Dick EJ, Cope J (2014) Evaluating methods for
                                                               setting catch limits in data-limited fisheries. Fish Res 153:
the fishery. Thus, the protection of mature fish within        48−68
BIRNM is key to supporting a sustainable local              Chapman B, Hulthén K, Brodersen J, Nilsson PA, Skov C,
fishery.                                                       Hansson LA, Brönmark C (2012a) Partial migration in
Bryan et al.: Queen triggerfish migration patterns 137
fishes: causes and consequences. J Fish Biol 81:456−478 Gaines SD, White C, Carr MH, Palumbi SR (2010) Designing
Chapman B, Skov C, Hulthén K, Brodersen J, Nilsson PA, marine reserve networks for both conservation and
Hansson LA, Brönmark C (2012b) Partial migration in fisheries management. Proc Natl Acad Sci USA 107:
fishes: definitions, methodologies and taxonomic distri- 18286−18293
bution. J Fish Biol 81:479−499 Garcia-Moliner G, Arnold B (2013) Caribbean blue tang and
Chérubin LM, Garavelli L (2016) Eastern Caribbean circula- queen triggerfish assessment. SEDAR 30, NOAA South-
tion and island mass effect on St. Croix, US Virgin east Data Assessment and Review, North Charleston, SC
Islands: a mechanism for relatively consistent recruit- Green AL, Maypa AP, Almany GR, Rhodes KL and others
ment patterns. PLOS ONE 11:e0150409 (2015) Larval dispersal and movement patterns of coral
Clark E, Nelson DR, Dreyer R (2015) Nesting sites and reef fishes, and implications for marine reserve network
behavior of the deep water triggerfish Canthidermis design. Biol Rev Camb Philos Soc 90:1215−1247
maculata (Balistidae) in the Solomon Islands and Thai- Grüss A, Kaplan DM, Guénette S, Roberts CM, Botsford LW
land. Aqua Int J Ichthyol 21:1−38 (2011a) Consequences of adult and juvenile movement
Claro R, Baisre JA, Lindeman KC, Garcia-Arteaga JP (2001) for marine protected areas. Biol Conserv 144:692−702
Cuban fisheries: historical trends and current status. In: Grüss A, Kaplan DM, Hart DR (2011b) Relative impacts of
Claro R, Lindeman KC, Parenti LR (eds) Ecology of the adult movement, larval dispersal and harvester move-
marine fishes of Cuba. Smithsonian Institution Press, ment on the effectiveness of reserve networks. PLOS
Washington, DC, p 194−219 ONE 6:e19960
Colin PL (1992) Reproduction of the Nassau grouper, Herbig JL, Szedlmayer ST (2016) Movement patterns of
Epinephelus striatus (Pisces: Serranidae) and its relation- gray triggerfish, Balistes capriscus, around artificial reefs
ship to environmental conditions. Environ Biol Fishes 34: in the northern Gulf of Mexico. Fish Manag Ecol 23:
357−377 418−427
Cornejo-Donoso J, Einarsson B, Birnir B, Gaines SD (2017) Hernández JMR, Alvarado NP, Vélez KC, Nemeth R, Appel-
Effects of fish movement assumptions on the design of a doorn R, Shervette V (2019) Queen triggerfish Balistes
marine protected area to protect an overfished stock. vetula reproductive biology in US Caribbean waters.
PLOS ONE 12:e0186309 Trans Am Fish Soc 148:134−147
Costa BM, Tormey S, Battista TA (2012) Benthic habitats of Heyman WD, Kjerfve B (2008) Characterization of transient
Buck Island Reef National Monument. Tech Memo NOS multi-species reef fish spawning aggregations at Glad-
NCCOS 142. NOAA, Silver Spring, MD den Spit, Belize. Bull Mar Sci 83:531−551
Crisafulli B, Fairclough D, Keay I, Lewis P and others (2018) Hilborn R, Stokes K, Maguire JJ, Smith T and others (2004)
Does a spatio-temporal closure to fishing Chrysophrys When can marine reserves improve fisheries manage-
auratus (Sparidae) spawning aggregations also protect ment? Ocean Coast Manag 47:197−205
individuals during migration? Can J Fish Aquat Sci, Hitt S, Pittman SJ, Nemeth RS (2011) Diel movements of
doi:10.1139/cjfas-2017-0449 fishes linked to benthic seascape structure in a Ca-
Crossin GT, Heupel MR, Holbrook CM, Hussey NE and oth- ribbean coral reef ecosystem. Mar Ecol Prog Ser 427:
ers (2017) Acoustic telemetry and fisheries management. 275−291
Ecol Appl 27:1031−1049 Hussey NE, Kessel ST, Aarestrup K, Cooke SJ and others
Currey LM, Heupel MR, Simpfendorfer CA, Williams AJ (2015) Aquatic animal telemetry: a panoramic window
(2014) Sedentary or mobile? Variability in space and into the underwater world. Science 348:1255642
depth use of an exploited coral reef fish. Mar Biol 161: Ingram GW Jr, Patterson WF III (2001) Movement patterns
2155−2166 of red snapper (Lutjanus campechanus), greater am-
Erisman B, Heyman W, Kobara S, Ezer T, Pittman S, berjack (Seriola dumeri), and gray triggerfish (Balistes
Aburto Oropeza O, Nemeth RS (2017) Fish spawning capriscus) in the Gulf of Mexico and the utility of marine
aggregations: where well-placed management actions reserves as management tools. Proc Gulf Caribb Fish Inst
can yield big benefits for fisheries and conservation. Fish 52:686−699
Fish 18:128−144 James D (2000) Diet, movement, and covering behavior of
Espinoza M, Heupel MR, Tobin AJ, Simpfendorfer CA the sea urchin Toxopneustes roseus in rhodolith beds in
(2016) Evidence of partial migration in a large coastal the Gulf of California, México. Mar Biol 137:913−923
predator: opportunistic foraging and reproduction as key Jossart J, Nemeth RS, Primack A, Stolz R (2017) Extreme
drivers? PLOS ONE 11:e0147608 passive acoustic telemetry detection variability on a
Farmer NA, Ault JS (2011) Grouper and snapper movements mesophotic coral reef, United States Virgin Islands. Mar
and habitat use in Dry Tortugas, Florida. Mar Ecol Prog Biol 164:180
Ser 433:169−184 Kadison E, Nemeth RS, Herzlieb S, Blondeau J (2006) Tem-
Farmer NA, Ault JS (2018) Accounting for detection gaps poral and spatial dynamics of Lutjanus cyanopterus
when evaluating reef fish habitat use in an acoustic (Pisces: Lutjanidae) and L. jocu spawning aggregations in
array. Can J Fish Aquat Sci 75:375−388 the United States Virgin Islands. Rev Biol Trop 54:69−78
Farmer NA, Ault JS, Smith SG, Franklin EC (2013) Methods Kadison E, Nemeth RS, Blondeau JE (2009) Assessment of
for assessment of short-term coral reef fish movements an unprotected red hind (Epinephelus guttatus) spawn-
within an acoustic array. Mov Ecol 1:7 ing aggregation on Saba Bank in the Netherlands
Feeley MW, Morley D, Acosta A, Barbera P, Hunt J, Switzer Antilles. Bull Mar Sci 85:101−118
T, Burton M (2018) Spawning migration movements of Kadison E, Brandt M, Nemeth R, Martens J, Blondeau J,
mutton snapper in Tortugas, Florida: spatial dynamics Smith T (2017) Abundance of commercially important
within a marine reserve network. Fish Res 204:209−223 reef fish indicates different levels of over-exploitation
Fricke HW (1980) Mating systems, maternal and biparental across shelves of the US Virgin Islands. PLOS ONE 12:
care in triggerfish (Balistidae). Ethology 53:105−122 e0180063You can also read