What's next for Financial Services in Canada? - Banking and the new digital era: A Commercial Real Estate Perspective - GWL Realty ...

Page created by Christopher Singh
 
CONTINUE READING
What's next for Financial Services in Canada? - Banking and the new digital era: A Commercial Real Estate Perspective - GWL Realty ...
Banking and the new digital era:
What’s next for Financial
Services in Canada?
A Commercial Real Estate Perspective
DECEMBER 2016

                                  A COLLABORATIVE REPORT FROM:
At a                                                                                     3. WHAT IS THE REAL ESTATE
                                                                                         GROWTH OUTLOOK FOR
                                                                                                                                                 5. WHY TORONTO
                                                                                                                                                 IS IMPORTANT

Glance                                                                                   FINANCIAL SERVICES?
                                                                                 It is expected that the Financial Services sector will
                                                                                 continue to be a key driver of demand for office
                                                                                                                                          Toronto continues to strengthen as a key Financial
                                                                                                                                          Services hub. Over the last 15 years, Toronto has
                                                                                                                                          accounted for over half of all Financial Service job
                                                                                 space over the long term. Short term sector growth       growth in Canada. Centralization of head office
                                                                                 however, will be at a slower pace than what has been     employment, a clustering of financial technology
             1. REPORT FOCUS                                                     seen in the past. While financial institutions con-      activity and new risk management and compliance
                                                                                 tinue to bolster their technology and compliance         functions has been driving this trend. Accordingly,
   This report between GWL Realty Advisors and                                   staff, they are also consolidating and automating        Toronto will continue to be a focal point for real
   CBRE Limited takes a detailed look at Financial                               processes where possible. Financial Services will be     estate demand for the sector. In other cities, Finan-
   Services, focusing on key trends and themes for                               defined by efficient growth going forward.               cial Services will still be an important source of
   the sector and their expected real estate impacts.                                                                                     office demand, but industries such as Technology,
                                                                                                                                          Health Care and Professional and Business Ser-
                                                                                                                                          vices are expected to play increasingly larger roles.
                                                                                        4. THE IMPACT OF
                                                                                        TECHNOLOGY
                2. HOW WELL IS THE
                CANADIAN FINANCIAL                                               Technology continues to play an important but
                                                                                 complex role in the sector. Financial institutions are
                SERVICES SECTOR
                PERFORMING?                                                      investing significant amounts of capital to modern-             6. WHAT ARE THE
                                                                                 ize operations due to the rise of digital technologies          IMPLICATIONS?
   Generally, the Financial Services sector is in a stage                        and a changing consumer demographic. A new
   of slow but stable growth in terms of financial                               category of financial technology or “Fintech” firms      For real estate managers and investors, there is a
   performance and employment. The sector added                                  have also emerged, changing the composition of           wide range of market opportunities and recom-
   35,200 new jobs over the last five years represent-                           the industry. As for the expected impact of Fintech,     mendations. A focus on accommodating changing
   ing a 5.1% growth rate. This is in contrast to the                            some firms are competitive to traditional financial      workplace strategies will be integral. New devel-
   pre-Global Financial Crisis total of 98,300 new jobs                          institutions, while some are collaborative—there is      opment, as well modernization of existing office
   and 17.8% growth from 2003-2008. New risk man-                                no single path as to how the sector will evolve. Over-   assets will be important to this strategy. With
   agement and compliance rules, as well as a slower                             all, a key expectation is that the Financial Services    Financial Services becoming more technological-
   Canadian economy continue to impact sector ex-                                sector will become more technologically-oriented.        ly-oriented, a wider range of office space that will
   pansion. As such, a focus on operational efficiency                           Finance and technology are becoming increasingly         be in demand from tenants. This will have impli-
   remains a top priority for the sector with invest-                            integrated and the sector is expected to act more like   cations on how and where real estate investors
   ments in technology a key aspect of that strategy.                            technology firms in terms of innovation, employee        should position themselves in the future.
                                                                                 retention/attraction and workplace strategies.

2 | Banking and the new digital era: What’s next for Financial Services in Canada?                                                                                  GWL Realty Advisors | CBRE Limited
Introduction: Financial
          Services—A Diverse
          and Complex Industry
          This report between GWL Realty Advisors and CBRE Limited
          takes a detailed look at Financial Services, focusing on key
          trends and themes for the sector and their expected real estate
          impacts. Key to this report is an understanding of sector prior-
          ities and structural changes that will impact Financial Services
          over the long term. The Financial Services sector is comprised
          of three major industries (Banking, Investments and Insurance)
          and is a major source of office demand across Canada. Pri-
          mary and secondary research, as well as interviews with leas-
          ing agents, consultants and industry experts formed the basis
          of our report findings.

3 | Banking and the new digital era: What’s next for Financial Services in Canada?   GWL Realty Advisors | CBRE Limited
The Financial Services sector is an important compo-
nent of the Canadian economy, accounting for a major
source of job growth and economic output. Accounting
for over 720,000 direct jobs in Canada—4.0% of national                                         DEFINING THE FINANCIAL
employment—the sector also accounts for a quarter of
the profits generated in the private sector (Burt, 2015).
                                                                                                SERVICES SECTOR
Comprised of a wide range of industries such as Bank-
ing, Securities, Portfolio Management and Insurance,
the Financial Services sector plays a key role in credit                             Based on Statistics Canada, three major         INVESTMENT (NAICS 523): The Investment
intermediation and capital management activities.                                    industries comprise the Canadian Financial      category has the smallest share of employ-
Like many other business industries, a myriad of com-                                Services sector: 1) Banks, 2) Insurance and     ment at 17.1% of total Financial Services
peting, diverse and complimentary factors influence how                              3) Investment. These categories are based       sector jobs (totalling over 120,000 people).
Financial Service firms are expected to operate and grow                             on standard NAICS (North American Indus-        This industry is quite diverse and includes
in the future. The Global Financial Crisis brought about
                                                                                     try Classification System) codes:               investment banking and securities broker-
a new era of tougher regulation and compliance for the
global banking system, while the Canadian economy, in                                                                                age, commodities/exchanges and portfolio
                                                                                     BANKS (NAICS 522): The Banking industry
its low and slow state, continues to impact sector growth.                                                                           management.
                                                                                     is the largest among the three, making up
Technological innovation is a key priority as the sector
embraces a new digital economy and an increasingly on-                               over 360,000 jobs and 51.4% of Financial        It is important to note that the Real Estate
line customer base. Labour retention and attraction are                              Services employment. Major banks and            and Leasing industry is not formally a part
also important as Financial Services continue to compete                             credit unions make up a majority of this        of the Financial Services sector. However,
with other sectors of the Canadian economy for talent,
                                                                                     industry. Also within this category are firms   at the Census Metropolitan Area (CMA)
especially among the growing millennial workforce.
                                                                                     involved in credit issuance, financing, lend-   level, Real Estate and Leasing does form the
As a result of these factors, the Financial Services sector
                                                                                     ing and mortgages, and financial transac-       larger Finance, Insurance and Real Estate
is expected to chart a new path with their commercial
real estate occupancy needs and workplace strategies.                                tion processing and clearing.                   (FIRE) industry sector as defined by Statis-
Efficient growth will define the Financial Services sector                                                                           tics Canada.
                                                                                     INSURANCE (NAICS 524): The Insurance in-
moving forward as they focus on operational efficiency
while accommodating technological advancement. For                                   dustry is the second largest within the sec-
real estate investors and managers, this means position-                             tor with an estimated 220,000 employees
ing themselves in the right locations and assets that are                            making up 31.4% of the Financial Services
best suited to accommodate this change.
                                                                                     sector. This industry includes insurance                      Source: Statistics Canada Survey of Employee Payroll
                                                                                     providers as well as insurance brokers and                         and Hours (SEPH); data as of September 2016

                                                                                     intermediaries.

4 | Banking and the new digital era: What’s next for Financial Services in Canada?                                                                                 GWL Realty Advisors | CBRE Limited
Key Trends Driving the
          Financial Services Sector
          With the Global Financial Crisis still a fresh
          memory, the Canadian Financial sector moves
          into a new phase defined by slow but stable
          growth with a focus on operational efficiency to
          drive profits. A relatively stagnant global econo-
          my and new rules impacting the ways financial
          firms conduct their lending and investment activi-
          ties have shifted operational strategies. Improve-
          ments in technology, risk management and talent
          retention are key focus areas.

5 | Banking and the new digital era: What’s next for Financial Services in Canada?   GWL Realty Advisors | CBRE Limited
WHAT IS DRIVING                                                       New emphasis on compliance,
                                                                      regulation and risk management
                                                                                                                                                          FIG. 1:           FINANCIAL PERFORMANCE INDICATORS: CANADIAN BANKS
                                                                                                                                                                            AND OTHER CREDIT INTERMEDIARIES

THE FINANCIAL                                                         One factor shaping the Financial Services sector                                                                          2002-2007:
                                                                                                                                                                                                Strong economic
                                                                                                                                                                                                                                             2008-2010:
                                                                                                                                                                                                                                             Global Financial
                                                                                                                                                                                                                                                                                            2011-2016:
                                                                                                                                                                                                                                                                                            Slow growth
                                                                                                                                                                                                                                                                                                                                                      Q2 2016
                                                                                                                                                                                                                                                                                                                                                      Performance
SERVICES SECTOR?                                                      has been a heightened regulatory environment
                                                                      since 2010. Insolvency among major global banks
                                                                                                                                                                                                expansion in
                                                                                                                                                                                                Canada
                                                                                                                                                                                                                                             Crisis - credit,
                                                                                                                                                                                                                                             liquidity freeze
                                                                                                                                                                                                                                                                                            economy, commodity
                                                                                                                                                                                                                                                                                            slowdown and low
                                                                                                                                                                                                                                                                                                                                                      (12-month
                                                                                                                                                                                                                                                                                                                                                      trend)
                                                                                                                                                                                                                                                                                            interest rates
The Canadian Financial Services sector continues                      due to inadequate capital levels was a common
to witness significant change. Highlighted in this                    theme during the Global Financial Crisis. Since                                        Average Annual
section are key trends driving the sector and their                   then, stricter regulations and the introduction of                                     Return on Equity                   9.7%                                         7.7%                                           9.1%                                                      8.8%
expected real estate impacts based on research                        Basel III1 in 2010 have resulted in banks and re-
                                                                                                                                                             Average Annual
and dialogue with industry experts.                                   lated groups bolstering their compliance and risk
                                                                      management capabilities while also adding more
                                                                                                                                                             Operating Profit
                                                                                                                                                             Growth
                                                                                                                                                                                                13.7% -3.4% 7.3%                                                                                                                                      0.1%
A phase of slow but stable growth                                     conservatism to lending practices. As a result,
                                                                                                                                                             Average Annual
In the aftermath of the Global Financial Crisis,
the Canadian financial system was revered for
                                                                      compliance and risk management employment
                                                                      at financial institutions has grown substantially
                                                                                                                                                             Operating
                                                                                                                                                             Revenue Growth
                                                                                                                                                                                                6.7%                                         -3.6% 3.6%                                                                                               0.6%
its stability. Canadian banks, supported by high                      since the Basel III introduction in 2010, phase-in
capital levels, strong balance sheets and strict                      in 2013 and full adoption in 2015.                                                                                                      Source: Statistics Canada (NAICS 5221,5222, 5223 Combined - CANSIM Table 187-0002), 2016.

lending practices, showed their resilience through
the worst global recession in decades. In contrast,
bail-outs, bankruptcies and mergers defined                               As a whole, Canadian banks
the Banking industry in many other parts of the                           responded to the slowing                                                        FIG. 2:            NATIONAL FINANCIAL SERVICES OPERATING PROFITS
                                                                                                                                                                             (ALL SECTORS)
world—a trend that still reverberates in the mar-                         economy, restructuring                                                                  $35,000                                                                                                                                                                                                           40%
ket today.                                                                some operations to increase                                                             $30,000                                                                                                                                                                                                           30%
The years leading up to the credit crisis (2002-                          efficiencies, streamline their                                                          $25,000                                                                                                                                                                                                           20%
2007) were a period of strong financial perfor-                           cost base and become fitter,
mance for the industry - profit growth and return                         faster organizations. They will                                                         $20,000                                                                                                                                                                                                           10%

                                                                                                                                                          ($MM)
on equity, important metrics tracking profitabil-                         most likely continue to do so                                                           $15,000                                                                                                                                                                                                           0%
ity for Canadian banks, was 13.7% and 9.7%,
respectively (Figure 1). This is the converse of the
                                                                          by keeping their focus on core                                                          $10,000                                                                                                                                                                                                           -10%

years during (2008-2010) and since (2011-2016)                            productivity measures and                                                                $5,000                                                                                                                                                                                                           -20%

the Global Financial Crisis where growth has been                         increased risk management.                                                                  $0                                                                                                                                                                                                            -30%
more modest. Streamlining operations by phasing                           – PWC (2016) Embracing the Fintech Movement
                                                                                                                                                                  -$5,000                                                                                                                                                                                                           -40%
out inefficient or declining business lines, merg-

                                                                                                                                                                            Q1 2002
                                                                                                                                                                                      Q4 2002
                                                                                                                                                                                                Q3 2003
                                                                                                                                                                                                          Q2 2004
                                                                                                                                                                                                                    Q1 2005
                                                                                                                                                                                                                              Q4 2005
                                                                                                                                                                                                                                        Q3 2006
                                                                                                                                                                                                                                                  Q2 2007
                                                                                                                                                                                                                                                            Q1 2008
                                                                                                                                                                                                                                                                      Q4 2008
                                                                                                                                                                                                                                                                                Q3 2009
                                                                                                                                                                                                                                                                                          Q2 2010
                                                                                                                                                                                                                                                                                                    Q1 2011
                                                                                                                                                                                                                                                                                                              Q4 2011
                                                                                                                                                                                                                                                                                                                        Q3 2012
                                                                                                                                                                                                                                                                                                                                  Q2 2013
                                                                                                                                                                                                                                                                                                                                            Q1 2014
                                                                                                                                                                                                                                                                                                                                                      Q4 2014
                                                                                                                                                                                                                                                                                                                                                                Q3 2015
                                                                                                                                                                                                                                                                                                                                                                          Q2 2016
ing complimentary departments and consolidat-
ing labour where possible continues to be a trend                     1
                                                                        Basel III is a global, voluntary framework on capital adequacy, stress testing
                                                                      and liquidity risk and measures the amount of capital a financial institution                                             Insurance              Investment & Securities                                                                                              Banks
for the industry given current profit patterns.                       must hold relative to leverage, as well as the ability to convert assets to cash.
                                                                      Exceeding the tests suggest firms are able to withstand economic and financial                                            % Change (Y/Y) - 4 Qtr Average Rolling
                                                                      market shocks in the future. Canadian Financial Institutions—although all ready
                                                                      well exceeding minimum standards—adopted Basel III rules for capital and
                                                                      liquidity officially in 2015.                                                                                                                 Source: Statistics Canada (NAICS 522, 523, 524 Combined - CANSIM Table 187-0002), 2016.

6 | Banking and the new digital era: What’s next for Financial Services in Canada?                                                                                                                                                                                    GWL Realty Advisors | CBRE Limited
Managing international exposure                                                  The digital economy is bringing a
A key trend for Canadian Financial Service firms over                            major shift to financial services. My                    FIG 3:   ESTIMATED SHARE OF NON-DOMESTIC
the last 15 years has been their tremendous growth                               view is that in less than five years,                             REVENUE SOURCES - MAJOR CANADIAN
                                                                                                                                                   BANKS (2014):
internationally. Major Canadian financial institutions                           the financial services industry won’t
now derive 20 - 50% of their revenue from non-domestic                           be the same as it is today. That puts
sources (Figure 3). Financial institutions have achieved                                                                                   CIBC
this through foreign direct investment, including acqui-
                                                                                 a lot of pressure on us and the other
sitions of existing firms or through the export of Finan-                        financial institutions to adjust, adapt
cial Services. Financial Service exports in particular, have                     and change.                                               BMO
more than tripled since 1999. Today, Canadian financial                          - Monique F. Leroux CEO Desjardin Group – From
institutions are carefully managing this expansion, rec-                         PWC Canadian Banks 2015                                   TD
ognizing that the diversification has provided a signifi-
cant revenue stream, but with added risk exposure.                                                                                         RBC
                                                                             Talent attraction and retention
The digital economy
                                                                             Talent attraction and retention continues to be a key         SCOTIABANK
An increasingly tech-savvy customer base is changing
                                                                             priority for the Financial Services sector. Recent studies
how financial institutions think about their marketing
                                                                             highlight that emerging knowledge industries such as         0%       10%     20%        30%                40%                 50%
and technology investments. In similar respects to what
                                                                             Technology and Life Sciences appear to be gaining ground                                    Source: Conference Board of Canada, 2015.
is happening in the retail sector, e-commerce and mobile
                                                                             on Finance in terms of job recruitment among graduates
communications are changing how customers conduct
                                                                             and millennial professionals. This poses a challenge for
their banking, insurance and investment activities.
                                                                             Financial Service firms, especially as they begin to grow
                                                                             their expertise in technology, digital communications and
   We’re in the technology business.                                         risk management (Universum, 2016).
     - Brian Porter, CEO, Scotiabank (2016)
                                                                             Accordingly, the Financial Services sector is looking at
Financial institutions accordingly, are starting to invest                   a wide variety of ways to attract and retain talent with a
significant amounts of capital to modernize operations.                      focus on employee lifestyle, amenities and socialization.
Big data is allowing firms to track financial markets                        Given that office space is the physical outcome of these
and their customers better. Software innovations are                         strategies, Financial Service firms are looking at more
streamlining operating processes and automating simple                       flexible, collaborative office environments while also
analytical tasks. Innovations in digital communications                      embracing health and wellness and sustainability initia-
are making financial transactions more efficient. While                      tives (CBRE, 2016). Collaboration is also an important
costly, financial institutions are recognizing that these                    consideration, and Financial Service firms are exploring
investments in technology are critical in order to keep                      new ways to attract talent—university partnerships and
pace with their customers. Staffing efforts are also reflec-                 digital innovation labs are notable examples as will be
tive of this shift—financial institutions now emphasize                      highlighted in the next section of this report.
their need to hire roles in software, media and data sci-
ence (Universum, 2016). The digital economy accordingly
is shifting the Financial Services sector towards more
progressive, technologically-based operational strategies.

7 | Banking and the new digital era: What’s next for Financial Services in Canada?                                                                           GWL Realty Advisors | CBRE Limited
NATIONAL EMPLOYMENT TRENDS
Mirroring Financial Services sector profits and revenues,                                    cities. This trend is largely reflective of the ongoing shift                              FIG. 4:            ANNUAL FINANCIAL SECTOR EMPLOYMENT
                                                                                                                                                                                                           GROWTH, CANADA
national Financial Services sector employment has grown                                      towards creative, knowledge work across Canada. Con-                                                          (EMPLOYMENT 12-MONTH ROLLING AVERAGE)
at a slower pace in the last several years. Looking at Figure                                versely, Toronto’s Financial Service sector has grown at a                                 5.0%
4, which shows the annual employment growth rate of the                                      pace well above the national average, adding 78,000 jobs                                   4.5%
entire Canadian Financial Services sector, growth since 2011                                 since 2006 and representing a 27.2% growth rate. Cana-                                     4.0%
                                                                                                                                                                                        3.5%
has averaged just 0.9% annually. This is markedly lower in                                   da as a whole has only grown by 9.0% over the same time                                    3.0%
comparison to the 10-year annual average of 1.9% and the                                     period. To put this into further context, when compared                                    2.5%
pre-recession (2003-2008) average of 2.5%. With the Finan-                                   to other major cities, Toronto now accounts for 32.0% of                                   2.0%
                                                                                                                                                                                        1.5%
cial Services sector accounting for over 8.0% of all services                                all national FIRE employment, followed by Montreal and                                     1.0%
employment, this current growth trajectory has implications                                  Vancouver with 12.2% and 8.7%, respectively (Figure 8).                                    0.5%
for real estate demand going forward.                                                                                                                                                   0.0%
                                                                                             Overall, Toronto continues to reinforce itself as a major

                                                                                                                                                                                                 2003
                                                                                                                                                                                                           2004
                                                                                                                                                                                                                   2005
                                                                                                                                                                                                                            2006
                                                                                                                                                                                                                                     2007
                                                                                                                                                                                                                                                2008
                                                                                                                                                                                                                                                       2009
                                                                                                                                                                                                                                                                2010
                                                                                                                                                                                                                                                                            2011
                                                                                                                                                                                                                                                                                   2012
                                                                                                                                                                                                                                                                                           2013
                                                                                                                                                                                                                                                                                                     2014
                                                                                                                                                                                                                                                                                                             2015
                                                                                                                                                                                                                                                                                                                      YTD 2016
At the regional level however, diverging employment                                          financial hub. This is mainly supported by four trends
trends are also apparent. Financial Services in cities such                                  based on analysis findings: 1) ongoing consolidation
as Montreal and Vancouver have been losing their share                                       nationally of head-office positions, 2) centralization and                                                                                  Source: Statistics Canada (CANSIM Table 281-0023), September 2016.
of regional employment to other faster growing service                                       expansion for technology and digital economy roles, 3)
industries. In particular, Business and Professional ser-                                    domestic management of foreign affiliates and services
vices, Healthcare and Technology are growing faster than                                     exports and 4) growth in compliance and risk manage-
Financial Service employment and also now command                                            ment functions.
a larger share of total employment in these and other

FIG. 5:    AVERAGE ANNUAL FINANCIAL SERVICES JOB GROWTH                                                                       FIG. 6:           FIRE EMPLOYMENT AS A % OF TOTAL SERVICE EMPLOYMENT
           TOP CMAS BY TIME PERIOD
 8%                                                                                                                           14%
 4%                                                                                                                           12%
                                                                                                                              10%
 0%
                                                                                                                               8%
-4%                                                                                                                            6%

-8%                                                                                                                            4%

                                                                                                                                                                                                                                                                                          SEP-2014

                                                                                                                                                                                                                                                                                                      SEP-2015

                                                                                                                                                                                                                                                                                                                    SEP-2016
                                                                                                                                                                                                                                                                 SEP-2012

                                                                                                                                                                                                                                                                              SEP-2013
                                                                                                                                                                                                                                     SEP-2010

                                                                                                                                                                                                                                                   SEP-2011
                                                                                                                                                                                                            SEP-2008

                                                                                                                                                                                                                          SEP-2009
                                                                                                                                     SEP-2002

                                                                                                                                                  SEP-2003

                                                                                                                                                             SEP-2004

                                                                                                                                                                        SEP-2005

                                                                                                                                                                                     SEP-2006

                                                                                                                                                                                                SEP-2007
           VAN           CAL         EDM               TOR                 OTT                MTL
                                                                                                                                                Vancouver                          Calgary                        Edmonton
                 2016 YTD       2011 -2015          2008 -2010              2003 -2007
                                                                                                                                                Toronto                            Ottawa                         Montreal
                                          Source: Statistics Canada (CANSIM Table 282-0130), September 2016.
                                                                                                                                                                                                                                         Source: Statistics Canada (CANSIM Table 282-0130), September 2016.

8 | Banking and the new digital era: What’s next for Financial Services in Canada?                                                                                                                                                                            GWL Realty Advisors | CBRE Limited
FIG. 7:          SELECT INDUSTRIES AS A % OF TOTAL SERVICE EMPLOYMENT
                                                                                                              (BUSINESS SERVICES, PROFESSIONAL SERVICES, HEALTH CARE AND INFO-CULTURE)
                                                                                             40.0%

INDUSTRY OUTLOOKS                                                                            37.5%
Banking:
                                                                                             35.0%
Banks as a whole have grown by 13.1% the last 10 years, representing a net gain of
42,000 jobs. Most of this growth took place prior to the Global Financial Crisis – aver-
age annual employment growth from 2003 to 2008 was 2.7%, compared to 0.4% from               32.5%
2011 to 2016 (Figure 9). Employment data through company filings for the six largest
banks in Canada confirms this trend: bank employment has slowed the last several
                                                                                             30.0%
years and is well below the pace of growth seen prior to 2009 (Figures 10 - 11). Average                 Vancouver                  Calgary          Edmonton              Toronto                  Ottawa                 Montreal
job growth among the major banks between 2011 and 2015 has been 3.1%, slower
than the 5.0% growth experienced from 2005 to 2009.                                                                                          2001            2006                2011                   2016
                                                                                                                                                                 Source: Statistics Canada (CANSIM Table 282-0130 - Data as of September 2016)

Insurance:                                                                                   FIG. 8:          NATIONAL FIRE EMPLOYMENT SHARE BY CMA

In contrast to banking, the insurance sector has grown at a much steadier pace the                                                                      Toronto, ON
last decade. From 2003 to 2008, average annual employment growth was 1.8%, just                                                                         Montréal, QC
above the 2011 to 2016 average of 1.7% (Figure 9). Over the 10 year period, the sector                   32.2%                         32.0%
                                                                                                                                                        Vancouver, BC
has added 33,000 new jobs representing 18.0% growth in total employment. Typically                                                                      Calgary, AB
considered a more mature, stable and slow growth industry, the insurance sector has                                                                     Edmonton, AB
benefitted from emerging business lines such as cyber security and risk management                                                                      Ottawa-Gatineau, ON/QC
according to PwC (2016) and EY (2016).                                                                                                                  Québec, QC
                                                                                                2.3%                                 12.2%
                                                                                                                                                        Winnipeg, MB
Investments:                                                                                        2.4%
                                                                                                       3.0%
                                                                                                                             8.7%
                                                                                                                                                                                             Source: Statistics Canada (CANSIM Table 282-0130,
                                                                                                              3.3%                                      Rest of Canada                                              282-0131), September 2016.
                                                                                                                     3.8%
Investments, the smallest industry in the Financial Services sector, posted strong 10 year
total growth of 24% or 23,000 net jobs. However, in similar respects to banking, most of     FIG. 9:          AVERAGE FINANCIAL SERVICE EMPLOYMENT GROWTH BY SECTOR
the growth has been prior to the Financial Crisis. Average annual employment growth be-                       (Y-O-Y, 12-MONTH ROLLING AVERAGE)
tween 2003 and 2008 was 3.4%, compared to 0.9% from 2011 to 2016 (Figure 9). Notably,        15%
the 12-month average (to September 2016) was -0.7% for the industry.
                                                                                             10%
There appears to be a tale of two markets emerging within the Investments industry:
groups tied to trading and securities continue to face challenges with growth, while
portfolio management continues to expand. The rise of automated trading platforms             5%
putting downward pressure on fees, the rise of well capitalized traditional banks as
direct competitors, and ongoing volatility in core business industries such as energy         0%
and mining continue to impact the Investment sector (Kiladze, 2016; McGee, 2016).
According to data from the Investment Industry Association of Canada, 25.0% of
investment firms have closed or been acquired in distress since 2013 (Schecter, 2016).
                                                                                             -5%
Conversely, in relation to portfolio management, global assets under management
                                                                                                                            Banks              Investments             Insurance
will grow from $63.9 trillion in 2016 to $101.7 trillion by 2020 according to PwC            -10%
(2014). Portfolio management accordingly continues to grow along with expansion of
                                                                                                Sept 2003

                                                                                                Sept 2004

                                                                                                Sept 2005

                                                                                                Sept 2006

                                                                                                Sept 2007

                                                                                                Sept 2008

                                                                                                Sept 2009

                                                                                                Sept 2010

                                                                                                Sept 2011

                                                                                                Sept 2012

                                                                                                Sept 2013

                                                                                                Sept 2014

                                                                                                Sept 2015

                                                                                                Sept 2016
                                                                                                Mar 2004

                                                                                                Mar 2005

                                                                                                Mar 2006

                                                                                                Mar 2007

                                                                                                Mar 2008

                                                                                                Mar 2009

                                                                                                Mar 2010

                                                                                                Mar 2011

                                                                                                Mar 2012

                                                                                                Mar 2013

                                                                                                Mar 2014

                                                                                                Mar 2015

                                                                                                Mar 2016
global asset management activities.

                                                                                                                                                                           Source: Statistics Canada (CANSIM Table 282-0130), September 2016.
9 | Banking and the new digital era: What’s next for Financial Services in Canada?                                                                                              GWL Realty Advisors | CBRE Limited
FIG. 10: TOP SIX CANADIAN BANKS – ANNUAL EMPLOYMENT CHANGE                                                                    FIG. 11: MAJOR CANADIAN BANK EMPLOYMENT, U.S. AND

FIG10
                                                                                                                                                         CANADA, (TD, RBC, BMO)

                 10%                                                                                                                            140,000

                  8%                                                                                                                            120,000

                  6%                                                                                                                            100,000

                  4%                                                                                                                             80,000

                  2%                                                                                                                                                                                                                                  Canada
                                                                                                                                                 60,000
                  0%                                                                                                                             40,000
                  -2%                                                                                                                                                                                                                                         U.S.
                                                                                                                                                 20,000
                  -4%                                                                                                                                     -
                        2000

                               2001

                                      2002

                                             2003

                                                    2004

                                                           2005

                                                                  2006

                                                                         2007

                                                                                2008

                                                                                       2009

                                                                                              2010

                                                                                                     2011

                                                                                                            2012

                                                                                                                    2013

                                                                                                                             2014

                                                                                                                                     2015

                                                                                                                                                          1999
                                                                                                                                                                 2000
                                                                                                                                                                        2001
                                                                                                                                                                               2002
                                                                                                                                                                                      2003
                                                                                                                                                                                             2004
                                                                                                                                                                                                    2005
                                                                                                                                                                                                           2006
                                                                                                                                                                                                                  2007
                                                                                                                                                                                                                         2008
                                                                                                                                                                                                                                2009
                                                                                                                                                                                                                                       2010
                                                                                                                                                                                                                                              2011
                                                                                                                                                                                                                                                     2012
                                                                                                                                                                                                                                                            2013
                                                                                                                                                                                                                                                                   2014
                                                                                                                                                                                                                                                                          2015
                                                                                                        Source: Company Filings, GWLRA, 2016.                                                                                          Source: Company Filings, GWLRA, 2016.

   THE RISE OF FINTECH
   Though formal definitions vary2, Fintech refers to a new                               The rise of Fintech is expected to influence the market in                             Everyone from Apple to Facebook
   category of flexible and scalable companies focused                                    various ways. Some Fintech companies compete with tra-                                 is encroaching on the territory of
   on using technology to provide financial products and                                  ditional financial institutions in core market segments
   services (Figure 12). They differ from traditional finan-                              such as wealth management and payments (Castaldo,
                                                                                                                                                                                 traditional lenders, and the threat of
   cial firms such as banks due to their primary reliance on                              2016). Other Fintech companies provide complimentary                                   competition from these unusual rivals
   digital technologies and software to operate. Based on                                 services such as data, security and management software                                has forced financial institutions to
   data from OMERS Ventures (2015), there are approximate-                                that help traditional financial services firms become                                  invest in a flurry of innovations...
   ly 100 known Fintech firms existing in Canada, with over                               more efficient. Entirely new financial markets and                                     – Globe and Mail. (Kiladze, 2014)
   60 located in Toronto. Funding for Fintech companies                                   products such as blockchain and cryptocurrency are also
   is often used as a barometer for the growth of the sector                              being created by firms in the Fintech sector.
   and as of 2015, total global investment in Fintech firms
                                                                                          Traditional Financial industries most at profit risk from
   totaled $22.3 billion according to Accenture (2016), nearly
                                                                                          Fintech are those where revenues are broker based such
   an eleven-fold increase since 2010. Canada conversely,
                                                                                          as payments, investment trading/advisory and credit
   has attracted $1.0 billion in capital from 2010 to 2015.
                                                                                          lending. Disintermediation highlights the role of technol-
   Many Fintech companies begin as independent start-ups
                                                                                          ogy in replacing middle-people that traditionally brought
   through venture capital, funded partnerships or incubator
                                                                                          sellers and buyers together. Industries in the Financial
   programs. However, a wider range of technology compa-
                                                                                          Services sector that face the least impact from Fintech
   nies are also entering the Financial Services sector, with
                                                                                          are those that require specialization, such as corporate
   Apple and other tech giants emerging as Fintech competi-
                                                                                          and institutional banking. It is expected that major
   tors (Kiladze, 2014).
                                                                                          banks will continue to play a dominant role in credit                           2
                                                                                                                                                                            Note that Fintech is a broad term referring to companies using technology to
                                                                                          intermediation such as loans and deposits.                                      provide financial services. Good resources on defining Fintech include Daily
                                                                                                                                                                          Fintech and MaRS.

   10 |Banking and the new digital era: What’s next for Financial Services in Canada?                                                                                                                                                     GWL Realty Advisors | CBRE Limited
Is Fintech a disruptor as many in the financial in-                      FIG. 12: MAJOR FINTECH CATEGORIES
dustry claim? Yes and No. Our view is that Fintech
companies will be collaborative and competitive                                                                                                                                                           Example Firms
                                                                                        Category                Technology Evolution
to traditional financial institutions depending on                                                                                                                                                        in Canada
the market segment. Fintech is not going away,
                                                                          Business to   Lending,                Making the transaction between those seeking donations, insurance, loans, debt            FinanceIt,
but how this industry evolves will also not be                            Consumer      crowdfunding            or equity and those giving them more efficient by moving the marketplace and              Grow.,
linear: some firms will partner or be acquired by                         (B2C)         & market                transactions process online. Receivers can access digital marketplaces for money          Ratehub,
larger financial institutions, while others will grow                                   intermediaries          more efficiently, while providers no longer have to be corporations – they can be         Kanetix
independently and be major competitors to in-                                                                   individuals (e.g. Peer to Peer).
cumbents. As a result of this, financial institutions
are also active developing their own competitive                                        Payments, Billing and   New technologies are allowing consumers the ability to pay for products and services or   Apple Pay,
                                                                                        Transfers               transfer money without the use of physical money or credit cards.                         Payfirma
Fintech products and digital innovations to stay
relevant to consumers.
                                                                                        Personal Finance &      Within the realm of investing, the development of algorithms and analytics platforms      Wealth Simple,
It is important to note that the Fintech industry is                                    Asset Management        to monitor securities are shifting traditional portfolio management and advisory re-      WealthBar,
relatively new and that a variety of trends will affect                                                         sponsibilities to computers and artificial intelligence (e.g. Robo-advisors). Consumers   BMO Investor
its growth and trajectory. Growing consumer de-                                                                 looking for investment advice no longer have to rely on humans – investing advice         Line
                                                                                                                and trading can be done digitally.
mand for Fintech products is an obvious one, but
increasing regulation of new financial technologies
                                                                                        Digital Currency &      The development of internet-based, non-physical currencies that can be used to            Ethereum,
and marketplaces, changing economic conditions
                                                                                        Ledgers                 purchase goods and services. Most common forms of digital currency are known              Blockstream
and sustainable profits are also indicators to                                                                  as “cryptocurrency” which involves the use of cryptography and chains/ledgers to
watch. Nevertheless, a key conclusion is that the                                                               validate the currency.
financial sector is generally becoming more tech-
nologically-oriented and diverse with Fintech and                         Business to   Client management, Development of client interfaces and marketing tools to enhance both a customer’s              Zafin, D+H
supporting innovations a key part of this shift.                          Business      marketing & analytics experience as well as derive more information on customer habits, issues and poten-
                                                                          (B2B)                               tial business needs. Mobile technology has been key to this trend.

   NOTABLE FINTECH PART-                                                                Institutional tools &
                                                                                        “Core” Software
                                                                                                                Software aimed primarily at making “back of house” operating processes more
                                                                                                                efficient.
                                                                                                                                                                                                          Fiserv, SunGard

   NERSHIPS AND INCUBATOR
   PROGRAMS IN CANADA                                                                   Data Management/        Software and related product solutions aimed at storing, disseminating, analyzing         Data Center Inc.,
                                                                                        Analytics               and optimizing vast quantities of data and information.                                   MarketIQ

      • MaRS: FinTech Cluster (Toronto)
      • RBC and University of Toronto:                                                  Cyber Security          The development of tools and processes to reduce loss, fraud or theft of data given       Crealogix,
        ONRamp (Toronto)                                                                                        the movement of financial activities online.                                              Securekey
      • TD Bank: Communitech (Kitchener-
        Waterloo)
                                                                          InsurTech     Insurance               A emerging sub-sector of FinTech that focuses on the development of technology            Clark
      • BMO and Ryerson University: DMZ                                                 Technologies            and digital tools for the insurance industry. Key segments included data analytics        (Germany)
        (Toronto)
                                                                                                                of clients and markets, as well as the development of customer facing sales and           TruMotion
      • BC Tech Association: BC FinTech                                                                         management platforms.                                                                     (U.S.)
        Program (Vancouver)
                                                                                                                                                                                                             Source: GWLRA, 2016.

11 |Banking and the new digital era: What’s next for Financial Services in Canada?                                                                                                      GWL Realty Advisors | CBRE Limited
Toronto’s Financial Services
           Footprint
           This section highlights office market trends occurring in
           Downtown Toronto3—Canada’s largest Financial Services
           hub. Directly employing over 243,000 people in the Fi-
           nancial sector, Toronto is home to over a third of Financial
           Services employment in Canada and 43.0% of all head
           office jobs. Furthermore, 31.0% of all Financial Service
           firms with offices in Canada are headquartered in Toronto
           (Burt, 2015). Ranked 8th globally and 2nd in North Amer-
           ica in terms of sector importance by the Global Financial
           Centres Index (2015), Toronto’s peers on the index include
           New York, London, Tokyo and San Francisco.
           3
             With limited data on office trends in the relatively diverse and large suburban office market in Toronto, this report
           focuses on occupier trends occurring in Toronto’s downtown core that is comprised of 69 million SF across seven
           submarkets.

12 ||Banking
     Banking and the new digital era: What’s next for Financial Services in Canada?                                                  GWL Realty Advisors | CBRE Limited
TORONTO AS A GLOBAL
                                                                                                                                                                          FINANCIAL SERVICES HUB:
With Canada’s five leading financial institutions                                         34.6%, respectively. The major Canadian banks are a
                                                                                                                                                                          NOTABLE EMPLOYMENT
located in the city’s Financial Core and surrounding                                      key source of office demand, totalling over 12 million                          TRENDS
area, Downtown Toronto continues to be a top choice                                       sq. ft. or 17.9% of the total occupied space within
among Financial Service firms. Access to a large work-                                    Downtown Toronto.                                                               (Fig. 13-15)
force, high transit accessibility and a base of com-
plementing commercial activities continue to drive                                             Toronto’s advantages are                                                     • Since 2001, Toronto’s FIRE sector has grown
                                                                                                                                                                              by 60%, representing a total growth of 135,000
location decisions. With over 200,000 people passing                                           numerous. For example, it has a                                                net jobs and is among the highest across all
through Toronto’s Union Station transportation hub                                             skilled, sizable, and multicultural                                            sectors. The five year (2011-2016) job trend is
every day and over 27,000 residential units either in
pre-construction, under-construction or being market-
                                                                                               workforce. As well, Canada has                                                 similar with Toronto’s FIRE sector growing by
ed Downtown, urbanization continues to help drive
                                                                                               a high degree of financial sector                                              20% (net 60,000 jobs).
office growth in and around the Financial Core.                                                liberalization and solid corporate                                           • Since 2001, Toronto has accounted for 55% of

Tenant data from CBRE shows that the Financial
                                                                                               governance, further benefiting                                                 all FIRE employment growth in Canada.

Services sector makes up 39.6% of the Downtown
                                                                                               Toronto. Supporting the [Financial                                           • Toronto’s FIRE sector as a share of all FIRE
office market (Figure 16). This is largely concentrated                                        Services] sector is a vibrant                                                  employment in Canada stands at 32%, an
within three of the seven Downtown submarkets, all of                                          network that includes many of                                                  increase of 6.4% since 2001 suggesting a rise
which have greater than 25% of their space occupied                                            Canada’s top lawyers, accountants,                                             in sector concentration. This trend has been
                                                                                                                                                                              particularly impressive since 2014, increasing
by Financial Service firms (Figure 17). Most notably,                                          administrators, technology firms,                                              by 3.2% over the short two year period.
Financial Service firms are highly concentrated within
the Financial Core, making up 52.3% of the tenant
                                                                                               and academic institutions.
                                                                                                                                                                            • Within Toronto, the FIRE sector represents
                                                                                               – Conference Board of Canada (2014)
base. Other major concentrations are in the Down-                                                                                                                             11.1% of regional employment, an increase of
town South and Greater Core, representing 41.3% and                                                                                                                           2.3% since 2001.

FIG. 13:          TOTAL EMPLOYMENT GROWTH, TORONTO CMA (2000 – YTD 2016)                                                                   FIG14
                                                                                                                                              FIG. 14:   FIRE EMPLOYMENT - TORONTO CMA AS A % SHARE OF THE NATIONAL TOTAL

         Health care and social assistance                                                                                                    34%
                        Educational services                                                                                                                                                                                                        32.0%
          Finance, Insurance & Real Estate                                                                                                    32%
                                Construction
Professional, scientific and technical services
                                                                                                                                              30%
             Natural Resources (Oil & Gas)
                            Business Services
             Total employed, all industries
                                                                                                                                              28%
          Transportation and warehousing
                 Wholesale and retail trade                                                                                                   26%
                                      Utilities
                                  Info-culture                                                                                                24%
                                                                                                                                                 Mar 2001
                                                                                                                                                 Sep 2001
                                                                                                                                                 Mar 2002
                                                                                                                                                 Sep 2002
                                                                                                                                                 Mar 2003
                                                                                                                                                 Sep 2003
                                                                                                                                                 Mar 2004
                                                                                                                                                 Sep 2004
                                                                                                                                                 Mar 2005
                                                                                                                                                 Sep 2005
                                                                                                                                                 Mar 2006
                                                                                                                                                 Sep 2006

                                                                                                                                                 Mar 2008
                                                                                                                                                 Sep 2008
                                                                                                                                                 Mar 2009
                                                                                                                                                 Sep 2009
                                                                                                                                                 Mar 2010
                                                                                                                                                 Sep 2010
                                                                                                                                                 Mar 2011
                                                                                                                                                 Sep 2011
                                                                                                                                                 Mar 2012
                                                                                                                                                 Sep 2012
                                                                                                                                                 Mar 2013
                                                                                                                                                 Sep 2013
                                                                                                                                                 Mar 2014
                                                                                                                                                 Sep 2014
                                                                                                                                                 Mar 2015
                                                                                                                                                 Sep 2015
                                                                                                                                                 Mar 2016
                                                                                                                                                 Sep 2016
                                                                                                                                                 Mar 2007
                                                                                                                                                 Sep 2007
                              Manufacturing

                                                  -30% -20% -10% 0%   10% 20% 30% 40% 50% 60% 70%
                                                                      Source: Statistics Canada (CANSIM Table 282-0130), September 2016.                                                 Source: Statistics Canada (CANSIM Table 282-0130, 282-007), September 2016.

13 |Banking and the new digital era: What’s next for Financial Services in Canada?                                                                                                                             GWL Realty Advisors | CBRE Limited
FIG15
FIG. 15: TORONTO FIRE 12%                                                                                                             FIG. 16: DOWNTOWN
         EMPLOYMENT                                                                                                                            TORONTO
         - % SHARE                                                                                                      11.1%                  OCCUPIED                  5.0%                                              Banks
         OF TOTAL                                                                                                                              SPACE BY                             19.3%
         TORONTO CMA
                      11%                                                                                                                      SECTOR                                                                      Other Financial Services
         EMPLOYMENT                                                                                                                            (Q3 2016)
                                                                                                                                                                                                                           Insurance
                                 10%                                                                                                                       39.7%
                                                                                                                                                                                              15.4%                        Business Services
                                                                                                                                                                                                                           Legal
                                  9%
                                                                                                                                                                                        4.6%                               Other Industries
                                                                                                                                                                                   11.2%
                                  8%
                                                                                                                                                                        9.8%                                               Vacant

                                       Sep 2001

                                       Sep 2002

                                       Sep 2003

                                       Sep 2004

                                       Sep 2005

                                       Sep 2006

                                       Sep 2007

                                       Sep 2008

                                       Sep 2009

                                       Sep 2010

                                       Sep 2011

                                       Sep 2012

                                       Sep 2013

                                       Sep 2014

                                       Sep 2015

                                       Sep 2016
                                       Mar 2001

                                       Mar 2002

                                       Mar 2003

                                       Mar 2004

                                       Mar 2005

                                       Mar 2006

                                       Mar 2007

                                       Mar 2008

                                       Mar 2009

                                       Mar 2010

                                       Mar 2011

                                       Mar 2012

                                       Mar 2013

                                       Mar 2014

                                       Mar 2015

                                       Mar 2016
                                                                                                                                                                                                                                           Source: CBRE Research, Q3 2016.
                                                                 Source: Statistics Canada (CANSIM Table 282-0130), September 2016.

KEY MARKET TRENDS
Toronto is expected to remain an important location for                                                                      Right-sizing and a trend of           It is important to note however, that while this trend
national Financial Services employment growth. Given                                                                         “efficient growth”                    towards efficiency continues, it is also being offset by
the large concentration of Financial Service firms in                                                                                                              positive job growth overall. As mentioned, Toronto’s
                                                                                                          Data on office-occupying4 job
the Toronto office market, what are the trends looking                                                                                                             total service sector employment is forecast to grow by
                                                                                                          growth and occupied space
forward? Our research findings point to the following                                                                                                              251,000 people over the next five years with financial
                                                                                                          confirms the phenomenon of
themes.                                                                                                                                                            services accounting for 10,000 direct jobs alone. This
                                                                                                          right-sizing within the Financial
                                                                                      2004-2008                                                                    total growth, regardless of ongoing space rationalization
Market demand from Financial Services will                                                                Services sector. From 2004 to
remain strong
                                                                                      1 JOB               2008, the total occupied space
                                                                                                                                                                   in the Financial sector will still drive expansion of the
                                                                                      88 SF               in Downtown Toronto grew by
                                                                                                                                                                   office market.
Financial Service employment growth is a good indicator                                                   6.6 million sq. ft., compared to
                                                                                      2011-2016
for office space demand. Looking at the 15 year cycle,                                                                                                             FIG. 17:             60%
                                                                                      1 JOB               only 1.9 million sq. ft. from 2011
                                                                                                                                                                   DOWNTOWN
Downtown Toronto office net absorption has generally
                                                                                      23 SF               to 2015. This is despite the fact                        TORONTO              50%
moved in line with Financial Services sector employ-                                                      that 2011-2015 witnessed more                            TOTAL
                                                                                                                                                                   OCCUPIED             40%
ment growth (Figure 18). The 2004 to 2008 period was an                                                   total job growth (84,400 people)                         BY FINANCIAL
especially strong period of both sector job growth and                           than 2004-2008 (75,600 people). As Figure 19 notes,                               SERVICE              30%
                                                                                                                                                                   FIRMS
absorption for Downtown Toronto. Net absorption in                               one office-occupying job equated to 87.6 sq. ft. of office                        (Q3 2016)            20%
Downtown Toronto since 2010 has also performed very                              space from 2004 to 2008, decreasing to 23.0 sq. ft. from                                               10%
well, save for a short period of negative net absorption in                      2011 to 2016. Discussions with industry experts further
                                                                                                                                                                                         0%
2013.                                                                            confirm this finding – major banks and insurance firms                                                       Financial   Greater    Downtown   Downtown     Downtown   Downtown    Liberty
                                                                                                                                                                                                Core       Core        South      West         North      East      Village

Looking ahead, the Conference Board of Canada es-                                continue to rationalize space by consolidating multiple
                                                                                 offices while also focusing on workplace design and                                                                                                       Source: CBRE Research, Q3 2016.
timates that Toronto will add another 10,000 jobs in
the Financial Services sector between 2016 and 2020.                             layout efficiencies.
Overall service sector employment is forecast to grow by                                                                                                           4
                                                                                                                                                                     For this report, “office-occupier” groups comprise of the following NA-
251,000 jobs over the same time period. Both numbers                                                                                                               ICS-based industries: FIRE, professional scientific and technical services,
                                                                                                                                                                   business services and info-culture.
bode well for the office market in Toronto.

14 |Banking and the new digital era: What’s next for Financial Services in Canada?                                                                                                                                  GWL Realty Advisors | CBRE Limited
FIG. 18: DOWNTOWN TORONTO NET ABSORPTION AND TORONTO FIRE
            SECTOR JOB GROWTH 4-QUARTER MOVING AVERAGE

                                600                                                                                                        12%
                                                                                                                                                                       New office supply impact
                                400                                                                                                        8%
                                                                                                                                                                       The Financial Services sector continues to be a main driver of new office develop-
                                200                                                                                                        4%                          ment in Downtown Toronto. In the last two development cycles (2009-2011 and
Net Absorption (000s sq. ft.)

                                                                                                                                                                       2014-2017), banks and related groups respectively made up 31.1% and 42.0% of total

                                                                                                                                                   Employment Growth
                                      -                                                                                                    0%
                                                                                                                                                                       pre-lease commitments (Figure 20).
                                -200                                                                                                       -4%
                                                                                                                                                                       Looking forward, Financial Service firms will continue looking for buildings that can
                                -400                                                                                                       -8%                         provide the most efficiency and latest in technology and amenities. Corporate stan-
                                                                                                                                                                       dards for health and wellness, as well as energy use and IT are increasingly rigorous.
                                -600                                                                                                       -12%
                                                                                                                                                                       New office buildings are expected to meet or exceed these standards. Landlords of
                                -800                                                                                                       -16%
                                                                                                                                                                       existing space will accordingly need to focus on capital improvements and upgrades
                                          Q1 2002
                                          Q3 2002
                                          Q1 2003
                                          Q3 2003
                                          Q1 2004
                                          Q3 2004
                                          Q1 2005
                                          Q3 2005
                                          Q1 2006
                                          Q3 2006
                                          Q1 2007
                                          Q3 2007
                                          Q1 2008
                                          Q3 2008
                                          Q1 2009
                                          Q3 2009
                                          Q1 2010
                                          Q3 2010
                                          Q1 2011
                                          Q3 2011
                                          Q1 2012
                                          Q3 2012
                                          Q1 2013
                                          Q3 2013
                                          Q1 2014
                                          Q3 2014
                                          Q1 2015
                                          Q3 2015
                                          Q1 2016
                                          Q3 2016
                                                                                                                                                                       to remain competitive.
                                                     Net Absorption                      Y-o-Y FIRE Employment Growth                                                  This trend is expected to define the Toronto office market going forward for two
                                                                                                Source: Conference Board of Canada, CBRE Research, 2016.               reasons. First, compared to other cities in Canada, tenants in Toronto are typically
                                                                                                                                                                       larger and have the physical capacity to benefit from these workplace strategies. The
                                                                                                                                                                       large size of financial firms in Toronto also limits them to a select number of market
   FIG. 19: DOWNTOWN TORONTO – OFFICE-OCCUPIER AND OCCUPIED SPACE
            CHANGE                                                                                                                                                     options further making new development attractive. Second, given the large concen-
                                                                                                                                                                       tration of Financial Service headquarters in Toronto, tenants are also better capital-
                                           Total Net Job Growth (000s) DT Toronto Occupied Growth (SF) Occupied Space to Jobs Ratio                                    ized and funded to invest in their premises.

                2004-2008                  75.6                        6,621,996                                 87.6                                                  Fintech firms are not a significant driver of office space…yet
                                                                                                                                                                       Given the relatively small size of the Canadian Fintech market, the industry is not
                2011-2015                  84.4                        1,938,434                                 23.0                                                  expected to be a significant driver of office demand over the short term. According
                                                                                                                                                                       to CBRE Research, standalone Fintech companies occupy in total approximately
                                                                                         Source: Conference Board of Canada, GWLRA, CBRE Research, 2016.
                                                                                                                                                                       260,000 sq. ft. in Downtown Toronto with the average tenant less than 10,000 sq. ft.
                                                                                                                                                                       Most of these tenants are fairly dispersed across Downtown Toronto (Figure 21), with
   FIG. 20: DOWNTOWN TORONTO – PRE-LEASE COMMITMENTS BY INDUSTRY                                                                                                       many occupying incubators and shared offices. Part of the popularity of incubators
                                                                                                                            Banks                                      and shared office space for Fintech companies is due to their unpredictable growth.
      2014-2017                                                                                                                                                        Some Fintechs scale very quickly and standard leases and covenant requirements are
   CONSTRUCTION                                                                                                             Other Financial Services
                                          15.6%     26.4%         18.0%          19.7%      16.6% 17.8%                                                                not always accommodative to their business structure.
          CYCLE                                                                                                             Business Services
                                                                          3.7%                                              Legal                                      Over the long term, new small to mid-sized tenant opportunities may start to emerge
                                                                                                                            Creative Industries                        from Fintech companies and related technology firms as they mature. This has been
      2009-2011
   CONSTRUCTION                            20.1%     11.0% 18.6%          13.3% 9.5%              25.2%                     Other Industries                           the case with other technology sectors such as software and digital media. Venture
          CYCLE                                                                                                                                                        capital funding is often correlated to office demand for office markets with a high
                                                                                                                            Vacant/Available
                                                                                                                2.4%                                                   exposure to technology (CBRE, 2016), and will also be a key indicator to monitor.
                   TORONTO
                DOWNTOWN -
                    EXISTING               20.2%      15.1% 10.8% 10.0%                     36.4%
                  BUIDLINGS
                                                                             2.4%                              5.0%
                                                                                                                        Source: CBRE Research, Q3 2016.

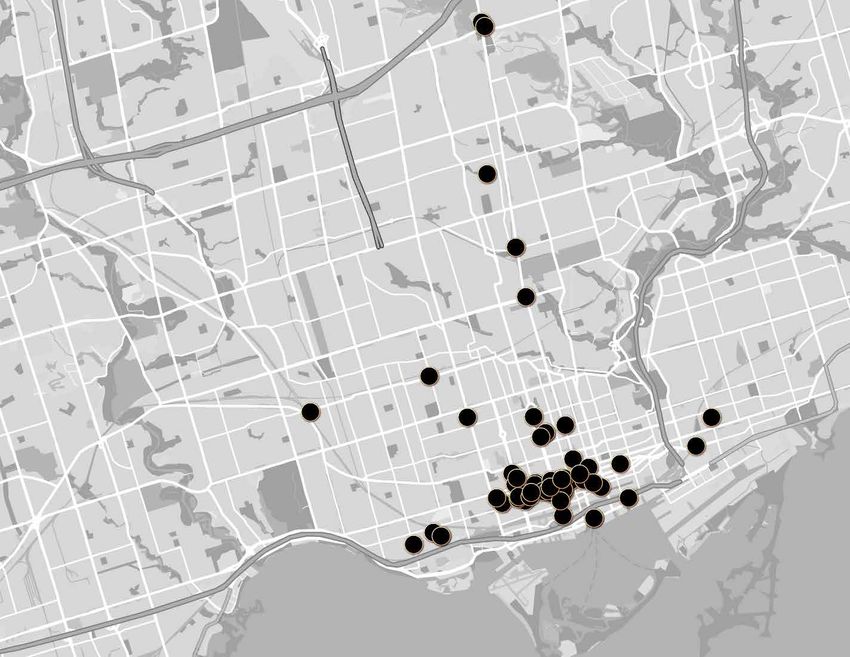
                      15 |Banking and the new digital era: What’s next for Financial Services in Canada?                                                                                                                        GWL Realty Advisors | CBRE Limited
FIGURE 21: TORONTO FINTECH LOCATIONS

      60+ Fintech Firms
      and their Locations in
      Toronto
      Source: CBRE Research, 2016.

16 |Banking and the new digital era: What’s next for Financial Services in Canada?   GWL Realty Advisors | CBRE Limited
Real Estate Impacts
          Looking Ahead
          Real estate will continue to play an integral role for
          Financial Service firms, especially as office space
          becomes increasingly used for branding and talent
          attraction. However, with technology, innovation
          and efficiency defining the financial services industry
          in Canada, property investors will need to take an
          evolved view of the sector—one defined by diversifi-
          cation within the industry, as well as a more modest
          outlook for overall growth moving forward.

17 |Banking and the new digital era: What’s next for Financial Services in Canada?   GWL Realty Advisors | CBRE Limited
MARKET THEMES

The industry will be more efficient from a                                   Financial Services will be part of an                       Toronto continues to strengthen as a global
growth perspective                                                           increasingly diverse service economy                        and national financial centre
Financial institutions will continue to be an integral part                  It is expected that cities across Canada will continue to   Toronto is expected to strengthen as a Financial Services
of the office market in Canada. Recent trends however,                       diversify as Technology, Health Care and Professional       hub. Over the last several years, Toronto has increased
suggest slower office demand from this sector in the                         service sectors grow in importance. Financial Services      its concentration of Financial Service activity and global
short term. Consolidation, automation and a focus on                         accordingly, will be part of a more dynamic office market   presence. Employment growth accordingly, highlights
operating efficiency is expected to continue defining the                    from a tenant perspective. The growing influence of         this shift—the Toronto area alone drives over half of all
industry. This is not to say the Financial Services sector                   technology in financial services also highlights diver-     Financial Sector employment growth in Canada. Looking
will not grow at all—it merely indicates that the pace                       sification within the sector as well—a wider range of       ahead, Toronto’s office market will stand to benefit from
of growth will be slower than in past years. The typical                     groups will be associated with Financial Services such      this ongoing trend.
150-200 sq. ft. per new employee ratio accordingly, will                     as Fintech, software and data management. Banks and
continue trending lower.                                                     Insurance groups will remain major players for the office
                                                                             market, but new leasing opportunities will also emerge
                                                                             with these other groups.

18 |Banking and the new digital era: What’s next for Financial Services in Canada?                                                                                    GWL Realty Advisors | CBRE Limited
IMPACTS ON REAL ESTATE REQUIREMENTS
Location considerations                                                                                                                                      OFFICE
Evolving office demand in Financial Services is expected
to create additional opportunities for property inves-
tors. Downtown locations, where many major financial
                                                                                 The primary drivers of workplace
                                                                                 strategy are talent attraction and                                          AS THE
                                                                                                                                                             NEW
institutions are located, will continue to be in demand—                         retention, collaboration and cost
urbanization and transit access remain positive drivers.                         savings. While the latter seems to
The growth of Fintech is also driving demand for “brick                          be a perennial driver, the first two

                                                                                                                                                             BRAND
and beam” spaces in urban-fringe locations. While brick                          are certainly a direct result of a
and beam space is already common among other tech-
nology-oriented sectors, it does present a wider range of
                                                                                 much more mobile society. – CBRE
                                                                                 America’s Occupier Survey (2016)
office investment opportunities related to the Financial
Services sector.
                                                                              A focus on talent: “Office as the New Brand”
A decentralization effect is also taking hold as firms in
                                                                             Based on research findings, Financial Service firms are
the industry think more broadly in terms of location. Sat-
                                                                             increasingly focused on three goals with respect to their
ellite offices, incubators, co-working spaces and innova-
                                                                             real estate needs:
tion labs near universities and other life science districts
are other emerging investor opportunities. This trend is                         • Attracting and retaining talent;
expected to drive office demand in secondary cities with
                                                                                 • Corporate branding (both internal and public); and
burgeoning technology and education clusters as well.
                                                                                 • Optimization of technology and resources.

                                                                             Office space accordingly, is increasingly used as an
     MARS FINTECH CLUSTER                                                    attraction point. Creating and utilizing space that allows
                                                                             employees to work independently, but also promoting in-
                                                                             teraction is an emerging priority for firms in the industry
     The MaRS FinTech Cluster is a program that
                                                                             (Deloitte, 2015). Effective spaces are ones that can create
     connects start-ups with financial institutions
                                                                             the opportunity for collaboration and interaction, and
     and is located in the MaRS Discovery District
                                                                             leverage technology for a flexible and mobile workforce.
     in Toronto. CIBC, TMX Group and PayPal are
                                                                             According to Citrix’s Workplace of the Future report (Ci-
     notable groups that have opened permanent
                                                                             trix, 2012), 89% of global organisations by 2020 will offer
     offices within the Discovery District to
                                                                             flexible work options enabled by mobile technology5. Fi-
     collaborate more effectively with FinTech
                                                                             nancial institutions will be a key part of this digital shift.
     startups.

                                                                             5
                                                                               This global market research report surveyed 1,900 senior IT decision makers
                                                                             in August 2012. They largely represent organizations with more than 1,000
                                                                             employees across 19 countries across the globe.

19 |Banking and the new digital era: What’s next for Financial Services in Canada?                                                                             GWL Realty Advisors | CBRE Limited
Flight to quality and support for new
                                                             supply
                                                             Consolidation, centralization and a focus on
                                                             technology and talent attraction among Financial
                                                             Services firms are expected to continue driving
                                                             demand for new office space. Investors and
                                                             managers who have a strong office development
                                                             program will benefit from this, particularly in
                                                             downtown and urbanizing locations. For existing
                                                             buildings, capital investments in building sys-
                                                             tems and technology upgrades will be necessary
                                                             to stay competitive.

                                                             Embracing tenant collaboration and
                                                             partnerships
                                                             The relationship between landlords and tenants
                                                             is also changing, with collaboration and part-
                                                             nership an emerging theme. Tenant retention is
                                                             just as important as talent retention and build-
                                                             ing owners should understand both leased and
                                                             common spaces are critical in fostering a positive
                                                             work environment for occupants. To have a suc-
                                                             cessful leasing program, investors and managers
                                                             will need to collaborate with tenants on technol-
                                                             ogy and amenity needs, sustainability require-
                                                             ments and workplace strategies.

20 |Banking and the new digital era: What’s next for Financial Services in Canada?                                GWL Realty Advisors | CBRE Limited
Conclusion:
          A Spectrum of Opportunities
          For investors and managers, the changes that are taking place in Financial
          Services will create a spectrum of opportunity in terms of office investment and
          development. On one end of the spectrum, Fintechs and technology firms will
          lead demand for non-traditional and non-core office in emerging urban areas
          and will drive new leasing models such as co-working spaces and technolo-
          gy clusters. On the other end of the spectrum are large, established banking,
          investment and insurance firms with significant downtown footprints. Property
          investors will need to decide what end of the spectrum they want to be in de-
          pending on size, covenant and management expertise.

21 |Banking and the new digital era: What’s next for Financial Services in Canada?           GWL Realty Advisors | CBRE Limited
BIBLIOGRAPHY
Canadian Bankers Association. (2014). Total bank employment by provinces . Toronto: Canadian Bankers              Citrix. (2012). Workplace of the future: a global market research report. Citrix. Retrieved from https://www.citrix.
        Association.                                                                                                         com/content/dam/citrix/en_us/documents/products-solutions/workplace-of-the-future-a-global-market-
                                                                                                                             research-report.pdf
Accenture. (2016). Fintech and the evolving landscape: landing points for the industry. Accenture.
                                                                                                                  Dapp, T. (2015). Fintech reloaded: traditional Banks has digital ecosystems . Frankfurt: Deutsche Bank .
Accenture. (2016). InsurTech Invesment Trends. Accenture. Retrieved from https://www.accenture.com/
         t20161011T031410__w__/ca-en/_acnmedia/PDF-15/Accenture-FinTech-Evolving-Landscape-                       Deloitte. (2015). The London Business Footprint: The Evolving Financial Sector. London: Deloitte.
         Infographic.pdf
                                                                                                                  Denning, S. (2014, June 24). Understanding disruption: insights from the history of business. Forbes. Retrieved
Ansari, S. (2015, April 2). New workspaces blow office design wide open. Toronto Star. Retrieved from https://             from Forbes: http://www.forbes.com/sites/stevedenning/2014/06/24/understanding-disruption-
           www.thestar.com/business/2015/04/02/new-workspaces-blow-office-design-wide-open.html                            insights-from-the-history-of-business/#3093a96330e0

, K. (2015, December 9). Could a robot take your job? . Retrieved from The conference Board of Canada: http://    EY. (2016). 2016 Canadian life insurance Outlook. Toronto: EY .
          www.conferenceboard.ca/economics/hot_eco_topics/default/15-12-09/could_a_robot_take_your_job.
          aspx                                                                                                    Griffith, A. (2014, September 25). Why startups fail, according to their founders. Retrieved from Fortune: http://
                                                                                                                             fortune.com/2014/09/25/why-startups-fail-according-to-their-founders/
Berman, D., & McGee, N. (2016, April 13). Scotiabank launches new round of job Cuts as consumers move
        online. The Globe and Mail. Retrieved from http://www.theglobeandmail.com/report-on-business/             Hammer, J. (November, 9 2015). Why fintech startups aren’t killing banks - yet. Retrieved from Crunch Network:
        streetwise/scotiabank-launches-new-round-of-jobs-cuts-as-consumers-move-online/article29626579/                   https://techcrunch.com/2015/11/09/why-fintech-startups-arent-killing-banks-yet/

Bouw, B. (2015, February 17). Next big sector to face disruption? Financial services. The Globe and Mail.         Holloway, A. (2016, February 4). How Janet Ecker plans to keep the financial services industry ahead of
          Retrieved from http://www.theglobeandmail.com/report-on-business/small-business/sb-money/next-                   challenges being thrown at it. Financial Post. Retrieved from http://business.financialpost.com/financial-
          big-sector-to-face-disruption-financial-services/article23025801/                                                post-magazine/how-janet-ecker-plans-to-keep-the-financial-services-industry-ahead-of-challenges-
                                                                                                                           being-thrown-at-it
Burt, M. (2015). An engine for growth. 2015 report card on Canada and Toronto’s Financial Services sector.
          Toronto: The conference Board of Canada .                                                               Kiladze, T. (2014, December 29). Too big to disrupt? The Globe and Mail. Retrieved from http://www.
                                                                                                                             theglobeandmail.com/report-on-business/feature-too-big-to-disrupt/article22163574/
Campbell, D., & Son, H. (2016, June 7). Wall Street is doing just fine with fewer workers. Bloomberg. Retrieved
        from http://www.bloomberg.com/news/articles/2016-10-19/fired-bond-traders-stung-anew-as-bank-             Kiladze, T. (2016, August 26). Why Bay streets bad boys are disappearing. The Globe and Mail, p. 2016.
        profits-soar-without-them
                                                                                                                  Kornack, M., Chung, D., & Shah, A. (2016). Landlord/tenant relationships increasingly important as office space
Canadian Bankers Association. (2015). Database of domestic Banks financial results fiscal year-end 2006-2014 .             Evolution continues. Toronto: National Bank.
        Toronto: Canadian Bankers Association.
                                                                                                                  Madhavi, A., & Yew, T. (2016, December 8). Profits shrink as banks face regulation, slow growth. Toronto Star.
Canadian Bankers Association. (2016). Global banking regulations and banks in Canada . Toronto: Canadian
        Bankers Association.                                                                                      Marino, J. (2016, January 5). Big banks are joining forces with the firms that were supposed to be disrupting
                                                                                                                            them. Retrieved from Business Insider: http://www.businessinsider.com/big-banks-are-backing-online-
Canadian Bankers Association. (2016). Select delivery Channel statistics - transaction volumes . Toronto:                   lenders-2015-12
        Canadian Bankers Association.
                                                                                                                  Marino, J. (2016, May 4). Online lenders are taking a beating. Retrieved from CNBC: http://www.cnbc.
Castaldo, J. (2016, May 17). Fintech firms are battling banks—and the banks are winning. Canadian Business.                 com/2016/05/04/online-lenders-are-taking-a-beating-on-deck-lending-club-fintech-startups.html
         Retrieved from http://www.canadianbusiness.com/investing/fintech-firms-are-battling-banks-and-the-
         banks-are-winning/                                                                                       Marowits, R. (2016, October 27). Montreal-based National Bank of Canada cutting up to 600 jobs amid shift in
                                                                                                                           banking industry. Retrieved from Global News: http://globalnews.ca/news/3028790/montreal-based-
CBRE. (2016). America’s occupier survey 2015/16. CBRE.                                                                     national-bank-of-canada-cutting-up-to-600-jobs-amid-shift-in-banking-industry/

22 |Banking and the new digital era: What’s next for Financial Services in Canada?                                                                                                             GWL Realty Advisors | CBRE Limited
You can also read