BIS Working Papers FX spot and swap market liquidity spillovers - Bank of ...
←
→
Page content transcription
If your browser does not render page correctly, please read the page content below
BIS Working Papers
No 836
FX spot and swap
market liquidity
spillovers
by Ingomar Krohn and Vladyslav Sushko

Monetary and Economic Department

January 2020

JEL classification: F31, G15

Keywords: foreign exchange, market and funding
liquidity, microstructure, dealer activity, window
dressing
BIS Working Papers are written by members of the Monetary and Economic
Department of the Bank for International Settlements, and from time to time by other
economists, and are published by the Bank. The papers are on subjects of topical
interest and are technical in character. The views expressed in them are those of their
authors and not necessarily the views of the BIS.

This publication is available on the BIS website (www.bis.org).

©   Bank for International Settlements 2020. All rights reserved. Brief excerpts may be
    reproduced or translated provided the source is stated.

ISSN 1020-0959 (print)
ISSN 1682-7678 (online)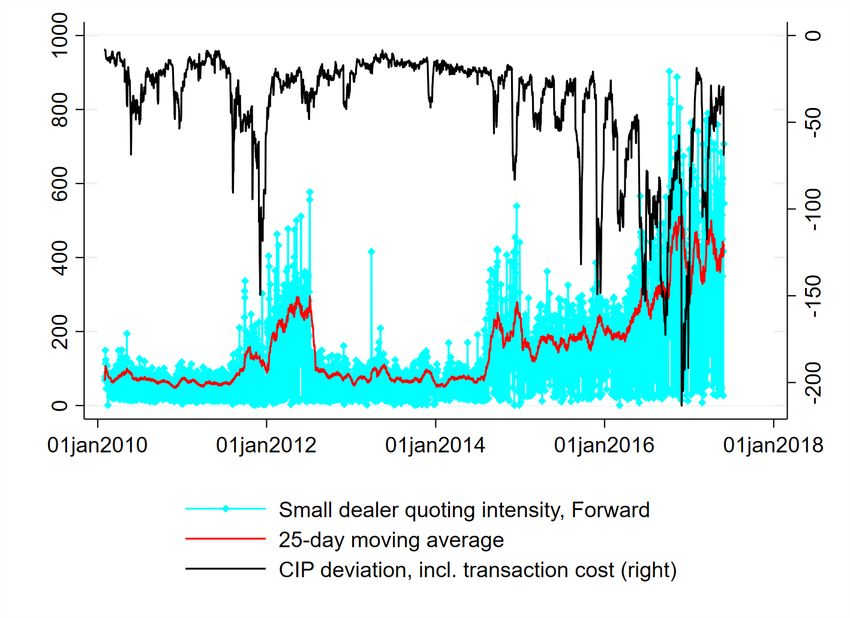
FX spot and swap market liquidity spillovers∗

                            Ingomar Krohn† Vladyslav Sushko‡

                                               Abstract

          We study the joint evolution of foreign exchange (FX) spot and swap market liquid-
       ity. Trading in FX swaps exceeds that of spot, yet this market segment has been largely
       ignored in prior research on liquidity in FX markets. We find strong co-movement
       in spot and swap market liquidity conditions and a strong link between FX funding
       and market liquidity, as gleaned from the pricing of both instruments. This link has
       strengthened over time with changes in dealer behaviour. Some of the largest dealers
       periodically pull back from pricing FX swaps and wider spreads attract smaller deal-
       ers. At the same time, liquidity in FX swaps remains impaired, which leads to adverse
       illiquidity spillovers to the spot market. Our findings suggest that funding liquidity has
       become a more important driver of spot market liquidity than it used to be.

First Draft: November 2017.
This Version: October 2019.

JEL classification: F31, G15
Keywords: Foreign Exchange, Market and funding liquidity, Microstructure, Dealer activity,
Window dressing

   ∗
     We thank Ingo Fender, Leonardo Gambacorta, Ulf Lewrick, Robert McCauley, Arnaud Mehl, Thomas
Nitschka, Andreas Schrimpf, Hyun Song Shin, Valeri Sokolovski, and Kostas Tsatsaronis for insightful com-
ments, and seminar participants at the Hong Kong Monetary Authority, and participants at the 7th Workshop
on Determinants of Foreign Exchange Rates at Norges Bank, Market Design and Regulation in the Presence
of High-Frequency Trading conference at the City University of Hong Kong, Northern Finance Association,
Bank of England and BIS research workshops for discussions. The views presented here are those of the
authors and do not necessarily reflect those of the BIS.
   †
     The author gratefully acknowledges the support of the BIS PhD internship programme and the support
from the Economic and Social Research Council (PhD grant no. 15000668). Copenhagen Business School,
Solbjerg Pl. 3, 2000 Frederiksberg, Denmark, Email: ik.fi@cbs.dk
   ‡
     Senior Economist, Representative Office for Asia and the Pacific, Bank for International Settlements,
78th Floor, Two International Finance Centre, 8 Finance Street, Central, Hong Kong SAR, Email: Vla-
dyslav.Sushko@bis.org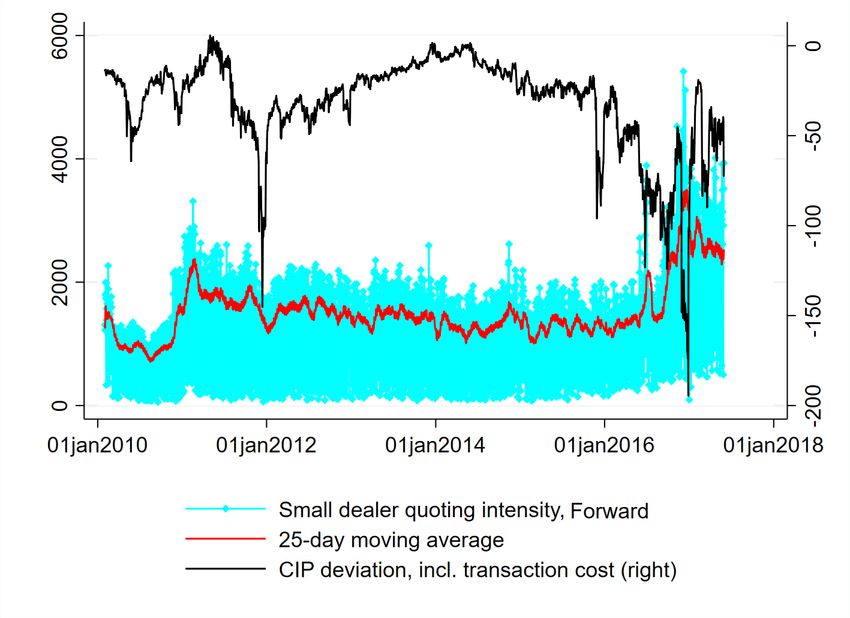
1       Introduction

With average daily trading volume of over $6 trillion, the foreign exchange (FX) market is
the world’s deepest financial market. Unlike, say, equity markets, FX trading is fragmented
across many venues and is primarily executed over-the-counter (OTC). Hence, FX liquidity
conditions are notoriously difficult to assess. Another unique feature of FX market is the
predominance of trading in FX derivatives over spot transactions. Daily trading volume
in FX swaps, the most liquid FX derivative instrument, has been exceeding that of spot
for years and by 2019 accounted for almost half of all trading in global FX markets (BIS,
2019).1 At the same time, as we show in the paper, the pricing of spot and FX swaps is
intimately linked. Greater volume of FX swap trading thus implies that liquidity conditions
in spot may very well be affected by liquidity in FX swaps. However, existing studies of FX
market liquidity have overlooked this market feature by focusing exclusively on spot trading
in isolation. This paper attempts to fill this gap.
    We assess liquidity conditions in the FX market taking into account the interrelation
between liquidity provision in FX spot and FX swaps. FX swaps have a spot leg and a
forward leg, which is why price formation in FX swaps depends on price formation in the
spot market, and vice-versa. Since FX swaps are term loans of one currency collateralised
with another currency, the interest rate implicit in FX swaps (i.e. forward discount) reflects
aspects of funding liquidity conditions in the two currency pairs. Hence, in addition to
assessing market liquidity on its own, we are able to examine the interaction between FX
market liquidity and FX funding liquidity. In order to circumvent endogeneity problems
arising from the market liquidity funding liquidity feedback loop, our identification strategy
relies on exogenous quarter-end funding liquidity shocks in FX swap markets to study their
effects on spot market liquidity.
   Our analysis focuses on the two most liquid currency crosses, JPY/USD and EUR/USD.
Our main empirical analysis is conducted at the intra-day frequency leveraging information
on prices with information on number of active dealers and their quoting behaviour.
    Our main results are as follows. First, we find that bid-ask spreads in spot and FX
swaps are very highly correlated, indicating that market liquidity in spot and swap markets
is intimately linked. Second, we find a robust relationship between FX funding and FX
market liquidity. A deterioration in FX funding liquidity, measured by the forward discount
or by deviations from covered interest parity (CIP, a related measure), is associated with a
    1
      In April 2019, average daily trading volume of FX swaps was approximately $3.2 trillion compared to $2
trillion for spot; in April 2016, analogous volume for FX swaps was $2.4 trillion compared to $1.7 trillion for
spot, according to the BIS Triennial Central Bank Survey of FX and OTC Derivatives Markets.

                                                      1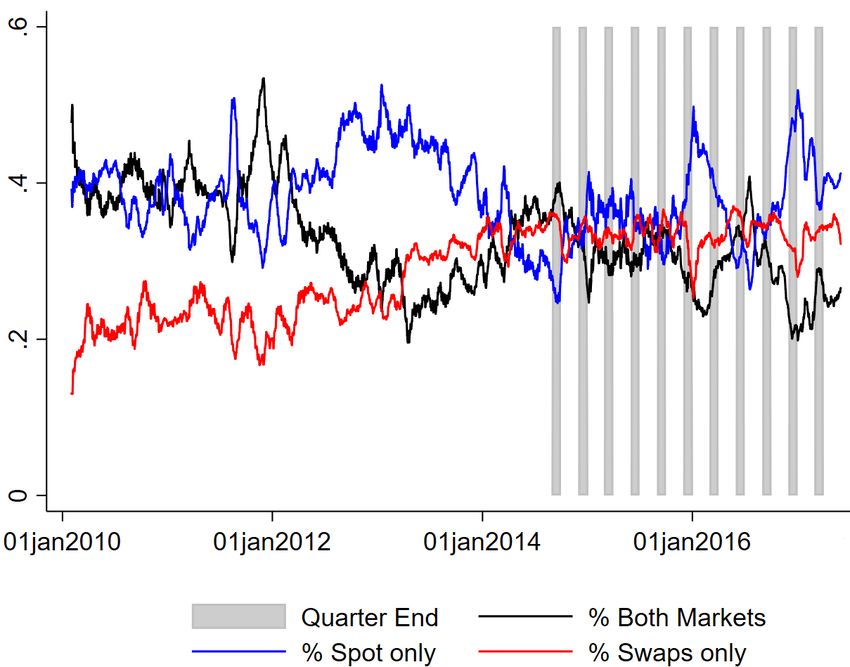
widening of bid-ask spreads not only in FX swaps but also in the spot market.
    Third, this link between FX market and FX funding liquidity conditions has strengthened
significantly since about mid-2014. In particular, while some deterioration in FX swap market
liquidity was always present around quarter-ends, these effects have become several times
larger since 2014. Significant illiquidity spillovers from FX swaps to spot market also emerged
in the latest period.
    Fourth, we document several empirical links between dealer activity and liquidity condi-
tions. We find that the positive marginal impact of dealer competition on market liquidity
has decreased over time, particularly in FX swaps but also in spot. We also find that USD
funding liquidity droughts in FX swap markets at quarter-ends, as measured by widening for-
ward discounts and CIP deviations, have become approximately three times greater between
July 2014 and May 2017 than they were during the 2011-12 European debt crisis. We find
that it is the desks belonging to institutions classified as global systemically important banks
(G-SIBs) that significantly cut back on their quoting activity in FX swaps during quarter-
and year-ends, causing market and funding liquidity to deteriorate, with the latter resulting
in violations of CIP.2
    Even though small dealers step-up their quoting activity in FX swaps when G-SIB deal-
ers pull-back, smaller dealers charge wider bid-ask spreads and a steeper forward discount
compared to large dealers, hence liquidity in FX swaps remains impaired. We identify two
reasons for this. One is that small dealers are low-volume players, thus require wider bid-ask
spreads and forward spreads for their market-making activity to be profitable. The second
reason is that small dealer quoting activity does not contribute to price discovery to the same
extent as that by large dealers. Specifically, greater quoting intensity by small dealers does
not suppress the dispersion of forward rate quotes in the same way that quoting intensity by
large dealers does, indicating greater volatility of quotes around the “true” forward rate.
    Finally, we identify a channel of illiquidity spillovers from FX swap to spot markets
through dealer behaviour. We find empirical evidence that wider spreads charged by small
dealers in FX swaps, when they take over much of the quoting activity from large dealers,
translate into wider bid-ask spreads in the spot market, despite the fact that large dealers
remain the predominant liquidity providers in spot. This implies that window dressing by
large FX dealers in FX swaps has been disruptive not only to the swap market liquidity, but
also to liquidity in the spot market, where similar window dressing is not observed.
   2
     G-SIB banks are subject to the G-SIB capital surcharge and have an incentive to manage down their
balance sheets to avoid crossing into the next G-SIB bucket; see, for example, J.P. Morgan “Making sense of
Libor’s mysterious rise”, North American Fixed Income Strategy, 14 December, 2017.

                                                    2
As in most empirical research, our findings are conditional on the representativeness of the
data source(s). We source tick-level data from Thomson Reuters (Refinitiv as of 2018) tick
history database, which collects time-stamped electronic quotes covering large segment of the
FX market. The data mainly captures dealer-to-client market segment, because the wholesale
inter-dealer FX swap market is predominantly a brokered market, so mainly voice executed.
While mid-prices are set in the inter-dealer market, our primary focus is on bid and ask quotes
faced by liquidity takers, which are ultimately set in the dealer-to-client market segment. Still,
given the considerable fragmentation of FX trading, for example, larger liquidity providers
can be linked to more than 20 electronic communication networks (Markets Committee,
2018), we cannot entirely exclude the possibility of some bias in coverage.
   This paper proceeds as follows. Section 2 reviews related literature and our contribution.
Section 3 describes the data and our measures of liquidity and dealer activity. Section 4
contains a broad overview of liquidity measures at daily frequency. Section 5 presents the
core intra-day analysis of FX liquidity dynamics. Section 6 concludes.

2       Related literature

This paper relates to several strands of international finance literature. We add to the study
of liquidity dynamics in currency markets. Mancini, Ranaldo, and Wrampelmeyer (2013)
provide a systematic assessments of FX spot liquidity, highlighting the substantial variation
of liquidity across currency pairs. Their findings also suggest that FX liquidity risk is priced
into currency excess returns. Banti, Phylaktis, and Sarno (2012) combine data on returns
and order flows across currencies to construct a measure of systematic FX liquidity risk.
Karnaukh, Ranaldo, and Söderlind (2015) provide further evidence for commonality in FX
liquidity, using daily data covering a large cross-section of currency pairs for more than twenty
years. Hasbrouck and Levich (2017) examine liquidity dynamics across a large number of
currencies using one-month of settlement data, complemented with high-frequency data on
quotes. We add to these studies by taking into account liquidity conditions in the FX swap
market as well as spot.3
  This aforementioned extension allows us to explicitly account for the joint behavior of FX
market liquidity and FX funding liquidity.4 While Banti and Phylaktis (2015) do assess this
    3
     BIS (2017) covered issues related to the liquidity of currency markets in the Americas, including FX
derivatives.
   4
     The theoretical framework for the interaction of these liquidity measures is grounded in Brunnermeier
and Pedersen (2009). Whereas market liquidity broadly refers to the costs of trade execution and the ability
to trade large volumes without generating an out-sized price impact, funding liquidity refers to the ease with

                                                      3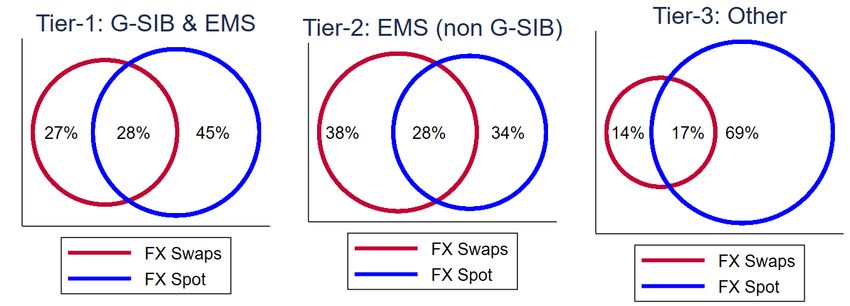
interaction of funding liquidity with FX market liquidity, they do not explicitly consider the
relative funding costs of one currency against another. Instead, they look at funding liquidity
conditions in two major repo markets (US and UK) as indicators of global funding condi-
tions. Similarly, Karnaukh, Ranaldo, and Söderlind (2015) show that FX liquidity declines
with higher VIX and TED spread (both US market-based measures). Unlike these studies,
we construct all the funding liquidity measures from activity in FX markets themselves. We
measure FX funding liquidity by the forward discount (computed from quotes of FX swap
points), which gives an implicit interest rate of funding one currency with another. Specif-
ically, the forward discount computed from the pricing of FX swaps represents the cost of
borrowing (lending) US dollar while lending (borrowing) a local currency in the spot market.
Hence, we look at funding liquidity in the proximate market, and in currencies matching the
spot market crosses under consideration.
    We also add to previous studies that examine the relationship between FX market liquidity
and dealer competition. Huang and Masulis (1999), in particular, also used Thomson Reuters
Tick History (TRTH) data to study the effects of dealer competition on liquidity, but these
authors only looked at the spot market. Hau, Hoffmann, Langfield, and Timmer (2019)
find that price discrimination in FX derivatives is eliminated when clients trade through
multi-dealer request-for-quote platforms. In addition, we add to studies relating FX price
discovery and dealer informational advantages to dealer size (Rosenberg and Traub, 2009;
Bjonnes, Osler, and Rime, 2009; Phylaktis and Chen, 2010; Menkhoff, Sarno, Schmeling, and
Schrimpf, 2016). We contribute to the literature by assessing the impact of large and small
dealers on liquidity conditions in both spot and FX swaps.
    Finally, we contribute to academic literature on CIP violations in a non-crisis time, be-
ginning with Du, Tepper, and Verdelhan (2018), who show that neither credit risk nor trans-
actions costs can explain the anomaly in the period of relative post-crisis calm. Some studies
have focused on the demand-side for FX hedges (Bräuning and Ivashina, 2017; Iida, Kimura,
and Sudo, 2018; Borio, Iqbal, McCauley, McGuire, and Sushko, 2016; Abbassi and Brauning,
2018), others on liquidity and risk premia asymmetries in the respective money markets,
(Rime, Schrimpf, and Syrstad, 2017; Wong and Zhang, 2017). In turn, Avdjiev, Du, Koch,
and Shin (2019) relate CIP deviations to the shadow price of bank leverage that fluctuates
with US dollar exchange rate. We contribute to this literature by documenting dynamics
arising from the supply side of FX swaps. Specifically, the pull-back from liquidity provision
in FX swaps by the dealing desks of G-SIB banks constitutes another contributing factor to
which such trades and the associated market positions can be funded. Importantly, funding instruments
are themselves traded, and their pricing can affect market liquidity conditions, which can then feed back to
funding costs.

                                                     4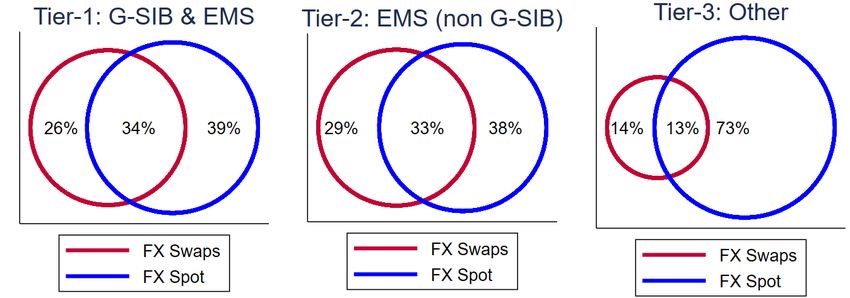
CIP deviations, particularly at quarter- and year-ends. Hence, we emphasize a somewhat
different channel than Cenedese, Della Corte, and Wang (2018), who find a link between the
leverage ratio of major bank dealers with wider CIP deviations in the following quarter.

3       Data and Variable Definitions

We obtain tick-level data for JPY/USD and EUR/USD spot exchange rate, 1-month swap
points, and 1-month OIS rates from Thomson Reuters (Refinitiv as of 2018) Tick History
data, distributed via Reuters Datascope. Our sample period runs from 1st February 2010
to 31st May 2017. The dataset contains information on dealers’ best bid and ask quote
submissions, timed at the milli-second frequency. It documents the name and location of
the dealer bank that submitted the quote. We also obtain information on 1-month overnight
indexed swap rates for both countries. Table 1 shows the sample of tick history data for a
two-second window for spot JPY/USD.5

                                         [Table 1, about here]

    We conduct our main analysis at the hourly frequency in order to circumvent problems
arising from microstructure noise. For bid and ask price quotes for spot rate, 1-month FX
swap points, and OIS rates, we use the last available price quote in each hour. In addition,
we count the total number of quote submissions in each hour and total number of unique
banks actively posting quotes in each hour.
   Next, while activity on FX markets is not restricted to specific trading hours, we clean the
data in the spirit of earlier studies (e.g. Andersen, Bollerslev, Diebold, and Vega, 2003) and
exclude certain trading hours and holidays with abnormal low trading volume. On weekends
and in the occasion of a holiday, we delete data entries between 21:00 (GMT) of the previous
day until 21:00 (GMT) of the holiday itself. For example, we drop information on weekends
from Friday 21:00 until Sunday 21:00. We drop data on fixed holidays such as Christmas
    5
    While containing important information on quoting activity by FX dealer banks, our dataset is also
subject to a number of limitations. First, it is primarily based on quotes supplied to Thomson Reuters
(now Refinitiv). Second, the data only has information on quotes and not traded prices or volumes, which
precludes us from computing a number of popular measures of market liquidity based on the volume-return
relationship. Third, the dataset does not contain information on the depth of the order-book or order size.
Lastly, trading venues such as Electronic Broking Services (EBS) have larger trading volumes for EUR/USD
and JPY/USD. As these are the two most frequently traded exchange rates, however, we believe it is pivotal
to shed light on the link between liquidity dynamics and dealer activity in spot and swap market of these
two currency pairs. Breedon and Vitale (2010) show that dynamics between EBS and Reuters are highly
correlated and both markets are closely linked with each other.

                                                    5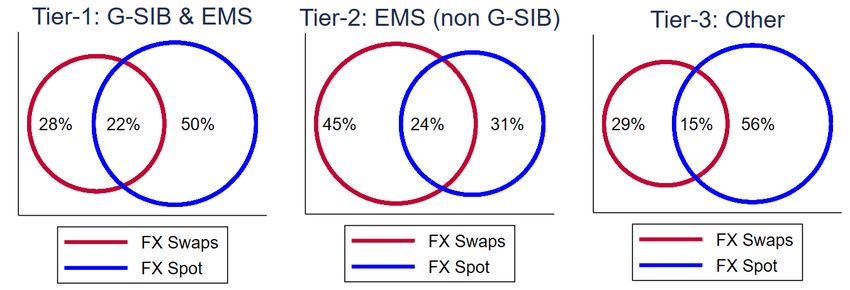
(24th - 26th December), New Year’s (31st December - 2nd January) and July 4th.6 In
addition, we exclude flexible holidays, such as Good Friday, Easter Monday, Memorial Day,
Labour Day, and Thanksgiving and the day after. For the entire sample period, we obtain
44,088 hourly observations for JPY/USD and EUR/USD each.

3.1     Price measures of market liquidity

After these steps of data cleaning, we construct the measures of market liquidity, employing
spot dealers’ spot bid and spot ask prices and FX swap dealers’ quote bid and ask swap
points. We define the 1-month forward rate implied by swap points: F = S + SP ∗ 10−2 for
USD/JPY and F = S + SP ∗ 10−4 for USD/EUR, where S denotes the spot rate and SP are
1-month swap points. Following Banti and Phylaktis (2015) we measure market liquidity at
the hourly frequency in the foreign exchange spot and swap market by the bid-ask spread

                                                Shask − Shbid
                                      SpreadSh =                                                    (1)
                                                    Shmid
                                                F ask − F bid
                                      SpreadFh = h mid h                                            (2)
                                                    Fh

   where the mid-price is calculated as the arithmetic average between ask and bid price in
each respective market segment. The bid and ask forward exchange rates, Fhbid and Fhask , are
implied by the swap points quoted by dealers in FX swaps.

3.2     Price measures of funding liquidity

Swap point quotes from FX swap dealers contain another important piece of information:
the cost of term funding of one currency against another. For example, if the reported swap
points are negative, this indicates that USD is trading at a forward discount compared to
the quoted currency. Hence, the pricing of FX swaps reflects the costs of obtaining say USD
today at the spot rate S in exchange for say JPY, and reversing this transaction in one month
at the pre-agreed forward exchange rate F .7
   Thus, our main measure of FX funding liquidity is based on the forward spread, which
we calculate as:
  6
    In 2015, the official holiday is 3rd July, since July 4th falls on a Saturday.
  7
    See, for example, Rime, Schrimpf, and Syrstad (2017), who document increasing importance of FX swaps
as funding instruments used by banks.

                                                   6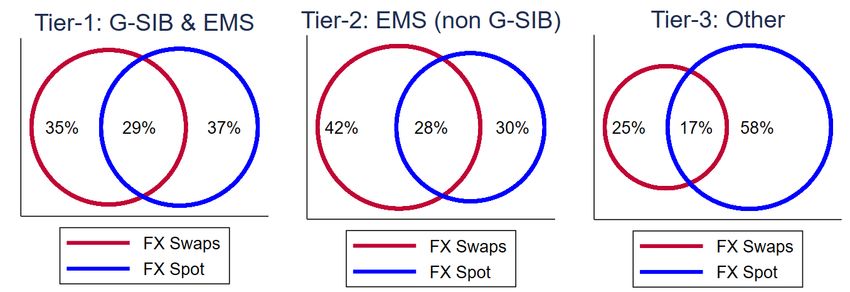
Fhmid − Shmid
                                      F discounth =                                                       (3)
                                                              Shmid

    where F mid and S mid refer to the mid-price of 1-month forward and spot rates, respec-
tively.
    As an alternative measure of funding liquidity, we adjust the forward spread (forward
discount) by the level of benchmark interest rates, OIS rates, in the two currencies of the
same maturity. This is because, over a longer horizon, the level of the forward-spot differ-
ential should change to reflect the relative interest rate differentials in the two currencies,
as stipulated by the CIP. Hence, an alternative measure of FX funding liquidity is based on
annualising the implied 1-month interest in the raw forward discount, then adjusting it by
the OIS rates in the two currencies. Effectively this comes down to computing deviations
from CIP:8

                                                                                  (360/30)
                                     rmid       rmid∗                     Fhmid

                      CIP devh = (1 + h ) − (1 + h ) ×                                                    (4)
                                      100        100                      Shmid

       where rhmid and rhmid∗ refer to the mid-price OIS rates of both currencies.
    By now, it should be fairly obvious that the pricing of FX swaps is reflective of both
market and funding liquidity.9 First, the quotes for swap ask (bid) points are the quotes for
the differential between ask (bid) spot and ask (bid) forward rate, hence they reflect market
liquidity conditions in FX swaps. Second, the forward discount implicit in the swap points
provides a measure of term funding of one currency against another, hence it reflects FX
funding liquidity conditions.

3.3       Quantity measures of FX liquidity

We compute additional quantity-based measures that account for FX dealer structure and
quoting activity. First, following Huang and Masulis (1999), we measure dealer competition
   8
     That said, adjustment of the forward discount by the OIS rates should not be considered as a measure
of CIP arbitrage profits (see, for example, Rime, Schrimpf, and Syrstad, 2017), but is simply used to account
for the relative cost of funding liquidity via FX swaps in the two currencies taking into account the level of
benchmark interest rates.
   9
     See Baba, Packer, and Nagano (2008) for an exposition of cash flows in an FX swaps.

                                                      7
by tracking the total number of quote submissions per hour. We do this not only for spot,
but also for forward point quotes in FX swaps, with the number of quotes per hour denoted
by QSh and QFh , respectively. In addition, we construct a measure of dealer competition at
the extensive margin by counting the total number of active unique dealer banks within each
hour. We denote this measure as NhS and NhF for spot and forward points, respectively.
We treat all dealers from the same bank, independently of their geographical location, as
one dealer bank. Lastly, we combine these two variables and measure quoting intensity as
QS QF
the ratio of submitted quotes and active banks ( N hS ) and ( N hF ). We interpret this measure
h h
as indicator of dealer competition at the intensive margin. An overview of our measures is
provided in Table 2.
[Table 2, about here]
4 Liquidity Provision Over the Long-Run
4.1 Liquidity at daily frequency and quarter-end anomalies
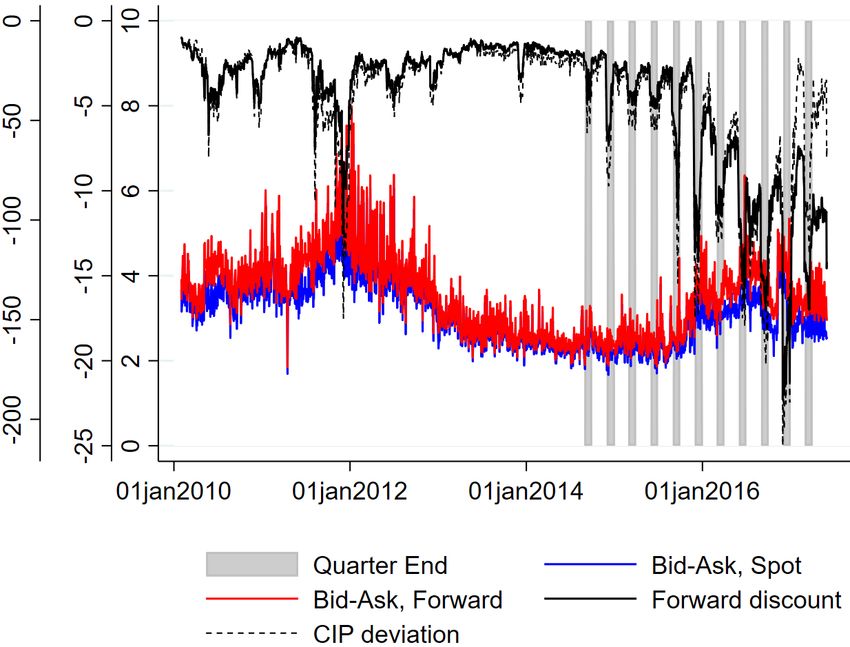
Figures 1a and 1b show the dynamics of the price-based liquidity measures for JPY/USD and
EUR/USD, respectively. Market liquidity in the spot and swap markets move very closely
(correlation of 0.97 for JPY/USD and 0.98 for EUR/USD) over most of the sample period.
For both currency pairs, bid-ask spreads widened during the European debt crisis at the end
of 2011 and beginning of 2012. They subsequently narrowed, but began widening gradually
for both currencies from mid-2014 until the end of the sample. Since higher bid-ask spreads
are associated with more illiquid market conditions, this suggests that market liquidity has
declined towards the end of our sample.
[Figure 1, about here]
We observe a similar pattern for funding liquidity. As indicated by the black lines, there
was a temporary increase in the (absolute) forward discount in the period around the height
of the European debt crisis. After improving in the 2012-13 period, funding liquidity began
deteriorating on a re-occurring basis at quarter-ends from the third quarter in 2014 onwards.
Table 3 shows summary statistics for price-based FX liquidity measures on the months
falling on quarter-ends (QE) compared to non-quarter-end (NQE) months. The sample is
split according to the apparent regime change in FX liquidity conditions with the emergence
8of the quarter-end turn in forward discount in September 2014 for JPY/USD and March
2015 for EUR/USD. Accordingly, we pick the second sub-sample cut-off two month prior to
the QE month for each currency pair. For each liquidity measure, Panel A shows the average
level, difference with NQE monthly average, and p-values of a one-sided t-test. Panel B
shows the average volatility of each liquidity measure on QE months, difference with NQE
monthly average, and p-values of the variance ratio test.
[Table 3, about here]
The table shows that FX funding liquidity, as measured by either F discount, or forward
discount adjusted by the level of benchmark interest rates, CIP dev, deteriorates significantly
at quarter-end months over the entire period (both wider spreads and higher spread volatil-
ity), but the magnitudes of the fall in liquidity at quarter-ends are several times larger in
the second period. In addition, spot market liquidity in JPY/USD has also began exhibiting
significant deteriorations at quarter-ends in the second period, as indicated by wider level
and volatility of bid-ask spreads in spot. Market liquidity in EUR/USD appears less affected,
although the volatility of bid-ask spreads particularly in the swap market, but also to a lesser
extent in spot, has risen.
These quarter-end anomalies are a recent phenomenon that has emerged since about
September 2014 for JPY/USD (March 2015 for EUR/USD). Their origins are exogenous to
the FX market as such, attributed to the window dressing by global banks, as some banks
shrink their balance sheets so as to manage their regulatory costs associated with the new
post-crisis capital and liquidity requirements. Such balance sheet window-dressing appears
to have first-and-foremost affected short-term money markets and on balance sheet funding
instruments, such as repurchase agreements (CGFS, 2017 and Aldasoro, Ehlers, and Eren,
2018). However, strong effects have also been documented for off-balance sheet instruments,
such as FX swaps (see Du, Tepper, and Verdelhan, 2018).
4.2 G-SIBs compared to other large and small FX dealers
Since we know which dealer is actively posting quotes, we can distinguish according to dealer
characteristics. Phylaktis and Chen (2010) relied on the ranking of the Annual Euromoney
Survey (EMS) to classify dealers by their FX business size. We follow the same methodology
and classify as large FX dealers those that appear in the Euromoney league tables, with the
rest classified as small dealers. On top of this, we layer another classification of whether the
9dealer’s parent bank has been designated as a G-SIBs according to the Financial Stability
Board’s (FSB) designation (BIS, 2011, 2013).
As an example, Table 4 shows the comparison between the thirty G-SIB bank dealers and
the top FX dealers according to the 2016 Euromoney survey. While almost all 30 G-SIBs are
ranked as top FX dealers in the Euromoney Survey (Table 4, left column),10 27 additional
banks have large enough FX business to be ranked in the Euromoney FX Survey but are not
in the list of G-SIBs.
[Table 4, about here]
Distinguishing between G-SIBs and other banks is important because of the way FX
swaps are treated in regulatory accounting and banks’ capital requirements. All banks are
subject to leverage ratio requirements. Calculation of exposure under the leverage ratio for
the purposes determining required capital is based on banks’ so-called “on-balance sheet”
instruments, such as loans, securities, or repurchase agreements. Hence, window dressing
around reporting of the Basel III leverage ratio has been associated with liquidity droughts
in repo markets (CGFS, 2017; Kotidis and Van Horen, 2018; BCBS, 2018), because entering a
repo contract directly contributes to the on-balance sheet exposure under the leverage ratio.
In contrast, FX swaps fall in the category of the so-called “off-balance sheet” instruments.
As such, their contribution to exposure under the leverage ratio primarily works through
what is known as an “add-on factor”’ for potential future exposure (PFE). For FX and gold
derivatives of maturities less than or equal to one year, the PFE factor is 1%. This means
that only 1% of the banks’ FX swaps position counts towards the calculation of exposure
under the leverage ratio, BCBS (2014). By contrast, the entire notional amount of FX
swaps book contributes to the G-SIB score via the so-called complexity component, BCBS
(2013). Hence, the direct incentive to window-dress FX swaps exposure is limited to banks
classified as G-SIBs. These institutions have an incentive to manage broader exposures that
contribute to different components of the G-SIB score in order to avoid crossing in the next
G-SIB bucket.11
10
The only exception is Mizuho FG, which is classified as G-SIB but not listed in the Euromoney Survey.
Note that non-bank market-makers such as Citadel Securities, XTX Markets, Tower Research Capital, or
Virtu Financial do not appear in our database by name. This is because their activity is prime-brokered by
major FX dealers banks. Therefore the quotes of such non-bank market-makers appear under their prime-
broker’s name and not their own. Dealers that are not part of our database are marked in grey in Table
4.
11
Appendix Figure A1 illustrates this using end-2016 G-SIB scores for the banks in our sample for
JPY/USD. Note, off-balance sheet derivatives, including FX swaps, are only one part of the total score
(contributing to about 1/3 of one out of five (20%) components of the G-SIB score, BCBS (2013)).
10[Figure 3, about here]
Figures 2a and 2b show, using Venn diagrams, the relative size of activity in FX swaps
and spot in the 2010-2014 versus the 2014-2017 periods for three types of dealers: G-SIBs,
EMS (non G-SIB), i.e. large FX dealers but not G-SIBs, and Other, i.e. those banks not
listed in the Euromoney tables.12 For conciseness, we will refer to these categories as Tier-
1, Tier-2, and Tier-3 dealers, respectively. The figures show that Tier-1 dealers (G-SIBs)
decrease the share of quotes in FX swaps from 55% in the 2010-2014 period to 50% in the
2014-2017 period, while Tier-2 (non G-SIB large dealers) and Tier-3 (small dealers) increased
the share of their quoting activity devoted to FX swaps over the same period (from 66% to
69% and from 31% to 44%, respectively). Hence, the demarcation of the shift in FX swaps
business run along the G-SIB vs non G-SIB split, rather than being a common feature due to
all banks having to adhere to the Basel III leverage ratio. Figure 2c further shows that the
shift away by G-SIB dealers from quoting prices for both FX swaps and spot to only quoting
spot was particularly pronounced around quarter- and year-ends.
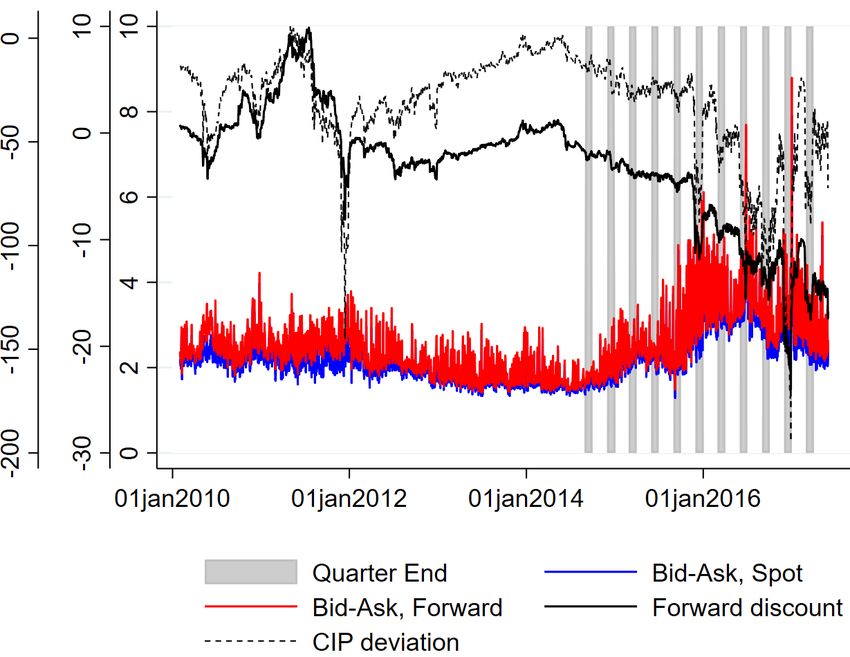
[Figure 4, about here]
Figures 4a and 4b plot the quoting intensity of smaller dealers in the swap market against
CIP deviations that take account of transaction costs (measured by bid-ask spreads). The
figures show that quoting intensity in FX swaps by Tier-3 (small) dealers, QF,T t
3
/NtF,T 3 , is
inversely related to liquidity conditions in FX swaps. Whenever bid-ask spreads and forwards
spreads widen, as measured by the transaction cost-adjusted CIP deviations, small dealers
tend to increase their quoting intensity. This was temporarily the case during the euro
area sovereign debt crisis, but became more persistent since about mid-2014 as price-based
measures of FX liquidity conditions deteriorated first in JPY/USD and then in EUR/USD.
One possibility is that smaller institutions, not constrained by G-SIB surcharge or that have
greater balance sheet availability, are trying to take advantage of the dislocations in FX swap
markets.13
12
Recall, our data only covers instruments for which quotes were supplied to Reuters Datascope and only
FX swaps of 1-month tenor. Therefore, the Venn diagrams are by no means meant to be representative of
the entire FX swap and spot business of dealers in our sample.
13
We also examined the possibility that small dealers may be posting skewed bid and ask quotes in FX
swaps, which would suggest FX swap use for funding purposes rather than passive liquidity provision. We
found not evidence of quote skewing.
115 Intraday FX liquidity Dynamics
In this section, we move to the analysis at the hourly frequency, using measures constructed
from tick-level data and described in Table 2. Figures 5 and 6 show the variation in FX
market and funding liquidity in spot and swap markets during the trading hours for the two
sub-sample periods for JPY/USD and EUR/USD, respectively. Market liquidity (measured
by bid-ask spreads) tends to be lower during the beginning and end of the trading day,
resembling a U-shaped form of liquidity (blue bars). Measures of FX funding liquidity, both
F discount and CIP dev, also exhibit a U-shape, indicating worse liquidity conditions when
London and New York based dealers are absent.
Red lines indicate averages for each trading hour during quarter-end months. As shown in
Figure 5a, market liquidity changed little during quarter-ends in the February 2010 to June
2014 period, but FX funding liquidity conditions were usually worse. During the second
sub-sample period, from July 2014 to May 2017, shown in Figure 5b, FX funding liquidity
measures are considerably worse in levels (blue bars), and their deterioration at quarter-ends
is much larger in relative terms, with spreads in both F discount and CIP dev about two times
wider (red lines). Furthermore, unlike the earlier period, bid-ask spreads exhibit widening at
quarter ends for both spot at swap markets, indicating possible spillovers from FX funding
to FX market liquidity at quarter-ends during the most recent period. Figures 6a and 6b
show qualitatively similar results for EUR/USD.
[Figures 5 and 6, about here]
Statistical tests confirm that intraday co-movement between FX market and funding liq-
uidity has strengthened since the appearance of quarter-end anomalies in funding markets in
mid-2014 for JPY/USD and early 2015 for EUR/USD. Table 5 shows that pairwise correla-
tions as well as percentage of variation explained by a common factor has increased across
all combinations of bid-ask spreads in spot and swaps with FX funding liquidity measures,
for both currency pairs.
[Table 5, about here]
5.1 Hourly liquidity dynamics in the two sub-periods
The descriptive statistics point towards time-varying liquidity dynamics across sub-sample
periods. They also indicate that the co-movement between FX market and FX funding
12liquidity conditions intensified in the last sub-sample period. While funding liquidity has
tended to deteriorate at quarter-ends even in the pre-2014 period, these funding liquidity
droughts have intensified since mid-2014. Furthermore, it is only in the latest sub-sample
period that FX funding liquidity droughts appear to spillover to market liquidity conditions.
To formally examine the relationship between liquidity conditions in spot and swap mar-
kets, and the interaction between their market liquidity and funding liquidity components,
we estimate a conditional error correction model (ECM), derived from an autoregressive dis-
tributed lag model specification for the two sub-sample periods. Following Pesaran, Shin, and
Smith (2001) the specification allows to assess the long- and short-run specification between
a set of variables independent of the order of integration of the variables in our system.
As the dynamics of variables vary across the sample period, displaying mean-reversion in
some months but high persistence in others, inferences about non-stationarity from standard
unit root tests are highly dependent on the chosen time-period. Modelling the relationship
between dealer activity and liquidity in an ARDL model, however, allows us to take an agnos-
tic view about the order of integration, and to model long- and short-run dynamics without
classifying variables as either stationary or non-stationary We formulate the following two
conditional ECMs as:
23 p−1
X X
∆SpreadPh =α+ δi Hi + θ0 SpreadPh−1 + θxP
h−1 + P
γi ∆zh−i + β∆xP
h + uh (5)
i=1 i=1
P 0
where zP P P P P P P P
h = (Spreadh , |F discount|h , QT 1,h /NT 1,h , QT 2,T 3,h /NT 2,T 3,h , V olh ) = (Spreadh , xh )
is a vector of endogenous variables. T 1, T 2, T 3 denote G-SIB and non G-SIB dealers, for
both spot and swap quotes, P = S, F . The vector contains bid-ask spread as a measure of
market liquidity, absolute forward points as a measure of funding liquidity (funding costs),
quoting intensity of large and smaller dealers, and realized volatility as control variables.
α denotes an intercept and the term 23
P
i=1 δi Hi refers to hourly dummy variables and their
associated coefficients. Long-run dynamics are captured by the lagged terms of the depen-
dent and independent variables while short run dynamics are driven by the contemporaneous
and lagged differenced terms. We test for the existence of a long-run relationship applying
Pesaran, Shin, and Smith (2001) bound testing procedure. First, we test if all long-run co-
efficients are significantly different from zero using a F-test (H0 : θi = 0). Second, we test
if the coefficient of the cointegrating relationship is smaller and significantly different from
zero. We estimate the identical model specification for every sub-sample period and only
vary the number of lags p. Then we examine the significance of the long-run coefficients.
13If both null hypotheses are rejected, we conclude that there exists a long-run relationship
between variables in vectors z S in spot and z F in FX swaps.
Table 6 shows the coefficient estimates of the long-run equations, expressed in terms of
economic magnitudes by scaling by the standard deviations of the regressors.14 The reported
F-statistics of the Pesaran, Shin, and Smith (2001) bounds test exceed I(1) critical values
for all equations, indicating the presence of a statistically significant long-run relationship
among the selected measures of liquidity and volatility. The results are obtained controlling
for time-of-day effects with hourly dummies, as well as for intraday volatility in both spot
and swap markets.
[Tables 6, about here]
The ECM-ARDL model estimation results point at several takeaways. First, there is a
strong and robust relationship between FX market liquidity, as proxied by bid-ask spreads
in both swap (SpreadF ) and spot (SpreadS ), with FX funding liquidity, as proxied by the
absolute forward discount (F discount). For example, a one standard deviation widening in
F discount is associated with 41.6bp (26.5bp) wider bid-ask in JPY/USD (EUR/USD) swap,
and a 64.9bp (8.4bp) wider bid-ask spread in JPY/USD (EUR/USD) spot. The link between
funding and market liquidity strengthens in the second sub-sample period, particularly for
JPY/USD where the economic magnitude of the coefficient on F discount increases more than
three-fold in the swap bid-ask spread equation. For EUR/USD we also observe a substantial
strengthening of the liquidity relationship from 6.9bp to 26.5bp in the swap market, while the
relationship in spot increases only slightly and remains comparably low.
Second, the positive net effect of dealer competition on market liquidity in FX swaps
has all but disappeared. A one standard deviation increase in the quoting intensity by
G-SIB dealers in the swap market, QFT 1 /NTF1 used to be associated with a 28.7bp (14.7bp)
narrowing of bid-ask spreads on JPY/USD forward rate spread (EUR/USD forward rate
spread) in the 2010 to mid-2014 (December 2015 for EUR/USD), but the effect becomes
small (and also not statistically significant for EUR/USD) in the second period. In contrast,
the negative association between quoting intensity of non G-SIB (Tier-2 and Tier-3) dealers,
QFT 2,T 3 /NTF2,T 3 , and market liquidity in FX swaps has persisted for both currency pairs, and
even strengthened significantly in the case of EUR/USD. Thus, a one standard deviation
increase in QFT 2,T 3 /NTF2,T 3 is associated with 0.31bp (0.04bp) wider bid-ask spread in FX swap
market for JPY/USD (EUR/USD).
14
Appendix Table A5 and Table A6 show the complete test results for the long-run relationship among the
variables for JPY/USD and EUR/USD, respectively.
14Third, in contrast to the swap market, dealer competition in the spot market has contin-
ued to contribute to significant narrowing of bid-ask spreads also in the post-2014 period. A
one standard deviation increase in quoting intensity by G-SIB dealers in spot, QST 1 /NTS1 , is
associated with 20.5bp (35.9bp) narrower bid-ask spreads in JPY/USD (EUR/USD) spot.
Fourth, rises in non G-SIB dealer activity in swaps appears to have negative spillovers on
spot market liquidity. Specifically, even though non G-SIB dealer competition in spot markets
does not seem to have a statistically significant effect on market liquidity in JPY/USD and
EUR/USD, higher quoting intensity by Tier-2 and Tier-3 dealers in swaps is associated with
wider bid-ask spreads in the spot (Table 6, last column). Similarly, when small dealer quoting
intensity in EUR/USD spot is replaced with small dealer quoting intensity in swaps in the
SpreadS equation, the coefficient is two times larger in magnitude and takes on a positive
sign.15
5.2 Isolating small dealer impact
While we have separated tier-1, G-SIB, banks from the remaining dealer universe in the pre-
vious estimations, in this analysis we further account for the difference within the remaining
dealers between those that make it into the Euromoney Survey, tier-2, and small FX dealers
that do not, tier-3. We re-examine the estimation of the ARDL-ECM model of Equation 5
and then discuss the impact of dealers’ quoting intensity on the forward spread dispersion.
Table 7 displays the economic impact of a change in dealer quoting intensity for each of the
three dealer types. Coefficients are scaled by the sample standard deviation.16
Focusing on the second sub-sample, the positive impact of quoting intensity of the three
different groups on market liquidity conditions declines almost monotonically in magnitude or
statistical significance from tier-1 to tier-3 banks. For example, for JPY/USD an increase in
tier-1 quoting intensity leads to a decline in market liquidity in the swap market by 10.2bp,
tier-2 dealers lower the spread, though the effect is not significant, and a one standard
deviation increase of tier-3 dealer quoting intensity significantly worsens market liquidity
conditions by 66.2bp. Further, we find that activity of tier-3 dealers (40.5bp) deteriorates
liquidity conditions in the spot market by a factor more than six times as large as the
quoting intensity of tier-2 dealers (6.1bp). For EUR/USD, we document similar market
characteristics, though the impact of quoting intensity of tier-2 and tier-3 dealers on market
15
The results are also robust to measuring FX funding liquidity using CIP deviations instead of the un-
adjusted forward discount (see Appendix Tables A7 and A8).
16
The raw regression coefficients and cointegration parameters for both currency pairs are shown in Ap-
pendix Tables A9 and A10.
15liquidity dynamics is lower than for JPY/USD.17
[Table 7, about here]
5.3 Adverse liquidity effects of shift towards small dealers
What are the possible economic reasons behind the negative relationship between FX market
liquidity and small dealer competition? The first reason is that small dealers charge higher
spreads. This can be gleaned from Table 8, which shows simple average of the median hourly
bid-ask spreads and forward discounts computed from forward quotes by large and small
dealers. For both JPY/USD and EUR/USD, the bid-ask spreads of forward rates (expressed
as a percentage of mid-forward rate, in basis points) are significantly higher for small dealers
compared to large (Tier-1 and Tier-2) dealers. Similarly, the forward discount (forward
spread, expressed as a percentage of mid-spot rate) is also somewhat wider for small dealers
compared to larger dealers. This is consistent with small dealers facing higher hurdle rates to
enter as market-makers in the swap market, presumably due to being smaller volume players.
Hence, their competition does not lead to the narrowing of the spreads to the levels that can
be supported by large dealers.
[Table 8, about here]
The second reason for the negative relationship between FX market liquidity and small
dealer competition in the swap market relates to the relative informational disadvantage of
small dealers compared to large dealers. Bjonnes, Osler, and Rime (2009) find that order
flow of large dealer banks is more informative than that of small banks, in terms of return
predictability. Menkhoff, Sarno, Schmeling, and Schrimpf (2016) find evidence that informa-
tive order-flow of sophisticated investors affects foreign exchange rate via the intermediation
of large dealers. Our logic is consistent with this literature. Large dealers intermediate the
lion share of customer flows inside their internal liquidity pools. This would suggest that,
on average, large dealers possess more precise information about the “true” market forward
exchange rate at any point in time, because they intermediate FX swap buying and selling
by a large and diverse client base.
In order to test this, we follow recent studies which assess the distribution of quote sub-
missions. For example, Corsetti, Lafarguette, and Mehl (2017) use information on both
17
Appendix Tables A11 and A12 that the results are qualitatively similar if funding costs are measured by
CIP deviations instead of by the forward spread.
16quotes and trades to construct a quote dispersion measure that accounts for market partic-
ipants’ reaction to new information based on the speed of trade execution. As we do not
possess information on trades but only on quote submissions, our measure of dispersion fol-
lows Jankowitsch, Nashikkar, and Subrahmanyam (2011) and is applied to forward quotes
within each hour:
v
u hi
uX q F Fi − F̄h
F i
Disph = t (6)
i=1
QFh F̄h
where qiF accounts for the number of forward quote submissions within a minute, QFh
denotes the total number of submissions within the hour, Fi denotes the forward mid price
in minute i and F̄h is the average forward price of each hour. In times of higher volatility
and low liquidity, we expect the dispersion of quotes to be comparably larger and DispFh to
increase.
We then once again formulate a conditional ECM, but for the system that includes DispFh ,
quoting intensity by large and small dealers, and hourly volatility of the forward rate, V olhP ,
as control:
23 p−1
X X
∆DispFh =α+ δi Hi + θ0 DispFh−1 + θxh−1 + P
γi ∆zh−i + β∆xP
h + uh (7)
i=1 i=1
F 0
zF F F F F F
h = (Disph , Qj,h /Nj,h , V olh ) = (Disph , xh ) and j = T 1, T 2, T 3, denotes Tier-1 (G-
SIB), Tier-2 (non G-SIB large), and Tier-3 (small) dealer quoting intensity, respectively.
Table 9 shows the results.
In the top panel, coefficients are scaled by the variables’ standard deviation, while the
bottom part of the table displays the raw long-run coefficients of Equation 7. Consistent
with the hypothesis outlined above, higher quoting intensity by G-SIB bank dealers leads to
a significant decline in the dispersion of forward quotes of 14.4bp for JPY/USD and 10.4bp
for EUR/USD. Quoting intensity by non G-SIB large FX dealers (Tier-2) does not lower the
quote dispersion for JPY/USD, while it does lower dispersion for EUR/USD, but to a lesser
degree compared to the effect of G-SIB dealer quoting activity (7.7bp). Notably, coefficients
of small dealer (Tier-3) quoting intensity are positive for both currency pairs, indicating that
banks with a smaller customer base and those that are likely exposed to lower volumes of
17customer order flow contribute to a wider dispersion of forward quote submissions. This effect
is particularly large for JPY/USD (33.3bp) while smaller and not significant for EUR/USD
(1.4bp).
[Table 9, about here]
To summarise, the results reported in Tables 8 and 9 indicate that two effects are at
play in generating the negative relationship between liquidity in the FX swap market and
competition by small dealers. The first one relates to their wider required intermediation
spreads, both bid-ask spreads and the forward spread (forward discount). The second one
relates to their informational disadvantage and hence greater uncertainty about the actual
market mid-rate for pricing FX swaps, which leads to greater dispersion and volatility of the
forward quotes.
5.4 Quarter-end contagion from FX funding liquidity to market
liquidity in spot
In this subsection, we test for the presence of contagion from funding markets to market
liquidity at quarter-end balance sheet reporting periods, when large dealers pull back and
small dealers increase their quoting intensity in FX swaps.
We follow Forbes and Rigobon (2002) and calculate an adjusted correlation coefficient
using hourly data. We then test for regime shifts between quarter-end and non-quarter end
months.18 Adjusting the correlation coefficient for heteroskedastic levels of volatility allows us
to make further statements about contagions and spillovers, rather than simple co-movement.
To this end, we estimate the following bivariate vector autoregressive model:
∆yh = φ(L)∆yh−1 + ηh (8)
∆yh = ∆F discounth , ∆SpreadPh where P = F, S
(9)
where ∆yh refers to the first differenced and de-seasonalized measures of funding and
market liquidity. First, we de-seasonalise the FX liquidity metrics by regressing their changes
on hourly dummies. Second, we estimate Equation (8) using a 200-hour rolling window
18
Using a vector autoregression framework, Moinas, Nguyen, and Valente (2017) exploit regime shifts of
volatility levels to examine liquidity dynamics in the European treasury bond markets.
18and store the variance-covariance matrix for every single estimation.19 Third, based on
the obtained variance-covariance matrices from the hourly VAR regressions, we follow the
approach in Forbes and Rigobon (2002) and construct an unconditional correlation coefficient
as follows:
ρ∗
ρ= p (10)
(1 + δ[1 − (ρ∗ )2 ])
σFQE
discount
with δ = N QE
−1
σF discount
where ρ∗ refers to the standard correlation coefficient between funding and market liq-
uidity, and σFQE N QE
discount and σF discount refer to the average variance of FX funding liquidity in
quarter-end months (QE) and the two preceding non quarter-end months (N QE), respec-
tively. Since the intra-day data allows us to construct the measure of co-movement for every
rolling window estimation, we are able to obtain a time series of unconditional correlation
coefficients for each QE and N QE period.
Having obtained the time-series of the adjusted correlation coefficients between funding
and market liquidity measures in quarter-end months and the preceding two months, we then
employ a one-sided t-test to examine the following hypothesis:
H0 : ρN QE < ρQE | ρQE < 0 HA : ρN QE > ρQE | ρQE < 0
where ρN QE and ρQE refer to the average of the adjusted correlation coefficients in the
non-quarter-end and quarter-end months. Rejecting the null hypothesis indicates that the
shocks to F discount in a quarter-end month lead to spillover to bid-ask spreads, even after
adjusting for the higher level of volatility of funding conditions during these periods.20
[Table 10, about here]
Table 10 shows the results for JPY/USD. The average adjusted correlation coefficient is
negative in a number of quarter-end as well as non-quarter-end months in both spot (upper
19
Every rolling estimation initially allows for 8 lags but we increase the lag length in a step-wise fashion
until residuals are free of serial correlation.
20
Qualitatively the same conclusions are drawn when shocks to CIP deviations at quarter-end months are
considered. Results are summarized in Table A13 and A14 for JPY/USD and EUR/USD, respectively.
19panel) and swaps (lower panel). Based on the t-test conducted on the adjusted correlation
coefficients, we are able to reject the null of no spillovers in 3 out of 11 quarter-end months
considered for spot, and 4 out of 11 quarter-end months for forwards. Hence, the evidence
in favour of contagion from FX funding to FX market liquidity in JPY/USD is strongest for
December 2015, June 2016, and December 2016.
[Table 11, about here]
Table 11 shows the analogous test results for EUR/USD. Similar to JPY/USD, the number
of months in which the null is reject in favour of contagious spillovers is higher for swap bid-
ask spreads than for spot bid-ask spreads. At the same time, the overall number of months, in
which the results point towards contagion from FX funding liquidity to FX market liquidity,
is slightly less that for JPY/USD. Still, both December 2015 and December 2016 turn out
to be the quarter-end periods with the most robust evidence in favour of contagions, rather
than simple co-movement. It is noteworthy that these months also fall on year-ends, when
additional G-SIB surcharges apply to large dealer banks’ balance sheets.
Overall, the empirical evidence suggests that a deterioration in funding liquidity at
quarter-ends can spillover to market liquidity in spot and swap market. Taken together
with our previous results on dealer activity, these findings suggest that the pull-back by G-
SIBs from dealing in FX swaps at quarter- and year-ends can have a particularly contagious
implications for spot market liquidity.
5.5 Small dealer market-making: case study of December 2016
In this sub-section we provide evidence that smaller dealers (non G-SIB banks) displaced large
dealers (G-SIB banks) as market-makers in FX swaps for both currency pairs and also in spot
markets for EUR/USD in December 2016. However, because these smaller volume players
require higher hurdle rates, in terms of both bid-ask spreads on the forward points that they
quote as well as wider forward discount, the increased competition by smaller dealers allows
the low FX liquidity environment to persist. In contrast, large banks continued to dominate as
market-makers in spot for JPY/USD and differences are very small for EUR/USD, indicating
that it is likely their balance sheet constraints on the exposures to FX derivatives that explains
their pull-back from quoting inside spreads in the swap market.
The left-hand panels of Figures 7 and 8 show the median hourly JPY/USD quotes of
smaller (Tier-2 & Tier-3, non G-SIB) dealers and large dealers (Tier-1, G-SIB) during De-
cember 2016, for spot and forward points, respectively. The top graph displays ask and
20the bottom graph the associated bid quotes. The right-hand panels show the hypothetical
location of small dealer quotes relative to large dealer quotes in the case that small dealers
are actively making markets by quoting inside spreads. If the actual quotes correspond to
the inside spread scenario, then this indicates that small dealers, not large dealers, would
have been making markets on average during this month. The comparison of actual data
(left) to the scenarios (right) in Figure 7 indicates that in December 2016, despite the pull-
back by G-SIB dealers form the market in the aggregate, they continued to make markets
in spot. However, the comparison of actual data (left) to the scenarios (right) in Figure 8 of
the FX swap quotes indicates that non G-SIB bank dealers displaced G-SIB bank dealers as
market-makers to clients in the FX swap market.
The results for EUR/USD, shown in Figure 9 and 10, are qualitatively similar for the
FX swap market and small players appear to act as market-makers. In the spot market,
differences in the submitted quotes of small and large dealers are low in magnitude and
spreads in spot and swap markets by the different dealer segments are very similar. Yet, in
contrast to JPY/USD it appears that during the majority of the day small dealers also act
as market makers in this market segment.
A hypothesis that we so far reject is that smaller banks enter the FX swap market to
source liquidity in one of the currencies. If this was the case, our test of inside versus outside
spread by dealer category would have shown smaller dealers providing skewed quotes relative
to large dealers. Data indicate that this is not the case.
Such entry of smaller dealers in FX swaps rather than spot as market-makers is consistent
with dealers belonging to the largest banks pulling back from trading in FX derivatives, but
continuing to make markets in spot. Hence, the results indicate that smaller dealers can
play an important role in market-making in FX swaps when large dealers manage down their
balance sheets, funding conditions are tight, and spreads are wide enough for smaller-volume
players to profitably engage as market-makers. In this context, special periods, like quarter-
ends, can be used for identification of funding liquidity effect on dealer competition and FX
market activity.
6 Conclusion
In this paper, we analyse the joint evolution of FX spot and swap market liquidity conditions.
We also draw on the pricing of both types of instruments to study the relationship between
FX market liquidity and FX funding liquidity. The assessment of liquidity conditions also
21You can also read