2021/22 Budget Wilfrid Laurier University - Inspiring Lives of Leadership and Purpose
←
→
Page content transcription
If your browser does not render page correctly, please read the page content below

Wilfrid Laurier University
Inspiring Lives of Leadership and Purpose

     2021/22 Budget

           Board Approved

                        June 3, 2021 – Board of Governors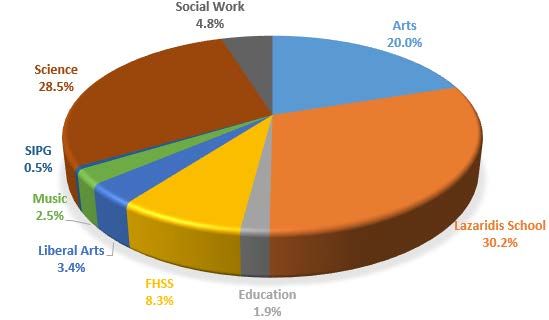
Wilfrid Laurier University Budget                                                                                                         June 3, 2021

Table of Contents
Part A – Overview ......................................................................................................................................... 5
           Executive Summary – 2021/22 Budget Highlights ........................................................................... 6
Part B - Operating Budget ............................................................................................................................. 8
   1. 2021/22 Budget Context .................................................................................................................... 8
   2. 2021/22 Budget Process ................................................................................................................... 13
           2.1 Revenue Process ...................................................................................................................... 16
           2.2 Enrolment (Undergraduate Headcount & Graduate Fall FTE) ................................................. 17
           2.3 Expense Process ....................................................................................................................... 23
   3. 2021/22 Operating Budget ............................................................................................................... 26
           3.1 Revenue Projections ................................................................................................................ 28
           3.1.1 Tuition Revenue .................................................................................................................... 28
           3.1.2 Government Grants .............................................................................................................. 30
           3.1.3 Total Revenue by Faculty ...................................................................................................... 30
           3.2 Expense Projections ................................................................................................................. 33
           3.2.1 Direct Cost of Teaching ......................................................................................................... 33
           3.2.2 Institutional Costs – Unit Oversight ...................................................................................... 34
           3.2.3 Institutional Costs – Central Oversight ................................................................................. 34
           3.2.4 Budget Targets ...................................................................................................................... 35
           3.2.5 Central Review of Preliminary Deficit Position ..................................................................... 36
           3.2.6 Essential Requests ................................................................................................................. 37
           3.2.7 Commentary to 2021/22 Budget by Expense ....................................................................... 38
           3.3 Budget by Faculty ..................................................................................................................... 42
           3.3.1 Shared Service Allocation ...................................................................................................... 42
Part C – Reserves ........................................................................................................................................ 43
Part D – Multi-Year Operating Budget Forecast ......................................................................................... 44
Part E – Ancillary Budget ............................................................................................................................. 49
Part F – Capital Budget................................................................................................................................ 53
Appendix I: Acronyms used in Budget document ...................................................................................... 56
Appendix II: Glossary of Budget Terms ...................................................................................................... 57

                                                                                                                                            Page 2 of 57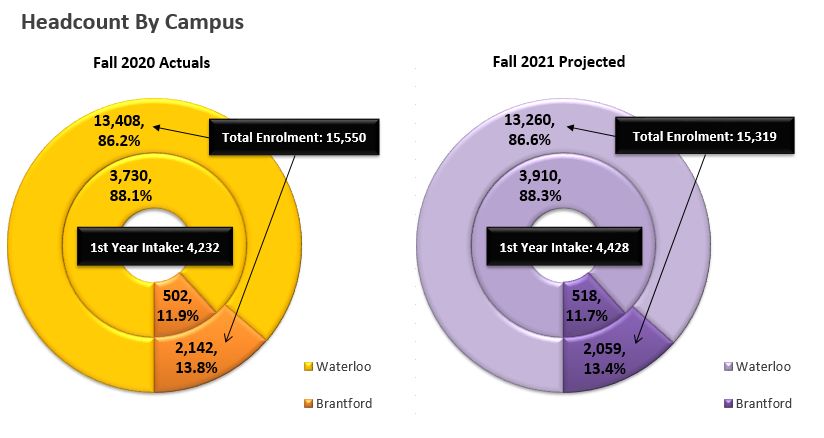
Wilfrid Laurier University Budget                                                              June 3, 2021

List of Tables
  Table 1        Forecasted Change in Total Students ……………………………………………………………………                        18
  Table 2        Fall Full-Time Headcounts – Undergraduate …………………………………………………………                      19
  Table 3        Graduate FTE by Program Category ………………………………………………………………………                          22
  Table 4        Graduate FTE by Type of Student …………………………………………………………………………                          22
  Table 5        Graduate FTE by Faculty ……………………………………………………………………………………….                            23
  Table 6        2021/22 Budget by Revenue & Expense ……………………………………………………………….                         27
  Table 7        Budgeted Operating Revenue Components ………………………………………………………….                         29
  Table 8        Major Sources of Government Grant Funding ………………………………………………………                       30
  Table 9        Total Revenue by Faculty .…………………………………………………………………………………....                         31
  Table 10       Direct Cost of Teaching ………………………………………………………………………………………...                          33
  Table 11       Institutional Costs - Unit Oversight ………………………………………………..........................     34
  Table 12       Institutional Costs – Central Oversight …..……………………………………..........................   34
  Table 13       Unit Budget Targets by Area …………………………………………………………………………………                           36
  Table 14       Essential Requests ………………………………………………………………………………………………..                             37
  Table 15       2021/22 Budget by Faculty …………………………………………………………………………………..                           42
  Table 16       Shared Service Allocation ……………………………………………………………………………………..                          42
  Table 17       Internally Restricted Net Assets ….………………………………………………………………………..                      44
  Table 18       Multi-Year Assumptions ……………………………………………………………………………………….                             45
  Table 19       Multi-Year Operating Budget Model …………………………………………………………………….                         47
  Table 20       Ancillary Reserve Funds …………………………………………………………................................        50
  Table 21       2021/22 Ancillary Budget Summary ……………………………………………………………………..                         50
  Table 22       2021/22 Ancillary Budget Detail ……………………………………………………………………………                         51
  Table 23       Equipment Renewal Budget ..……………………………………………………………………………….                            53
  Table 24       2021/22 Annual Capital Budget ……………………………………………………………………………                           55

                                                                                                Page 3 of 57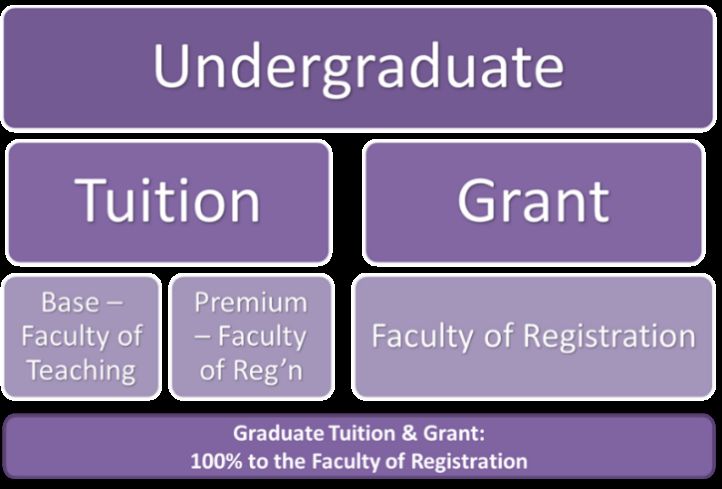
Wilfrid Laurier University Budget                                                               June 3, 2021

List of Figures
  Figure 1     Road to Recovery .…………………………………………………………………………………………………                                  6
  Figure 2     Breakdown of Total Revenue ………………………………………………………………………………..                              9
  Figure 3     SMA3 Grant Funding …………………………………………………………………………………………….                                  11
  Figure 4     Government Corridor Funding Formula Model ………………….....................................   12
  Figure 5     Annual Budget Process Timeline …………………………………………………………………………..                            14
  Figure 6     Governance Budget Process …………………………………………………………………………………                                14
  Figure 7     Components of Enrolment Forecast ……………………………………………………………………..                            17
  Figure 8     Total UG FT Enrolment by Campus ……………………………………………………………………….                             19
  Figure 9     Total UG FT Enrolment by Faculty ……………………………………………..............................         20
  Figure 10    Total UG FT Enrolment by Type of Student …………………………………………………………..                        21
  Figure 11    Essential Requests Principles …………………………………………….....................................     25
  Figure 12    Key Components of the Budget Build Process ………………………………………………………                         28
  Figure 13    RCM Tuition/Grant Allocation ………………………………………………………………………………                              31
  Figure 14    Total Revenue Allocation by Faculty ……………………………………………………………………..                         32
  Figure 15    Total Expenses Breakdown …………………………………………………………………………………..                               33
  Figure 16    Budget Target Strategy …………………………………………………………………………………………                                35
  Figure 17    Unit Budget Targets by Category ………………………………………………………………………….                            36
  Figure 18    Pandemic Implications ………………………………………………………………………………………….                                37
  Figure 19    Gapping Adjustments .………………………………………………………………………………………….                                 37
  Figure 20    Shared Service Allocation by Faculty …………………………………………………………………….                         43
  Figure 21    Cumulative Annual Funding Needs included in the Asset Management Plan…..…….              54

                                                                                                 Page 4 of 57
Wilfrid Laurier University Budget June 3, 2021
Wilfrid Laurier University 2021/22 Budget
Part A – Overview
Every budget report contains forward-looking information and is based on information available to
management at the time of preparation; actual results may vary from these assumptions. In 2021/22,
Laurier will enter a second year with a budget set in the context of a global pandemic. While the
organization has been successful in mitigating some of the fiscal impacts of the pandemic in 2020/21, this
work continues for 2021/22 as we anticipate a return to on-campus presence beginning in the fall and
accelerating to normal levels in winter 2022.
In addition to the challenges presented by the pandemic, Laurier is also faced with a structural deficit and
growing capital infrastructure needs. Most importantly, however, the University is poised to embark upon
a number of exciting initiatives which will contribute to its success in a highly competitive sector. The
ability to optimize investments in future-looking strategic endeavours while safeguarding the
organization’s financial health has been a key principle in the development of the 2021/22 Budget. Prior
to the Board of Governors receiving this final Budget, the draft Budget was presented to the Finance and
Investments Committee on May 20. The summary version was also presented to the Senate Executive
and Finance Committee on May 11 and to Senate on May 19. Fee information, which is part of the
assumptions included in this 2021/22 Budget report, has been included in a separate 2021/22 Fee Report
and was presented and approved at the April Board of Governors meeting.
For Approval:
Operating Budget
Ancillary Budget
Capital Budget
For Information:
Multi-Year Operating Budget Forecast
Multi-Year Ancillary Budget Forecast
In future years, a Multi-Year Capital Forecast will also be included
Page 5 of 57
Wilfrid Laurier University Budget                                                            June 3, 2021

Executive Summary – 2021/22 Budget Highlights
Overall Fiscal Outlook

The assumptions and estimates included in the 2021/22 Operating and Ancillary budgets are based on the
information available to management at the time of preparation. The prolonged event of the global
Coronavirus pandemic continues to present challenges for Laurier and the university sector overall. As the
University continues to monitor and align with public health requirements and guidelines, it maintains
strong alignment with the organizational mandate and vision as set out on the Laurier Strategy, and the
Strategic Mandate Agreement. The 2021/22 Operating Budget pursues the balance between mitigating
the impact of current challenges, such as a significantly reduced on-campus presence, with the need to
invest in longer-term strategic objectives. As Laurier embarks on a second year of pandemic budgeting for
the 2021/22 year, there is consideration for the longer-term multi-year approach as we look forward to
pandemic recovery.

Figure 1: Road to Recovery

                                                                      Pandemic
                                                                      Recovery
                                                  Second              Budget
                                                  Pandemic            (22/23)
                                                  Budget
                                                  (21/22),
                                    First         including
                                    Pandemic      three-year
                                    Budget        budget
                                    (20/21)       forecast

In this multi-year approach, continued efforts to address a structural deficit are needed to lay the
groundwork for Laurier to succeed in a post-pandemic world. Beyond pandemic recovery, Laurier is faced
with frozen tuition and grant values, increasing capital infrastructure needs, continued investment in
information technology systems, compounding inflationary pressures and funding requirements for
investment in strategic initiatives and programs to succeed in a highly competitive sector.
While Laurier currently meets the minimum benchmark in four out of five financial health indicators and
enjoys a DBRS Long Term Debt Rating of “A”, the ongoing structural deficit, decreasing reserve balances,
and the impacts of the pandemic present challenges to meeting these targets in the future.

Prioritization and a focus on key investments, with consideration for growth strategies, revenue
generation, cost containment and spending to increase key services and programs will be critical to
optimize limited resources and safeguard the organization’s fiscal health.

                                                                                              Page 6 of 57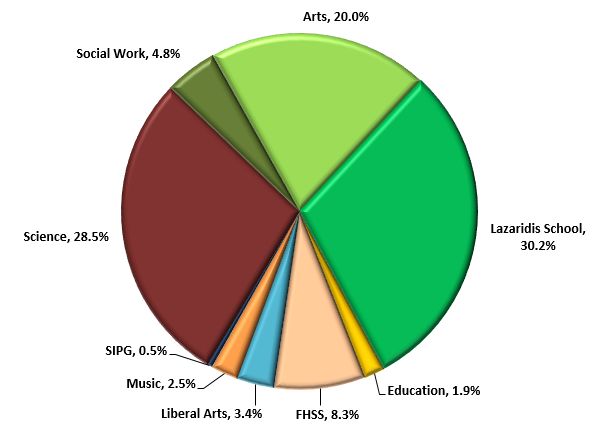
Wilfrid Laurier University Budget                                                                June 3, 2021

Operating Budget
The Operating Budget comprises the major annual revenues and expenditures of the University’s financial
operations. Revenues from student tuition fees and government operating grants account for 90% of the
total operating revenues. Faculty and staff salaries and benefits account for 74% of the total operating
expenditures.

The 2021/22 Budget (as presented in Table 6) shows forecasted total revenues of $309.7 million, an
increase of $2.2 million, or 0.7%, over last year’s Budget. Tuition revenue has remained fairly flat at $1.2
million increase or 0.7% based on the recently confirmed extension of the domestic tuition rate freeze
and continued challenges to international student recruitment (based on visa processing delays and travel
restrictions. Government operating grants remaining steady with an increase of $0.4 million.

Total expenditures are forecasted at $312.5 million, an increase of $0.5 million, or 0.2%, over last year.
This includes a decrease of $1.9 million in total salaries and benefits and an increase of $2.5 million in non-
salary expenses.

The 2021/22 excess of expenditures over revenues has produced a deficit of $2.9 million, which
represents a decrease of $1.7 million compared to the 2020/21 budgeted deficit of $4.6 million. The
2021/22 deficit will be bridged through anticipated 2020/21 year-end surplus results.

Ancillary Budget
The Ancillary Budget (as presented in Table 21 & 22) includes the self-sustaining activities of Conference
Services, Food Services, Off Campus Housing (Ezra Bricker & Houses), One Card, Parking Services, Printing
Services, Residences (Waterloo & Brantford Campuses) and Bookstore Operations.

The revenue of the Ancillary enterprises is estimated to increase by 16% from an approved budget of
$26.9 million in 2020/21 to $31.3 million in 2021/22, but still $22.3 million or 42% below the 2020/21 pre-
pandemic provisional budget of $53.6 million. Residence operations and Off-Campus Housing portfolios
revenue projections are based on the lowest capacity limits from Public Health. There is an increase in
revenue for the One Card budget with the introduction of a new mandatory fee related to new and
replacement card costs. Food Services revenue projection is modest as a staggered approach to open
various food outlets and is dependent on the in-person approach for fall and winter terms. Printing
Services projected revenue is based on the anticipated return to campus of students, faculty and staff
which corresponds to modestly higher volume of printing services activity. The combined revenue
projection for the Bookstore locations is also favourably impacted by the re-opening of retail locations
and in-person sales. Parking revenue increases reflects a projected gradual return to campus.

Expenses are expected to be lower than 2020/21 with a budget of $42.1 million in 2020/21. The most
significant impact is the savings of $2.8 million with the end of the residence lease at Kings Court (345
King St. N.). A new interest charge on ancillary reserve debt of $0.3 million is allocated across the
applicable Student & Ancillary Services organizations. The net position after reserves is expected to
improve from an approved deficit budget of $17.1 million in 2020/21 to a deficit of $11.3 million in
2021/22. With campus fall planning developing with a more optimistic outlook for in person activities,
this budget projection should be a conservative scenario as much is dependent on Public Health
guidelines.

                                                                                                   Page 7 of 57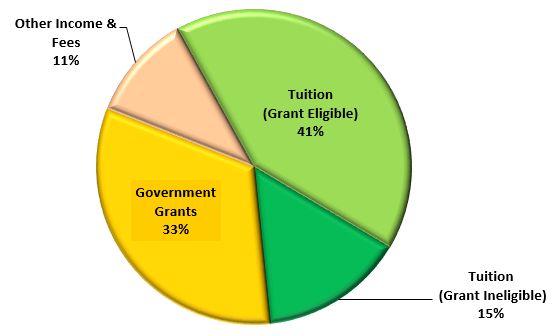
Wilfrid Laurier University Budget                                                               June 3, 2021

Capital Budget
Capital expenditure requirements are addressed through a variety of funding sources, including use of
established reserves, departmental annual operating budget lines, central operating budget accounts, as
well as strategies that rely on fundraising and partnership arrangements.

For the 2021/22 fiscal year, funding for capital expenditures includes $500,000 for Information and
Communication Technology projects that support organization-wide activities, a $2.4 million reserve
balance for capital replacement and renewal of equipment, as well as $2.8 million anticipated Facilities
Renewal Program (FRP) funding from the Ministry for capital maintenance requirements.

For major capital projects, the Facilities Capital Plan 2021-2026 identifies the capital projects required to
meet WLU’s present and future facilities needs. For 2021/22, five projects have been identified to be
initiated with a total funding requirement of $27 million from a variety of sources including WLU internal
funds ($13.2 million), fundraising ($9.6 million), and government funding ($4.5 million). The funding
strategy for these projects will be finalized as the 2020/21 year-end position, and any contribution from
year-end surplus, is confirmed.

RCM Budget Model Overview

In 2017/18, the University implemented a Responsibility Centre Management (RCM) budget model. A five-
year Transition Plan was developed to guide the budget process toward an incremental implementation
of the RCM budget model, by considering resource allocation for both Faculties in surplus and subvention
in accordance with allocated revenue and other factors.

For 2019/20, the Transition Plan, which would have been in year three, was paused in light of the
significant structural deficit that the University was facing. This deficit was caused by the government’s
decision to reduce domestic tuition by 10% in 2019/20 and to freeze rates in 2020/21. This policy change
resulted in a forecasted deficit of $18 million. During the pause in the transition plan, the budget model
has remained active and each operating budget includes a full allocation of revenue and expenses by
Faculty. The RCM position (whether surplus or deficit) is an important factor in assigning budget targets
and in allocating new resources.

As part of the 2020/21 budget process, the Provost and Vice President: Academic and the Vice President:
Finance & Administration engaged expert advice and conducted a series of internal consultations to
determine how best to resume the transition to full implementation of the RCM budget model. Given the
onset of the pandemic and continued uncertainty, further action on resuming the RCM model has been
deferred until Fall 2021.

Part B - Operating Budget
1. 2021/22 Budget Context
    The Operating Budget comprises the major annual revenues and expenditures of the University’s
    financial operations. Revenues from student tuition fees and government operating grants account
    for 90% of the total operating revenues. Faculty and staff salaries and benefits account for 74% of
    the total operating expenditures.

                                                                                                 Page 8 of 57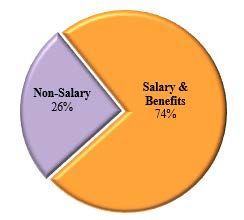
Wilfrid Laurier University Budget                                                               June 3, 2021

    The Operating Budget does not include those financial activities that are not available for general
    operating purposes such as direct sponsored research, trust and endowments, and government
    grants for major capital projects. These financial activities are consolidated and presented annually
    in the audited financial statements.

    Several internal and external factors directly influence Laurier’s Budget. These include:

    Strategic Plan
    The University is currently operating under the Laurier Strategy (2019-2024) which outlines the
    University’s high-level priorities for the five-year period. The strategy highlights Laurier’s role and
    responsibility in preparing people to be engaged global citizens who will work to address the world’s
    challenges in the coming decade. The focus of the strategy is on two distinct themes – thriving
    community and future-readiness— which positions the University to address societal and sector
    challenges and harness opportunities by leveraging our foundational strengths in academic
    excellence, research, partnerships, and community. This plan was a critical driver in the 2021/22
    budget process.

    Tuition Framework
    The Ministry of Colleges and Universities (MCU) provides a regulatory framework that guides the
    fee setting for publicly-funded tuition fees and the application of the framework for tuition fee set-
    aside, billing, and program fee policy.

    The MCU released the most recent tuition framework on January 17, 2019, which provided
    requirements for domestic tuition rates up to and including the 2020/21 academic year. The MCU
    “Tuition Fee Framework and Ancillary Fee Guidelines” prescribed a 10% tuition fee reduction in
    2019 and subsequent tuition fee freeze in 2020/21. MCU recently announced that the tuition freeze
    would be extended to cover the 2021/22 year and the University is therefore maintaining current
    domestic tuition levels for 2021/22.

    At Laurier, undergraduate domestic tuition represents approximately 37.2% of total operating
    revenue and graduate eligible tuition represents approximately 4.0% of total operating revenue.

    For the 2021/22 budget, 41.0% of total operating revenue is estimated to be from grant-eligible
    tuition fees.

    Figure 2: Breakdown of Total Revenue

                                                                                                 Page 9 of 57
Wilfrid Laurier University Budget June 3, 2021
Strategic Mandate Agreement
The Strategic Mandate Agreement (SMA) between the Ministry of Colleges and Universities (MCU)
and Laurier is the University’s formal agreement with the government regarding the institution’s role
in support of the provincial government’s objectives and priority areas for the postsecondary
education system. We are entering year two of a five-year agreement, SMA3, which runs from April
1, 2020 to March 31, 2025. SMA3 continues the previous corridor funding model and introduces a
performance/outcomes-based funding system linked to 10 metrics that are being phased in over the
life of the SMA. The metrics are mostly system-wide metrics determined by MCU, with two metrics
defined in part by the University.
• Metrics effective in 2020/21
o Graduate Employment in a Related Field
based on responses to the MCU Ontario University Graduate Survey (OUGS)
o Institutional Strength & Focus
proportion of enrolment in institution’s areas of strength and focus (areas
determined by each university)
o Graduation Rate
undergraduate seven-year graduation rate
o Community/Local Impact of Student Enrolment
institutional enrolment as a proportion of the city/town in which the
institution is located (weighted average for multi-campus institutions)
o Economic Impact (institution-specific)
number of graduating students who are employed in Ontario multiplied by
the average salary
o Research Funding & Capacity
The University’s share of federal Tri-Agency funding
• Metrics added in 2021/22
o Experiential Learning
number and proportion of graduates from undergraduate programs who
participate in at least one course with required experiential learning
component(s)
o Research Revenue Attracted from Private Sources
research revenue from private and non-profit sectors
o Graduate Employment Earnings
based on Statistics Canada’s Education and Labour Market Longitudinal
Platform (ELMLP)
• Metric added in 2022/23
o Skills & Competencies
test results from Education and Skills Online Tool (OECD), based on a random
sample of undergraduate students
Each metric includes an institutionally designated weighting, and a target and band of tolerance
informed by historical performance.
Over the course of the five-year agreement, the proportion of performance/outcomes-based funding
included as part of the provincial operating grant will increase from 25% in 2020/21 to 60% by
Page 10 of 57Wilfrid Laurier University Budget June 3, 2021
2024/25. In response to the pandemic, the government has announced that for the first two years
of the agreement – 2020/21 and 2021/22 – operating grant funding is being de-coupled from the
performance metrics. This means that operating grants are remaining constant for the 2021/22 fiscal
year. Discussions continue between the sector and the government about the pandemic impact on
the metrics and the appropriate timeline on which to resume the full transition to performance-
based funding.
Figure 3: SMA3 Grant Funding
Corridor Funding Formula for Grants
The previous three-year SMA2 introduced in 2017/18 moved Ontario universities to a corridor
funding model where rather than incrementally funding grant eligible (normally domestic)
enrolment, institutions are funded to a mid-point level within a corridor. At that time, the midpoint
was established at actual 2016/17 funding levels for undergraduate funding, with negotiated funding
growth for graduate enrolment.
The new SMA3 continues the corridor funding model with an increase to the midpoint to reflect
achieved graduate growth relative to 2016/17. The 3% corridor remains in place, with compliance
evaluated relative to a five-year growing moving average.
Page 11 of 57Wilfrid Laurier University Budget June 3, 2021
Figure 4: Government Corridor Funding Formula Model
Grant Reductions
A number of internal factors directly influence Laurier’s Budget. These include:
Milton Expansion
Laurier is committed to extending the University’s high-quality academic programming and student
experience to the town of Milton. The 2021/22 budget reflects the revenue and expenses for the
ongoing activities delivered through our long-standing partnership with the Milton community. This
includes the Faculty of Education’s part-time Master of Education program, which commenced in
January 2020 at the Milton Education Village Innovation Centre. We continue to offer not-for-credit
and community-based programs, including Faculty of Social Work professional development
certificates and workshops, the Laurier Milton Lecture Series and the Laurier Enriched Academic
Program (LEAP) children’s camp, in partnership with the Town. Additionally, the budget reflects
investments that the University will continue to make in community engagement, brand visibility,
programming, and stakeholder relations.
The University is continuing to work closely with the provincial government, the Town of Milton, and
Conestoga College to advocate for the development of a campus in Milton.
RCM Budget Model
The Responsibility-Centre Management (RCM) budget model calculations continue to be made to
allocate revenue and shared services costs across the institution to track the financial position of
each Faculty. Currently, the transition plan within the RCM budget model remains paused. This is a
continuation of the pause that was enacted mid-way through the 2018/19 fiscal year to enable the
University to manage the financial impact of the 10% tuition cut and ensuing freeze. A pause in the
transition plan means that Faculties in surplus do not receive a percentage of their surplus.
However, it is important that model continues to operate with full allocation of revenue and
expenses; the RCM position of each Faculty is an important variable for determining the allocation
of budget targets and for evaluating requests for new resources. The RCM allocation by Faculty is
included in Section 3.3/Table 15.
Page 12 of 57Wilfrid Laurier University Budget June 3, 2021
2. 2021/22 Budget Process
The budget process started later this year as the budget development process was complicated by
the fact that the previous year’s budget was approved on a provisional basis in June 2020, with
approval of a final budget in November 2020. In performing the work necessary to prepare the final
budget, the University was able to understand the principal revenue and expense impacts of
operating under pandemic conditions. However, the continuation of 2020/21 budget work well into
the fiscal year compressed the timeline for preparing the 2021/22 budget.
The 2021/22 budget development process was driven by two imperatives:
• Manage through the pandemic disruption so that the quality of teaching, learning, research,
and student engagement remain strong;
• Pursuing strategic objectives, prioritizing those which enable the University to both manage
through the pandemic and position Laurier for success post-pandemic with special attention
to the institution’s financial sustainability.
To manage this careful balancing act, the Budget Co-Chairs (Lloyd Noronha, Vice President: Finance
& Administration, and Anthony Vannelli, Provost & Vice President: Academic) have worked closely
with a newly re-established Budget Council, supported by the Budget Coordinating Team in
accordance with the roles and responsibilities outlined below.
Budget Co-Chairs
The Provost & Vice President: Academic and the Vice President: Finance & Administration are
jointly responsible for overseeing the development of the University Budget and making a
recommendation to the President.
Budget Council (BC)
The Budget Council (BC) was established in 2020/21 and is an advisory committee to the President
regarding the annual budget development and resource allocation decisions. Members fulfill
fiduciary responsibilities at an institutional-level basis and advise on overall budget objectives that
support the mission and goals of the University.
The Budget Council Provides oversight for the development of the University budget, as informed
by strategic and integrated planning.
• Establishes the annual budget development process
• Provides advice and recommendations for transparent resource allocation decisions
reflective of the University’s strategic priorities
• Informs assumptions on key budget drivers
Final approval of all budget recommendations, as presented in the Budget Report, is made by the
Co-Chairs. The Budget Council is co-chaired by the Provost & Vice President: Academic and the
Vice President: Finance and Administration. The Council membership is representative and
ensures appropriate attention to the breadth of the University budget and is structured to balance
academic and administrative budget leaders.
Budget Coordinating Team (BCT)
The Budget Coordinating Team was established in 2019/20 and is co-chaired by the Assistant Vice
President: Financial Resources and the Assistant Vice President: Integrated Planning & Budgeting.
The Budget Coordinating Team is responsible for overseeing the operational development of the
budget.
Page 13 of 57Wilfrid Laurier University Budget June 3, 2021
Working on the timeline in Figure 5, the ultimate objective of the budget process is to bring forward
a recommended budget for consideration by the governing bodies – review and recommendation by
Senate and review and approval by the Board of Governors (as depicted in Figure 6).
Figure 5: Annual Budget Process Timeline
Figure 6: Governance Budget Process
Department Budget Budget Board of
Budget Leaders President Senate
Council Governors
Managers (VPs, Deans, AVPs)
The University is responsible for submitting a budget for consideration by Senate and approval by
the Board of Governors.
The 2021/22 budget development process was divided into three phases:
Phase I: Budget Planning & Development
Phase II: Budget Coordinating Team Review
Phase III: Budget Council Review
Page 14 of 57Wilfrid Laurier University Budget June 3, 2021
Phase I: Budget Planning & Development
The University is operating in a dynamic environment, which requires that we continually examine
our priorities to ensure we are keeping current and meeting our obligations. We continue to look to
the Laurier community to be future-oriented, innovative, constructive and strategic as reflected in
the Laurier Strategy 2019-2024. This means being alert to opportunities, open to partnerships and
synergies.
The Budget Co-Chairs identified four categories of essential requests that were prioritized for
investment consideration: teaching, learning & scholarship (remote); health, safety & well-being of
students, staff, faculty; regulatory/legislative compliance; and digital opportunities. Requests falling
outside these categories were to be managed at the unit level.
In parallel, the Budget Co-Chairs also engaged with the Executive Leadership Team to identify the
strategic priorities for 2021/22: Indigeneity and equity, diversity, and inclusion; innovation (including
credential innovation); internationalization; and multi-campus development (including Milton).
Each budget leader was responsible for completing a budget development template. The purpose of
this development template was to provide budget leaders an opportunity to:
• Confirm previously submitted budget target details for 2021/22 (across each VP portfolio, 4%
was submitted over two fiscal years (2020/21 & 2021/22));
• Submit essential requests for 2021/22 in alignment with priority areas.
Each Vice President (or equivalent) was responsible for evaluating budget requests against these
priorities and completing a separate consolidated prioritized list for their portfolio. Items on this list
indicated the Vice Presidents’ agreement for the identified budget request.
Phase II: Budget Coordinating Team Review
The Budget Coordination Team (BCT) conducted a comprehensive review and analysis of the revenue
and expense factors driving the budget:
• revenue;
• institutional costs, unit-level and central;
• inflationary salary costs;
• direct costs of teaching;
• budget targets for 2021/22;
• essential requests.
The BCT also carefully reviewed areas of pandemic and historical underspending to recommend
potential budget gapping adjustments to appropriately reduce the level of conservatism included in
the operating budget.
The full detail on all these elements is provided in Sections 2.1 through 2.3 below.
Phase III: Budget Council Review
The Budget Council reviewed the overall budget strategy with consideration of the major revenue
and expense drivers outlined above. In particular, the Budget Council spent considerable time
reviewing the essential requests recommended by the Budget Co-Chairs. The criteria and process are
described in detail in section 2.3 under “Essential Requests.”
Page 15 of 57Wilfrid Laurier University Budget June 3, 2021
2.1 Revenue Process
The revenue process is made up of three separate components – operating grant, tuition fees, and
other revenue.
Operating grants
MCU’s funding model allocates enrolment-driven operating grant revenue in alignment with the
SMA3. Operating grant allocations for universities are governed by an enrolment corridor mechanism
that includes a negotiated midpoint, indicating the level of funded student enrolments.
The SMA3 funding model allocates enrolment-driven operating grant within two major components,
in addition to special purpose envelopes targeted to specific sector priorities. Within the Enrolment
Envelope, the Core Operating Grant (COG) is allocated based on enrolment through the corridor
funding model. The Differentiation Envelope is composed of the Performance/Outcomes-based
Grant, distributed based on outcomes, measured relative to the achievement of SMA3 metric targets.
Due to the uncertainty of the pandemic, the Ministry delayed the activation of performance-based
funding for two years. This means that operating grants are remaining constant for the 2021/22 fiscal
year, net of any deductions related to the change in the International Student Recovery (ISR).
Tuition revenue
Revenue from tuition is a factor of two inputs – tuition rates and enrolment projections.
Tuition rates
Tuition rates for publicly funded (domestic) students are governed by the Provincial Government’s
Tuition Fee Framework. On April 30, the government announced a one-year extension of the tuition
freeze for Ontario students, with a provision for a 3% increase for out-of-province students. Prior to
this announcement, Laurier had proceeded to set domestic tuition rates at the same levels as in
2020/21 (0% change). As part of the tuition rate-setting process in the coming year, Laurier will
evaluate the relevant factors in considering a potential tuition increase for out-of-province students.
For international students and non-publicly funded programs and courses, the University has
discretion over tuition fee increases as these are not eligible for provincial government funding and
are not governed by the tuition fee framework. Tuition rates for these programs are guided by the
market and Laurier’s relative competitiveness.
The Tuition Fee Report recommended by Senate and approved by the Board of Governors in March
includes the tuition fee rates that are incorporated into the forecast.
Enrolment projections
Student enrolment drives almost 90% (2020/21 – 90%) of operating revenue. The Strategic
Enrolment Management (SEM) Committee is responsible for providing strategic direction in
establishing the University’s long-term enrolment plan; aligning the enrolment planning process with
institutional and academic priorities. A key component of this plan is the development of short-term
and long-term enrolment targets for both graduate and undergraduate students. This forms the basis
of the enrolment projection, which is then used to project enrolment-driven revenue (tuition and
grant) institutionally and by Faculty.
Page 16 of 57Wilfrid Laurier University Budget June 3, 2021
SEM is tasked with developing long-term enrolment plans that reflect a comprehensive and
integrated approach to strategic enrolment management. The enrolment plan is intended to enable
the University to achieve and maintain optimal student enrolment within the context of the Laurier
Strategy, Strategic Academic Plan (SAP) and the Strategic Mandate Agreement (SMA) while
responding to external factors, including government policy, demographics, and the competitive
landscape.
The enrolment plan considers not only new annual intake, but also student retention, which impacts
the flow through of students progressing to graduation. Figure 7 depicts how the various cohorts of
students make up the 2021/22 enrolment projection, which drives the total tuition and grant revenue
forecast.
Figure 7: Components of Enrolment Forecast
2.2 Enrolment (Undergraduate Headcount & Graduate Fall FTE)
The following table illustrates the projected change in total students from 2020/21 to 2021/22:
Page 17 of 57Wilfrid Laurier University Budget June 3, 2021
Table 1: Forecasted Change in Total Students
Overall, the total student headcount for 2021/22 is projected to decrease by 520 students or 2.4%
over 2020/21. The decrease in enrolment is mainly driven by a projected lower average number of
continuing domestic students at the undergraduate level, but it is expected to be slightly offset by a
robust intake of new Year 1 and increasing number of graduate students.
Undergraduate (UG) Students:
Total projected undergraduate headcount for Fall 2021 are projected at 18,592 (Fall 2020 - 19,216),
reflecting a 3.2% decrease over prior year. International undergraduate enrolment are projected to
decrease by 6.7% over the prior year due to the continuing pandemic. Full-time (FT) and part-time
(PT) enrolments are both projected to be lower in 2021/22 than 2020/21.
One of the key elements of the undergraduate enrolment projection is the new intake of 1st Year
students. The intake target is established through collaboration and consultation with the Faculties
and other units across the University.
Page 18 of 57Wilfrid Laurier University Budget June 3, 2021
Table 2: Fall Full-Time Headcounts – Undergraduate
Note: Enrolments in Table 2 include students in the consecutive Bachelor of Education program,
a second entry undergraduate program.
Overall, it is projected the new Year 1 student enrolment in 2021/22 will remain similar to 2020/21
levels in the first entry programs. In 2nd entry programs, the Faculty of Education is planning to
significantly increase the new students. First year students represent 29.1% (2020/21 – 27.2%) of
total undergraduate enrolment.
The composition for the projected FT UG headcount for both first year intake and total enrolment is
displayed by campus (Figure 8), by Faculty (Figure 9) and by type of student (Figure 10).
Figure 8: Total UG FT Enrolment by Campus
Page 19 of 57Wilfrid Laurier University Budget June 3, 2021
The Brantford campus is anticipating a slightly higher intake of new Year 1 students in 2021/22 than
in the previous year (518 in 2021/22 vs. 502 in 2020/21), representing 11.7% (2020/21 - 11.9%) of
the total institutional first year intake. Overall, a total of 2,059 (2020/21 - 2,142) students at the
Brantford campus is projected for 2021/22, representing 13.4% (2020/21 – 13.8%) of total FT UG
enrolments.
The Waterloo campus is anticipating a slightly higher intake of new Year 1 students in 2021/22 than
in the previous year (3,910 in 2021/22 vs. 3,730 in 2020/21), representing 88.3% (2020/21 – 88.1%)
of the total institutional first year intake. Overall, a total of 13,260 (2020/21 – 13,408) students at the
Waterloo campus is projected for 2021/22, representing 86.6% (2020/21 – 86.2%) of total FT
undergraduate, which is similar with 2020/21.
Figure 9: Total UG FT Enrolment by Faculty
Note: The Faculty of Education is a two-year program, with the enrolments being reflected between
1st year and upper years. Social Work has a significant portion of new advanced standing (i.e. upper
year) students.
In 2021/22, the majority of the Faculties are projecting a similar enrolment of new Year 1 FT students
as achieved in 2020/21. Overall, the decrease in undergraduate FT enrolment of approximately 1.5%
(2020/21 – increase 2.0%) is not distributed evenly, with growth projected in the Faculty of
Education, Faculty of Science, and Faculty of Social Work and decreasing enrolments in the other
Faculties.
The three largest Faculties (Arts, Science and the Lazaridis School) account for 83% (2020/21 – 83%)
of total enrolment and 84% (2020/21 – 84%) of 1st year intake.
Page 20 of 57Wilfrid Laurier University Budget June 3, 2021
Figure 10: Total UG FT Enrolment by Type of Student
The number of international students in undergraduate programs has grown steadily over the last
decade. International FT students, including both fee-paying students and exchange students, made
up 6.3% (2020/21 – 5.7%) of the FT UG population in 2021/22; growing from less than 2.0% about 10
years ago.
In 2021/22, a decrease of 5.0% (2020/21 – nil%) is planned for FT international undergraduate
headcount due to uncertainty around international student travel policies. Overall, international
students represent 4.9% (2020/21 – 5.7%) of the projected incoming class. The above figure
demonstrates the breakdown by student type – domestic vs. international, for both total FT UG
enrolment and 1st year intake in 2020/21 and 2021/22.
Graduate Students:
Note: Graduate enrolment is presented in terms of Full-Time Equivalent (FTE) (1 FT graduate student
= 1.0 FTE and 1 part-time graduate student = 0.3 FTE) in each term. Consistent with MCU reporting,
the following graduate enrolment numbers are reported in Fall FTEs only.
At the graduate level, student enrolment is projected to increase by 6.8% (2020/21 – 5.0%). The
projected increase in enrolments is driven by increases in all program types.
The composition for the projected Graduate Fall FTE is displayed by program category (Table 3), type
of student (Table 4) and by Faculty (Table 5):
Page 21 of 57Wilfrid Laurier University Budget June 3, 2021
Table 3: Graduate FTE by Program Category
* Including diploma and general graduate studies
** Enrolment in cost recovery programs is not eligible for government grant funding
Professional Masters programs are projected to increase by 43.8 FTEs, Research Masters programs
are projected to increase by 24.6 FTEs, and Doctoral programs by 18.1 FTEs. The increase in Graduate
FTE is consistent with growing the total number of Graduate students.
Table 4: Graduate FTE by Type of Student
* Includes both domestic students in cost-recovery programs (about 80%) and those students who
have exceeded their grant funding limit (about 20%)
The majority of graduate growth is projected to be in programs eligible for provincial grant funding,
with an increase of 76.8 FTE or 8.5% over the prior year.
International graduate enrolment is projected to return to levels similar to 2019, with an increase of
16.4 FTE or 12.5% projected over the prior year. The Faculty of Science and Lazaridis School accounts
for the majority of the international growth while there are some other minor increases in the other
Faculties.
Page 22 of 57Wilfrid Laurier University Budget June 3, 2021
Table 5: Graduate FTE by Faculty
Anticipated growth in graduate programs of 6.8% is not evenly distributed across Faculties. This
reflects the type and mix of graduate programs and FTEs offered by each Faculty. For 2021/22, the
majority of the FTE increase is related to the professional Master’s programs. The Faculty of
Education, Social Work, and Lazaridis School are the primary Faculties contributing to the increases
in this category. The increase in research Master’s programs is supported by the Faculty of Arts and
the Faculty of Liberal Arts.
2.3 Expense Process
The current financial expense assumptions incorporate updated salary and benefit information,
updated projections including institutional costs, direct costs of teaching and essential requests for
2021/22 related to implementing digital opportunities, teaching & learning in a remote environment,
compliance obligations, and support for the health, safety and well-being of our students, staff and
faculty.
Total expenses for 2021/22 are $312.5 million. Expenses are categorized as Direct Cost of Teaching,
Institutional Costs – Unit Oversight, Institutional Costs – Central Oversight and Essential Requests.
Direct Cost of Teaching
The direct costs of teaching associated with the creation of new programs and enrolment changes in
continuing programs were also considered. Senate Academic Planning Committee and Senate
reviews and approves the creation of new programs and the related detailed multi-year budgets.
These necessary expenditures on teaching are offset by incremental revenue from the new
programs.
Page 23 of 57Wilfrid Laurier University Budget June 3, 2021
Each Dean reviewed their SEM enrolment plans and identified whether the change in enrolment mix
required additional direct teaching resources. Discussions between the Deans and the Provost
occurred to review the enrolment numbers to determine if those eligible costs would be funded.
Examples of direct cost of teaching expenditures may include the hiring of full-time faculty or
Contract Teaching Faculty (CTF), the development and delivery of online courses, teaching assistance,
lab supervision, support staff, partnerships, lab equipment, space and operating costs.
Institutional Costs – Unit Oversight
Institutional costs with unit oversight are costs that are directly attributable to a unit, and the unit
has the responsibility to oversee the cost. However, the unit has limited control over how the cost
may increase or decrease (e.g., audit fees, foreign exchange, scholarships, etc.).
These costs were reviewed by the unit as part of the budget process and the proposed changes were
reviewed with Vice President: Finance & Administration and the Provost & Vice President: Academic.
Budget Council also had an opportunity to review and advise the Co-Chairs.
Institutional Costs – Central Oversight
Institutional costs with central oversight are costs that cannot be directly attributed to a unit. These
costs are reviewed for any changes that may cause the cost to increase or decrease (e.g., University
Memberships - such as Council of Ontario Universities).
The central costs (both revenue and expense) were reviewed based on actual experience and/or
anticipated future changes and adjusted accordingly. The expected change was reviewed with the
Vice President: Finance & Administration and the Provost & Vice President: Academic and brought
to Budget Council for information.
Central review of Preliminary Deficit Position
During the management reporting of the 9-month YTD results, the forecasted 2020/21 year-end
position was indicating to be more favourable than originally anticipated in the approved budget.
These savings were a result of both OTO pandemic related savings as well as passive and other
savings.
In previous years, we have had deficit budgets projected and ended up with fiscal year-end surpluses.
In turn, the Budget Coordinating Team reviewed the central and institutional items to find
opportunities to reduce the preliminary deficit position that was arising for 2021/22. The Budget
Coordinating team reviewed the following two categories in detail:
Pandemic Savings
Significant savings may be attributed to pandemic-related changes in activity and expenses at
a magnitude greater than was considered in the November pandemic budget. Some of the
contributing categories include travel, catering, meeting expenses, printing, general supplies,
externally contracted services for trades, and outsourced custodial costs. Some of these
pandemic savings are anticipated to continue into 2021/22 on a OTO basis.
Central Gapping Adjustments
Gapping adjustments represent anticipated passive savings and are not guaranteed. Based on
the anticipated favourable 2020/21 year-end results due to underspending, a proactive
Page 24 of 57You can also read