Work Programme and Budget for 2018 & 2019 - Sprep
←
→
Page content transcription
If your browser does not render page correctly, please read the page content below
Work Programme
and
Budget for 2018 & 2019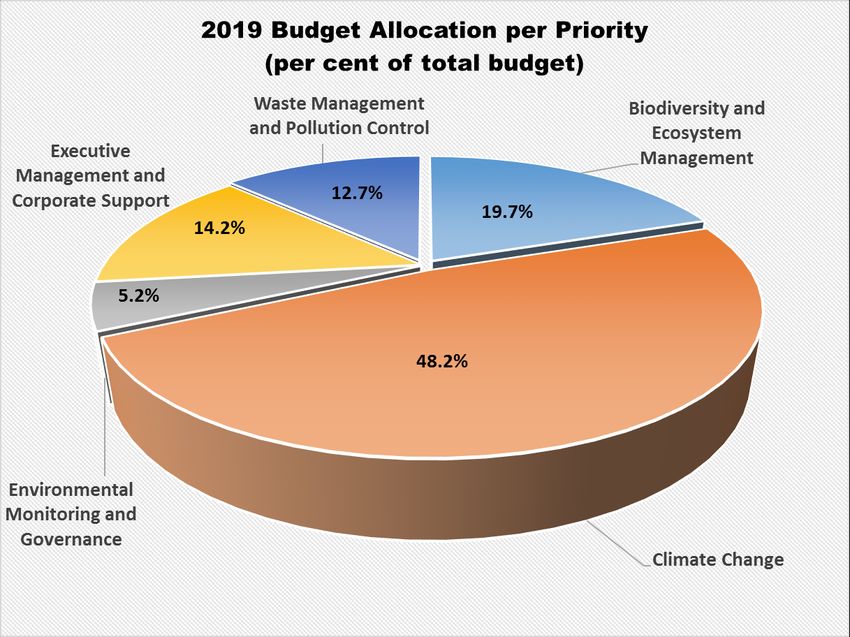
Work Programme and Biennial Budget for 2018-2019
Introduction                                                                       number of the vacant positions to be occupied by 2018 including the new PCU
                                                                                   division.
The Work Programme and Budget (WP&B) is prepared in accordance with the
requirements of the SPREP Financial Regulations and is expressed in USD. The       Table 5 summarises the work programme budget with expenditure of $24.96m in
Secretariat proposes a balanced budget of anticipated income and expenditure of    2018, noting an increase by $13m or 109% from the 2017 budget estimates. A
USD$28,998,044 for 2018 and USD$29,721,842 for 2019.                               further increase by about $490k or 2% is noted for 2019 compared to 2018.

Guide to the Layout of the Work Programme and Budget                               Table 6 summarises the work programme budget expenditure by expenditure type.

The 2018-2019 WP&B is aligned to the goals and objectives of the Strategic Plan    Table 7 shows funding composition by donor
2017-2026 and achievement of these through the 2018-2019 Performance
Implementation Plan (PIP). Accordingly, the WP&B format reflects budgeted          Table 8 shows the scale and allocation of Member contributions
activities to achieve PIP 2019 outcomes, measured by PIP 2019 indicators. The
budget summary format lists the budget for each target and links the sources of    The presentation of the 2018-2019 WP&B starts with a brief introduction of the
funding to the core and programme budget components.                               strategic priority statement, followed by the targets, performance indicators and
                                                                                   activities planned for the next two years 2018-2019. These reflect the targets and
The budget is categorized into two major components:                               goals under the new SPREP Strategic Plan 2017-2026 and are all linked to
                                                                                   budgeted figures with identified sources of funding.
  a)   the core budget which is primarily funded by member contributions,
       programme/project management fees and other miscellaneous funding           The budgeted figures are classified into Personnel, Operating and Capital Costs,
       sources; and                                                                according to the targets in the Strategic Plan. Where any programme funding is
  b)   the work programme which is funded by donor contributions                   labelled “unsecured” its inclusion is based on the firm understanding at the time of
                                                                                   the budget formulation that a formal contractual relationship exists for future
Table 1 shows the overall summary of total expected income and expenditure by      funding giving it at least a 50% chance of having funds available for use in 2018-
the 4 operational programmes and the Executive Management and Corporate            2019. For 2018-2019, we have adopted a very conservative approach to the budget
Support.                                                                           and thus have no allocations for any unsecured expenditure.

Table 2 shows the overall summary of total expected income and expenditure by      A list of staff and positions (filled, under recruitment, vacant and unfunded) falling
the Regional Goals and Organisational Goals in the new Strategic Plan 2017-2026.   under each programme is included to inform Members of the human resources
                                                                                   that are available to that particular programme and needed for programme
Table 3 summarises the core budget. Income in the core budget is predicted to be
                                                                                   delivery, subject to availability of financial assistance.
$4.03m in 2018, which has increased by 24%, compared to the budget for 2017.
Most of the core budget is spent on Executive Management & Corporate Support
                                                                                   Expenditures
($3.93m) and in addition to the Programme Support (US$107,656) being allocated
to Biodiversity and Ecosystem Management ($27,033) and Environmental
                                                                                   The proposed 2018 expenditure of US$28,998,044 is more than the approved 2017
Monitoring and Governance ($80,623).
                                                                                   budget of US$15,164,886, reflecting a significant increase by US$13,833,158.

Table 4 shows the core budget expenditure by expenditure type. Personnel costs
                                                                                   The increase in the 2018 Budget from 2017 reflects primarily the anticipation of
are predicted to increase by 44% from 2017. The increase is mainly due to a
                                                                                   many new projects in the pipeline that are likely to be finalised before the end of

                                                                                                                                                               1|P age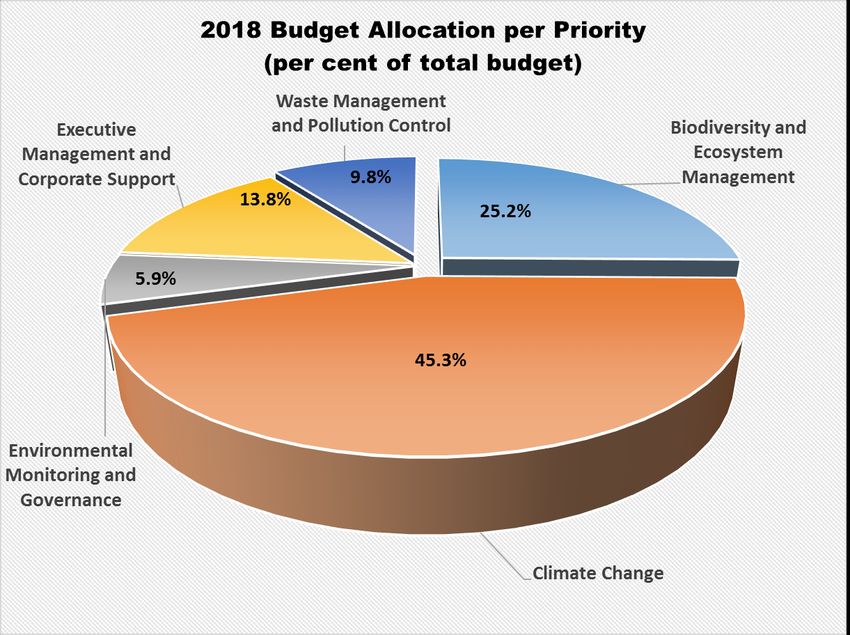
Work Programme and Biennial Budget for 2018-2019
2017 such as PacWaste Plus (EU), Vanuatu Climate Information Services for The Secretariat forecasts it will earn $1,654,515 in programme management fees in
Resilient Development Planning (GCF), Intra-ACP GCCA+ (EU), GCCA+ SUPA Project 2018 compared to $1,075,475 in 2017. The increase is directly correlated to the
(EU), Enhancing the Climate Change Resilience of Vulnerable Island Communities in increase envisaged in overall expenditure as a result of new projects forecasted to
FSM (Adaptation Fund), EDF-11PEUMP (EU). commence in 2018. The estimate of programmed management fees for 2019 is
$1,796,392 which is due to the new pipeline projects envisaged in 2018.
The budget for 2019 also reflects a further increase in expenditure to $29,721,842
reflecting an increase by $723,798 which is a result of additional expenditure Documents forming the 2018-2019 WP&B
anticipated from the new projects to be in effect from 2018 as listed above.
A. Overall Budget Summary (Table 1)
Income Overall Budget Summary – by Regional & Organisational Goals (Table 2)
B. Core Budget Funding Less Expenditure by Programme (Table 3)
The 2018 budget primarily comprises donor funding. Total available funding for Core Budget Funding Less Expenditure by Expenditure Type (Table 4)
2018 is made up of (a) core income and (b) work programme income. Total income C Work Programme Funding Less Expenditure by Programme (Table 5)
for core budget is a) US$4,037,390 and (b) work programme income $24,960,754 Work programme Funding Less Expenditure by Expenditure Type (Table 6)
from development partners and donors through programme and project funding. D Funding Composition (Table 7)
The major part (88.7%) of the budgeted income for the year is to be sourced from E Contribution Scale and Allocation for 2018-2019.
donors whilst 4.3% of the total income is sought from membership contributions F Work Programme and Budget Details 2018-2019
including unpaid contributions and voluntary contributions. The remaining 7% is Regional Goals 1-4
sourced from internal means. Organisational Goals 1-5
G Detailed Budget Analysis by Targets
For the 2019 budget, it also primarily comprises donor funding. Total income for Climate Change (2018 & 2019)
core budget is a) US$4,271,168 and (b) work programme income is US$25,450,674 Biodiversity & Ecosystem Management (2018 & 2019)
from development partners and donors through programme and project funding. Waste Management & Pollution Control (2018 & 2019)
The same allocation is maintained across income from membership contributions Environmental Monitoring & Governance (2018 & 2019)
(4.3%), donors (88.7%) with the remaining 7% sourced from internal means. H Corporate Services Operating Budget Details
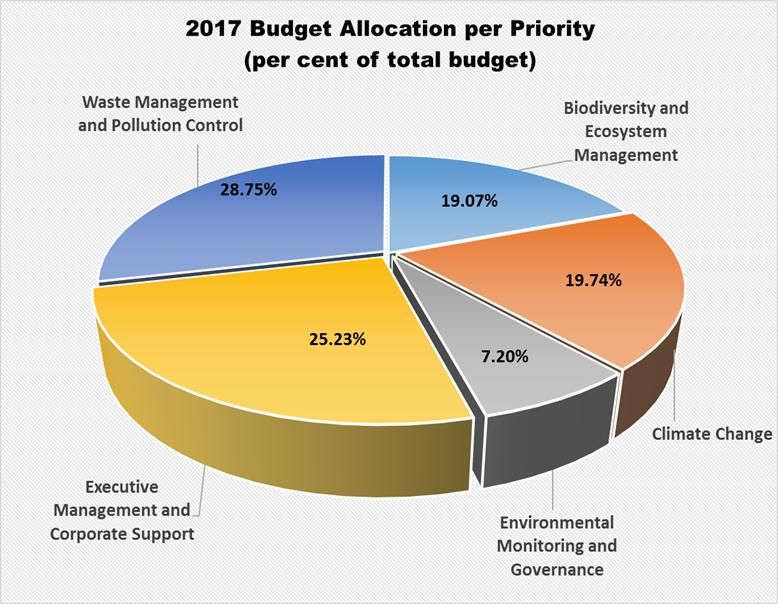
I Attachments Graph 1 – 2017 Budget Allocation per priority
Graph 2 – 2018 Budget Allocation per priority
Graph 3 – 2019 Budget Allocation per priority
Graph 4 – Budget Progression from 2004 - 2019
2|P ageA
SPREP BUDGET SUMMARY - YEAR 2018 & 2019
Revised 2017 Budget 2018 Budget 2019 Budget
Organisational Regional Organisational Regional
Core Programme Total Goals Goals Total Goals Goals Total
INCOME
TOTAL INCOME 3,242,865 11,922,021 15,164,886 4,037,290 24,960,754 28,998,044 4,271,168 25,450,674 29,721,842
EXPENDITURE
Executive Management & Corporate Support
Executive Management 1,037,241 296,984 1,334,225 1,051,242 81,250 1,132,492 1,389,242 81,250 1,470,492
Corporate Services 1,649,586 30,000 1,679,586 1,977,162 - 1,977,162 1,847,839 - 1,847,839
Information & Communications 484,955 327,736 812,691 901,230 - 901,230 911,430 - 911,430
Executive Management & Corporate Support 3,171,782 654,720 3,826,502 3,929,634 81,250 4,010,884 4,148,511 81,250 4,229,761
Programmes
Climate Change 17,177 2,976,985 2,994,162 13,141,160 13,141,160 14,337,021 14,337,021
Biodiversity and Ecosystem Management 21,753 2,869,857 2,891,610 27,033 7,281,637 7,308,670 24,623 5,814,522 5,839,145
Waste Management and Pollution Control 15,388 4,344,991 4,360,379 2,829,110 2,829,110 3,774,258 3,774,258
Environmental Monitoring & Governance 16,765 1,075,468 1,092,233 80,623 1,627,597 1,708,220 98,034 1,443,623 1,541,657
Total Programmes 71,083 11,267,301 11,338,384 107,656 24,879,504 24,987,160 122,657 25,369,424 25,492,081
TOTAL EXPENDITURE 3,242,865 11,922,021 15,164,886 4,037,290 24,960,754 28,998,044 4,271,168 25,450,674 29,721,842
NET SURPLUS/DEFICT - - - - - - - - -
Table 1: Core and Programme Budget
3|P ageB
SPREP BUDGET SUMMARY - YEAR 2018 & 2019
2018 Budget 2019 Budget
Organisational Regional Organisational Regional
Goals Goals Total Goals Goals Total
INCOME
TOTAL INCOME 4,037,290 24,960,754 28,998,044 4,271,168 25,450,674 29,721,842
EXPENDITURE
Regional Goals
Regional Goal 1 - 14,871,322 14,871,322 - 15,466,207 15,466,207
Regional Goal 2 - 5,520,097 5,520,097 - 4,587,580 4,587,580
Regional Goal 3 - 3,035,158 3,035,158 - 3,930,488 3,930,488
Regional Goal 4 - 1,534,177 1,534,177 - 1,466,399 1,466,399
Total Regional Goals - 24,960,754 24,960,754 - 25,450,674 25,450,674
Organisational Goals
Organisational Goal 1 925,012 - 925,012 926,802 - 926,802
Organisational Goal 2 19,222 - 19,222 27,413 - 27,413
Organisational Goal 3 2,821,966 - 2,821,966 3,036,408 - 3,036,408
Organisational Goal 5 271,090 - 271,090 280,545 - 280,545
Total Organisational Goals 4,037,290 - 4,037,290 4,271,168 - 4,271,168
TOTAL EXPENDITURE 4,037,290 24,960,754 28,998,044 4,271,168 25,450,674 29,721,842
NET SURPLUS/DEFICT - - - - - -
Table 2: Core and Programme Budget – by Regional & Organisational Goals
Regional Goal 1 - Pacific people benefit from strengthened resilience to climate change
Regional Goal 2 - Pacific people benefit from healthy and resilient island and ocean ecosystems
Regional Goal 3 - Pacific People benefit from improved waste management and pollution control
Regional Goal 4 - Pacific People benefit and their environment benefit from commitment to and best practice of environmental governance
Organisational Goal 1 - SPREP has information, and communication systems that get the right information to the right people at the right time and
influence positive organisational, behavioural and environmental change
Organisational Goal 2 - SPREP has multi-disciplinary processes in programme delivery and in supporting members to develop national and regional policies and strategies
Organisational Goal 3 - SPREP has a reliable and sustainable funding base to achieve environmental outcomes for the benefit of the Pacific islands region and manages
its programmes and operations to stay within its agreed budget
Organisational Goal 4 - SPREP is leading and engaged in productive partnerships and collaborations
Organisational Goal 5 - SPREP has access to a pool of people with the attitudes, knowledge, skills to enable it to deliver on its shared regional vision
4|P ageB
CORE BUDGET
Budget Budget Budget % %
2017 2018 2019 Change 2018 Change 2019
INCOME
Members' Contributions 1,069,774 1,069,774 1,069,774 0% 0%
Voluntary Member Contributions 53,489 53,489 53,489 0% 0%
Contributions in Arrears 50,000 50,000 50,000 0% 0%
Voluntary Contributions in Arrears 63,630 63,630 63,630 0% 0%
Host Country (Samoa) Contributions 20,327 20,327 20,327 0% 0%
Bank Interest 130,000 - - 0% 0%
Donor Funding 150,000 825,555 917,556 450% 11%
Miscellaneous - 150,000 150,000 0% 0%
Program Management Services 1,075,475 1,654,515 1,796,392 54% 9%
Unsecured 480,170 - - -100% 0%
Other income 150,000 150,000 150,000 0% 0%
TOTAL INCOME 3,242,865 4,037,290 4,271,168 24% 6%
EXPENDITURE
Executive Management & Corporate Support 3,171,782 3,929,634 4,148,511 24% 6%
Climate Change 17,177 - - -100% 0%
Biodiversity and Ecosystem Management 21,753 27,033 24,623 24% -9%
Waste Management and Pollution Control 15,388 - - -100% 0%
Environmental Monitoring & Governance 16,765 80,623 98,034 381% 22%
TOTAL EXPENIDTURE 3,242,865 4,037,290 4,271,168 24% 6%
NET SURPLUS/DEFICT - - -
Table 3: Core Budget less Expenditure by Programme
5|P ageB
CORE BUDGET
Budget 2017 Budget 2018 Budget 2019 % %
Change 2018 Change 2019
INCOME
Members' Contributions 1,069,774 1,069,774 1,069,774 0% 0%
Voluntary Member Contributions 53,489 53,489 53,489 0% 0%
Contributions in Arrears 50,000 50,000 50,000 0% 0%
Voluntary Contributions in Arrears 63,630 63,630 63,630 0% 0%
Host Country (Samoa) Contributions 20,327 20,327 20,327 0% 0%
Bank Interest 130,000 - - -100% 0%
Donor Funding 150,000 825,555 917,556 450% 11%
Miscellaneous - 150,000 150,000 100% 0%
Program Management Services 1,075,475 1,654,515 1,796,392 54% 9%
Unsecured 480,170 - - -100% 0%
Other income 150,000 150,000 150,000 0% 0%
TOTAL INCOME 3,242,865 4,037,290 4,271,168 24% 6%
EXPENDITURE
Personnel 1,807,818 2,598,577 2,615,488 44% 1%
Capital Expenditure 91,700 223,700 70,500 144% -68%
Consultancy 89,667 33,000 104,500 -63% 217%
Duty Travel 102,400 115,000 117,000 12% 2%
General & Operating Expenditure 903,880 942,912 959,180 4% 2%
Staff Development 70,000 49,000 49,000 -30% 0%
Special Events (SPREP Meeting) 176,400 57,000 333,000 -68% 484%
Training & Workshops 1,000 18,100 22,500 1710% 24%
TOTAL EXPENIDTURE 3,242,865 4,037,290 4,271,168 24% 6%
NET SURPLUS/DEFICT - - - - -
Table 4: Core Budget less Expenditure by Expenditure Type
6|P ageC
WORK PROGRAMME BUDGET
(amounts shown in USD Currency)
Budget Budget Budget
2017 2018 2019
INCOME
Programme Funding
Australia 2,464,147 2,031,427 2,047,208
NZAid 856,972 910,114 796,580
Project Funding
Adaptation Fund 1,972,010 2,618,290
Asian Development Bank 852,112
Australia 83,710
Australian Bureau of Metrology 349,695 863,544 85,020
Climate Analytics 240,000 240,000
Commonwealth Scientific and Industrial Research 88,030 -
European Union 3,189,696 7,759,450 8,376,508
EU through IUCN 388,800 388,800
FAO 2,000
France 16,800
GIZ 171,605 125,959 -
Government of Finland
Government of Germany 1,100,125 1,699,912 1,098,937
Green Climate Fund 6,000,000 7,800,000
South Korea
Island Conservation 35,000 -
IMO 130,717 79,100 79,100
IUCN 31,278 84,950 114,950
New Zealand 331,024 303,505 108,101
NOAA 122,669 60,500 -
PEW Trust 219,636 154,189 -
Pacific Islands Forum Secretariat (PIFS) 163,025 39,340 -
SPC-EU 99,432 148,439 182,205
UNDP-GEF 80,719
UNEP 1,192,381 1,515,238 1,227,630
UK Meteorology 199,000 209,000 209,000
World Meteorology Office 79,427 54,336 30,689
Other Donors 185,848 197,909 47,656
Unsecured - - -
Total Income 11,922,021 24,960,754 25,450,674
EXPENDITURE BY TYPE
Climate Change 2,976,985 13,141,160 14,337,021
Biodiversity and Ecosystem Management 2,869,857 7,281,637 5,814,522
Waste Managemetn and Pollution Control 4,344,991 2,829,110 3,774,258
Environmental Monitoring & Governance 1,075,468 1,627,597 1,443,623
Executive Management & Corporate Support 654,720 81,250 81,250
Total Expenditure 11,922,021 24,960,754 25,450,674
NET SURPLUS/DEFICT - - -
Table 5: Programme Budget less Expenditure by Programme Area
7|P ageC
WORK PROGRAMME BUDGET
(amounts shown in USD Currency)
Budget Budget Budget
2017 2018 2019
INCOME
Programme Funding
Australia 2,464,147 2,031,427 2,047,208
NZAid 856,972 910,114 796,580
Project Funding
Adaptation Fund 1,972,010 2,618,290
Asian Development Bank 852,112
Australia 83,710
Australian Bureau of Metrology 349,695 863,544 85,020
Climate Analytics 240,000 240,000
Commonwealth Scientific and Industrial Research 88,030 -
European Union 3,189,696 7,759,450 8,376,508
EU through IUCN 388,800 388,800
FAO 2,000
France 16,800
GIZ 171,605 125,959 -
Government of Finland
Government of Germany 1,100,125 1,699,912 1,098,937
Green Climate Fund 6,000,000 7,800,000
South Korea
Island Conservation 35,000 -
IMO 130,717 79,100 79,100
IUCN 31,278 84,950 114,950
New Zealand 331,024 303,505 108,101
NOAA 122,669 60,500 -
PEW Trust 219,636 154,189 -
Pacific Islands Forum Secretariat (PIFS) 163,025 39,340 -
SPC-EU 99,432 148,439 182,205
UNDP-GEF 80,719
UNEP 1,192,381 1,515,238 1,227,630
UK Meteorology 199,000 209,000 209,000
World Meteorology Office 79,427 54,336 30,689
Other Donors 185,848 197,909 47,656
Unsecured - - -
Total Income 11,922,021 24,960,754 25,450,674
EXPENDITURE BY TYPE
Personnel 4,312,045 4,318,537 3,211,967
Consultancy 3,534,650 2,249,716 1,529,543
General and Operating 1,000,329 1,011,688 721,477
Capital 20,778 34,657 49,998
Duty Travel 625,697 257,207 225,707
Training (incl. workshops & meetings) 1,244,523 2,078,138 1,274,892
Grant 1,183,998 210,000 190,000
Pipelines 14,800,810 18,247,090
Total Expenditure 11,922,021 24,960,754 25,450,674
NET SURPLUS/DEFICT - - -
Table 6: Programme Budget Income by Donor and Expenses by Expenditure Type
8|P ageD
FUNDING COMPOSITION FOR 2018 & 2019 BUDGET ESTIMATES
% of Total 2018 % of Total 2019
SOURCES OF FUNDING FOR THE BUDGET Budget 2018 TOTALS Budget 2019 TOTALS
I) Core Budget 1,257,220 1,257,220
-- Current
Current Members'
Contributions
Contributions 3.7% 1,069,774 3.6% 1,069,774
- Contributions in Arrears 0.2% 50,000 0.2% 50,000
- Voluntary Members' Contributions 2017 0.2% 53,489 0.2% 53,489
- Voluntary Members' Contributions in arrears 0.2% 63,630 0.2% 63,630
- Host Country (Samoa) contribution 0.1% 20,327 0.1% 20,327
- Other Donor 0.0% 0.0%
II) Other Income 300,000 300,000
- Interest Income 0.0% - 0.0% -
- Other Income 1.0% 300,000 1.0% 300,000
III) Programme Management Services 1,654,515 1,796,392
- Programme Management Services 5.7% 1,654,515 6.0% 1,796,392
IV) External Funding
A). Bilateral Funding 4,109 3,847,145
Australia
- AusAID - Extra Budgetary 9.4% 2,739,560 9.5% 2,829,931
- AusAID - Extra Extra Budgetary 0.0% 0.0%
New Zealand
- NZAID - Extra Budgetary 3.5% 1,005,237 3.1% 909,114
- NZAID - Extra Extra Budgetary 1.0% 303,505 0.4% 108,101
U.S.A
- USAID 0.0% 0.0%
- NOAA 0.2% 60,500 0.0% -
B). Multilateral Funding 21,478,597 22,473,429
- Adaptation Fund 6.8% 1,972,010 8.8% 2,618,290
- Australian Bureau of Metrology 3.0% 863,544 0.3% 85,020
- Climate Analytics 0.8% 240,000 0.8% 240,000
- Commonwealth Scientific and Industrial 0.3% 88,030 0.0% -
-European Union 26.8% 7,764,450 28.2% 8,381,508
- European Union - IUCN 1.3% 388,800.00 1.3% 388,800
- GIZ 0.4% 125,959 0.0% -
- Green Climate Fund (GCF) 20.7% 6,000,000 26.2% 7,800,000
- Govt. of Germany 5.9% 1,699,912 3.7% 1,098,937
- Island Conservation 0.1% 35,000 0.0% -
- International Maritime Organization 0.3% 79,100 0.3% 79,100
- IUCN 0.4% 102,250 0.4% 132,250
- PEW Trust 0.5% 154,189 0.0% -
- Pacific Islands Forum Secretariat (PIFS) 0.1% 39,340 0.0% -
- SPC/EC 0.5% 148,439 0.6% 182,205
- United Nations Development Programme/GEF 0.0% - 0.0% -
- United Nations Environment Programme 5.2% 1,515,238 4.1% 1,227,630
- United Kingdom Meteorology Office 0.7% 208,000 0.7% 209,000
- WMO 0.2% 54,336 0.1% 30,689
C). Other 197,909 47,656
- Miscellaneous Donors 0.7% 197,909 0.2% 47,656
TOTAL SECURED FUNDING 28,998,044 29,721,841
TOTAL UNSECURED FUNDING 0.0%
TOTAL BUDGET ESTIMATES 100.0% $28,998,044 100.0% $29,721,842
Table 7: Funding Composition for 2018-2019 By Donor
9|P ageWork Programme and Budget Details for 2018-2019
SCALE AND ALLOCATION OF MEMBERS'
CONTRIBUTIONS
FOR THE FINANCIAL YEAR 2018 & 2019
2018 & 2019
SPREP Approved Current
Scale Cont'n Shares
% USD $
American Samoa 0.95% 10,184
Australia 17.30% 185,106
Cook Islands 0.95% 10,184
Federated States of Micronesia 0.95% 10,184
Fiji 1.90% 20,360
France 12.55% 134,202
French Polynesia 1.90% 20,360
Guam 1.90% 20,360
Kiribati 0.95% 10,184
Marshall Islands 0.95% 10,184
Nauru 0.95% 10,184
New Caledonia 1.90% 20,360
New Zealand 12.55% 134,202
Niue 0.95% 10,184
Northern Marianas 0.95% 10,184
Palau 0.95% 10,184
Papua New Guinea 1.90% 20,360
Samoa 1.90% 20,360
Solomon Islands 1.90% 20,360
Tokelau 0.95% 10,184
Tonga 0.95% 10,184
Tuvalu 0.95% 10,184
United Kingdom 12.55% 134,202
United States of America 17.46% 186,787
Vanuatu 1.90% 20,360
Wallis & Futuna Islands 0.95% 10,184
Total 100% 1,069,774
10 | P a g eWork Programme and Budget Details for 2018-2019 F
WORK PROGRAMME AND BUDGET DETAILS
11 | P a g eREGIONAL GOAL 1 – Pacific people benefit from strengthened resilience to climate change 2018-2019
R01: In order In order to achieve the 10-year goal of Pacific Members to have built into their national systems greater capacity to manage
implementation of their climate change action priorities. For 2018-2019, SPREP is prioritizing, inter alia:
support a pilot programme for at least 4 PICTs to have integrated into their national sustainable development plans (or equivalent) adaptation, low carbon
development, nationally determined commitments for mitigation
community-based climate risk responses based on improved meteorological information
strengthening ecosystem-based adaptation implementation programmes in 4 PICs
enhancing National Meteorological and Hydrological Services (NMHS) capacity and improved climate services, and support and coordination through the
Pacific Meteorological Council
support to access and manage climate change finances
Support for the delivery of outputs under this Programme will be provided by the following staff:
Name Position
Espen RONNEBERG Climate Change Adviser
Tagaloa COOPER-HALO Climate Change Institutional Strengthening (USAID – SPC)
Salesa NIHMEI Meteorology & Climate Officer
Sunny SEUSEU Climate Prediction Services Coordinator
Makelesi GONELEVU Knowledge Management Officer
Siosinamele LUI COSPPac Climate Traditional Knowledge Officer
Azarel Mariner-MAIAI COSPPac Capacity Development Officer
Philip MALSALE COSPPac Climatology Officer
Sela SOAKAI –SIMAMAO Pacific Met Desk Project Assistant
Priscilla OLANO Pacific Climate Change Portal Technical Assistant
Alexandra MONTORO Technical Expert on Climate & Weather Services (PCRV)
Philip MARSDEN Climate information Knowledge Specialist (GIZ)
Patrick PRINGLE Senior Research Associate, Climate Change Strategies (CA)
VACANT Director - Climate Change
VACANT Climate Change Adaptation Adviser
VACANT Secretary to Director / Divisional Assistant
VACANT Pacific Islands Global Ocean Observatory System Officer
VACANT Pacific Islands Global Climate Observatory System Officer
12 | P a g eREGIONAL GOAL 1 – Pacific people benefit from strengthened resilience to climate change 2018-2019
2026 Regional Objectives 2019 Outcomes Indicators Activities Responsible 2018 Budget Estimates 2019 Budget Estimates
Programme(s) US$ US$
RO1.1 1.1.1 a) UNFCCC national 1. Support will be provided upon request and if CCD Sub Total – 778,422 Sub Total –397,229
Strengthen the capacity of Institutional strengthening reporting of at least 3 resources are available to assist PICs with UNFCCC
Personnel Operating Capital Personnel Operating Capital
Pacific island members to programmes supporting PICTs showing reporting.
Costs Costs Costs Costs Costs Costs
lead, prioritise, and manage mainstreamed and integrated mainstreamed CCA, DRR 2. Project proposals to assist in this regard are being
397,062 381,360 254,918 142,311
national climate change implementation of CCA, DRR and LCD mainstreamed developed.
adaptation (CCA), & low carbon development in operational national 3. Mainstreaming tools will be available through the Source of Funding Source of Funding
mitigation (NDCs) and (LCD) in budgeted national development plans. PCCP
disaster risk reduction development plans in at least 4. Roll out the starter pack to Samoa, Tuvalu, FSM AU 175,100 AU 171,568
(DRR) in fulfilment of their 3 PICTs. and PNG BM 2,959 NZ 64,456
national environment and 5. Support the development of risk and management WMPC GI 82,448 SP 161,205
development goals and MU 36,478
plans for disaster waste under Cleaner Pacific RO3.1.1,3;
NX 303,505
their voluntary and legal 2025, including Climate-Change Proofing 3.3.1 SP 125,439
obligations under regional 6. Support the integration CCA, DRR and low carbon EMG UNSECURED 52,493
and international into the NEMS development process.
agreements. b) Project pipelines to be 1. Vanuatu Climate information Services Resilient CCD Sub Total – 10,612,010 Sub Total –13,058,290
signed by the end of Development planning (VanCIS – RDP) - GCF
2017 2. Intra – ACP GCCA+ Project - EU Personnel Operating Capital Personnel Operating Capital
Costs Costs Costs Costs Costs Costs
3. GCCA+ SUPA Project - EU
10,612,010 13,058,290
4. IMPACT Project – Climate Analytics
5. Communities in FSM – Adaptation Fund Source of Funding Source of Funding
6. GCF Readiness Niue - GCF AF 1,972,010 AF 2,618,290
7. GCF Readiness RMI – GCF CL 240,000 CL 240,000
EE 2,400,000 EE 2,400,000
GC 6,000,000 GC 7,800,000
RO1.2 1.2.1 a) At least 4 PICTs have 1. Implementation of the PPOA project CCD Sub Total – 1,818,052 Sub Total – 1,259,921
Minimise multiple pressures incorporated EbA into 2. Implementation of the Pacific Ecosystem-based BEM Personnel Operating Capital Personnel Operating Capital
EbA incorporated into national
on vulnerable Pacific island national planning Adaptation to Climate Change Project: Costs Costs Costs Costs Costs Costs
adaptation plans of at least 3 575,899 1,238,121 4,032 202,241 1,057,681
ecosystems by strategies and 5 3. Based on the outcomes of ecological and social
PICTs
implementing ecosystem- additional PICs are being resilience assessment mapping (ESRAMs), Source of Funding Source of Funding
based approaches to supported to do so. implement EbA demonstration projects in Fiji AU 70,484 AU 69,684
climate change adaptation, b) Capacity building and (Taveuni Island; Macuata Province), Solomon GR 1,699,912 GR 1,098,937
including responses to training in planning and Islands (Wagina Island; Honiara) and Vanuatu MU 47,656 MU 47,656
ocean acidification and sea adaptation responses to (Tanna Island; Port Vila) NZ 43,645
level rise, to sustain address OA and SLR 4. Design and implement monitoring and evaluation
biodiversity and the implemented in at least plans for PEBACC demonstration activities.
provision of ecosystem 4 PICTs 5. Quantify ecosystem service and socio-economic
services that support benefits of restoration and protection activities
livelihoods and sustainable and communicate results in Fiji, Solomon Islands
development and Vanuatu.
6. Incorporate lessons learnt from PEBACC
demonstration projects and best practices into
regional policy development and planning.
13 | P a g eREGIONAL GOAL 1 – Pacific people benefit from strengthened resilience to climate change 2018-2019
2026 Regional Objectives 2019 Outcomes Indicators Activities Responsible 2018 Budget Estimates 2019 Budget Estimates
Programme(s) US$ US$
7. Train nationals in ecosystem and CCA assessment
and mapping at relevant scales through training
workshops and on ground activities in Fiji,
Solomon Islands and Vanuatu.
8. Disseminate EbA prioritisation tools (e.g. cost
benefit analyses).
9. Establish and/or support governance
arrangements that promote integrated,
sustainable and cross-sectoral approaches to EbA
at PEBACC project sites
10. Develop communications and outreach products
to promote integration of EbA
11. options into climate change policies, plans and
projects.
12. Support actions that capitalise on opportunities to WMPC
reduce threats (GHGs, disaster waste, air, water 3.1.1,3;3.2.1,
and soil contamination) arising from waste 5
management (e.g. waste to energy, good practice
in landfill operation, reduced packaging
13. Support the integration of EbA into the NEMS EMG
development process
RO1.3 1.3.1 a) At least 3 new countries 1. Regular coordination of Pacific Meteorological CCD
Enhance National accredited with ICAO Council (PMC) panels Sub-total – 1,415,995 Sub-total –505,325
At least 4 NHMS with climate
Meteorological and certification 2. Supporting PIAWS chair to ICAO meetings Personnel Operating Capital Personnel Operating Capital
service frameworks integrated Costs Costs Costs Costs Costs Costs
Hydrological Services b) At least 2 NMHSs to 3. Implementation of the Pacific Islands
across govt agencies and 501,373 914,622 0 245,395 259,929 0
(NMHS) capacity in weather establish and improve Meteorological Strategy 2017-2026 and the Pacific
forecasting, early warning communities MHEWS, and enhance Roadmap for Strengthened Climate Services.
Source of funding Source of funding
systems, long-term integration across 4. Implementation of the PMC recommendations and
AU 192,234 AU 180,616
projections, and improved government agencies Ministerial outcomes.
BM 860,586 BM 85,020
climate services to support and communities. 5. Support the PMC-5 and PMMM-3 NO 60,500 UM 209,000
members’ decision-making c) At least 4 NMS have 6. Develop tools for early warnings and provide PF 39,340 WM 30,689
and coordination through climate services supports to PICTs UM 209,000
the Pacific Meteorological frameworks and NCOFs 7. Support Pacific Island Climate Outlook Forum WM 54,335
Council d) At least 5 NMS have (PICOF)
integrated Traditional 8. Support countries to establish National Climate
Knowledge in their Outlook Forums (NCOFs) and develop national
climate knowledge climate services frameworks
products 9. Convene Online Climate Outlook Forums (OCOFs)
and provide trainings and guidance/resource
materials for seasonal outlooks.
14 | P a g eREGIONAL GOAL 1 – Pacific people benefit from strengthened resilience to climate change 2018-2019
2026 Regional Objectives 2019 Outcomes Indicators Activities Responsible 2018 Budget Estimates 2019 Budget Estimates
Programme(s) US$ US$
10. Support Pacific Island NMS in developing TK
knowledge products
11. Support NMS to integrate TK into climate
knowledge products
12. Support NMS to communicate integrated
knowledge products
13. Support the integration of the climate service EMG
framework into the NEMS development process
RO1.4 1.4.1 a) At least 3 PICs provided 1. Outreach on climate change finance opportunities CCD Sub-total – 163,202 Sub-total – 162,602
Support Pacific island with information and will continue, as well as direct expressions of
Members to access and Pacific island Members are technical support to interest.
Personnel Operating Capital Personnel Operating Capital
supported with information Costs Costs Costs Costs Costs Costs
manage climate change access climate finance 2. Support will be provided upon request from PICs 109,952 53,250 109,152 53,450
and technical assistance to
finances and their national and strengthen national for assistance with projects as part of RIE function
improve their national systems
accreditation processes institutions. of SPREP Source of Funding Source of Funding
for accreditation and access to b) SPRP has a portfolio of 3. Carry out training workshops for the Adaptation AU 140,202 AU 141,602
climate finance
at least 4 approved Planning and decision support tools SP 23,000 SP 21,000
projects/programmes as 4. Support the achievement of climate financing EMG
Regional Implementing mechanisms into the NEMS development process
Entity for climate finance 5. Support on the preparation and approval of at
least 4 GCF Readiness proposals Ex&Corp: PCU
6. Develop and present via web and country trainings
information and support tools for access to
climate finance
7. Ongoing representation of Pacific Island country
priorities and interests at key fora.
RO1.5 1.5.1 a) Repository for loss and 1. The PCCP will establish dedicated webpage to loss CCD Sub Total – 83,640 Sub Total – 82,840
Support Pacific Island damage established and and damage issues. Personnel Operating Capital Personnel Operating Capital
At least 3 PICTs have
Members to develop policy showing at least 3 PICTs 2. Support will be provided to PICs upon request to Costs costs Costs Costs costs Costs
responses to issues of loss developed policy for loss and supported to approve develop policies, pending availability of resources 83,640 0 0 82,840 0 0
damage
and damage, and climate loss and damage policies. 3. Support the achievement of this indicator into the EMG Source of Funding Source of Funding
change and disaster NEMS development process
induced population mobility AU 83,640 AU 82,840
4. Support the development of plans that relate to WMPC
disaster waste management and action 3.1.3:3.2.1,3
2018 Budget 2019 Budget
Total Personnel $1,667,926 $894,547
Total Operating $13,199,364 $14,571,660
TOTAL REGIONAL GOAL 1
Total Capital $4,032
OVERALL TOTAL $ 14,871,322 $15,466,207
15 | P a g eREGIONAL GOAL 1 – Pacific people benefit from strengthened resilience to climate change 2018-2019
BUDGET ESTIMATES BY SOURCE OF FUNDING 2018 & 2019
USD$ USD$
Personnel Costs: 2018 2019
Australia XB 545,224 527,565 BUDGET ESTIMATES ALLOCATION BY MEMBER COUNTRY 2018
Australia Bureau of Meteorology 292,888 85,020 & 2019
GIZ 82,448 - 2018 2019
Government of Germany 505,415 132,557 COUNTRY USD$ USD$
Multi Donor 36,478 - American Samoa 1,700 1,300
Pacific Is. Forum Secretariat 39,340 - Fiji 65,157 23,868
Federated States of
Secretariat of the Pacific Community 113,639 149,405 Micronesia 8,000 -
UNSECURED 52,493 - Kiribati 181,857 118,868
Sub Total 1,667,926 894,547 Nauru 2,500 -
Operating Costs: Regional 14,215,551 15,171,134
Adaptation Fund 1,972,010 2,618,290 Solomon Islands - 8,300
Australia XB 116,435 118,745 Samoa 109,232 -
Australia Bureau of Meteorology 570,656 - Tokelau 65,157 23,869
Climate Analytics 240,000 240,000 Tonga 21,600 -
European Union 2,400,000 2,400,000 Tuvalu 135,410 95,000
Green Climate Fund 6,000,000 7,800,000 Vanuatu 65,157 23,868
Government of Germany 1,190,465 966,379 GRAND TOTAL $14,871,322 $15,466,207
Multi Donor 47,656 47,656
US - NOAA 60,500 -
New Zealand XB 303,505 108,101
Secretariat of the Pacific Community 34,800 32,800
United Kingdom Metrology Office 209,000 209,000
World Metrology Organisation 54,336 30,689
Sub Total 13,199,364 14,571,660
Capital Costs:
Government of Germany 4,032 -
GRAND TOTAL $14,871,322 15,466,207
16 | P a g eREGIONAL GOAL 2 – Pacific people benefit from healthy and resilient island and ocean ecosystems 2018-2019
RO2: The 10-year goal is to see benefits accruing to Pacific Members from more effectively managed terrestrial, coastal and marine ecosystems. For
2018-2019, SPREP is prioritizing, inter alia:
Development of a regional GCF proposal for coastal ecosystem resilience
At least 20% of PICTs for improved coral reef, protected areas and genetic resources management capacity
At least 50% of PICs achieve CBD Aichi Target 11
At least 4 PICTs implementing invasive species management and eradication measures, supported by a regional framework
Support for the delivery of outputs under this Programme will be provided by the following staff:
Name Position
Stuart Chape Director - Biodiversity and Ecosystem Management
Warren Lee Long Coastal and Marine Adviser
David Moverley Invasive Species Adviser
Michael Donohue Threatened and Migratory Species Adviser
Amanda Wheatley Ecosystem and Biodiversity Officer
Juney Ward Shark & Ray Conservation Officer
Herman Timmermans PEBACC Project Manager
David Loubser PEBACC Vanuatu Country Manager
Allan Dan PEBACC Vanuatu Project Officer
Fred Patison PEBACC Solomon Islands Country Manager
Filomena Serenia PEBACC Fiji Project Officer
Jilda Shem PEBACC Communications Officer
Roneel Prasad PEBACC Finance & Administration Officer
Makerita Atiga Secretary to Director / Division Assistant
Akiko Hamada-Ano Coastal & Marine Management Specialist (PCRV)
Flora Artzner Pacific Biodiversity Blue Belt Coordinator
VACANT Biodiversity Adviser
VACANT Ecosystem-based Adaptation Adviser
VACANT Coastal & Coral Reef Management Officer
VACANT Invasive Species Officer
VACANT Protected Areas Officer
VACANT ABS Legal Adviser
VACANT ABS Capacity Building Officer
VACANT ABS Technical & Finance Assistant
17 | P a g eREGIONAL GOAL 2 – Pacific people benefit from healthy and resilient island and ocean ecosystems 2018-2019
2026 Regional 2019 Outcomes Indicators Activities Responsible 2018 Budget Estimates 2019 Budget Estimates
Objectives Programme(s) US$ US$
RO2.1 2.1.1 a) Four new technical and 1. Provide technical briefs and support to Members BEM: C&M Sub Total – 882,792 Sub Total – 711,832
Effectively manage and SPREP Members, other policy briefs on ocean and to Pacific SIDS missions in UN on BBNJ and
protect marine and regional organisations and management, ABNJ/BBNJ, SDG indicators , at BBNJ Prep Comm Meetings, via Personnel Operating Capital Personnel Operating Capital
coastal ecosystems; partners have easy access to Oceans SDG, sea bed regional taskforces and intersessionally. Costs Costs Costs Costs Costs Costs
mitigation of the impacts improved Information on mining and related issues 2. Produce draft marine bioregion descriptions for 135,124 747,668 0 78,534 633,298 0
of fisheries activities to sustainable use and are developed and the Pacific islands region with partners and Source of Funding Source of Funding
ensure healthy conservation of ocean coordinated by SPREP and experts.
AU 53,679 AU 45,574
populations of threatened resources and biodiversity its partners. 3. Provide legal and technical support on the
NZ 72,891 NZ 73,679
species, and reduce the beyond national jurisdictions development of BBJL/ABNJ and sea bed mining PW 41,067 EE 592,579
release of marine (BBNJ) briefs for technical partners and member countries EE 715,155
pollutants that increase 4. Support the integration of coastal, marine and
human health risks in ocean conservation into the NEMS development
order to achieve healthy process.
and productive oceans 5. Regional spatial datasets for marine EMG
that support food security bioregionalisation compiled
and sustainable 6. Expert and PICT representative biroregionalation
development workshops convened
7. Support to promote good waste disposal practices WMPC
in the fishing and shipping industry that impact on RO3.1.2
marine and coastal ecosystems (waste, fishing
gear, ballast water)
8. Support to promote best practice in waste WMPC
disposal to prevent plastics entering the marine RO3.1.1,2;
environment 3.3.1
2.1.2 a) At least three training 1. Through implementation of the EDF-11 PEUMP TAMS
By-catch of threatened species activities carried out for Project:
in commercial fisheries commercial fisheries in the Review extent and effectiveness of existing
successfully mitigated in one region to improve by- mitigation practices
key PICT fishery. catch mitigation Establish working relationships with fisheries
b) By-catch collaboration agencies, consultants, fishing fleet managers,
established with fisheries skippers, fishing masters and crew
industries and relevant Develop and deliver training module, based
agencies evidenced on successful models
through implementation Work with national and regional fisheries
of improved by-catch agencies and fisheries observers to
control methods in at implement by-catch mitigation methods in
least national jurisdictions national jurisdictions
18 | P a g eREGIONAL GOAL 2 – Pacific people benefit from healthy and resilient island and ocean ecosystems 2018-2019
2026 Regional 2019 Outcomes Indicators Activities Responsible 2018 Budget Estimates 2019 Budget Estimates
Objectives Programme(s) US$ US$
2.1.3 a) Regional coral reef 1. Develop Pacific regional coral reef database with C&M
Information on the status of database developed and GCRMN members and partners.
Pacific coral reefs is improved, the Pacific coral reefs 2. Provide national coral reef status and trends to be
easily accessed and used to status and trends update incorporated into national environmental
guide more effective planning completed. reporting and planning including SOEs.
and management of coral b) At least 3 country 3. Assist member countries to access training
reefs in 20% of PICTs environmental profiles are courses and guidelines in assessment and
improved with monitoring of coastal and coral reef habitats
information from this
database
2.1.4 a) Integrated ecosystem 1. Complete ecosystem analysis and mapping for 2 C&M
Examples of improved coastal analysis and mapping, and countries in EDF11 PEUMP.
and marine ecosystem analysis rapid biodiversity 2. Complete update of the Pacific Regional Wetlands
have been developed, assessments completed in Action Plan that includes coral reefs
implemented and made at least 2 PICTs and
available to Members. lessons learnt shared and
used by Members
2.1.5 a) Ballast water management 1. See 2.4.1: GEF6 project development will include ISP, WM
Ballast water management strategy implemented in X implementation of Ballast Water management
strategy implemented in PICTs strategy in Tuvalu.
Pacific island countries b) Pipeline project to be 1. EDF-11 PEUMP Sub Total - 2,188,800 Sub Total - 2,188,800
signed by end of 2017 2. BIOPAMA Phase 2
Personnel Operating Capital Personnel Operating Capital
Costs Costs Costs Costs Costs Costs
2,188,800 2,188,800
Source of funding Source of funding
EU 1,800,000 EU 1,800,000
EU-ICN 388,800 EU-ICN 388,800
RO2.2 2.2.1 a) Marine protected area 1. Pacific region Biodiversity and Protected Area C&M, EMG,
Sub Total –1,352,791 Sub Total –1,239,565
Support the conservation (MPA) planning and Management (BIOPAMA) project to support: CS
Protected area (PA) Personnel Operating Capital Personnel Operating Capital
and sustainable use of management capacity is management training Analyse need for Protected Area
Costs Costs Costs Costs Costs Costs
marine, coastal, and improved in at least 20% of undertaken in four PICTs Management Effectiveness (PAME) measures
terrestrial ecosystems and 643,790 702,001 7,000 490,694 739,271 9,600
PICTs through country engagement and existing
biodiversity, consistent national Aichi Target 11 roadmaps. Source of funding Source of funding
with regional and Prepare application proposal to IUCN for AU 335,036 AU 302,119
international funding under the BIOPAMAAction Grant to CW 86,355 EE 363,199
commitments implement Management Effectiveness EE 332,809 IU 114,950
Assessments and related activities at regional GI 41,635 NZ 24,790
IU 84,950 UE 434,508
and country levels.
NZ 19,717
Based on analysis of country Aichi Target 11 UE 426,008
roadmaps, identify specific training needs to UNSECURED 26,282
19 | P a g eREGIONAL GOAL 2 – Pacific people benefit from healthy and resilient island and ocean ecosystems 2018-2019
2026 Regional 2019 Outcomes Indicators Activities Responsible 2018 Budget Estimates 2019 Budget Estimates
Objectives Programme(s) US$ US$
be supported with funding from the
BIOPAMA Action Grant.
Conduct in-country training on Pacific Islands
Protected Area Portal (PIPAP) tools, including
introductory training sessions on PAME, Open
Standard for Conservation Planning and
Miradi and other training to be identified
from country engagement through the
BIOPAMA project.
Conduct in-country training on Protected
Area data management and analysis and
contributory processes (eg Marine Spatial
Planning, GIS).
Support establishment of country Protected
Area networks of practitioners with clearly
defined Terms of Reference to support PA
work including compilation of Country PA
spatial databases.
2. Support the integration of protected area
priorities into the NEMS development process.
3. Develop PA spatial database for PICs
4. Assist PICs in developing MSP guidelines
b) Guidelines for marine 1. Regional Marine Spatial Planning guidelines
spatial planning (MSP), PA developed to support all countries in the region.
management, monitoring 2. Provide technical support to MSP and MPA
and surveillance produced management capacity in Fiji, Solomon Islands,
and disseminated to Vanuatu and Tonga with partners.
Members and partners. 3. Support development of land-use options for WMPC
waste storage facilities and landfills for climate- 3.1.1,3
change proofing that does not impact on
biodiversity and ecosystem conservation
20 | P a g eREGIONAL GOAL 2 – Pacific people benefit from healthy and resilient island and ocean ecosystems 2018-2019
2026 Regional 2019 Outcomes Indicators Activities Responsible 2018 Budget Estimates 2019 Budget Estimates
Objectives Programme(s) US$ US$
4. Through implementation of the EU BEST funded BEM
Biodiversity Blue Belt Project:
Provide marine spatial planning (MSP) and
MPA management assistance to New
Caledonia, Wallis et Futuna & French
Polynesia.
Produce and distribute MSP and surveillance
technology guidelines in French & English for
all Members
5. Provide technical assistance to managers and key
stakeholders (e.g., tourism operators) on
implementation, use and management of
underwater education trails in French Polynesia
and Wallis et Futuna.
6. Produce and apply underwater trail management
guidelines for use in French Polynesia, New
Caledonia and Wallis and Futuna.
2.2.2 a) Three PICTs have 1. GEF Regional ABS project to undertake the Biodiversity,
developed draft ABS following: EMG
Capacity of PICTs to
implement Objective 3 of the policy instruments and Analyze common assets/values, issues and
Convention on Biological processes needs (including biological resources and
Diversity (CBD) on Access and applications of traditional knowledge) between
Benefit Sharing (ABS) is countries.
strengthened to enable better Develop a regional position to support a
national and local common vision for the region which supports
management and control of national ABS policies, and international
genetic resources negotiations.
21 | P a g eREGIONAL GOAL 2 – Pacific people benefit from healthy and resilient island and ocean ecosystems 2018-2019
2026 Regional 2019 Outcomes Indicators Activities Responsible 2018 Budget Estimates 2019 Budget Estimates
Objectives Programme(s) US$ US$
Identify new policy directions for individual
countries and the region.
Establish regional mechanisms which provide
the means for regional understanding and
technical support on an ongoing basis.
Undertake national scoping studies of existing
laws and regulations related to ABS, including
identification of any gaps, and implications of
ratification of the Nagoya Protocol.
Hold public awareness workshops targeting
decision-makers of the Protocol, as well as
increasing understanding of the importance of
genetic resources as a source of
innovation/driver for benefit- sharing in the
national economy.
Draft national ABS law/regulation/ policy
proposals and submitted for approval to
competent authorities and assist in preparation
of draft documentation for ratification.
Undertake an assessment of capacities and
systems to implement basic provisions of the NP.
Develop or review strategies and action plans
for the implementation of ABS measures
Create an enabling environment to develop
capacity among stakeholders; a supportive basis
for countries to take advantage of biodiscovery
and commercialisation opportunities; and a
supportive institutional framework.
Exchange of information and experience on
development and implementation of the
Nagoya Protocol through mutual learning
between Pacific countries.
2. Provide legal input to the draft ABS instrument EMG: 2
and policies
22 | P a g eREGIONAL GOAL 2 – Pacific people benefit from healthy and resilient island and ocean ecosystems 2018-2019
2026 Regional 2019 Outcomes Indicators Activities Responsible 2018 Budget Estimates 2019 Budget Estimates
Objectives Programme(s) US$ US$
2.2.3 a) At least 50% of PICTs have 1. Convene annual meetings of PIRT, and associated Biodiversity
The Pacific Islands Roundtable achieved Aichi Target 11 meeting of the Protected Areas Working Group to
for Nature Conservation (PIRT) on establishment of support coordinated and effective regional
effectively coordinates and protected areas progress of Pacific Island countries to achieve
implements the Framework for Aichi Target 11.
Nature Conservation and 2. Strengthen regional partnerships and
Protected Areas 2014-2020 collaboration through signing up 3 new member
agencies to the PIRT partnership agreement.
3. Work with at least 2 PIRT members to assist at
least 4 countries in implementing PA priorities in
their Aichi Target roadmap.
4. Prepare for 10th Nature Conference to be held in
2020including review current Framework for
Nature Conservation and development of new
draft framework.
2.2.4 a) Number of PICTs and 1. Pacific region Biodiversity and Protected Area Biodiversity,
partners that have joined Management (BIOPAMA) project to support: EMG, CS: 1
Data, information and
knowledge on PAs in PICTs are and used PIPAP as a Input and update new environmental data
improved, used and easily repository to share verified by countries and available at site,
accessed by Members and information on PAs and country and ecoregion levels, as well as
partners through the Pacific biodiversity conservation reporting on results, nationally and regionally
Islands Protected Area Portal through PIPAP.
(PIPAP). Facilitate a process for establishing data
sharing agreements with countries (based on
national processes and protocols).
Improve PIPAP features to include a
Dashboard/barometer in consultation with EU
Joint Research Collaborative (JRC) in line with
Pacific context.
Compile training modules, including a manual
on PIPAP tools and services, and explore
practical ways to integrate these into existing
capacity building and training
programmes/initiatives in the region and at
country level.
23 | P a g eREGIONAL GOAL 2 – Pacific people benefit from healthy and resilient island and ocean ecosystems 2018-2019
2026 Regional 2019 Outcomes Indicators Activities Responsible 2018 Budget Estimates 2019 Budget Estimates
Objectives Programme(s) US$ US$
Develop PIPAP tools, communication and
promotional products and activities that are
used to support decision making processes.
Conduct in-country training on PIPAP tools
and GIS capacity building training for PA
managers (complementary to 4.1.1)
Update and enhance PIPAP to include an
interactive function to support networking and
knowledge sharing including a feature to
facilitate expert advice.
1. Develop PA spatial databases for PICs and upload
these on PIPAP pending data sharing agreements.
2. Conduct GIS capacity building training for PA EMG: 2-3
managers (complementary to 4.1.1)
RO2.3 2.3.1 a) Regional Marine Species 1. Produce and present draft MSAP to SPREP Sub total – 560,635 Sub total – 314,922
Prevent the extinction of An updated MSAP including a Action Plan (MSAP) is meeting 2017 for comment and then updated in TAMS:1 Personnel Operating Capital Personnel Operating Capital
threatened species and new section on sharks and reviewed and updated for 2018. Costs Costs Costs Costs Costs Costs
support measures to the period 2018-2023. 2. Provide advice and technical support to Members TAMS:2 119,605 441,030 87,592 227,330
rays is endorsed by all PICTs is
sustain their conservation used as the basis for the b) At least 5 PICTs are on conservation of threatened marine species.
status conservation of threatened implementing activities 3. Promote MSAP as a strategic direction in the EMG:3
Source of funding Source of funding
marine species by PICTs under the MSAP to NEMS development for selected countries. EE 321,310 EE 220,730
protect and conserve NZ 126,205 NZ 94,192
threatened marine species PW 113,120
with support from SPREP
2.3.2 a) Data management in the 1. Update TREDS to be a more user-friendly web- TAMS
The conservation status of marine turtle research and based system
marine turtles is regularly monitoring database 2. Provide resources to ensure that information flows
monitored and information (TREDS) has improved and meet indicator
shared with Members and update report are sent 3. Support community monitors at nesting beaches
partners annually to Members and
partners
2.3.3 a) Planning and 1. Technical assistance and support provided to TAMS
Members progress the management support Samoa and Tokelau to strengthen regulations for
establishment two additional provided to PICTs for the shark protection and establishment of a shark
marine sanctuaries in the SPREP establishment of at least sanctuary
region for the protection of two marine species 2. Enforcement and compliance training provided for
threatened species sanctuaries government officials (enforcement officers) that
have established shark sanctuaries such as Samoa
24 | P a g eREGIONAL GOAL 2 – Pacific people benefit from healthy and resilient island and ocean ecosystems 2018-2019
2026 Regional 2019 Outcomes Indicators Activities Responsible 2018 Budget Estimates 2019 Budget Estimates
Objectives Programme(s) US$ US$
2.3.4 a) Endorsement of best 1. Produce and distribute regional guidelines for TAMS
Regional guidelines for best practice for species best practice for shark and ray ecotourism.
practice for species ecotourism ecotourism guidelines by
are developed and SPREP Members and
implemented by at least 2 PICTs. implementation by at least
2 PICTs
RO2.4 2.4.1 a) US$4m secured for four 1. Develop to Approved status the GEF6 project ISP: 1-5
Sub total – 535,079 Sub total – 132,460
Significantly reduce the Invasive species management PICTs to implement “Strengthening national and regional capacities to
socio-economic and management and reduce the impact of Invasive Alien Species on Personnel Operating Capital Personnel Operatingt Capital
and eradication measures Costs Costs Costs Costs Costs Costs
ecological impact of implemented in at least 4 PICTs eradication measures globally significant biodiversity in the Pacific”
149,826 385,253 103,585 28,875
invasive species on land and a regional support b) US$2m secured for including national STAR allocations of at least US$
and water ecosystems and framework is in place regional invasive species 4 million. Source of Funding Source of Funding
control or eradicate support from the Global 2. Develop to Approved status the GEF6 project EE 190,178 NZ 132,460
priority species Environment Facility (GEF) “Strengthening national and regional capacities to IC 35,000
c) Invasive species are reduce the impact of Invasive Alien Species on MU 35,000
removed from four islands globally significant biodiversity in the Pacific” NZ 180,901
UE 94,000
d) Invasive species managed including a component on regional support from
at four sites the Global Set-Aside Fund of US$2 million.
4. Coordinate a Pacific Invasive Partnership Meeting
in 2018 and 2019 to ensure expert support is
available to members for a wide variety of invasive
species issues and activities.
5. Determine priority eradication targets during GEF
6 project development stage during 2018.
Implement priority eradication activities during
2019.
6. Determine priority management sites activities
during GEF 6 project development stage 2018.
Support ongoing management of sites in Tonga,
Niue and Samoa
7. Support the integration of invasive species EMG: 6
management into the NEMS development
process.
8. Provide advice on the spread of invasive species WMPC 3.1.2
from marine debris
25 | P a g eREGIONAL GOAL 2 – Pacific people benefit from healthy and resilient island and ocean ecosystems 2018-2019
2026 Regional 2019 Outcomes Indicators Activities Responsible 2018 Budget Estimates 2019 Budget Estimates
Objectives Programme(s) US$ US$
2.4.2 a) At least one regional PILN 1. Coordinate the Mobilization of Invasive Species ISP
Capacity of PICT Pacific meeting convened Data with national partners.
Invasive Learning Network b) Number of new resources 2. Convene a regional PILN Meeting in 2019.
members to manage and on the Battler Resource 3. Re-engage CNMI PILN Team to revitalize their
eradicate invasive species is Database. national collaboration and participation in the
strengthened through network regional network.
initiatives 4. Provide technical support to the Micronesia
Invasive Species Committee.
5. Provide technical support to the newly created
Melanesian Invasive Species Committee.
6. Maintain and increase the resources available
through the Battler Resource Base.
7. Develop two new publications for the Pacific
Invasive Species Battler Series. (Biological control
of widespread weeds for resilient ecosystems,
Predator control for resilient ecosystems).
Budget 2018 Budget 2019
Total Personnel $ 1,048,345 $760,406
Total Operating $4,464,752 $3,817,574
TOTAL REGIONAL GOAL 2
Total Capital $7,000 $9,600
OVERALL TOTAL $5,520,097 4,587,580
26 | P a g eREGIONAL GOAL 2 – Pacific people benefit from healthy and resilient island and ocean ecosystems 2018-2019
BUDGET ESTIMATES BY SOURCE OF FUNDING 2018 & 2019
BUDGET ESTIMATES ALLOCATION BY MEMBER COUNTRY 2018
USD$ USD$ & 2019
Personnel 2018 2019
2018 2019
Australia XB 280,364 241,432
COUNTRY USD$ USD$
Commonwealth Secretariat 86,355 -
Cook Islands 4,000 -
European Union 57,142 47,348
Federated States of 5,000 -
GIZ 12,515 - Micronesia
New Zealand 335,022 256,029 Nauru - 4,000
Pew Charitable Trust 41,069 - Niue 3,500 7,500
United Nations Environment Programme 209,597 215,597
Northern Mariana 7,500 -
UNSECURED 26,282 -
Palau 5,000 -
Sub Total 1,048,345 760,406
Regional 5,455,497 4,564,580
Operating
Australia XB 108,350 103,660 Solomon Islands - 4,000
European Union 3,302,308 2,929,160 Tonga 3,500 3,500
European Union – IUCN 388,800 388,800 Tuvalu 4,000 -
GIZ 29,120 - Vanuatu - 4,000
Island Conservation 35,000 - Wallis & Futuna 32,100 -
International Union of Conservation on nature 77,950 107,950 GRANT TOTAL $5,520,097 $4,587,580
Multi donor 35,000 -
New Zealand XB 64,693 69,093
Pew Charitable Trust 113,120 -
United Nations Environment Programme 310,411 218,911
Sub Total 4,464,752 3,817,574
Capital
Australia XB - 2,600
International Unit of Conservation on Nature 7,000 7,000
Sub Total 7,000 9,600
GRAND TOTAL $5,520,097 $4,587,580
27 | P a g eYou can also read