2021 SECOND QUARTER MANAGEMENT DISCUSSION & ANALYSIS - AUTOCANADA ...
←
→
Page content transcription
If your browser does not render page correctly, please read the page content below
2021

   Second Quarter
    Management
Discussion & Analysis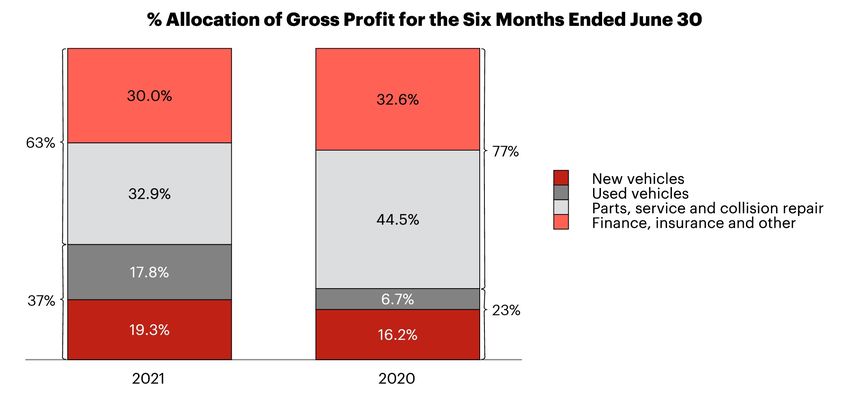
MANAGEMENT’S DISCUSSION AND ANALYSIS
OF FINANCIAL CONDITION AND RESULTS OF
OPERATIONS
For the three-month and six-month periods ended June 30, 2021
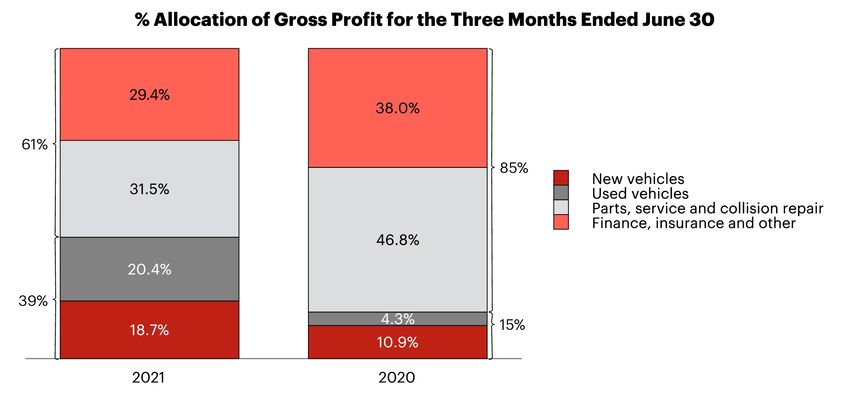
Table of Contents

MANAGEMENT'S DISCUSSION AND ANALYSIS

 1.    Reader Advisories                                                     3

 2.    Executive Summary                                                    4

 3.    Market and Outlook                                                   13

 4.    Results of Operations                                                15

 5.    Acquisitions, Divestitures, Relocations and Real Estate              31

 6.    Liquidity and Capital Resources                                      32

 7.    Related Party Transactions                                           38

 8.    Outstanding Shares                                                   38

 9.    Dividends                                                            38

 10.   Free Cash Flow                                                       39

 11.   Critical Accounting Estimates and Accounting Policy Developments     39

 12.   Disclosure Controls and Internal Controls Over Financial Reporting   40

 13.   Risk Factors                                                         40

 14.   Forward-Looking Statements                                           40

 15.   Non-GAAP Measures                                                    41

 16.   Non-GAAP Measure Reconciliations                                     43

 17.   Selected Quarterly Financial Information                             48

 18.   Segmented Operating Results Data                                     50

 19.   Same Store Results Data                                              53

 20.   IFRS 16 Impacts for the Period                                       55

 21.   List of Dealerships                                                  57
1.      READER ADVISORIES
This Management’s Discussion & Analysis (“MD&A”) was prepared as of August 11, 2021, to assist readers in
understanding AutoCanada Inc.’s (the “Company” or “AutoCanada”) consolidated financial performance for the
three-month period and six-month period ended June 30, 2021, and significant trends that may affect AutoCanada’s
future performance. The following discussion and analysis should be read in conjunction with the unaudited
condensed interim consolidated financial statements and accompanying notes (the “Interim Consolidated Financial
Statements”) of AutoCanada as at and for the three-month period and six-month period ended June 30, 2021, the
audited annual consolidated financial statements and accompanying notes (the “Consolidated Financial
Statements”) of AutoCanada as at and for the year ended December 31, 2020, and the MD&A for the year ended
December 31, 2020. Results are reported in Canadian dollars and have been rounded to the nearest thousand
dollars, unless otherwise stated.

To provide more meaningful information, this MD&A typically refers to the operating results for the three-month
period and six-month period ended June 30, 2021 of the Company, and compares these to the operating results of
the Company for the three-month period and six-month period ended June 30, 2020.

This MD&A contains forward-looking statements. Please see the section “FORWARD-LOOKING STATEMENTS” for a
discussion of the risks, uncertainties and assumptions used to develop our forward-looking information. This MD&A
also makes reference to certain non-GAAP measures to assist users in assessing AutoCanada’s performance. Non-
GAAP measures do not have any standard meaning prescribed by GAAP and are therefore unlikely to be comparable
to similar measures presented by other issuers. These measures are identified and described under the section
“NON-GAAP MEASURES”.

Additional information regarding our Company, including our 2020 Annual Information Form, dated March 2, 2021, is
available on SEDAR at www.sedar.com and our website www.autocan.ca. Such additional information is not
incorporated by reference herein, unless otherwise specified, and should not be deemed to be made part of this
MD&A.

                                                                  AutoCanada • 2021 Second Quarter Report • Page 3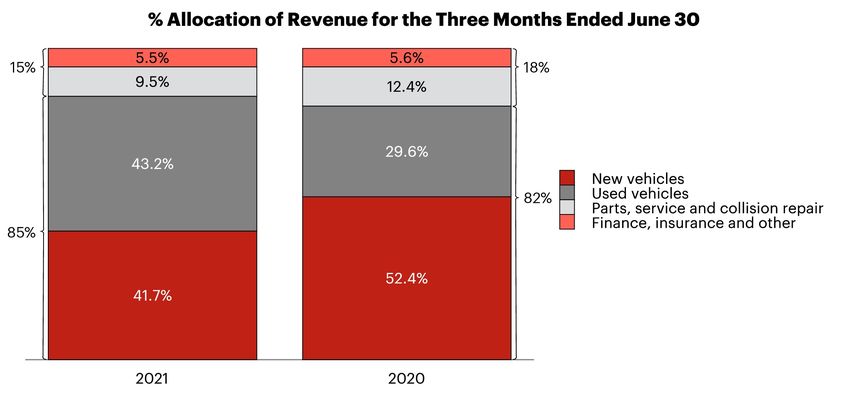
2. EXECUTIVE SUMMARY
Business Overview
Canadian Operations
AutoCanada's Canadian Operations segment currently operates 49 franchised dealerships in Canada, comprised of 21
brands, in 8 provinces. AutoCanada currently sells Chrysler, Dodge, Jeep, Ram, FIAT, Alfa Romeo, Chevrolet, GMC,
Buick, Cadillac, Infiniti, Nissan, Hyundai, Subaru, Audi, Volkswagen, Mazda, Mercedes-Benz, BMW, MINI and Ford
branded vehicles. In addition, AutoCanada's Canadian Operations segment currently operates 2 used vehicle
dealerships supporting the Used Digital Retail Division, and 2 stand-alone collision centers (within our group of 17
collision centers). In 2020, our Canadian dealerships sold approximately 58,000 new and used vehicles and processed
approximately 654,000 service and collision repair orders in our 902 service bays.

U.S. Operations
AutoCanada's U.S. Operations segment, operating as Leader Automotive Group, currently operates 17 franchises
comprised of 12 brands, in Illinois, USA. Leader Automotive Group currently sells Chevrolet, Hyundai, Kia, Subaru, Audi,
Volkswagen, Mercedes-Benz, Toyota, Honda, Lincoln, Volvo and Porsche branded vehicles. In 2020, our U.S.
dealerships sold approximately 7,800 new and used vehicles and processed 102,000 service and collision repair
orders in our 196 service bays.

Page 4 • AutoCanada • 2021 Second Quarter Report

2021 Second Quarter Key Highlights and Recent
Developments
All comparisons presented below are between the three-month period ended June 30, 2021 and the three-month
period ended June 30, 2020, unless otherwise indicated.
AutoCanada Key Highlights
   AUTOCANADA REPORTS RECORD SECOND QUARTER RESULTS - NET INCOME OF $37.7 MILLION OUTPACES
      PRIOR YEAR BY 288% AND ADJUSTED EBITDA OF $70.5 MILLION AHEAD OF PRIOR YEAR BY 1,360%
    ●   Revenue was $1,281.1 million as compared to $727.4 million in the prior year, an increase of 76.1% and the
        highest second quarter revenue reported in the Company's history
    ●   Net income (loss) for the period was $37.7 million versus $(20.1) million in 2020
    ●   Adjusted EBITDA was $70.5 million versus $4.8 million in the prior year, an increase of 1,360%; pre-IFRS 16
        Adjusted EBITDA was $59.6 million versus $(5.4) million, an increase of 1,210%; on a trailing twelve month
        basis, pre-IFRS 16 Adjusted EBITDA was $176.4 million
    ●   Fully diluted earnings per share was $1.23, an increase of $1.95 from $(0.72) in the prior year
    ●   Net indebtedness of $21.6 million at the end of Q2 2021 compares to $72.6 million at the end of Q1 2021;
        trailing twelve month free cash flow of $159.9 million compares to $179.3 million in the prior year and net debt
        leverage on a pre-IFRS 16 basis improves to 0.1x from 0.7x at the end of Q1 2021
Executive Overview
The Company reported record-setting performance as revenue for the second quarter of 2021 reached $1,281.1 million
as compared to $727.4 million in Q2 2020, an increase of 76.1%. We continued to demonstrate strong growth across all
areas of the business, both in our Canadian and U.S. operations. In particular, the record Q2 2021 was driven by strong
performance of our used vehicle and finance and insurance ("F&I") business operations.
Net income (loss) for the period was $37.7 million, as compared to $(20.1) million in Q2 2020.
Adjusted EBITDA was $70.5 million in Q2 2021 as compared to $4.8 million reported in Q2 2020. In Q2 2020, the
impact of COVID-19 resulted in the recognition of a net charge to earnings of $(17.0) million comprised of CEWS
income of $26.2 million, offset by COVID-19 related inventory write-downs and operating provisions of $(38.8) million
in Canada and $(4.4) million in the U.S.
Captured within second quarter Adjusted EBITDA of $70.5 million are typically non-recurring government subsidies of
$1.6 million for Canada, and $1.3 million for the forgiveness of Paycheck Protection Program ("PPP") loans for the U.S.
Excluding these typically non-recurring items, normalized Adjusted EBITDA was $67.5 million for the quarter as
compared to a normalized $21.9 million in the prior year. On a normalized basis, Adjusted EBITDA margin was 5.3% as
compared to a normalized 2.4% in the prior year, an increase of 2.9 percentage points ("ppts").
Total gross profit increased by 123% to $217.8 million, propelled by the Company's continued focus on the used vehicle
market and strong F&I outperformance. Canadian used retail unit sales increased by 75.6% and U.S. used retail unit
sales increased by 159%, respectively, over the prior year; consolidated used retail unit sales of 13,271 exceeded the
7,228 reported in the prior year, an increase of 83.6%. Strong used retail sales resulted in our consolidated used to new
retail unit ratio improving to 1.31 from 0.96, and to 1.13 on a trailing twelve month ("TTM") basis, moving beyond the
targeted annual 1.0 ratio. Same store F&I gross profit per retail unit average increased to $2,942 per unit, an increase
of $305 per unit, the eleventh consecutive quarter of year-over-year growth.
In the U.S., Q2 2021 was a breakout quarter as the newly appointed management team drove a fundamental shift in the
operating and sales culture, while capitalizing on favourable market conditions. Significant strategic operational
changes, including establishing a dedicated used vehicle team and actively top-grading talent across all functional
areas, positioned the U.S. well for selling season and led to improved metrics on multiple fronts. Specifically, the U.S.
increased used retail unit sales to 1,797 from 693 in the prior year, an improvement of 159%, while reporting normalized
Adjusted EBITDA of $7.7 million in Q2 2021 against $0.9 million reported in Q2 2020.
Similar to Q1 2021, proactive inventory management for both new and used vehicles continued to be a key driver to the
Company’s success in delivering both strong revenue and margin growth across all our business operations in the
second quarter. Consolidated used vehicle gross profit margin increased by 6.0 percentage points ("ppts") to 8.0% as
compared to the prior year. Normalizing for the COVID-19 related used inventory write-down recognized in Q2 2020,
used vehicle gross profit margin increased to 8.0% as compared to 4.4% in Q2 2020.

                                                                      AutoCanada • 2021 Second Quarter Report • Page 5
Operating expenses as a percentage of gross profit decreased by (31.0) ppts to 71.0%, as compared to prior year.
Normalized operating expenses as a percentage of gross profit improved to 72.4% as compared to 87.2% in the prior
year, and is well below the five-year second quarter historical average of 87.0%. The Company's ability to control and
rationalize costs underscores the effectiveness of the actions taken during 2020 to streamline the Company’s cost
structure while optimizing operating leverage.
Net indebtedness improved by $(51.0) million from March 31, 2021 to $21.6 million. Free cash flow on a TTM basis was
$159.9 million at Q2 2021 as compared to $179.3 million in Q2 2020. Additionally, our net indebtedness leverage ratio
improved to 0.1x at the end of Q2 2021, as compared to 0.7x in Q1 2021.
The Company remains well-positioned to execute on its acquisition strategy in the coming quarters. We have
established a substantial transaction pipeline with a number of dealerships currently being evaluated. We currently
have $500 million in annual revenue under signed letters of intent ("LOI's") and purchase agreements. LOI's, subject to
due diligence, represent $200 million in annual revenue. Signed purchase agreements for dealerships located in
Ontario, subject to OEM approvals and other standard closing conditions, represent over $300 million in annual
revenue – inclusive of brands we do not currently operate today.
Our performance, both in Canada and U.S. Operations, continues our trend of sustainable improvement and
demonstrates the efficacy of our complete business model and strategic initiatives. However, we remain aware that
uncertainty continues to exist in the macroeconomic environment given the ongoing challenges associated with the
global pandemic. Uncertainties may include potential economic recessions or downturns, continued disruptions to the
global automotive manufacturing supply chain, and other general economic conditions resulting in reduced demand
for vehicle sales and service. We will continue to remain proactive and vigilant in assessing how COVID-19 may impact
our organization and remain committed to optimizing and building stability and resiliency into our business model to
ensure we are able to drive industry-leading performance regardless of changing market conditions.
Page 6 • AutoCanada • 2021 Second Quarter ReportConsolidated AutoCanada Highlights
RECORD SETTING SECOND QUARTER
As a result of the continued execution of our complete business model, along with the improvement in market outlook
and demand during Q2 2021, AutoCanada delivered a record setting second quarter.
For the three-month period ended June 30, 2021:
● Revenue was $1,281.1 million, an increase of $553.6 million or 76.1% and the highest second quarter revenue
reported in the Company's history
● Total vehicles sold were 23,953, an increase of 8,859 units or 58.7%
● Used retail vehicles sold increased by 6,043 or 83.6%
● Net income (loss) for the period was $37.7 million (or $1.33 per basic share) versus $(20.1) million (or $(0.72)
per basic share) in 2020
● Adjusted EBITDA increased by 1,360% to $70.5 million, an increase of $65.7 million
● Adjusting for COVID-19 related typically non-recurring items of $3.0 million in Q2 2021 and $(17.0)
million in Q2 2020, normalized Adjusted EBITDA was $67.5 million, ahead of prior year by $45.7
million; normalized pre-IFRS 16 Adjusted EBITDA was $56.6 million, as compared to $11.7 million
● Ending net indebtedness of $21.6 million reflected a decrease of $(51.0) million from Q1 2021, driven primarily
by the strength of our operating performance. Free cash flow on a TTM basis was $159.9 million at Q2 2021 as
compared to $179.3 million in Q2 2020.
Canadian Operations Highlights
RETAIL UNIT SALES GROWTH OF 47.4%
Our used vehicle and F&I segments were key drivers of improved earnings in Q2 2021. Normalizing for COVID-19
related inventory write-downs taken in Q2 2020, total gross profit percentage increased to 17.3% as compared to 15.8%
in the prior year and used vehicle gross profit percentage increased to 7.7% as compared to 3.8% in the prior year. For
the eleventh consecutive quarter of year-over-year growth, same store F&I gross profit per retail unit average
increased to $2,942, up 11.6% or $305 per unit from prior year.
Current period results include the acquisitions of Auto Bugatti collision center and Haldimand Motors which occurred
in Q4 2020 and PG Klassic Autobody collision center which occurred on April 1, 2021. Unless stated otherwise, all
results for acquired businesses are included in all Canadian references in the MD&A.
For the three-month period ended June 30, 2021:
● Revenue was $1,089.5 million, an increase of 66.0%; the highest second quarter Canadian revenue reported in
the Company's history and the first time Canadian revenue has exceeded $1 billion in a single quarter.
● Total retail vehicles sold were 19,237, an increase of 6,184 units or 47.4%
● Used retail unit sales increased by 4,939 or 75.6%
● Average trailing twelve month Canadian used retail unit sales per dealership per month, excluding
Haldimand Motors, reached 57, as compared to 42 in the prior year
● Used to new retail units ratio increased to 1.48 from 1.00
● Trailing twelve month ratio improved to 1.13 at Q2 2021 as compared to 0.88 at Q2 2020
● Finance and insurance gross profit per retail unit average increased to $2,858, up 8.0% or $212 per unit
● Net income for the period was $33.0 million, up $46.7 million from a net loss of $(13.7) million in 2020
● Adjusted EBITDA increased 637% to $61.5 million, an increase of $53.2 million
● Adjusting for COVID-19 related, typically non-recurring items, normalized Adjusted EBITDA decreases
to $59.9 million, ahead of prior year by $38.9 million; normalized pre-IFRS 16 Adjusted EBITDA was
$49.9 million, as compared to $11.8 million
● Normalized Canadian Adjusted EBITDA margin was 5.5% as compared to 3.2% in the prior year, an
increase of 2.3 ppts
AutoCanada • 2021 Second Quarter Report • Page 7U.S. Operations Highlights
RETAIL UNIT SALES GROWTH OF 143%
The U.S. management team transition that occurred in late Q1 2021 drove a fundamental shift in the operating and
sales culture of the dealerships. Strategic decisions executed throughout Q2 2021 resulted in a breakout quarter,
where, along with a 143% improvement in retail unit sales, total gross profit percentage set a second quarter record of
15.6%. Actions taken included the strategic build-up of used vehicle inventory, the creation of a dedicated used vehicle
team, top-grading dealership management, expanding team across all levels of the business, and the execution of
operational best practices.
Current period results include the acquisition of Autohaus of Peoria which occurred on October 29, 2020.
● Revenue was $191.6 million, an increase of 170%
● Retail unit sales increased to 4,141 units, up 2,440 units or 143%
● Net income (loss) for the period increased by $11.1 million to $4.7 million from $(6.4) million in 2020
● Adjusted EBITDA was $9.0 million, an increase of $12.5 million from 2020
● Adjusting for COVID-19 related typically non-recurring items, normalized Adjusted EBITDA increases to
$7.7 million, an increase of $6.7 million from prior year normalized Adjusted EBITDA of $0.9 million;
normalized pre-IFRS 16 Adjusted EBITDA was $6.7 million, as compared to $(0.1) million
Same Store Metrics - Canadian Operations
SAME STORE USED RETAIL UNIT SALES GROWTH OF 61.7%
Same store new and used retail unit sales increased by 40.5% to 18,362 units; new retail units increased by 19.1% and
used retail units increased by 61.7%. The continued optimization of the Company's complete business model is
highlighted by the year-over-year improvement in gross profit across every business segment which collectively
totaled $89.8 million, or 103%.
Same stores metrics include only Canadian dealerships which have been owned for at least two full years since
acquisition.
● Revenue increased to $971.2 million, an increase of 54.2%
● Gross profit increased by $89.8 million or 103%
● Used to new retail units ratio increased to 1.37 from 1.01
● New and used retail unit sales increased by 40.5% to 18,362 units
● Used retail unit sales increased by 61.7%, an increase of 4,046 units
● Finance and insurance gross profit per retail unit average increased to $2,942, up 11.6% or $305 per unit; gross
profit increased to $54.0 million as compared to $34.5 million in the prior year, an increase of $19.6 million or
56.8%
● Parts, service and collision repair gross profit increased to $56.8 million, an increase of 43.1%
● Parts, service and collision repair gross profit percentage increased to 55.5% as compared to 49.4% in
the prior year, an increase of 6.1 ppts, driven by various initiatives to improve margin retention
Financing and Investing Activities and Other Recent Developments
ACQUISITION PIPELINE SUPPORTED BY HEALTHY BALANCE SHEET AND LIQUIDITY STRUCTURE
Our focus has been and continues to be on preserving cash and managing liquidity. In the quarter, net indebtedness
decreased by $(51.0) million to $21.6 million, resulting in a net debt leverage of 0.1x.
The following occurred:
● Amended and extended our existing credit facility on April 14, 2021 for total aggregate bank facilities of $1.3
billion, with a maturity date of April 14, 2024, maintaining a three-year tenor to our facility.
● S&P Global Ratings (“S&P”) issued a research update on April 14, 2021 whereby it revised the Company’s
outlook to stable, raised the issuer credit rating to 'B', and raised the rating of the Company's senior unsecured
notes to 'B'.
● Issued an additional $125 million add-on on April 15, 2021 to our existing 8.75% senior unsecured notes, due
February 11, 2025. The add-on offering was completed at a premium to par, resulting in a yield of 5.595%.
● On August 9, 2021, the Company completed the acquisition of Mark Wilson's Better Used Cars, an independent
used vehicle dealership in Guelph, Ontario as part of the development of the Used Digital Retail Division.
Page 8 • AutoCanada • 2021 Second Quarter ReportBusiness Objectives and Strategy
Progress Update on Business Objectives and Strategy
Below is an update of the Company's progress to date on management's Go Forward Plan (July 2018). For a complete
description of the strategic plan and objectives, please see our Q4 2019 MD&A.
Strategic Initiative Q2 2021 Progress Update
Balance Sheet
• Net debt leverage of 0.1x at the end of Q2 2021.
We have established a target net debt leverage range of
between 2.5x and 3.0x. On a lease adjusted net debt • Lease adjusted net debt leverage ratio of 1.8x at the end of
Q2 2021.
leverage basis, we have set a target range of between 4.0x
and 4.5x. • Net indebtedness reduced from $90 million at December
31, 2020 to $21.6 million at the end of Q2 2021.
Finance and Insurance ("F&I")
• Same store F&I gross profit per retail unit increased to
A dedicated F&I team with an in-house F&I training program $2,942, up 11.6%; eleventh consecutive quarter of year-over-
to educate our dealership network on a standardized year growth.
product portfolio and sales process. • Same store F&I gross profit increased by 56.8% to $54.0
million as compared to $34.5 million in the prior year.
Service Bay Occupancy and Business Development Center ("BDC")
A call center dedicated to handle all service work
• Despite the impacts of the current challenging market, our
appointment booking for all Canadian dealership locations.
Canadian service bay occupancy has increased by
BDC is based in Saint John, New Brunswick with specifically
approximately 11 ppts when compared to the prior year.
trained personnel.
Project 50 (Used Retail Cars)
• Average TTM Canadian used retail unit sales per dealership
An initiative dedicated to increasing our used to new retail
per month, excluding Haldimand Motors, reached 57, as
unit ratio to an annual industry-leading ratio of 1.0 in compared to 42 in the prior year.
Canada by establishing disciplined protocols around used
• TTM Canadian used to new retail units ratio increased to 1.13
retail sale.
at Q2 2021 as compared to 0.88 at Q2 2020.
Special Finance (RightRide)
An extension of Project 50 with an emphasis on selling • Operating as an extension of existing dealership locations,
used vehicles. RightRide is a division dedicated to reaching we have increased presence to 7 operating locations as at
more credit-challenged customers by partnering with Q2 2021.
existing third party financing providers. The Company • Developing comprehensive training and operating manual
retains no credit risk. to support scalability.
Collision Centers
• 17 collision centers (including 2 stand-alone collision
A division to monitor and optimize our collision center centers) under one leadership team.
operations across Canada, by focusing on stand-alone • Acquisition of PG Klassic AutoBody, a collision center
collision centers in areas where we have multiple located in Prince George, British Columbia in Q2 2021.
dealerships, to create a "hub and spoke" model. • Acquisition of Auto Bugatti, a BMW MINI certified collision
center located in Montreal, Quebec in Q4 2020.
Cross-border Wholesale
A division allowing us to capture higher profit selling price
and margin opportunities by moving used vehicles from • We continue to action cross-border margin opportunities.
our Canadian dealership network cross-border to the U.S.
U.S. Operations
Focus from Q1 2019 through end of 2020 on addressing
cost structure and moving to breakeven; Beginning in 2021, • Normalized Adjusted EBITDA increased to $7.7 million for Q2
emphasis has shifted to driving sustainable profitability 2021, an increase of $6.7 million from $0.9 million in Q2
through further emphasis on the used retail vehicle 2020.
business.
AutoCanada • 2021 Second Quarter Report • Page 9Used Digital Retail Division
Overview
Our Used Digital Retail Division ("the Division") is expected to drive Canadian used vehicle sales across all channels,
including both standalone brick and mortar used dealerships as well as completely online, by creating a seamless
omni-channel buying experience for customers that supports their in-store and online requirements for used vehicles.
This includes the development of a national network of used vehicle dealerships through both organic development
and acquisitions such as Haldimand Motors Q4 2020 and Mark Wilson's Better Used Cars in Q3 2021, as well as an
online platform, and will represent Canada’s first national used vehicle platform.
The Used Digital Retail Division strategy is complementary to our existing complete business model and will:
● Allow for an attractive market entry with low capital intensity
● Drive meaningful improvement beyond the Company's existing 1.0 used to new retail unit ratio target in
Canada
● Drive incremental revenues in existing high margin business segments, including finance, insurance, and
parts, service and collision repair
● Attract consumers earlier in the car buying lifecycle and serve them across all channels as a preferred provider
● Leverage AutoCanada’s scale, domain expertise, and existing industry relationships across Canada
Our expected activities and capital investments to establish the Division in the short, medium, and long-term are as
follows:
For a complete description of the Division, please see our Q4 2020 MD&A for further details.
M&A Strategy
Our near-term business strategy is to continue to optimize our platform to produce strong and stable results in any
economic environment through our various units. We intend to utilize our platform to create tangible value through an
acquisition roll-up strategy.
The current industry is largely comprised of fragmented independently owned dealerships. According to DesRosiers
Automotive Consultants ("DesRosiers"), there were approximately 3,300 franchised dealerships across Canada in 2018,
and approximately 49% of these franchised dealerships are owned by either individuals/families or groups that own
fewer than five locations. Independently owned dealerships often have underdeveloped business units, providing us
with synergy opportunities. Therefore, we continue to see a large opportunity for the Company to acquire dealerships.
Leveraging the benefits of our success in building out a ‘complete’ business model, management is taking a
disciplined approach in moving forward with an acquisition strategy. We will continue to seek to optimize brand and
geographic diversification through acquisitions.
Acquisition opportunities are evaluated using an internal rate of return construct by comparing returns of potential
projects and acquisitions against internal hurdle rates. The internal hurdle rate is calculated as internal cost of capital
plus transaction-specific risk premiums and is impacted by a number of factors including the brand, size of dealership,
and geography. This internal framework provides the guideposts for the management team to consider, evaluate, and
compare various opportunities.
Page 10 • AutoCanada • 2021 Second Quarter ReportFurther, our M&A strategy will be supported by a strong and liquid balance sheet. As strong stewards of capital, we will
continue to be disciplined with our capital allocation and target a net debt leverage ratio range of between 2.5x and
3.0x post-acquisition.
We have established a significant transaction pipeline, with dealerships and collision centers representing over $500
million in annual revenue currently being evaluated, inclusive of brands we do not currently operate today. We are at
varying stages of the acquisition process with these targets, ranging from signed LOI's to signed purchase
agreements, with the potential deals remaining subject to due diligence, OEM approvals, and other standard closing
conditions.
AutoCanada • 2021 Second Quarter Report • Page 11Second Quarter Financial Information
The following table summarizes the Company’s performance for the quarter:
Three Months Ended June 30
Consolidated Operational Data 2021 2020 % Change
Revenue 1,281,055 727,447 76.1%
Gross profit 217,841 97,879 122.6%
Gross profit % 17.0% 13.5% 3.5%
Operating expenses 154,773 99,736 55.2%
Operating profit (loss) 66,153 (4,388) 1607.6%
Net income (loss) for the period 37,698 (20,052) 288.0%
Basic net income (loss) per share attributable to AutoCanada shareholders 1.33 (0.72) 284.7%
Diluted net income (loss) per share attributable to AutoCanada shareholders 1.23 (0.72) 270.8%
Adjusted EBITDA 1 70,491 4,828 1360.0%
New retail vehicles sold (units) 10,107 7,526 34.3%
New fleet vehicles sold (units) 575 340 69.1%
Total new vehicles sold (units) 10,682 7,866 35.8%
Used retail vehicles sold (units) 13,271 7,228 83.6%
Total vehicles sold 23,953 15,094 58.7%
Same store new retail vehicles sold (units) 7,763 6,518 19.1%
Same store new fleet vehicles sold (units) 575 337 70.6%
Same store used retail vehicles sold (units) 10,599 6,553 61.7%
Same store total vehicles sold 18,937 13,408 41.2%
Same store revenue 971,184 629,637 54.2%
Same store gross profit 177,439 87,613 102.5%
Same store gross profit % 18.3% 13.9% 4.4%
1 This financial measure has been calculated as described under Section 15, Non-GAAP Measures and should not be considered a
substitute or alternative for GAAP measures. This is not a defined term under IFRS and does not have a standard meaning, so may
not be a reliable way to compare us to other companies.
Page 12 • AutoCanada • 2021 Second Quarter Report3. MARKET AND OUTLOOK
The Canadian Vehicle Market
Total Canadian Vehicle Sales (Millions of Units)
28.2
5.1 5.1
4.8 5.0 4.9
17.1
4.3 4.3 4.3 4.4
4.5 4.5 4.5 4.5 4.6 4.5
3.8 3.8 3.9 3.9 4.0
3.6 3.6
00 01 02 03 04 05 06 07 08 09 10 11 12 13 14 15 16 17 18 19 20 21F
New Sales Used Sales Units in Operation
Source: DesRosiers Automotive Consultants
Based on market data provided by DesRosiers, a 2% Compound Annual Growth Rate ("CAGR") is noted for the period
from 2000 to 2019. Due to the impact of COVID-19, the overall Canadian market for vehicle sales has noted a CAGR
of 1% for the period from 2000 to 2020. In line with continued population growth, there is an anticipated continued
long-term growth in year-over-year vehicle sales. The above market data provided by DesRosiers further confirms
that consumers continue to buy more vehicles every year and supports our continued growth.
With the overall trend of increases in total vehicle sales, the Company's strategy to focus on increasing our used to
new retail unit ratio, and strengthen and stabilize our business model as a result, is very much tied to the broader
market outlook that Canadians continue to buy more vehicles, new or used, each and every year.
According to DesRosiers, Seasonally Adjusted Annual Rate ("SAAR") for March 2021 increased by 87% to 1.9 million
units as compared to 1.0 million units in March 2020. SAAR creates a base sales figure to allow for more meaningful
comparison between months converting the current monthly sales to take into account seasonality of the past ten
years. In addition, according to DesRosiers, the market forecast for Canadian light vehicles sales in 2021 is expected
to increase by 12.3% to 1.8 million light vehicles, as compared to the 1.6 million light vehicles sold in 2020. However,
actual sales may differ materially as there continues to be a high level of uncertainty regarding the near-term and
long-term impacts of COVID-19. In addition to the direct impacts of COVID-19 on our operations, there may be
disruptions to the global automotive manufacturing supply chain, resulting in limited access to inventory or other
impacts on general economic conditions resulting in reduced demand for vehicle sales and service. This includes
the current microchip inventory shortage that is impacting new vehicle inventory production. While AutoCanada
currently has ample levels of new vehicle inventory, prolonged shortages could result in lower new vehicle sales
volumes.
Regardless of the current market uncertainties, with our successful strategy to build up new and used inventory and
our comprehensive and complete business model, we are well situated to continue to manage and operate through
these uncertain times.
AutoCanada • 2021 Second Quarter Report • Page 13Performance vs. the Canadian New Vehicle Market
Based on market data provided by DesRosiers, the overall Canadian automotive new retail vehicle sector for the six-
month periods ended June 30, 2021 increased by 33.0%, compared to the prior year.
Continued Strong New Vehicle Performance - Same Store New Retail improved by 19.1%
For the quarter, same store new retail units increased by 19.1% and compares with an increase of 43.6% in the
Canadian new vehicle market for the brands represented by AutoCanada, as reported by DesRosiers.
Building on the Q2 2020 outperformance of the Canadian new vehicle market by 20.4% in the prior year, our current
quarter improvement year-over-year of 19.1% is a testament to our continued strong operations and growth. Refer to
Q2 2020 MD&A for further details of our strong outperformance of the market in Q2 2020. Prior to Q2 2021, the
Company had outperformed the Canadian new retail vehicle market for nine consecutive quarters.
Year to date, same store new retail units increased by 23.9% and compares with an increase of 29.0% in the
Canadian new vehicle market for the brands represented by AutoCanada, as reported by DesRosiers.
New Retail Units YoY % Growth - Market vs AutoCanada Same Store Sales
51.8%
43.6%
33.0%
29.0%
23.9%
19.1%
Total Market Market: Brand AutoCanada
Representation
by AutoCanada
Three Months Ended June 30 Six Months Ended June 30
Source: DesRosiers Automotive Consultants
Key contributing factors to our continued strong performance include the following:
● Dealerships remained open for business, where possible and within government guidelines
● Active management of the business using 10-day sprints to monitor the business on a real-time basis
● Development and consistent execution of AutoCanada best practices creating reliable and repeatable
performance
● Proactive inventory management of new and used vehicles to support sales
● By turning new vehicle sales volume and thereby earning increased OEM volume allocations, we
were able to "turn and earn" OEM allocations through ongoing market outperformance
● Ability and willingness to take on incremental allocations declined by competitor dealerships
● Time in position for the management team to drive operational excellence in all elements of our complete
business model
● Alignment of compensation structures with our OEM partners' balanced scorecard metrics
● Ability to retain and attract top sales talent driven by our sales outperformance and strong inventory
position across both new and used vehicle inventory
Page 14 • AutoCanada • 2021 Second Quarter Report4. RESULTS OF OPERATIONS
Second Quarter Operating Results
Same stores metrics include only Canadian dealerships which have been owned for at least two full years since
acquisition. In Q2 2020, the impact of COVID-19 resulted in the recognition of $26.2 million in Canada Emergency
Wage Subsidy ("CEWS") income, COVID-19 related inventory write-downs of $(20.9) million, and other provisions and
adjustments of $(22.4) million. Applicable details have been provided below; refer to the Q2 2020 MD&A for further
details.
Revenues
The following tables summarize revenue for the three-month periods and six-month periods ended June 30:
Three Months Ended June 30
2021 2020 Change Change
$ $ $ %
New vehicles 534,152 381,427 152,725 40.0%
Used vehicles 553,889 215,032 338,857 157.6%
Parts, service and collision repair 122,222 90,417 31,805 35.2%
Finance, insurance and other 70,792 40,571 30,221 74.5%
Total revenue 1,281,055 727,447 553,608 76.1%
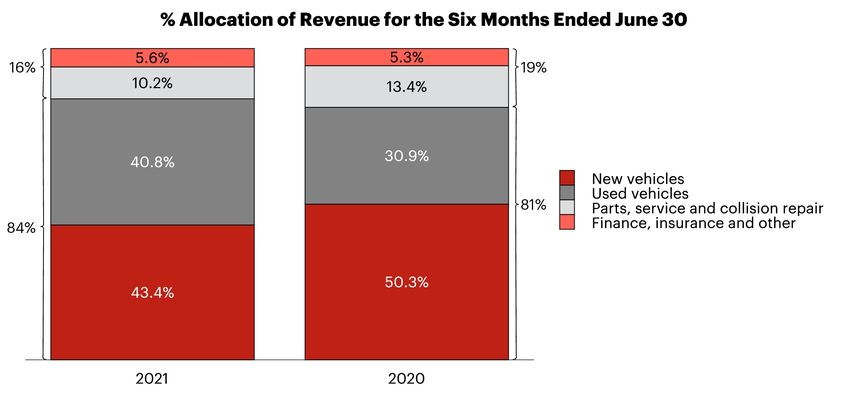
Six Months Ended June 30
2021 2020 Change Change
$ $ $ %
New vehicles 976,600 723,008 253,592 35.1%
Used vehicles 917,961 444,387 473,574 106.6%
Parts, service and collision repair 230,445 192,870 37,575 19.5%
Finance, insurance and other 125,873 76,008 49,865 65.6%
Total revenue 2,250,879 1,436,273 814,606 56.7%
AutoCanada • 2021 Second Quarter Report • Page 15Gross Profit
The following tables summarize gross profit for the three-month periods and six-month periods ended June 30:
Three Months Ended June 30
2021 2020 Change Change
$ $ $ %
New vehicles 40,821 10,634 30,187 283.9%
Used vehicles 44,410 4,224 40,186 951.4%
Parts, service and collision repair 68,614 45,836 22,778 49.7%
Finance, insurance and other 63,996 37,185 26,811 72.1%
Total gross profit 217,841 97,879 119,962 122.6%
Page 16 • AutoCanada • 2021 Second Quarter ReportSix Months Ended June 30
2021 2020 Change Change
$ $ $ %
New vehicles 74,409 34,901 39,508 113.2%
Used vehicles 68,586 14,397 54,189 376.4%
Parts, service and collision repair 126,941 95,805 31,136 32.5%
Finance, insurance and other 115,541 70,074 45,467 64.9%
Total gross profit 385,477 215,177 170,300 79.1%
Gross Profit Percentages
The following table summarizes gross profit percentages for the three-months ended June 30:
Three Months Ended June 30
Change
2021 2020
ppts
New vehicles 7.6% 2.8% 4.8
Used vehicles 8.0% 2.0% 6.0
Parts, service and collision repair 56.1% 50.7% 5.4
Finance, insurance and other 90.4% 91.7% (1.3)
Total gross profit % 17.0% 13.5% 3.5
For the three-months ended June 30, 2021, 15.2% of the Company's revenue generated from F&I and Parts, service
and collision repair ("PS&CR") contributed 60.9% of the Company's total gross profit. This relationship is driven by
the higher gross profit percentages of 90.4% and 56.1% respectively for F&I and PS&CR, compared to the lower
gross profit percentages for new and used vehicles.
As a result of the impact of COVID-19 in Q2 2020 and normalizing for the inventory write-down charges taken in the
prior year, 18.1% of the Company's revenue generated from F&I and PS&CR contributed to a total 72.3% of the
Company's normalized gross profits. The decrease noted from prior year is a result of the strength and profitability of
our used vehicle sales.
This relationship continues to be key to a stable and robust business model and supports management's key
initiatives to further develop our higher profit margin generating divisions.
AutoCanada • 2021 Second Quarter Report • Page 17Six Months Ended June 30
Change
2021 2020
ppts
New vehicles 7.6% 4.8% 2.8
Used vehicles 7.5% 3.2% 4.3
Parts, service and collision repair 55.1% 49.7% 5.4
Finance, insurance and other 91.8% 92.2% (0.4)
Total gross profit % 17.1% 15.0% 2.1
For the six-months ended June 30, 2021, 15.8% of the Company's revenue generated from F&I and Parts, service and
collision repair ("PS&CR") contributed 62.9% of the Company's total gross profit. This relationship is driven by the
higher gross profit percentages of 91.8% and 55.1% respectively for F&I and PS&CR, compared to the lower gross
profit percentages for new and used vehicles. This relationship is key to continue building a stable and robust
business model and supports management's key initiatives to further develop our higher profit margin generating
divisions.
New vehicles
For the three-month period ended June 30, 2021
Consolidated Operations
New vehicle revenue increased by 40.0% with new vehicle gross profit increasing by 283.9%. New vehicle gross
profit percentage increased to 7.6% as compared to 2.8% in the prior year.
Canadian Operations and Same Stores Results
New vehicle revenue increased by 31.3% and new vehicle gross profit percentage increased to 8.1% as compared
to 3.7% in the prior year.
Same store new vehicle revenue increase of 31.3% was largely driven by the increase in same store new vehicle
retail units to 7,763, an increase of 1,245 units or 19.1% compared to the prior year. In the three-months ended
June 30, 2020, same store new vehicle retail gross profit was reduced by a COVID-19 related inventory write-
down of $(8.6) million taken to adjust inventory cost base to market values. Normalizing for the inventory write-
down in the prior year, same store new vehicle gross profit percentage increased to 8.1% as compared to 6.2% in
the prior year.
We continue to prioritize our OEM relationships, which includes achieving sales unit targets, customer
satisfaction targets, and several other key measures as reflected within the various OEM balanced scorecards.
With our strong OEM relationships and market performance, we have sufficient new vehicle inventory to meet
expected sales demand.
Along with other strategies borne out to drive stability in the Company's complete business model, the Company
continues to experience strong growth.
U.S. Operations
New vehicle revenue increased by 108.4% and new vehicle gross profit increased by $6.7 million, an increase of
364.2%. In the three-months ended June 30, 2020, new vehicle retail gross profit was reduced by a COVID-19
related inventory write-down of $(2.6) million taken to adjust inventory cost base to market values. Normalizing
for the inventory write-down in the prior year, new vehicle gross profit percentage increased to 5.4% as
compared to 1.8% in the prior year.
These improvements are attributable to the management team transition which occurred in late Q1 2021 and the
resulting culture shift from one that focused on cost control to one that prioritizes growth, customer experience
and expanded operational scope. This shift in posture included actions taken to hire significantly more sales
team members and implementing rigorous training and processes to allow for the execution of best practices
which drive sales across all segments while providing a high level of service to customers. This shift has resulted
in an improvement OEM Customer Satisfaction Index ("CSI") performance, with select dealerships scoring a
perfect CSI for the month of July 2021.
In addition, the strong gross profit margin is partially attributed to the more pronounced market demand factors
within our U.S. Operations. Market demand factors were driven by both the constrained availability of new
inventory resulting from the closure of vehicle assembly plants at the onset of the pandemic, and the relaxation of
the more stringent lockdown restrictions imposed by the State of Illinois and the City of Chicago.
Comparisons to the prior year are impacted by the acquisition of Autohaus of Peoria on October 29, 2020.
Page 18 • AutoCanada • 2021 Second Quarter ReportFor the six-month period ended June 30, 2021
Consolidated Operations
New vehicle revenue increased by 35.1% and new vehicle gross profit increased by 113.2%. Gross profit per new
vehicle sold increased by $1,488 per unit.
Canadian Operations and Same Stores Results
New vehicle revenue increased by 30.2% and new vehicle gross profit increased by 83.5%.
Same stores new vehicle revenue increased by 30.2% and same stores new vehicle gross profit increased by
83.5%. Same store new vehicle gross profit percentage increased to 8.1% as compared to 5.7% in the prior year.
New retail units increased by 2,819 units, or 23.9%, with same stores seeing an increase in new retail units of
2,819, or 23.9%.
Key drivers to new vehicle sales and gross profit for the three-month period noted above also apply to year to
date performance.
U.S. Operations
New vehicle revenue increased by 71.7% and new vehicle gross profit increased by $9.0 million, an increase of
525.5%. New vehicle gross profit percentage increased to 5.0% as compared to (2.0)% in the prior year.
Key drivers to new vehicle sales and gross profit for the three-month period noted above also apply to year to
date performance.
Used vehicles
For the three-month period ended June 30, 2021
Consolidated Operations
Used vehicle revenue increased by 157.6%. Used vehicle gross profit increased by 951.4% and gross profit per
used vehicle sold increased by $2,762 per unit.
Canadian Operations and Same Stores Results
Used vehicle revenue increased by 138.5% and used vehicle gross profit increased by 1,186%. Used vehicle gross
profit percentage increased to 7.7% as compared to 1.4% in the prior year.
Same store used vehicle revenue increased by 110.4%. In the three-months ended June 30, 2020, same store
used vehicle gross profit was reduced by a COVID-19 related inventory write-down of $(4.6) million taken to
adjust inventory cost base to market values. Normalizing for this inventory write-down in the prior year, same
store used vehicle gross profit increased by 451.0% to $30.7 million, and same store used vehicle gross profit
percentage increased to 8.4% as compared to 3.2% in the prior year.
Increased demand for used vehicles was a key driver for the improvements in used vehicle gross profit and gross
profit percentage. Due to both the recent surge in demand for used cars and shortage of inventory, wholesale
and auction prices continued to remain at record highs. Insight into this trend is provided by the Canadian Black
Book Used Vehicle Retention Index ("CBBUVRI"), which monitors the health of the used wholesale vehicle market
and tracks the retained wholesale values for two to six-year-old vehicles in Canada. According to the CBBUVRI, in
June 2021, the index reached the tenth consecutive month with an all-time high at 125.1 points, an increase of
24.5% compared to prior year and an increase of 1.2% compared to May 2021.
With our Project 50 initiative and our strategic build up of used vehicle inventory through Q4 2020 and Q1 2021,
we were well positioned and able to meet the demand for used vehicles, as demonstrated by our same store used
retail vehicle unit sales increasing by 4,046 units to 10,599 units. We continue to prioritize retailing of used
vehicles, as opposed to wholesale or auctioning used vehicles. This ensures we are able to generate F&I and
PS&CR gross profit, as well as provide additional opportunities for AutoCanada to develop customer loyalty and
build customer retention.
Our focus on increasing used retail volume is reflected by the continued improvement in our same store used to
new retail unit ratio which increased to 1.37 for Q2 2021 as compared to 1.01 in the prior year. The TTM Canadian
used to new retail unit ratio for the year improved to 1.13 at Q2 2021 as compared to 0.88 at Q2 2020. According
to DesRosiers, our performance places us well ahead of our peers as historical Canadian market used to new retail
unit ratio was 0.49 in 2019 and 0.60 in 2020. Average TTM Canadian used retail units sold per month per
Canadian dealerships increased from 42 used retail units in the prior year to 57 used retail units in the current
year, excluding Haldimand Motors.
AutoCanada • 2021 Second Quarter Report • Page 19Continuing from our fourth quarter strategic decision to build up our used vehicle inventory supply, our used
vehicle inventory position increased to $309.8 million as at June 30, 2021 as compared to $114.9 million in the
prior year, an increase of $194.9 million or 169.7%. For the month of July 2021, the CBBUVRI showed indications of
a cooling off in wholesale pricing, as the index decreased to 124.7, a reduction of (0.3)% as compared to June
2021. Although wholesale pricing may be challenged to continue its trend of successive all-time highs, the market
remains robust and near all-time high levels. Management actively tracks and manages market trends in order to
maintain a competitive used vehicle inventory supply and strategically increased its wholesaling of targeted used
vehicles in late Q2 2021 to de-risk and optimize its used vehicle inventory portfolio. While it is anticipated that the
used market will remain strong relative to historical demand, Management will continue to monitor and analyze
the used vehicle market to ensure our used inventory portfolio is best suited to meet market demand.
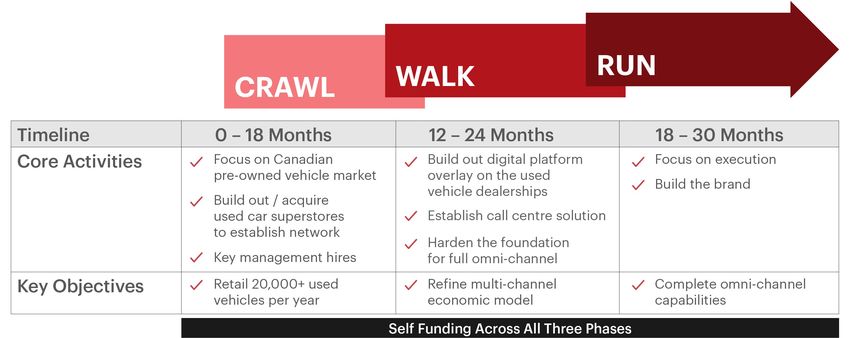
Used to New Retail Units Ratio
(Quarterly on a Same Store basis and TTM on a Canadian basis)
1.13
1.37
1.01
0.95 1.19
0.93
1.08
1.01
0.91
0.86 0.85
0.72
Q3 Q4 Q1 Q2
2019 2020 2021 2021 and 2020 TTM Canadian Used to New Retail Units Ratio
This trend of continuous improvement demonstrates the stability of the used retail market, our growing
competence as a used vehicle retailer, and ultimately supports our business objectives and strategy to develop a
complete business model.
Comparisons to the prior year are impacted by the acquisition of Haldimand Motors on December 1, 2020.
U.S. Operations
Used vehicle revenue increased by 413.0% and used vehicle gross profit increased by 469.5%. In the three-
months ended June 30, 2020, used vehicle gross profit was reduced by a COVID-19 related inventory write-down
of $(0.4) million taken to adjust inventory cost base to market values. Normalizing for the inventory write-down in
the prior year, used vehicle gross profit percentage decreased to 10.3% as compared to 11.8% in the prior year.
Due to strong market demand for used vehicles, there is a thinning of used inventory supply available.
Management prioritized the build up of used vehicle inventory to meet market demand to address the limited
inventory supply. This resulted in an increase in used retail vehicles sold by 1,104 units to 1,797 units as compared
to the prior year.
The unique market conditions in Q2 2020 and low number of 693 used vehicles sold resulted in exceptionally
strong used margin performance in that period. The current used vehicle gross profit percentage of 10.3% is a
result of both the market demand, and the transition to the new management team. In Q2 2021, a used vehicle
team was established to support the dealerships used retailing process, and also to focus on the strategic
accumulation of quality used vehicle inventory. As a result of management actions taken, our used vehicles sold
increased to 1,797, while generating a strong 10.3% used vehicle gross profit percentage.
The Mannheim Used Vehicle Value Index ("MUVVI") represents a seasonally adjusted measurement of used vehicle
prices. MUVVI decreased from a record high of 203.0 in May 2021, to 200.4 in June 2021, and to 196.9 for the first
15 days of July 2021. With the noted slow down of used vehicle prices in mind, management will continue to
actively monitor the used vehicle market conditions and ensure our used vehicle inventory is at an appropriate
level to meet market demand.
Comparisons to the prior year are impacted by the acquisition of Autohaus of Peoria on October 29, 2020.
Page 20 • AutoCanada • 2021 Second Quarter ReportFor the six-month period ended June 30, 2021
Consolidated Operations
Used vehicle revenue increased by 106.6% and used vehicle gross profit increased by 376.4%. Gross margin
increased by $1,926 per unit.
Canadian Operations and Same Stores Results
Used vehicle revenue increased by 99.8% and used vehicle gross profit increased by 390.9%. Used vehicle gross
profit percentage increased to 7.3% as compared to 3.0% in the prior year.
Same stores results for the six-month period ended June 30, 2021, saw used vehicle revenue increase by 69.3%,
while same stores used vehicle gross profit increased by 312.1%. Used vehicle gross profit percentage increased
to 7.7% as compared to 3.2% in the prior year.
Same stores used retail vehicle revenue increased by $237.7 million and used retail vehicle gross profit increased
by $30.0 million. Same stores used to new retail vehicles sold ratio increased to 1.28 from 1.04.
Key drivers to used vehicle sales and gross profit for the three-month period noted above also apply to year to
date performance. An additional driver for the reduction in used vehicle gross profit is a $2.3 million charge taken
in the three-months ended March 31, 2020 to eliminate all forward contract exposure associated with the cross-
border wholesale division.
U.S. Operations
Used vehicle revenue increase by 174.6% and used vehicle gross profit increased by 305.3%. Used vehicle gross
profit percentage increased to 8.9% as compared to 6.1% in the prior year.
Key drivers to used vehicle sales and gross profit for the three-month period noted above also apply to year to
date performance.
Parts, service and collision repair
For the three-month period ended June 30, 2021
Consolidated Operations
Parts, service and collision repair revenue increased by 35.2% and gross profit increased by 49.7%.
Canadian Operations and Same Stores Results
Parts, service and collision repair revenue increased by 33.6% and gross profit increased by 51.2%. PS&CR gross
profit percentage increased to 56.3% as compared to 49.7% in the prior year.
With the gradual relaxation of COVID-19 related restrictions in Q2 2021, according to Apple Maps Mobility Trends
Report using January 13, 2020 as a benchmark, driving mobility increased by an average of 35.5% in Q2 2021 as
compared to Q2 2020. This trend contributed to the gradual increase in routine maintenance transactions and
resulted in the noted increases in both revenue and gross profit. With the noted gradual recovery in kilometres
driven, service and collision repair orders increased by 21.7% and our service bay occupancy has increased by
approximately 11 ppts.
Same stores results saw PS&CR revenue increase by 27.4%. In the three-months ended June 30, 2020, same store
parts, service and collision repair gross profit was reduced by a COVID-19 inventory write-down of $(3.7) million
taken to adjust inventory cost base to market values. Normalizing for the inventory write-down in the prior year,
same store PS&CR gross profit percentage increased to 55.5% as compared to 54.1% in the prior year, and same
store gross profit increased by 30.8%. The increase in same store parts, service and collision repair gross profit
percentage is driven by the continued focus on improving and optimizing margin thresholds.
We continue to implement our BDC strategy, which involves leveraging the large database of our customer
information across our Canadian dealership network to centralize the service work appointment booking process.
Our BDC strategy has been implemented at all Canadian dealerships locations, and should be implemented at all
Canadian collision center locations by Q4 2021. In addition, this strategy will grow in scale and will be integrated
with our acquisition strategy. We have specially trained personnel to ensure consistent quality customer
interactions. Further optimization of our BDC strategy entails a number of elements including occupancy
tracking, technician recruitment, and call list development for vehicle recall and overdue maintenance follow up.
This strategy has allowed us to develop incremental and directed marketing initiatives, while focusing on
improving service retention, and will increase service bay occupancy rates over time.
Comparisons to the prior year are impacted by the acquisitions of Auto Bugatti collision center on October 6,
2020 and PG Klassic Autobody collision center on April 1, 2021.
AutoCanada • 2021 Second Quarter Report • Page 21Same Store Parts, Service & Collision Repair Gross Profit ($ Millions)
56.8
49.7 50.1 50.4
49.4
47.5
43.8
39.7
Q3 Q4 Q1 Q2
2019 2020 2021
Same Store Parts, Service & Collision Repair Gross Profit Percentage
55.8%
55.5%
54.6%
53.6%
51.6%
50.3%
49.4%
48.4%
Q3 Q4 Q1 Q2
2019 2020 2021
U.S. Operations
Parts, service and collision repair revenue increased by 47.6% and gross profit increased by 39.1%. Parts, service
and collision repair gross profit percentage decreased to 55.3% as compared to 58.7% in the prior year.
Similar to drivers noted in the Canadian operations, the gradual relaxation of lockdown restrictions resulted in an
overall increase in miles driven. According to the Federal Highway Administration of the U.S. Department of
Transportation, vehicle miles on all roads and streets increased by 40.1% as compared to the prior year for the
months of April and May 2021. Service and collision repair orders increased by 40.2% as compared to prior year
and contributed to the increases noted in both revenue and gross profit.
The reduction in gross profit percentage is attributable to a change in product mix as a result of the significant
increases noted in repair orders. Under the new U.S. management team, there is a renewed focus on expanding
the parts, service and collision repair teams at our U.S. dealerships to ensure we are able to accommodate
increased traffic while also implementing and executing on process improvements to maintain our strong gross
profit percentage performance.
Comparisons to the prior year are impacted by the acquisition of Autohaus of Peoria on October 29, 2020.
Page 22 • AutoCanada • 2021 Second Quarter ReportFor the six-month period ended June 30, 2021
Consolidated Operations
Parts, service and collision repair revenue increased by 19.5% and gross profit increased by 32.5%.
Canadian Operations and Same Stores Results
Parts, service and collision repair revenue increased by 18.9% and gross profit increased by 34.5%. Parts, service
and collision repair gross profit percentage increased to 55.3% as compared to 48.9% in the prior year.
Same stores results saw parts, service and collision repair revenue increase by 14.0%, while gross profit increased
by 28.4%. Same store gross profit percentage increased to 55.0% as compared to 48.9% in the prior year.
Key drivers to parts, service and collision repairs sales and gross profit for the three-month period noted above
also apply to year to date performance.
U.S. Operations
Parts, service and collision repair revenue and gross profit increased by 23.8% and 18.7% respectively. Parts,
service and collision repair gross profit percentage decreased to 53.4% as compared to 55.7% in the prior year.
Key drivers to parts, service and collision repairs sales and gross profit for the three-month period noted above
also apply to year to date performance.
Finance, insurance and other
Finance and insurance products are sold with both new and used retail vehicles.
For the three-month period ended June 30, 2021
Consolidated Operations
Finance, insurance and other revenue increased by 74.5% and gross profit increased by 72.1%. Gross profit per
vehicle increased by $217 per unit.
Canadian Operations and Same Stores Results
Finance, insurance and other revenue increased by 61.4% and gross profit increased by 59.2%. Gross profit
percentage decreased to 90.1% as compared to 91.4% in the prior year.
Same stores results saw finance, insurance and other revenue increase by 59.2% and gross profit increased by
56.8% to $54.0 million. Same store finance, insurance and other gross profit percentage remained strong at
89.9% as compared to 91.3% in the prior year. Gross profit per retail unit average increased to $2,942, up 11.6% or
$305 per retail unit, as compared to $2,637 in the prior year. Gross profit increased due to both the
improvements on a per retail unit basis along with the increase of 5,291 retail units to total same store retail units
of 18,362.
The $305 per retail unit increase in same store gross profit per unit is attributed to the strong foundation our F&I
initiative has built and the continued optimization of our in-house training program. The training program
leverages available data and focuses on educating our finance managers to both better understand our product
portfolio to cater to customer preferences and to better provide added value to customers throughout the sale
process. Improving our insight into customers' product preferences allows us to provide value generating
products for our customers to increase value add products per deal and ultimately improve customer retention.
The improvements noted have been consistently applied across all locations and brands and support the
sustainability of our current performance.
F&I continues to have the highest gross profit retention in the Company. We are constantly optimizing the various
inputs and value added product menu, with an emphasis to drive consistent improvements in our F&I
performance.
AutoCanada • 2021 Second Quarter Report • Page 23You can also read