January-March 2020 1Q20 - BBVA.com
←
→
Page content transcription
If your browser does not render page correctly, please read the page content below

January-March 2020 1Q20
#IStayAtHome

            In face of COVID-19, banks “are part of the solution”

                               In BBVA we have stepped up and made a difference:

                      We live our values and                                                        We rely on committed
                      we help society                                                               employees with strong values

                                                                                Working remotely                                    Working remotely

                              €35m                                                                             Number
                                                                                                            of employees
         Donation for the fight against COVID-19                                      95%                                                  71%
                                                                                                            126,041
                                                                                 central services                                    branch network

                                                                                             We are a strong bank. We have the best team

  Medical                   Direct aid to                  Scientific
 equipment                    NGO´s                        research

                                                                                          Customer            We think             We are
                                                                                          comes first           big               one team

                               SOCIETY                                                                      EMPLOYEES

                      We  helpun
                               our  customers                                                   We address the challenges faced
                       Somos      sólo equipo in their                                          by banks with a sound capital and
                      lives and in their businesses
                                                                                                liquidity position

     59%                         54%                         63%
   (% penetration)             (% penetration)             (% penetration)
                                                                                                                                  CET1
                                                                                       LCR / NSFR
                                                                                                                              fully-loaded
 Digital customer          Mobile customers               Digital sales

                                                                                  134% / 120%                                  10.84%
       We adapt to the needs of our customers and help them make
  financial transactions through remote channels, maintaining the minimum
            services with approximately 54% of our branches open

                             CUSTOMERS                                                                   SHAREHOLDERS

The health and well being of all is the first and foremost priority

                                                            BBVA, Creating Opportunities
Contents
BBVA Group highlights                                 2

Relevant events                                       3

Group information                                     6

  Macro and industry trends                            6

  Results                                              9

  Balance sheet and business activity                 14

  Solvency                                            16

  Risk management                                     19

  Responsible banking                                 24

Business areas                                        25

  Spain                                               28

  The United States                                   31

  Mexico                                              34

  Turkey                                              37

  South America                                       40

  Rest of Eurasia                                     44

  Corporate Center                                    46

  Other information: Corporate & Investment Banking   48
2
BBVA Group highlights
BBVA GROUP HIGHLIGHTS (CONSOLIDATED FIGURES)
31-03-20 ∆% 31-03-19 31-12-19
Balance sheet (millions of euros)
Total assets 730,923 5.7 691,200 698,690
Loans and advances to customers (gross) 395,911 0.7 393,321 394,763
Deposits from customers 385,050 1.7 378,527 384,219
Total customer funds 481,488 (0.0) 481,717 492,022
Total equity 49,174 (8.2) 53,547 54,925
Income statement (millions of euros)
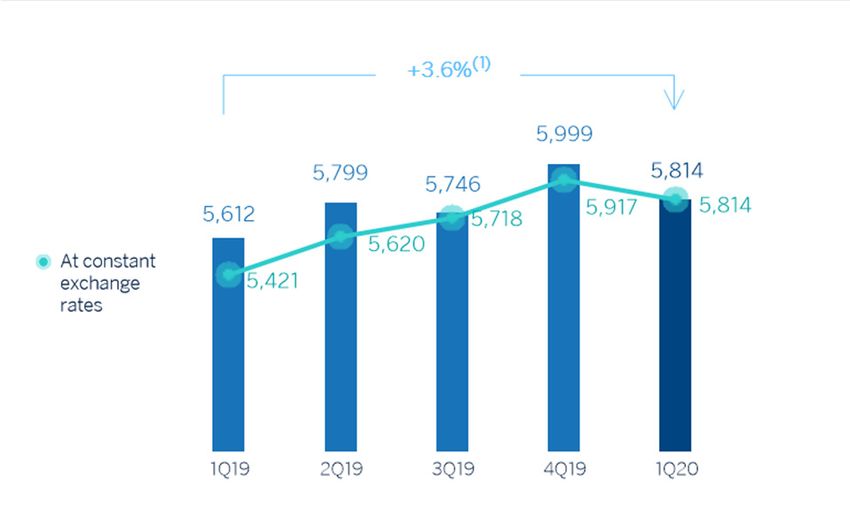
Net interest income 4,556 3.6 4,398 18,124
Gross income 6,484 7.2 6,046 24,463
Operating income 3,566 14.1 3,124 12,561
Net attributable profit (1,792) n.s. 1,182 3,512
Adjusted net attributable profit (1) 292 (75.3) 1,182 4,830
The BBVA share and share performance ratios
Number of shares (million) 6,668 - 6,668 6,668
Share price (euros) 2.92 (42.8) 5.09 4.98
Earning per share (euros) (2) (0.29) n.s. 0.16 0.47
Adjusted earning per share (euros) (1) (2) 0.03 (83.4) 0.16 0.66
Book value per share (euros) 6.49 (9.9) 7.20 7.32
Tangible book value per share (euros) 5.78 (2.7) 5.94 6.27
Market capitalization (millions of euros) 19,440 (42.8) 33,960 33,226
Yield (dividend/price; %) (3) 8.9 4.9 5.2
Significant ratios (%)
ROE (net attributable profit/average shareholders' funds +/- average
2.4 10.0 9.9
accumulated other comprehensive income) (1)
ROTE (net attributable profit/average shareholders' funds excluding average
2.8 12.1 11.9
intangible assets +/- average accumulated other comprehensive income) (1)
ROA (Profit or loss for the year/average total assets) (1) 0.26 0.85 0.82
RORWA (Profit or loss for the year/average risk-weighted assets - RWA) (1) 0.50 1.62 1.57
Efficiency ratio 45.0 48.3 48.7
Cost of risk 2.57 1.03 1.02
NPL ratio 3.6 3.9 3.8
NPL coverage ratio 86 74 77
Capital adequacy ratios (%)
CET1 fully-loaded (4) 10.84 11.35 11.74
CET1 phased-in (5) 11.08 11.58 11.98
Total ratio phased-in (5) 15.39 15.19 15.92
Other information
Number of clients (million) 78.5 3.8 75.6 77.9
Number of shareholders 876,785 (1.7) 892,316 874,148
Number of employees 126,041 0.2 125,749 126,973
Number of branches 7,694 (1.9) 7,844 7,744
Number of ATMs 32,275 (0.8) 32,528 32,658
General note: as a result of the decision taken by the International Financial Reporting Standards Interpretations Committee (IFRIC) regarding the collecting of interests of written-off
financial assets for the purpose of IFRS 9, those collections are presented as reduction of the credit allowances and not as a higher interest income, recognition method applied until
December 2019. Therefore, and in order to make the information comparable, the quarterly information of the 2019 income statements has been restated.
(1) Excluding the goodwill impairment in the United States as of 31-03-2020 and 31-12-2019, for an amount of 2,084 and 1,318 millions of euros, respectively.
(2) Adjusted by additional Tier 1 instrument remuneration.
(3) Calculated by dividing shareholder remuneration over the last twelve months by the closing price of the period.
(4) As of March 31, 2020 the fully-loaded capital ratios include the positive impact of +2 basis points due the reduction of the limit of share buybacks which is pending to be approved
by the ECB.
(5) Phased-in ratios include the temporary treatment on the impact of IFRS 9, calculated in accordance with Article 473 bis of the Capital Requirements Regulation (CRR).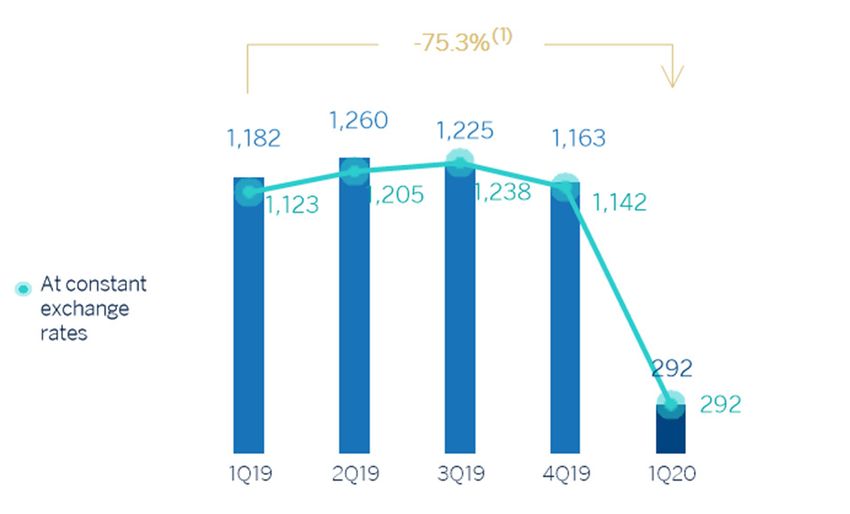
3
Relevant events
Results
Good performance of gross income, with year-on-year growth in all its components: recurring income (net
interest income and fees and commissions), which grew in most geographical areas, net trading income (NTI),
and the other operating income and expenses line.
Operating expenses closed in line with the same quarter of the previous year.
As a result of the above, the efficiency ratio improved.
Impairment on financial assets increased mainly due to the deterioration of the macroeconomic scenario
resulting mostly from the impacts of COVID-19, which have amounted to €-1,433m at the Group level.
As a result of the valuation of the goodwill of its subsidiaries, the Group has estimated that there is an impairment
in the United States which has been recorded in the line item “Other results” of the Consolidated income
statement as of March 31, 2020. This impairment represents an impact of €-2,084m in the net attributable profit
and is mainly due to the negative impact of the update of the macroeconomic scenario affected by the COVID-19
pandemic. This impact does not affect the tangible net equity, the capital, or the liquidity of BBVA Group and is
included in the line item other gains (losses) of the income statement of the Corporate Center.
Finally, the net attributable loss stood at €-1,792m. If the goodwill impairment in the United States is excluded
from the year-on-year comparison, the Group's net attributable profit decreased 75.3% compared to the first
quarter of 2019 and stood at €292m.
NET ATTRIBUTABLE PROFIT
(MILLIONS OF EUROS)
(1) Excluding the goodwill impairment in the United States.
Balance sheet and business activity
The figure for loans and advances to customers (gross) remained stable compared to December 2019 (up
0.3%), with increases in the commercial portfolio which offsets the deleveraging in the rest of the portfolios.
Customer funds fell in the quarter (down 2.1%) as a result of the negative impact on mutual and pension funds
due to the market instability caused by COVID-19.
Liquidity
The availability of ample liquidity buffers in each of the geographical areas in which the BBVA Group operates and
their management have allowed internal and regulatory ratios to remain comfortably above the minimum levels
required.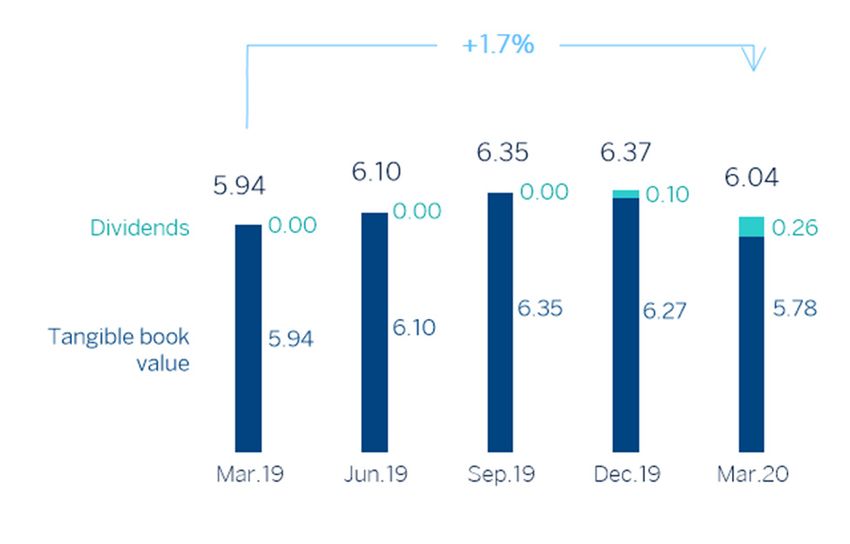
4
Solvency
• The BBVA Group has set the objective to maintain a buffer on its CET1 capital ratio requirement (currently, at
8.59%) between 225 and 275 basis points. As of March 31, 2020, the CET1 fully-loaded ratio stood at 10.84%.
CAPITAL AND LEVERAGE RATIOS AND COST OF
RISK (PERCENTAGE AS OF 31-03-20)
Risk management
The calculation of the expected credit losses at the end of March includes the update of the forward looking
information in the models under IFRS 9 in order to reflect the circumstances created by the COVID-19 pandemic
in the macroeconomic environment, which is characterized by a high degree of uncertainty regarding its intensity
and duration.
NPL AND NPL COVERAGE RATIOS AND COST OF
RISK (PERCENTAGE)
Dividend
On April 9, a cash payment was made for the supplementary dividend for the 2019 financial year for a gross
amount of €0.16 per share, in line with that approved at the General Shareholders’ Meeting held on March 13.
Thus, the total dividend for the 2019 financial year amounts to €0.26 gross per share.
Bancassurance agreement
On April 27, 2020, BBVA reached an agreement with Allianz, Compañía de Seguros y Reaseguros, S.A. in order
to create a bancassurance partnership, for the purpose of developing the non-life insurance business in Spain,
excluding the health insurance line, by establishing a newly-incorporated insurance company. On the closing date
of the transaction, BBVA Seguros will transfer 50% plus one share of this new company to Allianz for an initial
fixed price of approximately €277m, which will be adjusted based on the variation in the company’s shareholders
equity between signing and closing date. Excluding a variable part of the price (up to €100m related to achieving
specific business goals and certain milestones), it is estimated that the transaction will generate a profit net of
taxes amounting to approximately €300m, and that the positive impact on the fully-loaded CET1 capital ratio of
the BBVA Group will be approximately 7 basis points. The closing of the transaction is subject to obtaining the
required regulatory authorizations.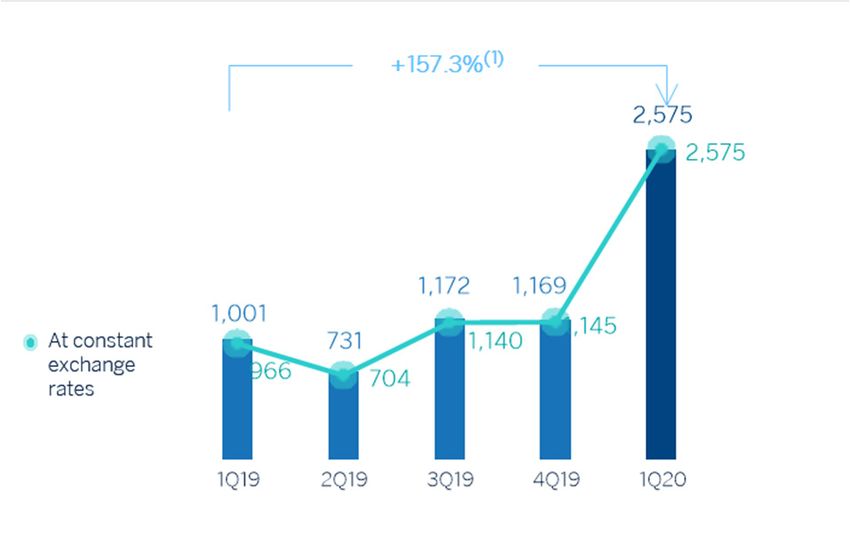
5
Security, business continuity and support measures taken by BBVA
In response to the COVID-19 pandemic, BBVA has focused on guaranteeing the security and the continuity of the business
operations as a priority, and on closely monitoring the impact on the Group’s business and risks. Additionally, BBVA
adopted from the outset a number of measures to support its main stakeholders, acting with the utmost responsibility and
taking a step forward. The main business continuity measures taken are:
In order to serve customers, and since financial services are legally considered an essential service in most of the
countries where the Group operates, the branch network remains operational, with dynamic management of
the network and with information about branches and opening times on the website. In addition, customers are
using the digital channels and their remote agents as the recommended option. BBVA is therefore trying to
minimize the number of employees who need to provide services at the branches, trying to limit the risk of
contagion as much as possible and protecting the health of its employees, customers and society in general.
DIGITAL AND MOBILE CUSTOMERS (MILLIONS)
With employees, the measures established by the health authorities have been implemented, including taking an
early stance on promoting working from home. At the beginning of April 2020, the proportion of the Group’s
employees working remotely stood at 95% for central service employees and 71% for the branch network.
Other support and responsibility measures taken are the following:
The banks are a key part of the solution to the COVID-19 crisis. Specifically, BBVA has activated support
initiatives with a focus on the most affected customers, regardless of whether they are companies, SMEs, self-
employed workers or private individuals. The following are just some of those initiatives:
o In Spain, credit facilities for SMEs and self-employed workers of up to €25,000m, deferment of
mortgage loan repayments for individuals and self-employed workers, and early payment of pensions,
with free cash withdrawals for pensioners at the nearest ATM;
o In the United States, flexibility in the repayment of loans for small businesses and for consumer finance,
and the removal of certain fees for individual customers;
o In Mexico, a repayment deferment of up to four months on various credit products, fixed payment plan
to reduce monthly credit card charges and interruption of Point of Sale (POS) fees to support retailers
with lower turnover;
o In Turkey, delay of loan repayments, penalty-free interest and repayments for individual customers, and
deferment for up to six months of loan capital repayments for companies;
o In South America, some countries such as Argentina have provided a credit facility for micro-SMEs to
help them purchase remote work equipment; Colombia has frozen repayments for up to six months on
loans to individuals and companies, and is offering a special working capital facility for companies; and
in Peru, a loan facility has been approved to support SMEs.
To support society in its fight against the COVID-19 pandemic, BBVA is committed to making a global donation
of €35m to support the health authorities and social organizations and to promote scientific research.
Pronouncements of regulatory bodies and supervisors
With the aim of mitigating the impact of COVID-19, various European and international bodies have made
pronouncements aimed at allowing greater flexibility in the implementation of the accounting and prudential
frameworks. The BBVA Group has taken these pronouncements into consideration when preparing this report.
With regard to the payment of dividends, on March 27 the European Central Bank recommended that credit
institutions should refrain from distributing dividends or making irrevocable commitments to distribute them, and
from repurchasing shares to remunerate shareholders, until October 1, 2020 at the earliest. Consequently, the
Board of Directors of BBVA has agreed to modify, for the financial year 2020, the Group’s shareholder
remuneration policy, which was announced through the Relevant Event notification of February 1, 2017,
establishing a new policy for 2020 of not making any dividend payment for the 2020 financial year until the
uncertainties caused by COVID-19 are resolved and, in any case, not before the end of the financial year.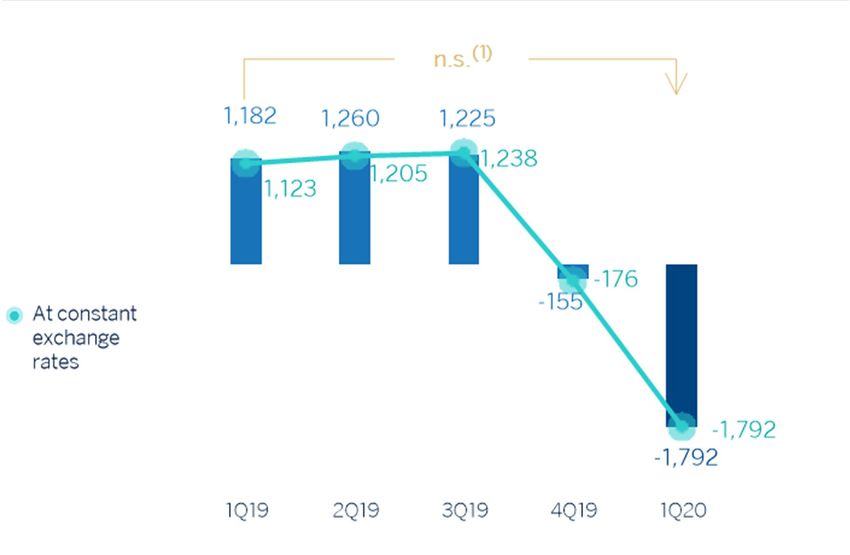
6

Group information
Macro and industry trends
Global growth slowed throughout 2019 to 3.0%, down from 3.7% in 2018. However, this more stable environment,
supported by the counter-cyclical economic policies announced last year and the reduction in trade tensions, has changed
since March 2020 as a result of the COVID-19 pandemic. To contain this health crisis, most countries have put in place
strong social distancing measures. At the time of publication of this report, it is unclear how long these will last for and how
quickly they will be relaxed. However, they will undoubtedly have a severe impact on activity through the supply, demand
and financial channels, despite the economic stimulus measures announced.

Therefore, a severe global recession seems inevitable in 2020, although the level of uncertainty on around the forecasts
is very high. BBVA Research's baseline scenario works on the assumption that the confinement measures will generally
last for about six weeks, and that they will be relaxed slowly to prevent new waves of infections. This will result in a sharp
contraction in activity in the first half of 2020 and a rebound in the third quarter, but which will not be sufficient to
compensate for the previous decline. The economic policy measures should prevent a deeper recession and support a
partial recovery in 2021. However, the forecast is that the global GDP will shrink by about 2.5% in 2020, and that it will
rebound to about 5% in 2021, although the risks for these forecasts are on the downside.

In terms of economic policy, the stimuli in the major economies have generally been large and have been adopted
relatively quickly. In the United States, a significant fiscal package of about 12% of the GDP has been announced to cover
health expenditures and mitigate the effects of rising unemployment through financial support to households and
businesses. The Federal Reserve (hereafter the Fed), for its part, has cut interest rates by a total of 150 basis points in
March to around 0%-0.25%, relaunched its program of quantitative easing, and put in place credit and liquidity facilities
(up to USD 2.3 trillion, which represents 11% of the GDP).

In Europe, the member states of the European Union (EU) are implementing support packages aimed at guaranteeing
credit for businesses, along with discretionary fiscal stimuli as a supplement to the automatic stabilizers. Despite
differences between countries, at an aggregate level the fiscal stimulus would account for about 2% of the EU’s GDP, and
the liquidity facilities would account for 15%. These national measures are supplemented by the approval of a
supranational emergency package of about 4% of the GDP to cover healthcare costs, implement a framework to support
employment and increase the funds available from the European Investment Bank to support funding for companies. For
its part, the European Central Bank (hereafter the ECB) will make purchases of assets for the value of €1,050 billion (8%
of the GDP) until the end of 2020, after approving a new extraordinary program (Pandemic Emergency Purchase
Programme or PEPP) of €750 billion and increasing the Expanded Asset Purchase Programme (APP) by €120 billion,
which is in addition to the monthly purchases of €20 billion. Moreover, the European monetary authority has adopted
temporary measures to support the liquidity of the banks, especially by relaxing the requirements for the collateral
accepted in their transactions, and has acted in a coordinated manner with the Fed for the supply of US dollars.

In this context, interest rates will remain low in the major economies for a longer time than previously anticipated, while
many emerging countries have recently cut interest rates to mitigate the effects of the pandemic.

As for the banking system, in an environment where much of the economic activity is paralyzed, banking services are of
fundamental importance for three reasons: first, families and businesses need to make payments and authorize charges
to maintain activity; second, a new loan or the renewal of a maturing loan can help families and businesses manage the
shock to their income. In the current situation, it is very important to ensure that the temporary liquidity problems faced
by companies do not become solvency problems, thus jeopardizing their survival and the jobs they create. To this end, the
support provided by banks and public guarantees is essential. Third, banking has become the only source of financing for
most companies in light of the turbulence on the financial markets.

While in profitability terms the European and Spanish banks are still far from the levels seen before the financial crisis, due
mainly to the low interest rate environment we have been experiencing for some time now, the financial institutions are
facing this challenge from a position of financial strength since their solvency has been constantly improving since the
2008 financial crisis, with increased capital and liquidity buffers and therefore a greater capacity to lend.

Spain
In terms of growth, the most recent activity-level data, along with the deterioration of the labor market, indicate that the
emergence of the pandemic earlier this year has suspended the signs of stabilization that had led to its GDP growth in 2019,
of about 0.4% quarterly, which was above the growth rates in the rest of the Eurozone. To face this situation, the
government launched various support measures amongst which the program of credits with public guarantees, the
employment protection and the deferment repayment for the most vulnerable ones stand out. The hibernation of the
economy following the strong confinement measures adopted in mid-March will result in a sharp reduction in the capacity
being utilized by the economy and a fall in demand in the first half of the year. This will be reflected in a fall in the GDP of

7
around 8% in 2020, according to BBVA Research estimates. However, a gradual recovery of the economy is expected in
the second half of 2020 following the lifting of the confinement, although some sectors and demand segments, such as
construction and tourism, may be affected for a longer time. In 2021, the economy is expected to only recover partially
growing at a rate of slightly below 5.7%. The uncertainty surrounding the forecasts is high and depends mainly on the
evolution of the pandemic, the duration and intensity of the isolation measures, and the effect of the extraordinary
economic policy measures being taken.

The United States
The COVID-19 outbreak has created a combination of supply and demand shocks that, although transitional, were already
having a significant economic impact at the end of the first quarter, with a sharp reduction in utilized capacity and an
unprecedented increase in people applying for unemployment benefits. According to BBVA Research forecasts, the GDP
will fall by about 4.4% in 2020, before seeing an increase of around 3.4% in 2021. The risks for this scenario are on the
downside. Uncertainty about the economy over the coming quarters is very high due to the ongoing scarcity of data, the
volatility of the financial markets and the possible effect of the unprecedented economic policy measures adopted, both
fiscal and monetary. In this regard, we expect the Fed to hold rates at 0% at least until the end of 2021 and remain prepared
to take further action if necessary, while it is also possible that a new infrastructure spending tax package will be approved.

Mexico
The latest figures suggest that activity continued to stagnate in the first months of 2020, although the fall in industrial
production and investment points to a gloomier scenario, especially because, in the face of the pandemic, there is not
enough fiscal space for economic policy measures to compensate for the negative effects on the economy. In this context
of a sharp moderation in demand, inflation has unexpectedly declined to 3.3% in March, and a greater reduction is
forecasted for the remainder of the year. On March 20 and April 21, 2020, Banxico cut the benchmark interest rate for a
total of 100 basis points, to 6.0%, and is likely to continue making cuts, causing it to fall below 5% by the end of the year.
In addition, Banxico announced an unprecedented program of measures to promote a controlled behavior of the financial
markets, strengthen the channels for granting credits and provide liquidity for the development of the financial system.
The measures announced for the moment amount to 3.3% of the GDP. Likewise, the Mexican banks have offered
deferments of payments up to four months and payment facilities to allow clients to cope with their obligations. There is
great uncertainty about the evolution of the economy in the coming months, but the Mexican economy could be one of the
most affected in the region because of its close relationship with the United States economy, in addition to the adverse
effects related to internal uncertainty, the lack of fiscal stimuli seen so far and weak oil prices. In this context, rating
agencies have revised Mexico’s long-term sovereign rating in foreign currency. Namely, Fitch announced on April 15th a
downgrade from “BBB” to “BBB-“, maintaining a stable Outlook and Moody’s did the same on April 17th by revising it down
from “Baa3” to “Ba2”. According to BBVA Research estimates, the GDP could fall by about 7% in 2020.

Turkey
After the strong recovery in activity in the second half of 2019, growth was showing some signs of moderation at the end
of the first quarter of 2020, with a reduction in confidence and utilized capacity. In the face of the COVID-19 outbreak, the
Turkish government has taken partial confinement measures and announced a program of fiscal measures equivalent to
1.5% of the GDP to fight the effects of the pandemic. The main measures that stand out include the increase in the
minimum pension and financial support for the worst affected households, the protection of employment through
providing more flexibility in the rules on short-term labor subsidies and the postponement of the payment of taxes in
certain industries. The central bank has cut the reference rate in several monetary policy meetings, in the latest reducing
it by 100 basis points to 8.75% from 12% at the end of 2019, all of this in addition to the measures announced to provide
liquidity through long-term instruments and discount rates. BBVA Research forecasts that the reference rate will reduce
to 8% as from May, given the perspective regarding inflation, which could stand at 7.5% at the end of the year according
to the latest forecasts. Public banks have granted a three-month deferment in the repayment of bank loans to companies
affected by the crisis. According to BBVA Research forecasts, the economy could stagnate in 2020 before returning to
more robust growth of around 5% in 2021.

Argentina
The recession seen in the Argentine economy since the middle of last year has been exacerbated in early 2020 by the
negative impact on economic growth due to the confinement measures put in place in order to contain the health crisis
caused by the COVID-19. To offset the negative impact, the government has announced a series of fiscal measures of about
2.8% of the GDP. This will have a direct cost to the Treasury of at least 1.6% of the GDP, as the rest will be financed through
the banking system. It has also imposed the postponement of all capital and interest payments in accordance with local
legislation until the end of the year, while debt obligations to other public bodies will be automatically extended with new
bond issues. According to BBVA Research forecasts, the GDP could contract by about 6% in 2020 and will grow by around
1.5% in 2021, although there is still a great deal of uncertainty.
8
Colombia
After the good performance of 3.3% growth in 2019, up from 2.5% in 2018, the figures available early in the year were
already showing certain moderation and they have deteriorated sharply since mid-March because of the impact of the
pandemic and the fall in oil prices. In addition to the mandatory confinement, a number of measures have been taken to
counter the effects of the pandemic. With regard to monetary policy, the central bank has cut the interest rate by 50 basis
points to 3.75% and adopted measures to inject liquidity, amongst them, the one destined to provide US dollars with the
help of the facility maintained with the Fed (FIMA Repo Facility). However, the BBVA Research scenario foresees a fall in
the GDP of around 3% in 2020 and a strong recovery in 2021 (4%). In return, the announced economic measures and low
oil prices will result in a weakening of the public finances. This has led Fitch to revise the rating for government debt down
to “BBB-”, with a negative outlook, which could increase the pressure to obtain external financing.

Peru
Following the slowdown in the economy in 2019 (2.2% after 4% in 2018), the rebound in growth in January (3% year-on-
year) was cut short as a result of the COVID-19 epidemic. Containment measures have been adopted to tackle this. The
government has announced a comprehensive package of measures of up to 12% of the GDP that will be used to finance
pandemic-related expenditures, support the labor market and guarantee loans, as well as to underpin the recovery once
the health crisis has been overcome. Among these measures, the creation of a universal family allowances, from which a
total of 6.8 million families (75% of the total) will benefit, and a new tax on the highest incomes has been announced to try
to mitigate the negative effects of COVID-19. In this context, and with the inflation located within the target range (1.8% in
March), the central bank reduced interest rates by 200 basis points between March and April to 0.25%, while it has
reinforced the message that it is prepared to provide greater monetary stimuli if necessary. However, BBVA Research
forecasts consider that the GDP will fall by around 6% in 2020 and partially recover in 2021 with a growth rate of around
5%, although there is still much uncertainty and the risks are on the downside.

INTEREST RATES (PERCENTAGE)
                                                                                      31-03-20               31-12-19         30-09-19          30-06-19           31-03-19
Official ECB rate                                                                         0.00                   0.00             0.00              0.00               0.00
Euribor 3 months (1)                                                                       (0.42)               (0.39)             (0.42)              (0.33)              (0.31)
Euribor 1 year (1)                                                                         (0.27)               (0.26)             (0.34)              (0.19)              (0.11)
USA Federal rates                                                                            0.25                  1.75              2.00               2.50                2.50
TIIE (Mexico)                                                                                6.50                  7.25              7.75               8.25                8.25
CBRT (Turkey)                                                                                9.75                12.00              16.50              24.00           24.00
(1) Calculated as the month average.

EXCHANGE RATES (EXPRESSED IN CURRENCY/EURO)
                                                                      Year-end exchange rates                                       Average exchange rates
                                                                                       ∆ % on               ∆ % on                                                   ∆ % on
                                                                31-03-20             31-03-19             31-12-19                           1Q20                          1Q19
U.S. dollar                                                         1.0956                   2.5                  2.5                       1.1027                           3.0

Mexican peso                                                      26.1772                 (17.1)              (18.9)                     22.0918                            (1.3)

Turkish lira                                                       7.2063                (12.0)                 (7.2)                      6.7428                           (9.4)

Peruvian sol                                                        3.7524                 (0.7)               (0.9)                       3.7528                            0.6

Argentine peso      (1)                                          70.6330                 (30.7)                 (4.7)                              -                            -

Chilean peso                                                        927.21                (17.5)               (9.3)                       885.33                          (14.4)

Colombian peso                                                   4,453.41                 (19.5)              (17.3)                    3,900.44                            (8.7)
(1) According to IAS 29 "Financial information in hyperinflationary economies", the year-end exchange rate is used for the conversion of the Argentina income statement.
9
Results
The BBVA Group generated a net attributable loss of €1,792m in the first quarter of 2020. The strong performance of the
recurring revenue items (net interest income and fees and commissions), net trading income (NTI) and the other income
line was offset by a higher impairments on financial assets, mainly due to the deterioration of the macroeconomic scenario
resulting from COVID-19 and higher provisions, and, in addition, to the goodwill impairment in the United States in the first
quarter of 2020 of €2,084m included in Other gains (losses) also caused by the COVID-19 pandemic. The comparison with
the same period in 2019 is impacted by those two factors. Without taking into account the goodwill impairment in the
United States, the Group's net attributable profit stood at €292m which corresponds to a decrease of 75.3% compared to
the first quarter of 2019.
CONSOLIDATED INCOME STATEMENT: QUARTERLY EVOLUTION (MILLIONS OF EUROS)
2020 2019
1Q 4Q 3Q 2Q 1Q
Net interest income 4,556 4,709 4,473 4,544 4,398
Net fees and commissions 1,258 1,290 1,273 1,256 1,214
Net trading income 594 490 351 116 426
Other operating income and expenses 75 (89) 22 (18) 8
Gross income 6,484 6,400 6,120 5,897 6,046
Operating expenses (2,918) (3,082) (2,946) (2,952) (2,922)
Personnel expenses (1,532) (1,637) (1,572) (1,578) (1,553)
Other administrative expenses (988) (1,039) (971) (976) (977)
Depreciation (397) (406) (403) (398) (392)
Operating income 3,566 3,317 3,174 2,945 3,124
Impairment on financial assets not measured at fair value
(2,575) (1,169) (1,172) (731) (1,001)
through profit or loss
Provisions or reversal of provisions (312) (243) (113) (117) (144)
Other gains (losses) (2,113) (1,444) (4) (3) (22)
Profit/(loss) before tax (1,435) 460 1,886 2,095 1,957
Income tax (186) (430) (488) (595) (541)
Profit/(loss) for the year (1,621) 31 1,398 1,500 1,416
Non-controlling interests (172) (186) (173) (241) (234)
Net attributable profit (1,792) (155) 1,225 1,260 1,182
Earning per share (euros) (1) (0.29) (0.04) 0.17 0.17 0.16
Of which:
Goodwill impairment in the United States (2,084) (1,318)
Net attributable profit excluding the goodwill impairment in
292 1,163 1,225 1,260 1,182
the United States
Earning per share excluding the goodwill impairment in the
0.03 0.16 0.17 0.17 0.16
United States (euros) (1)
General note: as a result of the decision taken by the International Financial Reporting Standards Interpretations Committee (IFRIC) regarding the collecting of interests of written-off
financial assets for the purpose of IFRS 9, those collections are presented as reduction of the credit allowances and not as a higher interest income, recognition method applied until
December 2019. Therefore, and in order to make the information comparable, the quarterly information of the 2019 income statements has been restated.
(1) Adjusted by additional Tier 1 instrument remuneration.10
CONSOLIDATED INCOME STATEMENT (MILLIONS OF EUROS)
∆ % at constant
1Q20 ∆% exchange rates 1Q19
Net interest income 4,556 3.6 7.5 4,398
Net fees and commissions 1,258 3.6 6.3 1,214
Net trading income 594 39.5 54.6 426
Other operating income and expenses 75 n.s. n.s. 8
Gross income 6,484 7.2 11.4 6,046
Operating expenses (2,918) (0.1) 2.2 (2,922)
Personnel expenses (1,532) (1.3) 1.0 (1,553)
Other administrative expenses (988) 1.1 3.7 (977)
Depreciation (397) 1.3 3.1 (392)
Operating income 3,566 14.1 20.3 3,124
Impairment on financial assets not measured at fair value (2,575) 157.3 166.6 (1,001)
through profit or loss
Provisions or reversal of provisions (312) 117.0 119.7 (144)
Other gains (losses) (2,113) n.s. n.s. (22)
Profit/(loss) before tax (1,435) n.s. n.s. 1,957
Income tax (186) (65.6) (63.4) (541)
Profit/(loss) for the year (1,621) n.s. n.s. 1,416
Non-controlling interests (172) (26.6) (15.7) (234)
Net attributable profit (1,792) n.s. n.s. 1,182
Earning per share (euros) (1) (0.29) 0.16
Of which:
Goodwill impairment in the United States (2,084)
Net attributable profit excluding the goodwill impairment in
292 (75.3) (74.0) 1,182
the United States
Earning per share excluding the goodwill impairment in the
0.03 0.16
United States (euros) (1)
General note: as a result of the decision taken by the International Financial Reporting Standards Interpretations Committee (IFRIC) regarding the collecting of interests of written-off
financial assets for the purpose of IFRS 9, those collections are presented as reduction of the credit allowances and not as a higher interest income, recognition method applied until
December 2019. Therefore, and in order to make the information comparable, the quarterly information of the 2019 income statements has been restated.
(1) Adjusted by additional Tier 1 instrument remuneration.
Unless expressly indicated otherwise, to better understand the changes in the main headings of the Group's income
statement, the year-on-year percentage changes provided below refer to constant exchange rates.
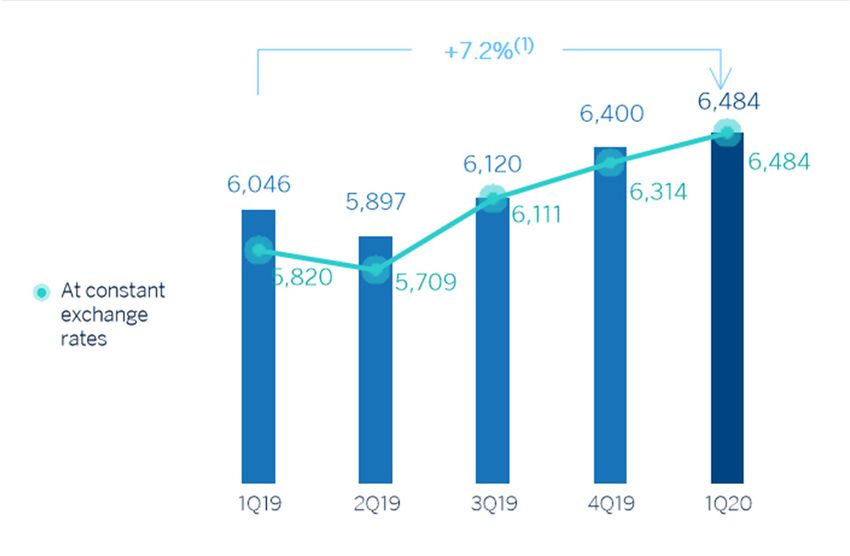
Gross income
Gross income increased by 11.4% year-on-year, supported by the good performance of net interest income and NTI and,
to a lesser extent, the growth in net fees and commissions and the other operating income and expenses line.
GROSS INCOME (MILLIONS OF EUROS)
(1) At constant exchange rates: +11.4%.
Net interest income grew by 7.5% year-on-year, fostered by the good performance from Turkey, South America and, to
a lesser extent, Mexico, which compensated the lower contribution from the United States as a result of the Fed’s interest-
rate cuts in the second half of 2019.11
Net fees and commissions also performed well and grew by 6.3% year-on-year, thanks to the strong contribution from
Spain and the United States.
As a result, the more recurring revenue items grew in all geographical areas, with the exception of the United States, and
ended the quarter with a year-on-year increase of 7.2%.
NET INTEREST INCOME PLUS NET FEES AND
NET INTEREST INCOME/ATAS (PERCENTAGE)
COMMISSIONS (MILLIONS OF EUROS)
(1) At constant exchange rates: +7.2%.
NTI recorded a year-on-year increase of 54.6% mainly due to the foreign-exchange rate hedging gains registered at the
Corporate Center, and, to a lesser extent, the earnings generated mainly from Turkey and the United States.
The other operating income and expenses line closed the first quarter of the year at €75m, which compares very
positively with the €8m recorded in the same period of 2019, mostly due to the evolution of the insurance business in
Mexico.
Operating income
Operating expenses increased by 2.2% between January and March 2020 (down 0.1% at current exchange rates)
showing a variation below the inflation in most of the countries where BBVA is present. The main drivers are the reduction
in expenses in Spain and the Corporate Center, as a result of the cost discipline plans.
OPERATING EXPENSES (MILLIONS OF EUROS)
(1) At constant exchange rates: +2.2%.
The efficiency ratio stood at 45.0% at the end of the quarter, significantly below the level reached at the end of March
2019 (48.3%). As a result of gross income growing faster than expenses, the operating income line increased by 20.3%
year-on-year.12
EFFICIENCY RATIO (PERCENTAGE) OPERATING INCOME (MILLIONS OF EUROS)
(1) At constant exchange rates: +20.3%.
Provisions and other
The impairment on financial assets not measured at fair value through profit or loss (impairment on financial assets)
increased by 166.6% in the first quarter of 2020, mainly due to the negative impact of the deterioration in the
macroeconomic scenario resulting from COVID-19, and had an impact at Group level of €-1,433m.
IMPAIRMENT ON FINANCIAL ASSETS (MILLIONS
OF EUROS)
(1) At constant exchange rates: +166.6%.
Provisions or reversal of provisions (hereafter provisions) closed the quarter with a negative balance of €312m, 119.7%
higher than the figure recorded in the same period of 2019, mainly due to higher provisions in Spain and additional
provisions of €27m for COVID-19.
On the other hand, other gains (losses) mainly reflects the above mentioned goodwill impairment in the United States
closing with a loss of €-2,113m.
Results
As a result of the above, the Group's net attributable loss for the first quarter of 2020 amounted to €1,792m, which
compares negatively with the profit of €1,182m obtained in the same quarter of 2019. This comparison is affected by the
increase in the impairment on financial assets as well as by the goodwill impairment in the United States, both related to
the impact of COVID-19.13
NET ATTRIBUTABLE PROFIT (MILLIONS OF NET ATTRIBUTABLE PROFIT EXCLUDING THE UNITED
EUROS) STATES GOODWILL IMPAIRMENT (MILLIONS OF EUROS)
(1) At constant exchange rates: -74.0%.
(1) At constant exchange rates: n.s.
By business areas, and in millions of euros, Spain and the United States had a net attributable loss of 141 and 100,
respectively, and Mexico, Turkey, South America and the Rest of Eurasia recorded a net attributable profit of 372, 129, 70
and 44, respectively.
TANGIBLE BOOK VALUE PER SHARE AND
EARNING PER SHARE (1) (EUROS)
DIVIDENDS (1) (EUROS)
(1) Replenishing dividends paid in the period.
(1) Adjusted by additional Tier 1 instrument remuneration.
(2) Excluding the goodwill impairment in the United States in 4Q19 and 1Q20.
ROE AND ROTE (1) (PERCENTAGE) ROA AND RORWA (1) (PERCENTAGE)
(1) Ratios excluding the goodwill impairment in the United States in 2019 and 1Q20. (1) Ratios excluding the goodwill impairment in the United States in 2019 and
1Q20.14
Balance sheet and business activity
The most relevant aspects related to the evolution of the Group's balance sheet and business activity as of March 31,
2020, are summarized below:
Loans and advances to customers (gross) remained stable compared to December 2019 (up 0.3%), with an
increase in the corporate portfolio that offsets the deleveraging in the rest of the portfolios.
Non-performing loans fell by 4.4% in the quarter mainly due to decreases in Spain.
Customer deposits remained at the same level as at the end of 2019 (up 0.2%), with a year-on-year increase of
1.7%, strongly supported by the good performance of demand deposits (up 3.0% in the quarter, up 7.9% year-
on-year), where customers have deposited the liquidity available to face the pandemic.
Off-balance sheet funds fell by 10.5% in the quarter (down 6.5% year-on-year) as a result of the negative
performance of the markets caused by COVID-19.
Regarding the intangible assets, during the first quarter of 2020, the United States goodwill has been impaired
by €2,084m due to the COVID-19 pandemic, which does neither affect the tangible net equity, nor the solvency,
nor liquidity of the BBVA Group.
CONSOLIDATED BALANCE SHEET (MILLIONS OF EUROS)
31-03-20 ∆% 31-12-19 31-03-19
Cash, cash balances at central banks and other demand deposits 49,544 11.8 44,303 50,059
Financial assets held for trading 127,103 23.8 102,688 92,366
Non-trading financial assets mandatorily at fair value through profit or loss 5,100 (8.2) 5,557 5,535
Financial assets designated at fair value through profit or loss 1,175 (3.2) 1,214 1,311
Financial assets at fair value through accumulated other comprehensive income 61,229 0.1 61,183 60,204
Financial assets at amortized cost 442,831 0.8 439,162 433,008
Loans and advances to central banks and credit institutions 18,854 5.2 17,924 15,787
Loans and advances to customers 382,592 0.1 382,360 380,799
Debt securities 41,385 6.5 38,877 36,421
Investments in subsidiaries, joint ventures and associates 1,440 (3.3) 1,488 1,587
Tangible assets 9,344 (7.2) 10,068 10,408
Intangible assets 4,702 (32.5) 6,966 8,383
Other assets 28,456 9.2 26,060 28,338
Total assets 730,923 4.6 698,690 691,200
Financial liabilities held for trading 113,699 26.8 89,633 80,818
Other financial liabilities designated at fair value through profit or loss 8,641 (13.7) 10,010 7,846
Financial liabilities at amortized cost 533,205 3.2 516,641 520,464
Deposits from central banks and credit institutions 69,290 26.7 54,700 64,427
Deposits from customers 385,050 0.2 384,219 378,527
Debt certificates 64,937 1.5 63,963 62,365
Other financial liabilities 13,928 1.2 13,758 15,144
Liabilities under insurance and reinsurance contracts 9,593 (9.6) 10,606 10,577
Other liabilities 16,612 (1.6) 16,875 17,947
Total liabilities 681,749 5.9 643,765 637,653
Total equity 49,174 (10.5) 54,925 53,547
Total liabilities and equity 730,923 4.6 698,690 691,200
Memorandum item:
Guarantees given 45,478 (0.8) 45,952 45,831
General note: figures considering the classification of BBVA Paraguay as non-current assets and liabilities held for sale (NCA&L), which are included within the other assets and other
liabilities figures, respectively, as of 31-03-20 and 31-12-19.15
LOANS AND ADVANCES TO CUSTOMERS (MILLIONS OF EUROS) (1)
31-03-20 ∆% 31-12-19 31-03-19
Public sector 27,391 (2.8) 28,193 29,138
Individuals 167,316 (4.2) 174,608 171,947
Mortgages 107,393 (2.8) 110,500 111,776
Consumer 35,058 (3.8) 36,438 36,159
Credit cards 12,591 (15.4) 14,892 13,644
Other loans 12,274 (3.9) 12,778 10,367
Business 185,962 5.7 176,008 175,678
Non-performing loans 15,242 (4.5) 15,954 16,559
Loans and advances to customers (gross) 395,911 0.3 394,763 393,321
Allowances (2) (13,319) 7.4 (12,402) (12,522)
Loans and advances to customers 382,592 0.1 382,360 380,799
(1) Figures considering the classification of BBVA Paraguay as non-current assets and liabilities held for sale (NCA&L), which are included within the other assets and other liabilities
figures of the Group consolidated balance sheet, respectively, as of 31-03-20 and 31-12-19.
(2) Allowances include the valuation adjustments for credit risk during the expected residual life of those financial instruments which have been acquired (mainly originated from the
acquisition of Catalunya Banc, S.A.). As of March 31, 2020, December 31, 2019 and March 31, 2019 the remaining amount was €418m, €433m and €520m, respectively.
LOANS AND ADVANCES TO CUSTOMERS
CUSTOMER FUNDS (BILLIONS OF EUROS)
(GROSS. BILLIONS OF EUROS)
(1) At constant exchange rates: +4.5%.
(1) At constant exchange rates: +1.9%.
CUSTOMER FUNDS (MILLIONS OF EUROS) (1)
31-03-20 ∆% 31-12-19 31-03-19
Deposits from customers 385,050 0.2 384,219 378,527
Current accounts 288,773 3.0 280,391 267,614
Time deposits 88,688 (8.2) 96,583 104,698
Other deposits 7,589 4.7 7,246 6,215
Other customer funds 96,438 (10.5) 107,803 103,189
Mutual funds and investment companies 59,507 (13.3) 68,639 64,928
Pension funds 34,853 (4.8) 36,630 35,071
Other off-balance sheet funds 2,078 (18.0) 2,534 3,191
Total customer funds 481,488 (2.1) 492,022 481,717
(1) Figures considering the classification of BBVA Paraguay as non-current assets and liabilities held for sale (NCA&L), which are included within the other assets and other liabilities
figures of the Group consolidated balance sheet, respectively, as of 31-03-20 and 31-12-19.16 Solvency Capital base BBVA's fully-loaded CET1 ratio has decreased by 90 basis points in the first quarter of 2020 to 10.84%. It should be noted that the impairment of goodwill recorded by BBVA in the United States at the end of 2019 and the first quarter of 2020, for the amount of €1,318m and €2,084m, respectively, has not had an impact on capital at the consolidated level. The uncertainty caused by the COVID-19 pandemic has led to a significant fluctuation in asset prices in the financial markets, accompanied by a sharp increase in volatility. The stock exchanges have experienced falls in response to the impact of the crisis on corporate earnings and the increase in risk aversion that has also spread to the debt markets, as well as the evolution of exchange rates. All of this has had a negative impact on the Group's capital base, particularly with regard to the value of financial assets not valued at fair value through profit and loss, due mainly to the negative impact of the deterioration in the macroeconomic scenario resulting from COVID-19. The national and supranational authorities are responding to this adverse economic situation by taking steps to mitigate its effects. In the area of prudential regulation, the main measures include the announcements by the European Banking Authority that have focused on making the regulatory framework more flexible, especially in relation to the treatment of public and private moratorium measures for prudential purposes, and the guarantees granted by the different authorities. As a result of all of the above, risk-weighted assets (RWA) increased by approximately €3,884m in the first quarter of the year. Isolating the effect of exchange rates, mainly due to the depreciation of the Mexican peso and the emerging currencies, it would result in a growth of €16,065m. This reflects the strength of the activity in the first two months of the year, as well as the increased demand for credit and drawing down of funding facilities resulting from the COVID-19 situation. The fully loaded Additional Tier 1 capital (AT1) stood at 1.63% at the end of March 2020. In February, we saw the early amortization of the issue of CoCos worth €1,500m and with a coupon of 6.75%, issued in February 2015, which since December 2019 no longer computed in the capital adequacy ratio. In terms of the issues eligible as Tier 2 capital, in January 2020 BBVA, S.A. issued €1,000m of Tier 2 subordinated debt over a ten-year period, with an option for early amortization in the fifth year, and a coupon of 1% in January 2020. With regard to the rest of the Group's subsidiaries, Garanti BBVA carried out a Tier 2 issue in February for TRY 750m (€114m) at TLREF (Turkish Lira Overnight Reference Rate) plus 250 basis points. All of this, together with the evolution of the remaining elements computable as Tier 2 capital, has placed the fully loaded Tier 2 ratio at 2.40% as of March 31, 2020. Moreover, at the supervisory level, the European Central Bank, in its announcement on March 12, has allowed the banks to operate temporarily below the capital level defined by the Pillar II Guide (P2G), the Capital Conservation Buffer (CCB) and the Liquidity Coverage Ratio (LCR). In addition to the above, the banks are allowed to use additional Tier 1 and Tier 2 capital instruments to meet the Pillar II Requirements (P2R). These measures are reinforced by the relaxation of the Countercyclical Capital Buffer (CCyB) announced by various national macroprudential authorities and by other complementary measures published by the European Central Bank. All of this has resulted in a reduction of 68 basis points in the fully loaded CET1 requirement for BBVA, with that requirement standing at 8.59%. The reduction in the requirement at the total ratio level is only around 2 basis points, as a result of the lower applicable countercyclical buffer. As a result, it has been agreed to modify the CET1 capital target in line with the new situation, which has been set as a management buffer between 225 to 275 basis points to the CET1 requirements. This range is the one used as a reference for determining the previous CET1 capital target (under fully-loaded view) of between 11.5% and 12%, which means that the new target maintains an equivalent distance in terms of CET1. At the end of March, the management buffer of the fully-loaded CET1 would amount to 225 basis points. The phased-in CET1 ratio stood at 11.08% at the end of March 2020, taking into account the transitory effect of the IFRS 9 standard. AT1 stood at 1.66% and Tier 2 at 2.65%, resulting in a total capital ratio of 15.39%. The current management buffer at the CET1 level would therefore be 249 basis points. Regarding shareholder remuneration, on April 9 a cash payment was made for a supplementary dividend for the 2019 financial year for the gross amount of €0.16 per share, in line with that approved at the General Meeting of Shareholders on March 13. This amounted to €1,067m. Thus, the total dividend for the 2019 financial year amounts to €0.26 gross per share. In addition, in accordance with recommendation ECB/2020/19 issued by the ECB on March 27, 2020, on dividend distributions during the COVID-19 pandemic, and the subsequent notifications clarifying the treatment of dividend accruals
17
by financial institutions under its supervision, the Board of Directors of BBVA has agreed to modify, for the financial year
2020, the Group’s shareholder remuneration policy, which was announced through the Relevant Event notification of
February 1, 2017, establishing a new policy for 2020 of not making any dividend payment for the 2020 financial year until
the uncertainties caused by COVID-19 are resolved and, in any case, not before the end of the financial year.

SHAREHOLDER STRUCTURE (31-03-2020)
                                                                             Shareholders                                                          Shares
Number of shares                                                                    Number                      %                                    Number                       %
Up to 500                                                                           360,533                    41.1                                67,493,011                    1.0
501 to 5,000                                                                        405,879                   46.3                              707,872,492                     10.6
5,001 to 10,000                                                                       58,796                    6.7                               413,591,321                    6.2
10,001 to 50,000                                                                      46,208                    5.3                             886,021,853                     13.3
50,001 to 100,000                                                                       3,455                   0.4                              235,353,161                     3.5
100,001 to 500,000                                                                      1,606                   0.2                             289,282,093                      4.3
More than 500,001                                                                         308                   0.0                          4,068,272,649                      61.0
Total                                                                               876,785                100.0                            6,667,886,580                    100.0

                                                 FULLY-LOADED CAPITAL RATIOS (PERCENTAGE)

CAPITAL BASE (MILLIONS OF EUROS)
                                                                                        CRD IV phased-in                                     CRD IV fully-loaded

                                                                             31-03-20 (1) (2) 31-12-19 31-03-19                   31-03-20 (1) (2) (3) 31-12-19 31-03-19
        Common Equity Tier 1 (CET 1)                                               40,852 43,653         41,784                            39,984 42,856          40,975
      Tier 1                                                                           46,972         49,701        47,455                      45,979        48,775        46,503
      Tier 2                                                                             9,753         8,304          7,341                       8,848        7,464          7,286
Total Capital (Tier 1 + Tier 2)                                                        56,725       58,005         54,797                       54,827       56,240         53,789
Risk-weighted assets                                                                 368,654 364,448 360,679                                  368,827 364,942              361,173
        CET1 (%)                                                                          11.08         11.98         11.58                       10.84         11.74          11.35
      Tier 1 (%)                                                                          12.74        13.64          13.16                       12.47         13.37         12.88
      Tier 2 (%)                                                                           2.65          2.28          2.04                        2.40          2.05          2.02
Total capital ratio (%)                                                                  15.39         15.92          15.19                       14.87         15.41         14.89
(1) As of March 31, 2020, the difference between the phased-in and fully-loaded ratios arises from the temporary treatment of certain capital items, mainly of the impact of IFRS9, to
which the BBVA Group has adhered voluntarily (in accordance with article 473bis of the CRR).
(2) Provisional data.
(3)
  As of March 31, 2020 the fully-loaded capital ratios include the positive impact of +2 basis points due the reduction of the limit of share buybacks which is pending to be approved
by the ECB.

Regarding the MREL (Minimum requirement for own funds and eligible liabilities) requirements, BBVA has continued its
issuance plan during 2020 by closing two public issues of non-preferred senior debt, one in January 2020 for €1,250m
over seven years and one coupon of 0.5%, and another in February 2020 for CHF 160m over six and a half years and a
coupon of 0.125%.

The supervisor has also made announcements regarding the fulfillment of this MREL requirement, with a delay to be
expected in the timetable for its entry into force.

The Group finds that the present structure of shareholders’ funds and admissible liabilities, together with the proposed
plan for issuances, should enable it to comply with the MREL by the date of entry into force of the requirement.

Finally, the Group's leverage ratio maintained a solid position, at 6.2% fully loaded (6.4% phased-in), which remains the
highest among its peer group.
18
Ratings
The rating agencies have kept BBVA's rating unchanged during the first quarter of the year. As a result of the uncertainty
generated by the COVID-19 pandemic, on March 27 Fitch decided to change BBVA's outlook to Rating Watch Negative in
a joint action that affected 17 Spanish banking groups. This resulted from a review of financial institutions in several
European countries. On April 1, 2020, DBRS reported the result of its annual review of BBVA, confirming the rating of A
(high). Moody's and S&P have held BBVA's rating at A3 and A-, respectively. These ratings, together with their
corresponding outlooks, are shown in the following table:
RATINGS
Rating agency Long term (1) Short term Outlook
Axesor Rating A+ n/a Stable
DBRS A (high) R-1 (middle) Stable
Fitch A F-1 Rating Watch Negative
Moody's A3 P-2 Stable
Standard & Poor's A- A-2 Negative
(1)
Ratings assigned to long term senior preferred debt. Additionally, Moody’s and Fitch assign A2 and A rating respectively, to BBVA’s long term deposits.19
Risk management
Credit risk
The calculation of the expected credit losses at the end of March includes the update of the forward looking information
in the models under IFRS 9 in order to reflect the circumstances created by the COVID-19 pandemic in the macroeconomic
environment, which is characterized by a high degree of uncertainty regarding its intensity and duration. As a
consequence, this update is based on the best information available between the reporting date of this report and its date
of publication. This information may change in the future depending on the evolution of the macroeconomic environment
or its uncertainty. The effect of the aforementioned update is significant in terms of estimated losses and has been
calculated for all geographical areas where the Group operates, taking into account both the macroeconomic scenarios as
well as the effects on specific sectors and customers as much as possible. The scenarios consider the various economic
measures which have been announced by governments and monetary authorities all over the world. Due to this, the
scenarios include the prediction that in a relatively close time horizon, a more aligned economic environment with the
previously existing long-term perspectives may be reached.
BBVA Group's main risk indicators evolved as follows in the first quarter of 2020, as a result, among other reasons, of the
situation explained in the previous paragraph
Credit risk remained stable at +0.2% in the quarter. Nonetheless, at constant exchange rates, it grew by 3.1%
with generalized increases in all geographical areas.
The balance of non-performing loans fell by 4.4% in the first quarter of 2020 (down 1.3% at constant exchange
rates), primarily due to the reduction in Spain.
The NPL ratio stood at 3.6% as of March 31, 2020 which represents a decrease of 17 basis points compared to
December 2019.
Loan-loss provisions increased strongly by 7.3% in the last three months (up 13.6% at constant exchange rates)
due to the higher provisions for the adjustment in the macro scenario due to the negative effects of COVID-19 and
for specific clients in the commercial portfolio of certain business areas.
The NPL coverage ratio closed at 86%, which was an improvement of 932 basis points compared to the end of
2019.
The cumulative cost of risk stood at 2.57% as of March 31, 2020, which represents a significant increase of 155
basis points compared to the figure at the end of 2019.
NON-PERFORMING LOANS AND PROVISIONS
(MILLIONS OF EUROS)
CREDIT RISK (1) (MILLIONS OF EUROS)
31-03-20 (2) 31-12-19 (2) 30-09-19 (2) 30-06-19 31-03-19
Credit risk 442,648 441,964 438,177 434,955 439,152
Non-performing loans 15,998 16,730 17,092 16,706 17,297
Provisions 13,748 12,817 12,891 12,468 12,814
NPL ratio (%) 3.6 3.8 3.9 3.8 3.9
NPL coverage ratio (%) (3) 86 77 75 75 74
(1) Include gross loans and advances to customers plus guarantees given.
(2) Figures without considering the classification of BBVA Paraguay as non-current assets and liabilities held for sale (NCA&L).
(3) The NPL coverage ratio includes the valuation adjustments for credit risk during the expected residual life of those financial instruments which have been acquired (mainly
originated from the acquisition of Catalunya Banc, S.A.). Excluding these allowances, the NPL coverage ratio would stand at 83% as of March 31, 2020, 74% in 2019 and 71% as of
March 31, 2019.20
BREAKDOWN OF CREDIT RISK ACCORDING TO STAGE (MILLIONS OF EUROS)
31-03-2020 31-12-2019 31-03-19
Gross Gross Gross
Provisions Provisions Provisions
exposure exposure exposure
Loans and advances to customers 397,170 (13,368) 396,012 (12,447) 393,321 (12,522)
Stage 1 348,564 (2,794) 346,548 (2,138) 345,654 (2,152)
Stage 2 33,316 (2,448) 33,464 (2,185) 31,109 (2,440)
Stage 3 15,291 (8,126) 16,000 (8,124) 16,559 (7,930)
Contingent risks 45,478 (380) 45,952 (370) 45,831 (292)
Stage 1 41,266 (58) 41,715 (60) 41,955 (34)
Stage 2 3,504 (98) 3,507 (83) 3,138 (92)
Stage 3 708 (224) 731 (227) 738 (167)
Credit risk 442,648 (13,748) 441,964 (12,817) 439,152 (12,814)
Stage 1 389,830 (2,852) 388,263 (2,197) 387,608 (2,185)
Stage 2 36,820 (2,546) 36,971 (2,269) 34,247 (2,532)
Stage 3 15,998 (8,349) 16,730 (8,351) 17,297 (8,097)
(1) Figures without considering the classification of BBVA Paraguay as non-current assets and liabilities held for sale (NCA&L).
NON-PERFORMING LOANS EVOLUTION (MILLIONS OF EUROS)
1Q20 (1) (2) 4Q19 (2) 3Q19 (2) 2Q19 1Q19
Beginning balance 16,730 17,092 16,706 17,297 17,087
Entries 2,121 2,484 2,565 2,458 2,353
Recoveries (1,435) (1,509) (1,425) (1,531) (1,409)
Net variation 686 975 1,139 927 944
Write-offs (944) (1,074) (991) (958) (775)
Exchange rate differences and
(474) (262) 237 (561) 41
other
Period-end balance 15,998 16,730 17,092 16,706 17,297
Memorandum item:
Non-performing loans 15,291 16,000 16,400 15,999 16,559
Non performing guarantees
708 731 692 707 738
given
(1) Preliminary data.
(2) Figures without considering the classification of BBVA Paraguay as non-current assets and liabilities held for sale (NCA&L).
Structural risks
Liquidity and funding
Management of liquidity and funding at BBVA aims to finance the recurring growth of the banking business at suitable
maturities and costs, using a wide range of instruments that provide access to a large number of alternative sources of
financing. In this context, it is important to notice that given the nature of BBVA’s business, the funding of lending activity
is fundamentally carried out through the use of stable customer funds.
Due to its subsidiary-based management model, BBVA is one of the few major European banks that follows the Multiple
Point of Entry (MPE) resolution strategy: the parent company sets the liquidity policies, but the subsidiaries are self-
sufficient and responsible for managing their own liquidity (taking deposits or accessing the market with their own rating),
without fund transfers or financing occurring between either the parent company and the subsidiaries, or between the
different subsidiaries. This strategy limits the spread of a liquidity crisis among the Group's different areas, and ensures
that the cost of liquidity and financing is correctly reflected in the price formation process.
During the first quarter of 2020, liquidity conditions remained comfortable across all countries in which the BBVA Group
operates. In the second part of the quarter, the global crisis caused by COVID-19 had a significant impact on financial
markets. The effects of this crisis on the Group's balance sheets have fundamentally been felt through greater drawing
down of credit facilities by wholesale customers in the face of worsening funding conditions in the markets, with no
significant effect in the retail world. In view of this situation, a joint response has been made by the different central banks,
through specific measures and programs to facilitate the funding of the real economy and the availability of liquidity in the
financial markets.You can also read