Positional material deterioration over the building envelope
←
→
Page content transcription
If your browser does not render page correctly, please read the page content below
Study Report   SR457 [2021]

               Positional material
               deterioration over the
               building envelope
               Zhengwei Li and Nick Marston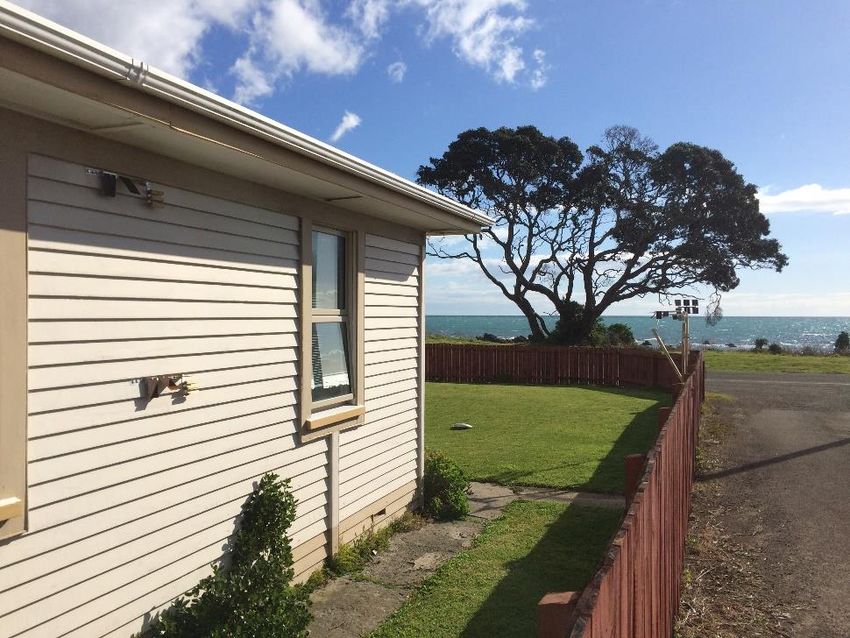
1222 Moonshine Rd, RD1, Porirua 5381    © BRANZ 2021
Private Bag 50 908, Porirua 5240       ISSN: 1179-6197
New Zealand
branz.nz
Study Report SR457 Positional material deterioration over the building envelope
Preface
This is the report prepared during research into building micro-environments and
positional material degradation over the building envelope.
Acknowledgements
We would like to thank New Zealand Building Research Levy for financial support.
We would also like to thank
Auckland Harbour Bridge Alliance
Lauder Atmospheric Research Station (NIWA)
Raukokore School, Waihau Bay
Tai Poutini Polytechnic, Greymouth
Unison Networks
Vital Pet Food, Belfast
for allowing the installation of monitoring instruments and exposure racks on their
premises
Bryan Keen
Nigel Kell
Rob Causer
Roger Stanford
Sheng-Huei Huang
for their technical assistance
Rob Francis of R A Francis Consulting Services Pty Ltd, Australia
for technically reviewing this report.
Copyright licence permission
Figure 4.3(a) Environmental definitions “Sheltered” and “Exposed” and Figure 4.3(b)
Exposure definitions from NZS 3604:2011 Timber-framed buildings were reproduced in
this report as Figure 2. Figure 4.2 Exposure zone map from NZS 3604:2011 was
reproduced as Figure 7 in this report.
Copyright in NZS 3604:2011 is owned by the Crown and administered by the New
Zealand Standards Executive. Reproduced with permission from Standards New
Zealand, on behalf of New Zealand Standards Executive, under copyright licence
LN001380.
i
Study Report SR457 Positional material deterioration over the building envelope
Positional material deterioration
over the building envelope
BRANZ Study Report SR457
Authors
Zhengwei Li and Nick Marston
Reference
Li, Z. W. & Marston, N. J. (2021). Positional material deterioration over the building
envelope. BRANZ Study Report SR457. Judgeford, New Zealand: BRANZ Ltd.
Abstract
This study characterised typical micro-environments, i.e. sheltered and exposed, on
seven residential buildings across New Zealand. It revealed that environmental
conditions on the building envelope were different from those of the surrounding
atmosphere in terms of temperature, humidity, time-of-wetness, surface deposition,
quantity of rain and UVA irradiation. Consequently, material degradation on the
building envelope was different from that fully exposed to the atmosphere.
For areas with light to moderate marine influences or strong geothermal influences,
the corrosivity on the building envelope was lower than or similar to that of the
surrounding atmosphere. The corrosivity in the exposed position was, in general,
higher than or similar to that in the sheltered position on the same wall. This was
supported by corrosion rate measurements with mild steel coupons and mild steel
nails in H3.2 CCA-treated timber.
For areas with severe marine influences, the building wall(s) facing towards the sea
had a corrosivity higher than the surrounding atmosphere and the building wall(s)
not facing towards the sea. The comparative corrosivity between the exposed and
sheltered positions was complicated. The nails in the timber in the exposed position
always had a higher corrosion rate than those in the sheltered position on the same
wall. The corrosion rates of most mild steel coupons in the exposed position were
higher than or similar to those of the coupons in the sheltered position on the same
wall. However, the corrosion rates of some coupons in the exposed position on the
wall(s) facing towards the sea were lower than those of the coupons in the
sheltered positions.
This study improved our understanding of building micro-environments. It will provide
in-depth information that may help inform the materials specification scheme used in
relevant regulation documents as well as the design of simulated material performance
testing methodologies.
Keywords
Building envelope, building micro-environment, sheltered, exposed, temperature,
humidity, time-of-wetness, wind-driven rain, solar irradiation, surface deposition,
corrosion, mild steel.
ii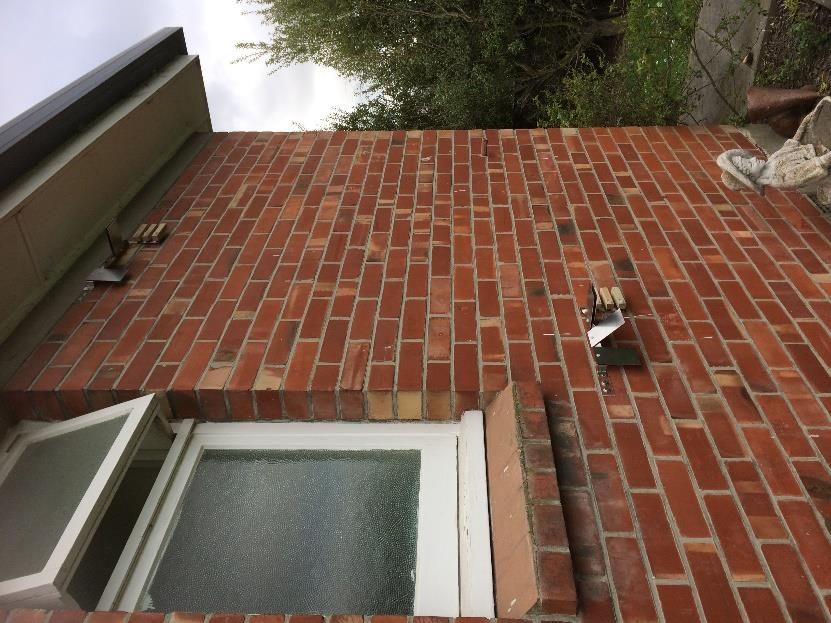
Study Report SR457 Positional material deterioration over the building envelope

Contents
EXECUTIVE SUMMARY.................................................................................... 1
1.  INTRODUCTION ..................................................................................... 4
2.  LITERATURE REVIEW ............................................................................. 5
        Material environmental degradation ........................................................5
        2.1.1 Temperature ..............................................................................5
        2.1.2 Humidity ....................................................................................5
        2.1.3 Rain ..........................................................................................5
        2.1.4 Wind .........................................................................................6
        2.1.5 Solar irradiation ..........................................................................6
        2.1.6 Chloride .....................................................................................7
        2.1.7 Hydrogen sulphide ......................................................................7
        2.1.8 Sulphur dioxide ..........................................................................8
        2.1.9 Orientation .................................................................................8
        2.1.10 Inclination ..................................................................................8
        Building micro-environment ....................................................................9
        2.2.1 Definition ...................................................................................9
        2.2.2 Monitoring building micro-environment ....................................... 10
        2.2.3 Corrosivity of micro-environment ............................................... 12
        Summary ............................................................................................ 15
3.  OBJECTIVE ........................................................................................... 16
4.  EXPERIMENTAL .................................................................................... 17
        Monitoring site and building ................................................................. 17
        4.1.1 Auckland .................................................................................. 18
        4.1.2 Rotorua ................................................................................... 18
        4.1.3 Waihau Bay .............................................................................. 18
        4.1.4 Wellington................................................................................ 19
        4.1.5 Greymouth ............................................................................... 19
        4.1.6 Christchurch ............................................................................. 19
        4.1.7 Lauder ..................................................................................... 19
        Atmospheric environment monitoring .................................................... 20
        Building micro-environment .................................................................. 21
        Environmental corrosivity ..................................................................... 22
5.  RESULTS............................................................................................... 24
        Test building in Auckland ..................................................................... 24
        5.1.1 Atmospheric environmental conditions ........................................ 24
        5.1.2 Surface deposition on the test building ....................................... 25
        5.1.3 Corrosion rates of mild steel coupons ......................................... 25
        5.1.4 Corrosion rates of mild steel nails in timber ................................. 27
        Test building in Rotorua ....................................................................... 27
        5.2.1 Atmospheric environmental conditions ........................................ 27
        5.2.2 Airborne sulphur-containing species ........................................... 28
        5.2.3 Corrosion rates of mild steel coupons ......................................... 29
        5.2.4 Corrosion rates of mild steel nails in timber ................................. 31

                                                      iii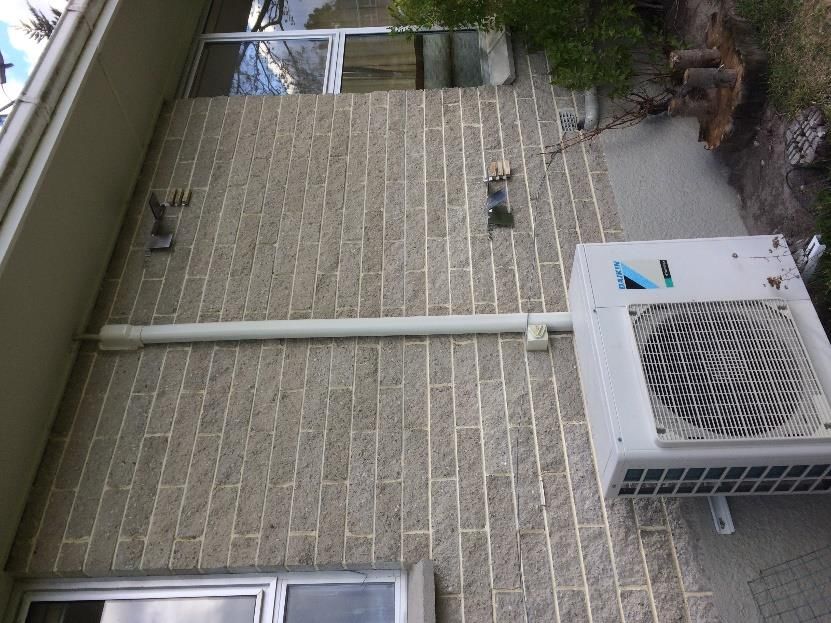
Study Report SR457 Positional material deterioration over the building envelope

           Test building in Waihau Bay ................................................................. 31
           5.3.1 Atmospheric environmental conditions ........................................ 31
           5.3.2 Environmental conditions on the test building ............................. 32
           5.3.3 Surface deposition on the test building ....................................... 33
           5.3.4 Corrosion rates of mild steel coupons ......................................... 34
           5.3.5 Corrosion rates of mild steel nails in timber ................................. 35
           Test building in Wellington ................................................................... 36
           5.4.1 Atmospheric environmental conditions ........................................ 36
           5.4.2 Temperature on the test building ............................................... 37
           5.4.3 ToW on the test building ........................................................... 42
           5.4.4 Wind-driven rain on the test building .......................................... 42
           5.4.5 Surface deposition on the test building ....................................... 43
           5.4.6 UVA irradiation on the test building ............................................ 44
           5.4.7 Corrosion rates of mild steel coupons ......................................... 45
           5.4.8 Corrosion rates of mild steel nails in timber ................................. 46
           Test building in Greymouth .................................................................. 47
           5.5.1 Atmospheric environmental conditions ........................................ 47
           5.5.2 Environmental conditions on the test building ............................. 48
           5.5.3 Surface deposition on the test building ....................................... 48
           5.5.4 Corrosion rates of mild steel coupons ......................................... 49
           5.5.5 Corrosion rates of mild steel nails in timber ................................. 50
           Test building in Christchurch ................................................................ 51
           5.6.1 Atmospheric environmental conditions ........................................ 51
           5.6.2 Environmental conditions on the building .................................... 51
           5.6.3 Surface deposition on the test building ....................................... 52
           5.6.4 Corrosion rates of mild steel coupons ......................................... 53
           5.6.5 Corrosion rates of mild steel nails in timber ................................. 54
           Test building in Lauder ........................................................................ 55
           5.7.1 Atmospheric environmental conditions ........................................ 55
           5.7.2 Environmental conditions on the test building ............................. 55
           5.7.3 Surface deposition on the test building ....................................... 56
           5.7.4 Corrosion rates of mild steel coupons ......................................... 57
           5.7.5 Corrosion rates of mild steel nails in timber ................................. 58
6.     DISCUSSION ........................................................................................ 60
           Environmental conditions on test buildings ............................................ 60
           6.1.1 Temperature, humidity and time-of-wetness ............................... 60
           6.1.2 Wind-driven rain ....................................................................... 60
           6.1.3 Surface deposition .................................................................... 61
           Comparative corrosivity between building and the atmosphere ................ 63
           6.2.1 Mild steel coupons .................................................................... 64
           6.2.2 Nails in timber .......................................................................... 66
           Comparative corrosivity between sheltered and exposed building
           positions............................................................................................. 68
           6.3.1 Mild steel coupons .................................................................... 68
           6.3.2 Nails in timber .......................................................................... 69

                                                        iv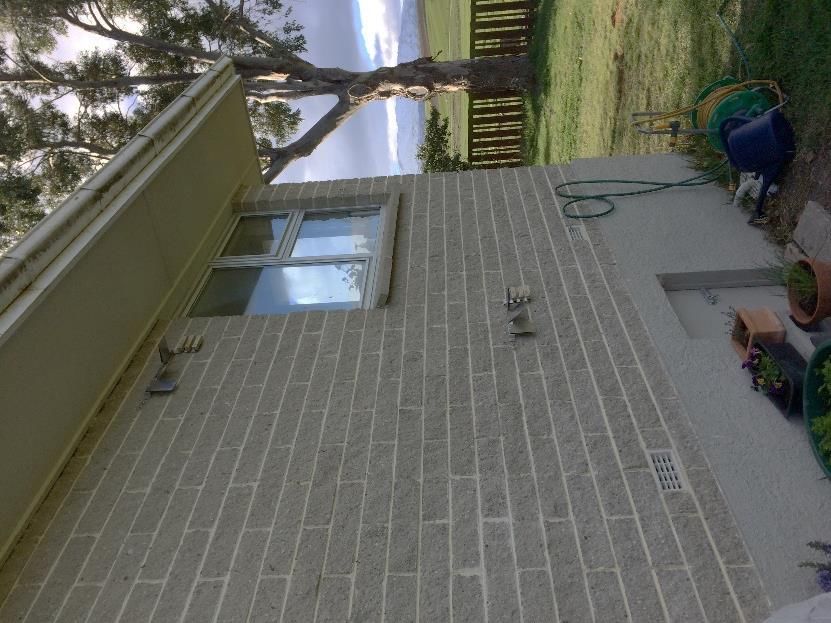
Study Report SR457 Positional material deterioration over the building envelope

7.  CONCLUDING REMARKS ...................................................................... 70
REFERENCES ................................................................................................ 72
APPENDIX A: TEST BUILDINGS .................................................................... 77

Figures
Figure 1. Correlation between atmospheric corrosion rate of mild steel and atmospheric
       salinity. .......................................................................................................7
Figure 2. Schematics showing closed, sheltered and exposed micro-environments on
       buildings according to NZS 3604:2011. ........................................................ 10
Figure 3. Correlation between airborne chloride deposition in open and sheltered
       locations and distance from the sea. ............................................................ 11
Figure 4. Changes of water-soluble anion concentrations on the surface of copper
       installed at different heights of a building. .................................................... 11
Figure 5. Correlation between metal corrosion rate and monthly airborne chloride. .... 13
Figure 6. Chloride accumulation (a) and aluminium corrosion loss (b) under aircraft
       shelter. ..................................................................................................... 14
Figure 7. Location of monitoring buildings. ............................................................. 17
Figure 8. Schematic of the device for wind-driven rain measurement on the wall. ...... 22
Figure 9. Schematic of UVA sensor installed on the wall. ......................................... 22
Figure 10. Mild steel nail driven into timber block for corrosion test. ......................... 23
Figure 11. Wind speed (m/s) and direction during the 1-year monitoring period
       (percentage shown is count of wind speed).................................................. 24
Figure 12. First-year corrosion rates of mild steel coupons on the test building in
       Auckland. .................................................................................................. 26
Figure 13. First-year corrosion rates of mild steel nails embedded into H3.2 CCA-
       treated timber blocks on the test building in Auckland. .................................. 27
Figure 14. Wind speed (m/s) and direction during the 1-year monitoring period
       (percentage shown is count of wind speed).................................................. 28
Figure 15. First-year corrosion rates of mild steel coupons on the test building in
       Rotorua. .................................................................................................... 30
Figure 16. First-year corrosion rates of mild steel nails embedded into H3.2 CCA-
       treated timber blocks on the test building in Rotorua. ................................... 31
Figure 17. Wind speed (m/s) and direction during the 1-year monitoring period
       (percentage shown is count of wind speed).................................................. 32
Figure 18. First-year corrosion rates of mild steel coupons on the test building in
       Waihau Bay. .............................................................................................. 35
Figure 19. First-year corrosion rates of mild steel nails embedded into H3.2 CCA-
       treated timber blocks on the test building in Waihau Bay. .............................. 36
Figure 20. Wind speed (m/s) and direction during the 1-year monitoring period
       (percentage shown is count of wind speed).................................................. 37
Figure 21. Comparison of daily surface temperature on four walls of the test building in
       Wellington. ................................................................................................ 39
Figure 22. Comparison of hourly surface temperature on four walls (July 2016) of the
       test building in Wellington. ......................................................................... 40
Figure 23. Comparison of hourly surface temperature on four walls (November–
       December 2016) of the test building in Wellington. ....................................... 41
                                                           v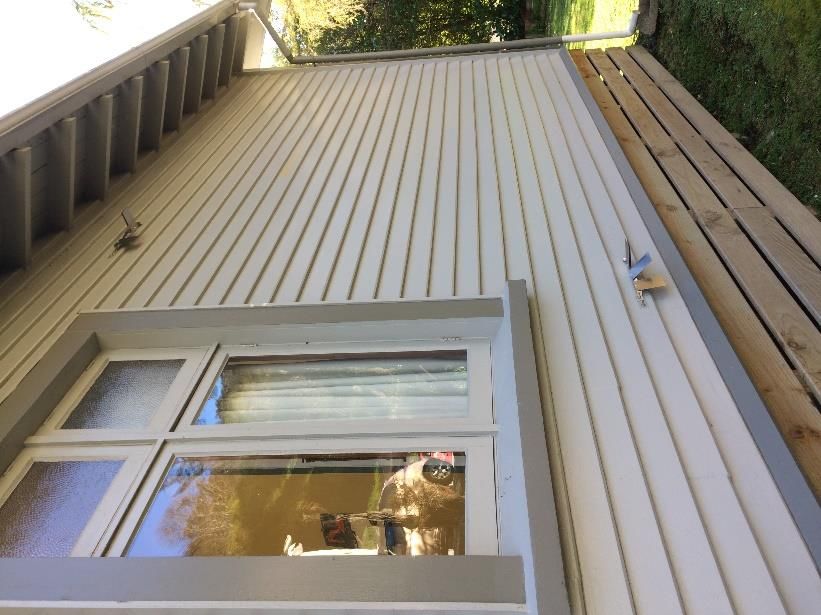
Study Report SR457 Positional material deterioration over the building envelope
Figure 24. Comparison of daily UVA irradiation on four walls of the test building in
Wellington. ................................................................................................ 44
Figure 25. First-year corrosion rates of mild steel coupons on the test building in
Wellington. ................................................................................................ 45
Figure 26. First-year corrosion rates of mild steel nails embedded into H3.2 CCA-
treated timber blocks on the test building in Wellington................................. 46
Figure 27. Wind speed (m/s) and direction during the 1-year monitoring period
(percentage shown is count of wind speed).................................................. 47
Figure 28. First-year corrosion rates of mild steel coupons on the test building in
Greymouth. ............................................................................................... 50
Figure 29. First-year corrosion rates of mild steel nails embedded into H3.2 CCA-
treated timber blocks on the test building in Greymouth. ............................... 51
Figure 30. First-year corrosion rates of mild steel coupons on the test building in
Christchurch. ............................................................................................. 53
Figure 31. First-year corrosion rates of mild steel nails embedded into H3.2 CCA-
treated timber blocks on the test building in Christchurch. ............................. 54
Figure 32. Wind speed (m/s) and direction during the 1-year monitoring period
(percentage shown is count of wind speed).................................................. 55
Figure 33. First-year corrosion rates of mild steel coupons on the test building in
Lauder. ..................................................................................................... 58
Figure 34. First-year corrosion rates of mild steel nails embedded into H3.2 CCA-
treated timber blocks on the test building in Lauder. ..................................... 58
Figure 35. Correlation between the highest surface deposition in sheltered position on
the building and distance from the sea. ....................................................... 61
Figure 36. Correlation between the highest surface deposition in the sheltered position
on the building and the corrosion rate of 90° inclined mild steel coupon: (a)
linear fitting and (b) polynomial fitting. ........................................................ 63
Figure 37. A schematic of surface deposition on the 0° inclined surfaces: (a) fully
exposed to the atmosphere and (b) installed on the building. ........................ 65
Figure 38. Correlation between annual rainfall and corrosion rate of the nail in timber
fully exposed to the atmosphere. ................................................................ 67
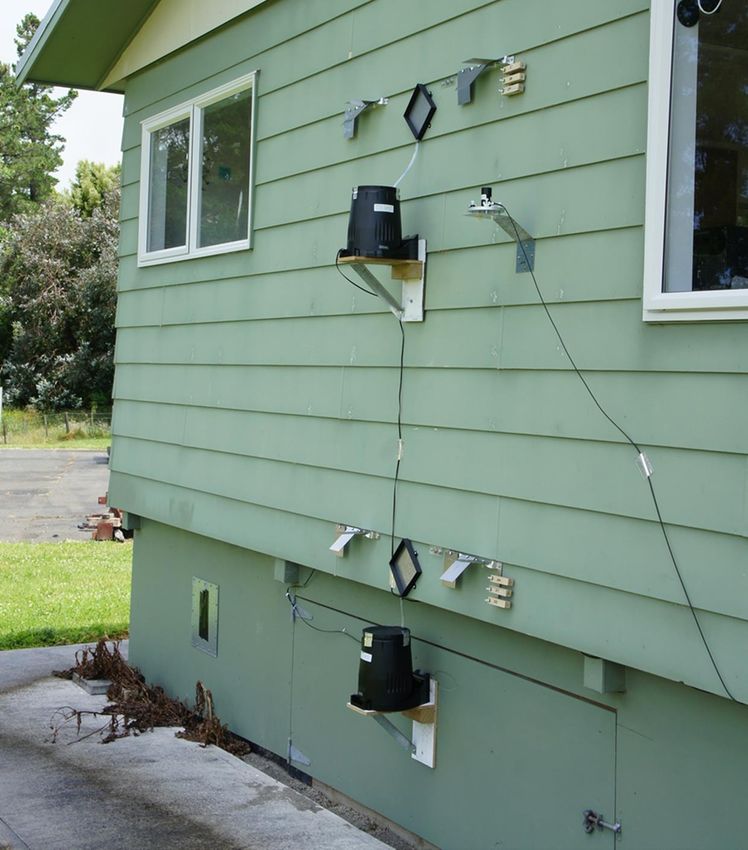
Figure 39. Monitoring positions on the test building in Auckland. .............................. 77
Figure 40. A summary of monitoring results obtained on the test building in
Auckland. .................................................................................................. 78
Figure 41. Monitoring positions on the test building in Rotorua. ............................... 79
Figure 42. A summary of monitoring results obtained on the test building in Rotorua. 80
Figure 43. Monitoring racks and devices on the north wall of the test building in
Waihau Bay. .............................................................................................. 81
Figure 44. A summary of monitoring results obtained on the test building in Waihau
Bay. 82
Figure 45. A schematic of positions of the coupons and monitoring devices installed on
the west and east walls (not to scale). ......................................................... 83
Figure 46. A schematic of positions of the coupons and monitoring devices installed on
the north and south walls (not to scale). ...................................................... 84
Figure 47. A summary of monitoring results obtained on the test building in
Wellington. ................................................................................................ 85
Figure 48. Monitoring positions on the (a) north and (b) east walls of the test building
in Greymouth............................................................................................. 86
vi
Study Report SR457 Positional material deterioration over the building envelope

Figure 49. A summary of monitoring results obtained on the test building in
       Greymouth. ............................................................................................... 87
Figure 50. Monitoring positions on the (a) east and (b) west walls of the test building
       in Christchurch........................................................................................... 88
Figure 51. A summary of monitoring results obtained on the test building in
       Christchurch. ............................................................................................. 89
Figure 52. Monitoring positions on the (a) north and (b) east wall of the test building in
       Lauder. ..................................................................................................... 90
Figure 53. A summary of monitoring results obtained on the test building in Lauder. . 91

Tables
Table   1. Corrosion loss of weathering steel samples on a steel bridge.........................8
Table   2. Corrosion rate ratio of vertical to 30° inclined samples..................................9
Table   3. Zinc corrosion rates in different marine environments. ................................ 12
Table   4. First-year corrosion rates of metallic samples exposed in sheltered and open
         marine-influenced environments.................................................................. 14
Table   5. Atmospheric environment monitoring details.............................................. 20
Table   6. Surface deposition on the test building in Auckland. ................................... 25
Table   7. Concentration of airborne sulphur-containing species on the test building in
         Rotorua. .................................................................................................... 29
Table   8. Environmental conditions on the test building in Waihau Bay. ..................... 33
Table   9. Surface deposition on the test building in Waihau Bay. ............................... 34
Table   10. Temperature on the test building in Wellington. ....................................... 37
Table   11. Total ToW values in positions on the test building in Wellington. ............... 42
Table   12. Wind-driven rain on the test building in Wellington. .................................. 42
Table   13. Surface deposition on the test building in Wellington. ............................... 43
Table   14. Environmental conditions on the test building in Greymouth. ..................... 48
Table   15. Surface deposition on the test building in Greymouth. .............................. 49
Table   16. Environmental condition on the test building in Christchurch. .................... 52
Table   17. Surface deposition on the test building in Christchurch. ............................ 52
Table   18. Environmental condition on the test building in Lauder. ............................ 56
Table   19. Surface deposition on the test building in Lauder...................................... 57
Table   20. Monitoring positions on the test building in Wellington. ............................. 83

                                                          vii
Study Report SR457 Positional material deterioration over the building envelope
Executive summary
A wide variety of materials are used on buildings for cladding, decorating, fastening,
framing and sealing purposes. Their resistance to environmental degradation is
essential to the durability and performance of buildings. To ensure materials or
functional components will meet or exceed the minimum durability requirements of the
performance-based New Zealand Building Code (NZBC), a specification scheme has
been established. This scheme relies on a reliable definition of the atmospheric
corrosivity zone and the building micro-environment. Corrosivity zone information can
be retrieved from the New Zealand atmospheric corrosivity map shown in NZS
3604:2011 Timber-framed buildings. Limited studies have been done to deliver a good
understanding of building micro-environments for consistent building practice.
This study investigated the formation and characteristics of exposed and sheltered
positions on seven residential buildings located within representative corrosivity and
climate zones across New Zealand. These included Auckland, Rotorua, Waihau Bay
(Bay of Plenty), Wellington, Greymouth, Christchurch and Lauder. Specific factors
monitored over the building envelope included the following:
surface temperature (and variation) (T)
relative humidity (RH)
time-of-wetness (ToW)
surface (salt) deposition
wind-driven rain
UVA irradiation
first-year metal corrosion rate (mild steel coupon and nail in timber).
This study revealed that the environmental conditions over the test building envelope
were different from those of the surrounding atmosphere.
The maximum surface temperature measured on the building could be up to 40°C
higher than the maximum ambient temperature. It was dependent on the material
type of the wall cladding, wall orientation and position on the wall. Meanwhile, the
temperature on the building had a larger variation than that of the surrounding
atmosphere.
The time-of-wetness, defined as the period of T > 0°C and RH > 80%, showed a
general trend of surrounding atmosphere > exposed positions on the building >
sheltered positions on the building. ToW is extensively used in the atmospheric
corrosion study and environmental corrosivity classification.
The quantity of wind-driven rain on the building was significantly lower than that of
the reference vertical rain. It had obvious dependences on wall orientation and
prevailing/common wind direction.
Surface deposition was dependent on the inclination angle and position of the
collection surface. The horizontally inclined (0°) surfaces always collected more
deposits than other surfaces no matter where they were installed, i.e. on the
building or fully exposed to the atmosphere. On the building, the sheltered position
always collected a larger amount of deposits than the exposed position on the
same wall. This could be partly explained by the rain-washing effect. Surface salt
deposition on the building also decreased rapidly with the distance from the sea.
UVA irradiation on the building was lower than that in the surrounding atmosphere.
For example, on the building in Wellington, the daily average UVA irradiation on the
1Study Report SR457 Positional material deterioration over the building envelope
south wall was approximately 6 times lower than that on the north wall and 10
times lower than that in the atmospheric environment.
This study revealed that these different micro-environmental conditions on the building
may lead to material degradation that was different from that fully exposed to the
atmosphere.
The corrosion rate of mild steel coupons showed a dependence on inclination
angle. The following corrosion rate trends have been observed.
- On the test building: 0° >≈ 45° > 90°.
- Fully exposed to the atmosphere: 0° > 45° >≈ 90°.
The corrosivity of the surrounding atmosphere was greater than or similar to that
on the building. This was particularly true in areas with light to moderate marine
influences or geothermal influences (for example, Auckland, Rotorua, Wellington,
Greymouth and Christchurch).
In severe marine environments (for example, Waihau Bay), the comparative
corrosivity between the building and its surrounding atmosphere was more
complicated.
- South and west walls (directly exposed to marine environment) > surrounding
atmosphere >≈ north and east walls (not directly exposed to marine
environment).
Surface deposition on the building could be correlated to mild steel corrosion rate. In
general, a higher deposition was observed with a higher corrosion rate. However,
surface deposition was not the only factor key to metal atmospheric corrosion on the
building. In areas with light marine influences, environmental moisture may play a
more important role.
This study revealed that material degradation over the building had an obvious
positional dependence. The corrosivity in the exposed position would, in general, be
higher than or similar to that in the sheltered position on the same wall. This was
supported by corrosion rate measurements with mild steel coupons and mild steel nails
in H3.2 copper chrome arsenate (CCA) treated timber. However, in severe marine
environments, corrosion rates of some coupons installed in the exposed position on the
wall(s) that were subject to direct marine influences might be lower than those of the
coupons in the sheltered positions.
These experimental observations may help clarify whether current definitions and
understandings of building micro-environments can support the materials specification
scheme used in relevant regulation documents – NZBC Acceptable Solution E2/AS1 and
NZS 3604:2011.
They also imply that, when designing a scheme for simulated material performance
testing, environmental factors key to degradation must be identified and incorporated
into the procedure. More attention should also be paid to sample arrangement details,
purpose-built testing structure features and type of materials selected for testing.
2Study Report SR457 Positional material deterioration over the building envelope
Summary of experimental details and main findings
Auckland
Rotorua
Waihau Bay
Building
Wellington
Greymouth
Christchurch
Lauder
Atmosphere
Micro-climate
- Geothermal
- Industrial
Micro-environment
Environment - Exposed
- Sheltered
Temperature
Relative humidity
Time-of-wetness
Rain
UVA irradiation
Factor Surface soluble deposit
Corrosion rate
Environmental condition trend:
- maximum surface temperature: building > atmosphere
- surface temperature variation: building > atmosphere
- UVA irradiation: building < atmosphere
- rain: sheltered building position < exposed building position < atmosphere
- time-of-wetness: sheltered building position < exposed building position <
atmosphere
- surface soluble deposit: sheltered building position > exposed building
position
Observation
Comparative corrosivity:
- light to moderate marine area: atmosphere >≈ exposed building position >≈
sheltered position
- severe marine area: building wall directly exposed to marine > atmosphere >
building wall not directly exposed to marine
- geothermal area: atmosphere > exposed building position >> sheltered
building position
Material degradation on building is position-dependent.
Material specification scheme needs to be supported by a better understanding
of micro-environmental characteristics and influences.
Environmental factors key to material durability need to be identified and
Implication incorporated into accelerated or simulated test.
Sample arrangement and testing structure features must be well controlled for
accelerated or simulated test.
3Study Report SR457 Positional material deterioration over the building envelope
1. Introduction
The building and housing sector contributes approximately 8% to New Zealand’s GDP
by employing approximately 10% of our labour force (PricewaterhouseCoopers, 2016)
to build and maintain our housing stock, which was valued at approximately $1,200
billion in 2020 (Reserve Bank of New Zealand, 2020).
Metals, polymers and timbers are widely used in building and construction for cladding,
fastening, framing, sealing and decorating purposes. Their resistance to a variety of
environmental attacks is essential to the durability and performance of buildings. The
NZBC has clear and definite durability requirements for functional components used on
buildings. For example, a minimum of 50-year durability must be met for components
that provide structural stability or that are difficult to access or replace or where their
failure may go undetected during service and maintenance.
To meet or exceed the minimum durability requirements, a scheme has been
established for the specification of materials, functional components and protective
measures. This has been adopted by NZBC E2/AS1 and NZS 3604:2011. This scheme
uses a two-tier approach – atmospheric exposure zone (where the building will be
constructed) and micro-environment identified on the building envelope (closed,
sheltered and exposed). The exposure zone is defined by the New Zealand
atmospheric corrosivity map. However, the understanding of building micro-
environments and their influences on material degradation is relatively limited.
Micro-environments created on buildings by structural components and/or functional
features are diverse. They can differ from surrounding atmospheric environments and
also show large variations over the building envelope. Consequently, material
degradation over the building envelope is dependent on position and location. This is
particularly true for the sheltered and exposed positions that are defined by relevant
New Zealand building standards.
Limited studies have been devoted to thoroughly investigate the generation and
characteristics of representative building micro-environments, their influences on
materials degradation and their implications for performance and durability. Some
studies have been performed with purpose-built structures to determine the
comparative corrosivity of sheltered and exposed conditions. However, the results
obtained to date are not comprehensive and therefore cannot provide a sound base to
understand the mechanisms behind and to consistently support the current material
specification scheme.
Materials account for approximately 18–24% of new build costs (Deloitte Access
Economics, 2018), and different grades of materials have large price differences. An
improved understanding is needed of the representative micro-environments found on
buildings, particularly in exposed and sheltered positions. This helps the industry make
more-informed decisions about the use of fit-for-purpose materials and maintenance
schemes, reducing risk of overspecification or under-specification. Over the longer
term, this will lead to tangible savings, increase industry productivity and position the
industry to “build right first time”.
4Study Report SR457 Positional material deterioration over the building envelope
2. Literature review
In this section, the following aspects will be briefly discussed, these being based on
findings from publicly available literature.
Influences of individual environmental/climatic factors on material degradation.
Monitoring of micro-climatic factors on the building envelope.
Degradation behaviours of materials in open and sheltered environments.
Material environmental degradation
A variety of environmental factors such as climate and atmospheric pollution can
contribute to material degradation as discussed in this section.
2.1.1 Temperature
Ambient temperature is not believed to be very important, especially for atmospheric
corrosion. The material surface temperature is more important since it can directly
affect relative humidity (RH), time-of-wetness (ToW) and degradation kinetics. An
increase in temperature will, in general, accelerate mass transportation and
electrochemical reactions. This tends to accelerate corrosion processes if
environmental humidity is constant. That said, RH will normally decrease when the
temperature is increased, leading to a decrease in ToW and the overall corrosion rate
(Roberge, 1999). Therefore, temperature tends to affect atmospheric corrosion in
more complex ways. An increase in temperature over the range of 20–40°C while
holding the chloride content (160 mg/m3) and RH (80%) constant has been observed
to result in three distinct patterns with different metals (Griffin, 2006) over a relatively
short period. These include:
an increase of corrosion rate for iron
a decrease of corrosion rate for zinc
no change in corrosion rate of copper.
2.1.2 Humidity
RH is particularly relevant to atmospheric corrosion of metallic materials (Mansfeld,
1979). There is a critical RH (CRH) threshold below which corrosion will not occur since
there is insufficient moisture to create an electrolyte layer on the metal surface
(McCafferty, 2010). The CRH value is dependent on the surface condition of the metal
and also the pollution level of the surrounding environment. The primary CRH for a
clean metal in unpolluted air is approximately 66%. If the metal is covered with any
corrosion products, a second CRH may exist. In the case of iron and steel, a tertiary
CRH appears. At ~60% RH, rusting commences at a very slow rate and corrosion
increases sharply at 75–80% RH. At ~90% RH, a tertiary increase in corrosion rate can
be observed.
2.1.3 Rain
Rainwater is important to initiate and sustain corrosion since it maintains the humidity
of the surrounding air above the CRH. If rainwater is retained in pockets or crevices of
the growing corrosion products, it may also accelerate corrosion by supplying
continued wetness in these localised areas (Cole & Ganther, 2006; Cole & Paterson,
2007). Regular rainwater washing could partially remove loose corrosion products, and
consequently the fresh metal surface would be exposed to further attack.
5Study Report SR457 Positional material deterioration over the building envelope
On the other hand, rainwater can remove the accumulated dust and/or corrosive
deposits such as salt particles partly or completely from the material surface. Rain-
washing effects are particularly noticeable on inclined surfaces in marine environments
(Ganther et al., 2011). A modelling study indicated that pollutants on a surface can be
reduced to 10% of their original concentrations after a rainfall of 1.5 mm (Cole &
Paterson, 2007). Another study found that, in areas with a monthly average rainfall of
less than 100 mm, rain-washing effects would be limited (Chen, Chiu, Chan, Chang &
Yang, 2013).
2.1.4 Wind
The speed and direction of wind, particularly the prevailing wind, will affect the
formation and persistence of a water/moisture layer on a material surface. Wind can
also affect particle accumulation on material surfaces (Klassen & Roberge, 2001; Cole,
Paterson & Ganther, 2003; Schweitzer, 2006; Nguyen, Wang & Leicester, 2012). Wind
can disperse airborne contaminants in larger areas. For example, in marine
environments, strong prevailing winds can carry salt particles inland over long
distances. However, winds with a speed exceeding a critical value have the ability to
blow dry salt off metal surfaces (Cole, Lau, Chan & Paterson, 2004). They may also
have a drying effect on a corroding metal surface. These may benefit corrosion
resistance. In contrast, a low wind speed would favour accumulation of more
pollutants, possibly contributing to a high corrosion rate. It has been found that better
predicted results and/or correlations could be produced when wind was incorporated
into atmospheric corrosion modelling (Oesch & Heimgartner, 1996).
2.1.5 Solar irradiation
Solar irradiation can affect ToW and subsequently the metal corrosion process. Light of
certain wavelengths can stimulate photo-sensitive corrosion reactions on certain
metals. The corrosion of carbon steel in sodium chloride solutions has been found to
be increased by ultraviolet (UV) irradiation. This is because the conductivity of the
corrosion product layer was increased in the presence of UV (Riazi, Danaee & Peykari,
2013). Potential interactions between UV light, airborne chlorides and oxidising agents
such as ozone may produce reactive species that can be involved in corrosion
processes. For example, it has been found that UV-induced photo-dissociation of ozone
can generate reactive atomic oxygen, which can react rapidly with silver (Ag) to form
Ag2O, leading to more severe attack of the Ag surface (Chen et al., 2010). On the
other hand, UV irradiation has been proved to be capable of suppressing pit generation
and enhancing the passivity of AISI 304 stainless steel in solutions containing chlorides
(Macdonald, Sikora, Balmas & Alkire, 1996; Moussa & Hocking, 2001).
UV light is the primary environmental factor contributing to degradation of polymeric
materials, such as paints, sealants, adhesives and plastics, through auto-oxidation
processes or photolytic rearrangements (Wypych, 2013; Yousif & Haddad, 2013). Signs
of photo-induced degradation may include embrittlement (surface cracking),
discolouration and loss of transparency.
Solar irradiation on a building envelope is not uniform and can be affected or (partially)
blocked by architectural features, construction materials, functional structures, building
orientation, urban morphology and/or building scale (Axarli, 2005; Martins, Adolphe &
Bastos, 2014). For example, clear float glass can transmit a larger percentage of UVA
radiation than polycarbonate and laminated glass, which has virtually zero transmission
of wavelength shorter than 380 nm (King & O’Brien, 1995).
6Study Report SR457 Positional material deterioration over the building envelope
2.1.6 Chloride
Deposition of hygroscopic salts, such as NaCl and MgCl2, can promote corrosion at low
RH levels. The deliquescence relative humidity (DRH) values for NaCl and MgCl2 are
76% and 33% respectively. However, considerable corrosion could be initiated and
sustained down to 33% RH under NaCl and to 11% RH under MgCl2 (Schindelholz,
Risteen & Kelly, 2014).
Chlorides can directly participate in corrosion reactions and affect the morphology and
composition of the growing corrosion products on steels (Ma, Li & Wang, 2009; Ghali,
2010). Chloride ions are known to compete with hydroxyl ions to combine with ferrous
cations, leading to the formation of unstable and soluble iron-chloride complexes,
which have a lower passivation effect than stable iron-hydroxyl species.
A direct relationship between airborne salt level (salinity) and atmospheric corrosion
rate of mild steel has been observed (Qu, Yan, Zhang, Wan & Cao, 2002). Although
the corrosion rate seems to be increased linearly with atmospheric salinity lower than
600 mg Cl-/m2/day, it tends to level off when atmospheric salinity is above this critical
level (see Figure 1) (Alcantara, Chico, Diaz, de la Fuente & Morcillo, 2015).
Mild steel corrosion rate
(µm/year)
Atmospheric salinity (mg Cl-/m2/day)
Source: Alcantara, Chico, Diaz, de la Fuente & Morcillo, 2015.
Figure 1. Correlation between atmospheric corrosion rate of mild steel and
atmospheric salinity.
Most cities in New Zealand are coastal, and many buildings are within 5 km of the sea.
Previous BRANZ studies suggest that sea salt-mediated corrosion rates at a distance of
approximately 20 km and more inland in New Zealand were higher than those obtained
on continental land masses (Duncan & Balance, 1988).
2.1.7 Hydrogen sulphide
Hydrogen sulphide (H2S) is corrosive to most metals – for example, copper (Cu), iron
(Fe), lead (Pb), silver (Ag) and zinc (Zn) – with the formation of sulphides and/or
sulphates with poor protection (Lenglet et al., 1995; Tran, Fiaud, Sutter & Villanova,
2003).
7Study Report SR457 Positional material deterioration over the building envelope
In New Zealand, H2S is often encountered within and close to geothermal areas – for
example, within the Taupo Volcanic Zone of the North Island. Distribution and
dispersion of H2S is influenced by a multitude of factors, including surface terrain and
weather conditions. H2S has a higher density than air, and therefore it tends to
accumulate and concentrate in low-lying areas with limited air movement.
2.1.8 Sulphur dioxide
Sulphur dioxide (SO2) has a high solubility in water and can react with sunlight,
oxygen, dust particles and water to form sulphurous acid (H2SO3), sulphuric acid
(H2SO4) and sulphate (SO42-) aerosol. The presence of sulphate ions on iron and steel
leads to the formation of iron sulphate (FeSO4), which can be hydrolysed to release
sulphate ions in an auto-catalytic process (Badea et al., 2011). SO2 can also lead to a
decrease in the critical relative humidity for corrosion initiation. Therefore, SO2 can
cause direct damage to or accelerate the degradation of many building materials, such
as stone, concrete, metal and organic coatings (WBK & Associates Inc., 2003).
2.1.9 Orientation
Under real servicing conditions, materials or components on buildings may face
towards different directions at different angles. Orientation is one of the factors
contributing to environmental material degradation (Jordan, 2010).
Table 1 shows that weathering steel samples fully exposed on the north side of a steel
bridge in the Czech Republic corroded faster than those exposed on the opposite side.
This difference has been attributed to the difference in ToW, which is affected by wind
and solar irradiation (Kreislova, Knotkova, Krivy & Podjuklova, 2009).
Table 1. Corrosion loss of weathering steel samples on a steel bridge.
Corrosion loss (µm)
Position
1 year 4 years 9 years
South 16.8 19.3 17.5
North 21.6 43.6 58.5
Source: Kreislova, Knotkova, Krivy & Podjuklova, 2009.
2.1.10 Inclination
Materials are normally installed at different angles to the horizontal when used on
buildings/structures or when exposed for performance testing (Wypych, 2013).
0° – provides a long wet period and gives a high degree of dirt accumulation.
5° – introduces some water drainage and slightly reduces dirt accumulation on the
skyward surface.
45° – the most commonly used configuration for performance testing.
90° – normally results in the lowest surface temperature, solar irradiation and
wetting period.
Variable angle – allows samples to be exposed at an angle that can compensate for
seasonal differences in the sun’s position according to ASTM E782-95(2015)
Standard practice for exposure of cover materials for solar collectors to natural
weathering under conditions simulating operational mode and ASTM E881-
92(2015) Standard practice for exposure of solar collector cover materials to
natural weathering under conditions simulating stagnation mode.
8Study Report SR457 Positional material deterioration over the building envelope
The corrosion rates of carbon steel samples placed vertically (90°) and inclined at an
angle of 30° with respect to the ground were measured after a 1-year exposure (see
Table 2) (Griffin, 2006). The vertically positioned samples always corroded faster than
the 30° inclined samples. This difference was particularly true for the samples closer to
the sea.
Table 2. Corrosion rate ratio of vertical to 30° inclined samples.
Exposure location Corrosion rate ratio – vertical versus 30° inclination
Kearny, NJ 1.25
Vandergrift, PA 1.26
South Bend, PA 1.20
25 m, Kure Beach, NC 1.41
250 m, Kure Beach, NC 1.25
Source: Griffin, 2006.
It was supposed that chloride deposits on the vertically positioned samples could not
be cleaned as effectively as those on the 30° inclined samples. This would promote
corrosion on the vertical sample surface. This mechanism could explain why the
samples exposed 25 m from the sea have a larger corrosion rate ratio when compared
with those exposed further from the sea. However, it is arguable that, although the
vertical samples had a larger effective area for receiving sea salt impinging onto their
surfaces than those positioned at 30°, these salt particles also had a larger probability
of being lost from the surface.
BRANZ’s study in an industrial area showed that the samples positioned at an angle of
45° could corrode at a rate approximately 2 times higher than those vertically
positioned. Samples positioned at 5° always showed the highest corrosion rate among
these three positions. It was believed that water and particulate matter could not be
retained on the 45° inclined surface easily. Meanwhile, on the 5° inclined surface, a
water layer contaminated with PM and other corrosive media could be retained for a
much longer period, thus promoting corrosion.
The major pollutants found in the industrial area tested are SO2, nitrogen oxides (NOx)
and/or particulate matter. The gaseous species could be involved in metal corrosion
when dissolved into water, most commonly rainwater. As such, the retention of
contaminated water on the surface would be a factor critical to metal corrosion.
The different influences of sample orientation on metal atmospheric corrosion in
marine and industrial environments might be a result of the difference in type of
corrosive media and their mechanisms contributing to corrosion.
Building micro-environment
2.2.1 Definition
Three micro-environments have been defined by NZS 3604:2011 (see Figure 2).
Closed – dry, internal location, not subject to airborne salts or rain wetting.
Sheltered – open to airborne salts but not rain washed.
Exposed – open to airborne salts and rain wetting.
9Study Report SR457 Positional material deterioration over the building envelope
Figure 2. Schematics showing closed, sheltered and exposed micro-environments on
buildings according to NZS 3604:2011.
Sheltered might be the most difficult or diverse among these three situations.
Note that the term “hidden” is also used by E2/AS1. It means concealed behind
another element such that no part is visible. This micro-environment is somewhat
similar to “closed” of NZS 3604:2011, but differences still exist.
2.2.2 Monitoring building micro-environment
Functional or structural components can change wind pattern, solar irradiation and/or
rain collection on the building envelope. These changes can further impact surface
deposition and accumulation of airborne pollutants and/or PM.
Wind-driven rain
It has been found that the actual rain load received by materials and components on
building façades was heavily influenced by building geometry and design details – for
example, the size of overhang (Ge & Krpan, 2007, 2009). The presence of an overhang
can reduce the amount of wind-driven rain by approximately 4 times for low-rise
buildings and 1.5 times for high-rise buildings. With respect to high-rise buildings, this
wetting was significantly reduced for the location right underneath the overhang. The
protection area provided by an overhang could extend beyond 2.5 m below the roof
line for high-rise buildings and to half of the height for low-rise buildings. The width of
the overhang has also been shown to significantly influence wall wetting wind-driven
rain (Hubbs & Hircock, 2014; Mohaddes Foroushani, 2013).
10Study Report SR457 Positional material deterioration over the building envelope
Surface deposition
Airborne chloride deposition at locations both in the open and under a purpose-built
shelter have been measured using the wet-candle technique (King & O’Brien 1995).
The ratio of chloride levels in the open to the sheltered conditions is 3, 2.3 and 1.5 for
severe marine, moderate-mild marine and mild marine environments respectively.
Chloride levels in both open and sheltered locations also decrease rapidly with distance
from the sea (see Figure 3).
Source: King & O’Brien, 1995.
Figure 3. Correlation between airborne chloride deposition in open and sheltered
locations and distance from the sea.
The concentration of water-soluble contaminants on a building’s external surface could
change with height (see Figure 4) (Tzanis et al., 2011). This change with height is
particularly obvious with nitrate and sulphate.
F- Cl- SO42- NO3-
Source: Tzanis et al., 2011.
Figure 4. Changes of water-soluble anion concentrations on the surface of copper
installed at different heights of a building.
11Study Report SR457 Positional material deterioration over the building envelope
2.2.3 Corrosivity of micro-environment
Implication of standards
Section 4 Durability of NZS 3604:2011 focuses mainly on the durability of metallic
fastening and fixing components (bolts, nails, screws, nail plates and brackets).
Materials specification in NZS 3604:2011 Table 4.1 to Table 4.3 appears to indicate
that the exposed positions have a higher corrosivity towards steel-based fastening and
fixing components when compared with the sheltered positions. For example, in zones
B and C, structural steel fixings used in the sheltered positions can be protected with
hot-dip galvanized zinc coatings. Meanwhile, only stainless steel fixings can meet
durability requirements in the exposed positions.
Table 20 of E2/AS1 gives guidance on selection of materials for cladding, flashing and
fixing applications. This table indicates that the sheltered positions are more corrosive
than the exposed positions mainly due to the possible deposition of airborne salt
particles on the building component surface. For example, hot-dip galvanized nails
cannot be used in the sheltered positions on buildings in zone C but can be used in the
exposed positions.
E2/AS1 and NZS 3604:2011 use the same approach for material specifications.
However, their actual definitions of the corrosivity for specific building micro-
environments are somewhat different.
Experimental observations
The atmospheric corrosion rates of zinc samples in exposed and sheltered locations
within marine environments have been measured (see Table 3) (Leonard, 2003).
Table 3. Zinc corrosion rates in different marine environments.
Environment Exposure Corrosion rate (µm/year)
Open 1.0
Mild marine
Sheltered 0.9
Open 1.9
Moderate marine
Sheltered 3.9
Open 6.2
Severe marine
Sheltered 15.2
Source: Leonard, 2003.
Note: Detailed description of mild, moderate and severe marine environments was not given.
In a mild marine environment, the corrosion rates measured in both open and
sheltered locations were very similar – 1.0 and 0.9 µm/year respectively. In a severe
marine environment, the corrosion rate measured in the sheltered locations could be
approximately 2.5 times higher than that measured in the open locations.
This observation indicates that shelter could increase corrosion rate. However, this is
only obvious when a large quantity of airborne sea salt particles is produced.
This could be further demonstrated by the correlation between metal corrosion rate
and the level of airborne chloride (see Figure 5) (Griffin, 2006).
12You can also read