Kapuni Green Hydrogen Project - Landscape and Visual Effects Assessment Prepared for Hiringa Energy 8 June 2021 - EPA NZ
←
→
Page content transcription
If your browser does not render page correctly, please read the page content below
Kapuni Green Hydrogen Project
           Landscape and Visual Effects Assessment
                      Prepared for Hiringa Energy

                                      8 June 2021
Document Quality Assurance
Bibliographic reference for citation:
Boffa Miskell Limited 2021. Kapuni Green Hydrogen Project: Landscape and Visual Effects
Assessment. Report prepared by Boffa Miskell Limited for Hiringa Energy.
Prepared by: Boyden Evans
Landscape Architect / Partner
Boffa Miskell Limited
Reviewed by: Rhys Girvan
Landscape Planner / Principal
Boffa Miskell Limited
Status: FINAL Revision / version: 7 Issue date: 8 June 2021
Use and Reliance
This report has been prepared by Boffa Miskell Limited on the specific instructions of our Client. It is solely for our Client’s use for
the purpose for which it is intended in accordance with the agreed scope of work. Boffa Miskell does not accept any liability or
responsibility in relation to the use of this report contrary to the above, or to any person other than the Client. Any use or reliance
by a third party is at that party's own risk. Where information has been supplied by the Client or obtained from other external
sources, it has been assumed that it is accurate, without independent verification, unless otherwise indicated. No liability or
responsibility is accepted by Boffa Miskell Limited for any errors or omissions to the extent that they arise from inaccurate
information provided by the Client or any external source.
Template revision: 20180621 0000
File ref: Kapuni_Green_Hydrogen_Project_Landscape_and_Visual_Effects_Assessment_20210608.docx
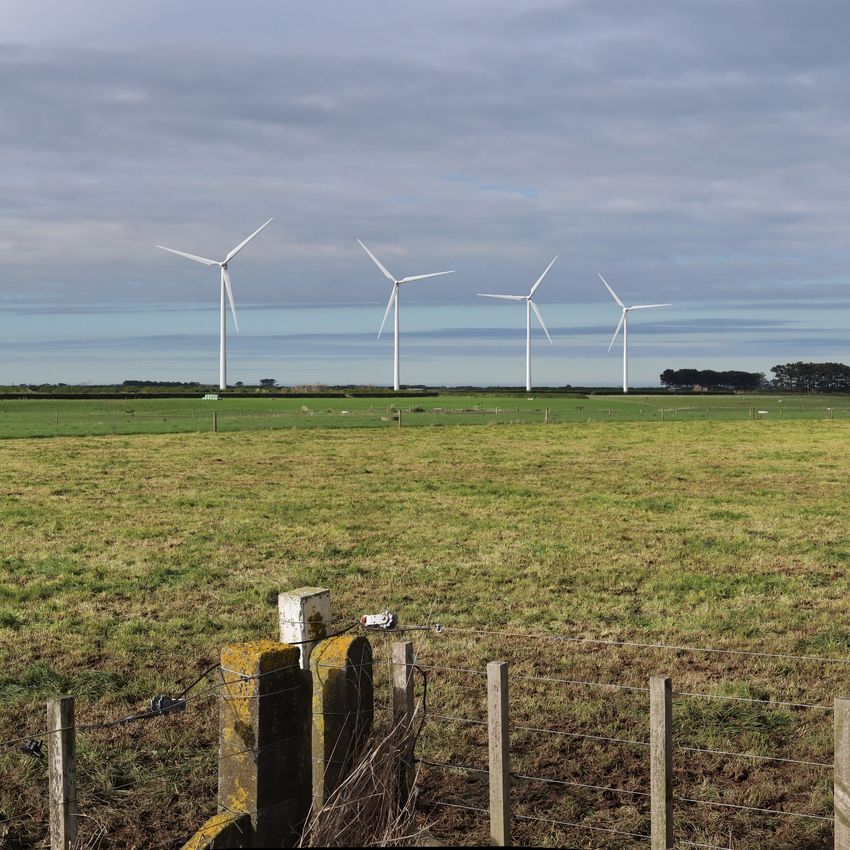
Cover photograph: Turbines of the Kapuni Green Hydrogen project viewed from 2km at the intersection of Manaia and Skeet RoadsExecutive Summary Boffa Miskell Limited (Boffa Miskell) has been engaged by Hiringa Energy Limited (Hiringa) to carry out a landscape and visual effects assessment for the proposed Kapuni Green Hydrogen Project, on farmland near Kapuni, South Taranaki). The Project comprises installation of four, 206m tall three-bladed wind turbines aligned in a north-south direction. The turbines comprise a tapered cylindrical tower, a nacelle with three rotor blades. The turbines will be spaced approximately 360m apart. The hub height will sit at 125m with approximately 80m long rotor blades giving an overall 162 m rotor radius and an overall 206m tip height. Originally, the four turbines proposed were 230m tall three-bladed wind turbines aligned in a north-south direction. The turbines comprised a similar tapered cylindrical tower, a nacelle with three rotor blades and the turbines were spaced approximately 360m apart. The hub height sat at 149m with approximately 80m long rotor blades giving an overall 162 m rotor radius and an overall 230m tip height. However, following micro-siting investigations and advice from turbine suppliers, the configuration of turbines on the proposed site were slightly altered and a shorter tower proposed but the same diameter rotor retained resulting in a 24m lower tip height. This is referred to as the 2.5D layout. The original landscape and visual effects assessment, including the series of visual simulations prepared were based on the original layout and tip height. As a result of the layout and height changes, all the visual simulations were reviewed and assessed as regards to potential changes to the level of landscape and visual effects. Several of the visual simulations from viewing distances at 1km or less have been completely re-done, whereas the visual simulations from greater distances have not been re-done as the level of landscape and visual effects are unchanged. In addition, since the landscape and visual effects assessment was completed in December 2020, ongoing consultation with hapū has resulted in consideration of visual effects from several additional marae not included in the original assessment. Full visual simulations have been completed for three viewpoints adjacent to marae; however, for the four marae viewpoints identified more recently, only wire frame 1 models have been prepared due to the distance of the marae from the wind turbine site. These involved inserting the revised turbine layout and heights into the Windfarm software model and a wire frame image generated from each of the identified marae viewpoints. The wire frame images illustrate the scale of the turbines and their relationship to the viewpoint. Access to the Site will be off Kokiri Road along an existing east-west farm race near the southern site boundary. Access will only require widening of the race in places to enable construction and transportation of turbine 1 Production of wire frames are produced using Windfarm software and are a key step in the preparation of visual simulations. BM191082_Kapuni_Green_Hydrogen_Project_Landscape_and_Visual_Effects_Assessment_20210608
components. Apart from a small section of hedgerow along Kokiri Road to
enable access to the Site no other existing vegetation is required to be
removed.
Creating a new access track along the southern boundary, which is the
preferred landowner option will require some additional culverts.
Hiringa and Ballance Agri-nutrients are developing a wind to hydrogen
project at the nearby Ballance site. The renewable electricity generated by
the four wind turbines will be used to power the Ballance Plant and produce
green hydrogen from electrolysis for production of ammonia / urea and a
hydrogen supply for heavy transport. The power produced by the turbines
will be transmitted to the electrolysis infrastructure adjacent to the Ballance
plant on Palmer Road either by a new underground cable connected to
existing overhead lines in Palmer Road or via a new underground cable.
The Site lies within the volcanic ring plain of the South Taranaki District,
characterised by the andesitic cone of Mt Taranaki, visible across much of
the District. The ring plain forms a gently sloping landscape towards the
coast, merging into both marine terraces and hill country to the east.
Pastoral farming is the dominant land use across the district with dairy
farming the main activity. It is a ‘working’ productive rural landscape
comprising extensive areas of pasture broken up by shelterbelts, boxthorn
hedgerows, small woodlots, and groups of amenity trees across with incised
stream gullies originating from Mt Taranaki. The ring plain currently
accommodates several non-farming, industrial type activities with the Kapuni
Gas Treatment Plant, Kapuni Production Station, the Ballance Plant,
Fonterra plant and the 8 gas well sites, all of which are well established and
contribute to the overall landscape character of the immediate area and also
in relation to the broader ring plain landscape.
The Project will have an adverse effect on landscape character when the
turbines are considered as a small cluster of individual elements, however,
when they are considered in broader context of the simple ‘geometry’ of the
ring plain and the wider South Taranaki district, the effects on landscape
character are attenuated.
The turbines will introduce a new and prominent element into the ring plain
landscape, but they will not visually dominate it, no more so than either the
Kapuni Gas Plant, Ballance Plant or Fonterra Plant do.
The turbines will have an adverse effect on landscape character and while
this will be relatively limited, it does affect the associative values, especially
those expressed by Nga iwi o Taranaki in relation to the maunga and its
connection and influence on the wider landscape.
A summary of the landscape effects of the Project is outlined below:

                  Contributing Factors                             Level of      Nature
                                                                    Effect         of
                                                                                 Effect
 Landform         •    A flat site that that requires minimal
 Effects               landform alteration (i.e. excavation
                       for turbine foundations and
                       construction of a site access track).
                  •    Site access off Kokiri Road will use
                       an existing farm race near the Site’s       Very Low       Neutral
                       southern boundary
                  •    Minor earthworks only to widen races
                       being used for construction access to
                       enable delivery of turbine
                       components and construction traffic
 Vegetation       •    A short section of one hedgerow will
 Effects               need to be removed on the Site to
                       enable construction access but no           Very Low       Neutral
                       other woody vegetation will be
                       removed or affected on the Site or on
                       adjoining areas
 Landscape        •    Turbines will be new elements on the
 Character             ring plain landscape
 Effects          •    For Nga Iwi o Taranaki, the activities
                       on the ring plain are linked physically
                       and metaphysically to the maunga
                  •    Height, scale, form, and dynamic
                       movement of the turbines will affect        Moderate-
                                                                                 Adverse
                       the character of ring plain landscape.,       High
                       albeit a small part of it
                  •    With only four turbines, the spatial
                       extent is limited
                  •    The wind turbines will not adversely
                       affect the continuation of the existing
                       dairy farm with stock able to access
                       to the base of the turbines.

The Site is well separated in terms of distance from the surrounding towns
and settlements and from both SH3 and SH45. The four turbines will have a
wide theoretical visibility because of the low relief of the ring plain and the
wider South Taranaki landscape. The scale of Mt Taranaki is however the
dominant element in this landscape and its presence provides an overall
context.
At 206m tip height (i.e. when the blade is standing vertically) there are no
other built elements of that height or scale on the ring plain. In addition, the
form of the turbines and their dynamic movement also contribute to their
visibility.

BM191082_Kapuni_Green_Hydrogen_Project_Landscape_and_Visual_Effects_Assessment_20210608
The Project has a large potential visual catchment and the viewing audience
is varied, comprising residents on the surrounding farms and rural properties
and those residing in the various small settlements and towns around the
district. There are also those people who work in the various industries and
workplaces in the settlements and in the countryside, along with the transient
viewing audience; people who are driving, cycling or walking to and from
work, on route to shopping or errands, participating in recreational activities,
visiting friends, or driving for pleasure.
This wind energy project is significantly different to others developed
elsewhere in New Zealand in that it comprises only four wind turbines. Four
turbines situated within this flat, open landscape is not an issue per se,
despite the height and scale of the turbines because the receiving landscape
can absorb structures of this height. This situation is similar but in a different
way to how the landscape has absorbed the large footprints and bulk and
scale of both the Kapuni Gas Plant and Ballance Plant. The visual
relationship between the turbines and Mt Taranaki as the backdrop is the
primary issue. Depending where the viewer is situated on the ring plain the
nature of the visual relationship with the mountain changes.
The four turbines contrast with the other landscape elements because of
their height, form, and dynamic movement in the open, flat, rural landscape.
Despite that the turbines dwarf the other vertical elements on the ring plain,
the even, flat, and gently rising topography that extends to the base of the
mountain provides a broad horizontal scale that can accommodate large
scale elements. In other words, the turbines will appear in scale with the
landscape as a whole and they are visually anchored and absorbed by the
landscape.
Adverse visual effects will be experienced from a limited number of private
properties; on site assessments were made and visual simulations prepared
from a representative range of these private properties and a summary of
the visual effects from these is in the table below. The visual effects from
these properties are primarily those with an open and panoramic view of Mt
Taranaki from the internal and/or external living areas. However, many
landowners of these properties have extensively planted around their
dwellings for wind protection and enclosure and thus views towards the
maunga or towards the turbines are screened.
Private viewpoints: Summary of visual effects
Viewpoint Location Level of Nature of
Number Visual Effect
Effects
H6 Meyer Property, Kokiri Road High Adverse
H14 Lawn Farm, Manaia Road Moderate Adverse
H18 Smith & Sutton Property, Manaia High Adverse
Road
H29 Delvin / Poole Property, Skeet Road Moderate Neutral
H88 Smith Property, Inaha Road High Adverse
H108 Johnston Property, Thomas Road Moderate AdverseAt viewing distances of 2km or less, the visual effects are generally
moderate, sometimes greater but beyond this the visual effects rapidly
diminish. At distances of 3-5+km, the homogeneity and dominant horizontal
nature of the ring plain mean that the turbines are generally visually
absorbed into the wider landscape.
From the roads and from other public areas, the views are transient and
ever-changing as the viewer moves through the landscape; weather
conditions also have a major influence on visibility and the level of visual
effects. It is only from a few locations and from distances less than 2 km
where views are adversely affected to any degree and then only when the
turbines sit directly in front of Mt Taranaki and in conditions when the
maunga is visible.
Public Viewpoints: Summary of Visual Effects
Viewpoint Location Level of Nature of
Number Visual Effect
Effects
P1 Upper Glenn Road Low Adverse
P2 Intersection of Normanby Road Low Adverse
and Manaia Road
P3 Junction of Normanby Road and High Adverse
Kokiri Road
P4 Intersection of Normanby Road Low Adverse
and Tito Road (Okaiawa)
P5 Manaia Sports Park, Manaia Low Adverse
P6 TSB Sports Hub, Hawera Low Neutral
P7 Hawera Aerodrome Low Neutral
P8 Intersection of Manaia Road and Moderate Adverse
Skeet Road
P9 Eltham Road, east of Kaponga Low Neutral
Given the height of the turbines, there is very limited opportunities to mitigate
adverse visual effects. Tree planting on the Site is neither feasible nor
desirable. Tree planting close to the viewpoint can provide effective
screening similar to that which occurs in relation to viewpoint R-10 (Delvin /
Poole, located 1.6km north of the Site). For those properties where such
existing screen planting does not occur and the visual effects are high,
landowners could be offered tree planting. Such planting would be subject
to the wishes and agreement of affected property owners and would typically
involve planting of shelterbelts or stands of amenity trees at suitable
distances between the dwelling and the wind turbines.
Compared to wind farms developed in various parts of New Zealand, the
effects of the four Kapuni turbines on the biophysical landscape (i.e.
landform and vegetation) will be minimal because of the flat topography, the
low level of landscape modification and that no existing vegetation will be
removed.
While the turbines will be prominent when viewed from various places on the
ring plain, the nature and scale of the landscape is such that the four
BM191082_Kapuni_Green_Hydrogen_Project_Landscape_and_Visual_Effects_Assessment_20210608turbines can be successfully accommodated without significant adverse
landscape and visual effects.
As noted, the maunga and its connection and influence on the wider
landscape holds special value to Nga iwi o Taranaki and siting of the
turbines in key viewshafts across the ring plain will result in adverse cultural
landscape effects. Assessments were carried out in relation to three marae,
but four other generally more distant marae locations have not been visited
and assessments made. Instead, for these marae locations, wire frame
models have been generated that illustrate the scale of the turbines from
these viewpoints and their contextual relationship to Mt Taranaki.
Marae viewpoints: summary of visual effects
Viewpoint Location Level of Nature of
Number Visual Effect
Effects
H71 Te Aroha Marae, Inaha Road High Adverse
H109 Aotearoa Marae, Hastings Road Low Adverse
H111 Waiokura Marae, Winks Road Low Adverse
H112 Mawhitiwhiti Marae, Omahuru Road N/A N/A
H113 Oeo Pa, South Road N/A N/A
H114 Okare ki Uta Marae, Taikatu Road N/A N/A
H115 Tawhitinu Marae, South Road N/A N/ACONTENTS
Executive Summary i
1.0 Introduction 1
2.0 Description of the Existing Environment 2
2.1 Landscape Context 2
2.2 Site Description 4
3.0 Project Description 5
4.0 Statutory Provisions 6
4.1 Resource Management Act 6
4.2 Taranaki Regional Policy Statement 6
4.3 South Taranaki District Plan 7
5.0 Landscape and Visual Effects 8
5.1 Assessing Landscape Effects 9
5.2 Assessing Visual Effects 10
5.3 Shadow Flicker 12
5.4 Nature of Effects 13
5.5 Assessing the Overall Level of Effects 13
6.0 Associative Landscape Values 14
7.0 Assessment of Landscape and Visual Effects 16
7.1 Landscape Effects 17
7.2 Visual Effects 18
7.3 Summary of Landscape and Visual Effects 31
8.0 Measures to Avoid, Remedy and Mitigate Effects 35
9.0 Conclusions 36
10.0 References 38
Appendices
Appendices 1, 2 and 3 are in the Graphic Supplements
Appendix 4: Dwelling Inventory: Visual Effects 1
BM191082_Kapuni_Green_Hydrogen_Project_Landscape_and_Visual_Effects_Assessment_20210608List of Tables
Table 1: Consideration of Landscape Effects ................................................9
Table 2: Consideration of Visual Effects .......................................................11
Table 3: Nature of Effects .............................................................................13
Table 4: Determining the overall level of landscape and visual effects .......13
Table 5: Evolution of Wind Turbine Development in New Zealand
Wind Farms .................................................................................16
Table 6: Landscape effects ...........................................................................18
Table 7: Public Viewpoints ...........................................................................22
Table 8: Public Viewpoints: Summary of Visual Effects ...............................26
Table 9: Private Viewpoints .........................................................................27
Table 10: Private viewpoints: Summary of visual effects ............................31
Graphic Supplement
Appendix 1: Public Locations
Appendix 2: Private Locations
Appendix 3: Marae Locations1.0 Introduction
Boffa Miskell Limited (Boffa Miskell) was engaged by Hiringa Energy Limited (Hiringa) to carry
out a landscape and visual effects assessment for the proposed Kapuni Green Hydrogen
Project, which involves the development of four wind turbines on farmland near Kapuni, South
Taranaki (Figure 1). Hiringa and Ballance Agri-nutrients are developing a wind to hydrogen
project at the nearby Ballance site. The renewable electricity generated by the four wind
turbines will be used to power the Ballance industrial plant and produce green hydrogen from
electrolysis for production of ammonia / urea and a hydrogen supply for heavy transport. The
power produced by the turbines will be transmitted to the electrolysis infrastructure adjacent to
the Ballance plant on Palmer Road either by a new underground cable connected to existing
overhead lines in Palmer Road or via a new underground cable.
The four wind turbines will produce 24MW on a 227 ha. block of land owned by PKW Parininihi
ki Waitotara Farms Limited Partnership (PKW) Trust (the Site). Wind speed and direction
analysis by Hiringa has been carried out and the four turbines are orientated in a north-south
direction to maximise power output from the predominant westerly wind.
The proposed Kapuni Green Hydrogen Project (the Project) is different in several ways from
the erection of turbines to capture wind energy that have been developed elsewhere in New
Zealand because:
• Of how the power will be used (i.e. production of green hydrogen).
• It will supply power primarily to a single user; and
• It is located on a ‘flat’ site on the Taranaki ring plain as opposed to on elevated sites such
as hilltops and ridgelines.
This landscape and visual effects assessment considers the Project in terms of the broader
landscape and in relation to the local landscape and the individual properties and communities.
This assessment addresses the following aspects:
(i) A description and appraisal of the existing landscape, including its physical, perceptual,
and associative factors.
(ii) Overview of the statutory provisions in relation to landscape and visual matters in the
Taranaki Regional Policy Statement and the South Taranaki District Plan.
(iii) An assessment of the wind turbines on the biophysical aspects such as effects on
landforms and vegetation.
(iv) An assessment of the effects of the wind turbines on landscape character.
(v) An assessment on any outstanding natural features and landscapes, including:
(vi) An assessment of visual effects; and
(vii) An assessment of the proposed power transmission.
Boffa Miskell Ltd | Kapuni Green Hydrogen Project | Landscape and Visual Effects Assessment | 8 June 2021 12.0 Description of the Existing Environment
2.1 Landscape Context
A technical landscape assessment for South Taranaki was completed in 2014 2 to help inform the
review of the South Taranaki District Plan. The South Taranaki District comprises approximately
358,000 ha along the west coast of the North Island. It encompasses the northern extent of the
South Taranaki Bight and includes the southern and western areas of Mt Taranaki. The eastern
area of the district also extends into a larger area of rugged hill country which continues into the
Whanganui District and encompasses part of Whanganui National Park.
At a broad scale, the landforms of South Taranaki comprise three main elements:
• Mt Taranaki volcano and its surrounding ring plain.
• The folded soft rock sediments of the hill country; and
• The sequence of uplifted sedimentary marine terraces along the southern coastal area.
A transition from the volcanic ring plain into more gently rolling areas of hill country and the
presence of coastal sands on part of the marine terraces are also evident in association with
these three overarching landform elements.
The proposed Kapuni Green Hydrogen Project is located on the ring plain, which has a uniform
elevation graduating in distinguishable bands from the base of the volcanic cone (Figure 2).
The ring plain forms a gently sloping landscape which merges into both marine terraces and hill
country to the east.
Mt Taranaki at 2518 masl forms a distinctive backdrop to the ring plain. The andesitic volcanic
cone dominates the South Taranaki landscape and is visible throughout much of the district. In
parts, the ring plain is comprised of lahar (volcanic mudflow), debris flow and tephra
(fragmented volcanic material) deposits and includes distinctive rounded lahar mounds.
The high rainfall experienced on Mt Taranaki also provides the source of many of the rivers
which radiate through the ring plain and flow through parts of the adjoining hill country (Figure
2). Mt Taranaki has a significant effect on the climate on the ring plain with the mountain often
shrouded in cloud.
While native forest covers an area of 9.6km radius from the summit, the ring plain is largely
devoid of native vegetation cover. However, many of the stream gullies across the ring plain
have been fenced and the stream margins planted with native vegetation.
Originally Taranaki was one of the most densely forested areas of New Zealand, which included
extensive totara-broadleaf forest spread across the ring plain and connecting with broad
swathes of rimu and tawa across the inland hills. Maori occupation began around 1250-1300
AD during which the clearance of some of the original forest began, particularly along the
coastline. The arrival and settlement of Europeans saw the clearance of most of the remaining
coastal forests alongside much of the existing rimu and tawa forests extending into the inland
hill country. This subsequently enabled the establishment of significant areas of dairy farming
which has formed the basis of Taranaki’s economy since the 1880s. In the 1960s the oil and
gas industry has undergone major development in South Taranaki and has had a significant
influence on Taranaki’s landscape and economy. The Kapuni Gas Treatment Plant, Kapuni
2
South Taranaki Landscape Assessment, 2014, prepared by Boffa Miskell Limited for South Taranaki District Council
2 Boffa Miskell Ltd | Kapuni Green Hydrogen Project | Landscape and Visual Effects Assessment | 8 June 2021Production Station, the Ballance Agri-nutrients Plant, and the Fonterra plant are major industrial
developments in the area and there are also gas well sites distributed across the ring plain
(Figures 3 and 5).
However, pastoral farming is the dominant land use across the district with dairy farming the
main activity. It is a ‘working’ productive rural landscape comprising extensive areas of pasture
broken up by shelterbelts, boxthorn hedgerows, small woodlots, and groups of amenity trees
with incised stream gullies originating from Mt Taranaki.
Dwellings, mostly single level are distributed across the ring plain and generally surrounded by
shelterbelts, hedgerows, and amenity planting to provide wind protection and enclosure,
especially from the dominant westerly wind (Figure 3).
The ring plain has been extensively modified, initially by extensive agricultural development,
which has been further changed in places with the advent of oil and gas development. In broad
terms, it is a landscape composed of clearly definable elements with the ring plain extending out
around the base of the mountain making it a landscape easy to understand and navigate.
South Taranaki Landscape Study
The 2014 landscape assessment subdivided the district into three landscape character types
and eleven landscape character areas. The volcanic ring plain, which is one of the three
landscape character types identified, is subdivided into four landscape character areas – Mt
Taranaki, Pungarehu in the north, Manaia the central section, and Waingongoro in the south
(Figure 4).
The Project is situated in the Manaia landscape character area (Figure 4), which extends to the
south of Mt Taranaki and is generally flatter and typically lacks the pattern of lahar mounds that
are evident to the north-west. SH 3 to west and SH 45 (the Surf Highway) traverse this
character area with a grid road network throughout. The field subdivision follows a similar grid-
like pattern, which contrasts with the radial stream pattern that extends across the ring plain.
The assessment records the ‘Key Characteristics’ for the Manaia landscape character area as:
“Flattened area of volcanic ring plain with strong radial stream pattern extending towards
the coastline from Mount Taranaki
• Low level laharic cliffs along exposed coastal edge
• Predominately free draining productive soils accommodating dairy, cropping and
horticultural use
• Boxthorn hedges along paddock boundaries with areas of riparian vegetation along
stream corridors
• Dispersed rural settlement pattern associated with agricultural use and small rural
service towns accessed along a gridded rural road network
• Some industry associated with oil and gas extraction established near the coastal edge
and inland.”
The assessment records the ‘Forces of Change’ for the Manaia landscape character area as:
“Smaller farmsteads are increasingly being subsumed by larger land holdings
• Expansion of intensive agricultural or industrial development and associated increase in
scale and modification of character of rural development
Boffa Miskell Ltd | Kapuni Green Hydrogen Project | Landscape and Visual Effects Assessment | 8 June 2021 3• Expansion of existing oil and gas extraction and processing areas along the coastal
edge
• Reintroduction and colonisation of indigenous vegetation along stream margins
• Expansion of coastal lifestyle development associated with existing recreation
opportunities established at Kaupokonui.”
Hawera situated the junction of SH3 and SH45 is the main town and there are several small
settlements along SH 3 (Eltham, Stratford) and SH 45 (Manaia, Opunake). Hawera is located
13.5 km to the south-east, Kapuni is a small settlement located approximately 2 km immediately
to the northwest of the Site, Manaia on SH 45, 5 km immediately to the south of the Site,
Kaponga 7.7 km to the north, and Eltham 15 km to the north-east
The Kapuni Gas Treatment Plant, the Kapuni Production Station, the Ballance Agri-nutrients
plant, and the Fonterra plant are all situated within the Manaia landscape character area and
influence the character of this area. There are also several gas well sites located throughout the
ring plain (Figures 3 and 5).
The landscape assessment also identifies, maps, and describes outstanding natural features
and landscapes in the district; there are none identified in the vicinity of this area of the ring
plain. The assessment also identified ‘Other’ natural areas, features and landscapes but there
are none of these in this category located within the Manaia landscape character area within the
ring plain.
In the section on ‘Landscape Opportunities and Threats’, “energy developments, including oil
and gas wells, production plants and wind farms” are recorded. However, in noting these, the
landscape assessment also notes that,
“Many of these activities are also opportunities in so far as they provide for the reasonable
use of the land for people’s livelihood, lifestyle and/ or recreational activity. The major
threats to landscape values are not so much the activities themselves. It is the location,
nature, scale, design and management of the activities that cause potential threats to
landscape values.”
In the subsequent discussion on the opportunities and threats there is acknowledgement that oil
and gas and the dairy industries have the potential to introduce large scale structures that can
potentially affect the character of the landscape. Wind farms would also fall into this category.
2.2 Site Description
The Site is currently run as a dairy farm. The PKW property is in several titles, comprising 133
ha. on the west side of Kokiri Road where the four proposed turbines are located and 94 ha. to
the east of Kokiri Road. The Site is bounded by several other farm properties; within a 1km
radius of the Site there are 17 separate properties (Figure 6).
Kokiri Road runs between the land parcels. Palmer Road bounds the smaller land parcel to the
east and extends northwards to join Skeet Road located 1.5 km to the north. Normanby Road
is situated 2.6 km to the south, Manaia Road is 1.8 km to the west. Inaha Road extends north
off Normanby Road (Figure 6).
There are four dwellings on the PKW farm property, all of which are located east of the turbines
(Figure 6). A milking shed, various associated outbuildings and structures, including an effluent
disposal pond are situated on the main block of the property with access off Kokiri Road.
4 Boffa Miskell Ltd | Kapuni Green Hydrogen Project | Landscape and Visual Effects Assessment | 8 June 2021A series of farm races traverse the Site and the adjoining properties. While the Site is
essentially flat, there are small undulations and depressions. Small streams which form part of
the network of waterways radiating from Mt Taranaki traverse parts of the Site, Kapuni Stream
to the east of Kokiri Road and Waiokura Stream to the west of the turbine location (Figure 5).
There are several hedgerows across the Site, some running north-south and others east-west.
There is also 400m length of hedgerow immediately east of the proposed turbines. Most of the
dwellings on the site have hedgerows, shelterbelts, or amenity trees around along part of their
boundaries.
3.0 Project Description
The original Kapuni Green Hydrogen Project comprised installation of four 230m m tall three-
bladed wind turbines aligned in a north-south direction and spaced approximately 360m apart.
The hub height was at 149m with approximately 80m long rotor blades giving an overall 162m
rotor diameter (Figure 6) and an overall 230m tip height. The original landscape and visual
effects assessment completed in December 2020 was carried out based on this turbine layout
and height.
However, further turbine micro-siting investigations were carried out and a slightly amended
turbine configuration adopted, together with a shorter turbine tower but the length of the rotor
blades unchanged (Figure 6). This is referred to as the ‘2.5D layout’. The Project now
comprises installation of four, 206 m tall three-bladed wind turbines aligned in a north-south
direction. This north-south linear arrangement ensures that the turbines effectively harness the
dominant westerly winds. The turbines comprise a tapered cylindrical tower and a nacelle with
three rotor blades. The turbines will be spaced approximately 360m apart. The hub height will
sit at 125m with approximately 80m long rotor blades giving a rotor diameter of 162m and an
overall 206m tip height (Figure 6)
The turbines will produce 24MW of power, which will be used to supply power to the nearby
Ballance Plant, where following an electrolysis process it will produce 5MW of hydrogen gas,
which will be used in the production of ammonia at the plant. Water required as part of the
electrolysis process will be sourced from Waingongoro Stream, which Ballance already has a
consent for. The four turbines will be connected to the national grid and any excess power not
required at the Ballance Plant will be exported to the grid.
From the wind data that Hiringa have been collecting at the Site since 2019, the expected turbine
capacity factors will be equivalent to, if not better than, some of the best onshore wind farms in
the world.
Each turbine site will require a reinforced concrete foundation (22.8m wide and 3.495m deep).
Overall volumes of disturbance on the Site will be in the order of 21,000-25,000 m3 and
approximately 4,000 to 5,000m3 of excavated material from each turbine foundation, some of
which will be used as backfill and the balance disposed in various places on the PKW property
or disposed off-site.
The turbine towers, nacelle and rotors will be all be painted off-white / light grey matt finish (RAL
7035). In accordance with CAA regulations each turbine will have a red light at each hub. The
regulations also require that each turbine has a light in the tower centre (front and back) to allow
360-degree viewing.
Boffa Miskell Ltd | Kapuni Green Hydrogen Project | Landscape and Visual Effects Assessment | 8 June 2021 5A 5m by 10m substation and switch rooms (i.e. footprint of 20-foot container) will be built near
the base of turbine 3. An underground cable from the turbines will connect to the substation to
the Ballance Plant. Option 1 involves the cable running from the turbines eastward across the
PKW farm and then across Kokiri Road and then finally to connecting to the 33kV Powerco
network lines running along the west side of Palmer Road. Option 2 provides a new direct 33kV
line to the Ballance Kapuni Plant and requires an easement with a single landowner (Figure 5).
Given the Site’s flat topography, only minor earthworks will be required to provide construction
access to the Site. There are two access options to the Site, one is to use the existing east-
west farm race into the Site and the other option is to create a new east-west track along the
southern boundary of the PKW farm. From there, farm races will be used to access each
turbine site. The races will be widened with an improved hardstand surface and short sections
of hardstand will be constructed between some of the turbines. The existing shelterbelt and
hedgerows within the farm will not be removed or altered.
Creating a new access track along the southern boundary, which is the preferred landowner
option will require some additional culverts.
The dairy farming operation on the Site will continue following construction of the turbines with
no restrictions on stock access or movement.
4.0 Statutory Provisions
4.1 Resource Management Act
Part 2 matters pertinent to landscape and visual aspects are sections 5, 6(a), 6(b), 7(c) and 7
(f). Section 5 sets out the purpose of the RMA, which is to promote sustainable management
and section 6 sets out matters of national importance. While culverts will be installed as part of
the access track across the Site to the turbine locations, the Project will not adversely affect the
preservation of the natural character of the coastal environment, rivers, lakes and wetlands and
their margins (s6 (a) and it is not located in an identified outstanding natural feature or
landscape (s6 (b)).
Section 7 (c) concerns the maintenance and enhancement of amenity values and s7 (f) the
maintenance and enhancement of the quality of the environment.
4.2 Taranaki Regional Policy Statement
The Taranaki Regional Policy Statement 2010 (RPS) sets out the wider landscape and natural
character policy provisions for the region.
Chapter 10 of the RPS sets out relevant policy in relation to natural features and landscapes
with NFL Policy 1 specifically relating to identified outstanding natural features and landscapes.
Such areas are referred to as those features or landscapes of exceptional value or eminence or
distinction at a national, regional or district level.
The RPS refers to the outstanding natural features and landscapes within South Taranaki as
including Mt Taranaki and parts of the distinctive lahar mounds of the ring plain. In addition to
outstanding natural features and landscapes, the RPS also identifies that recognition shall be
6 Boffa Miskell Ltd | Kapuni Green Hydrogen Project | Landscape and Visual Effects Assessment | 8 June 2021given to other natural features and landscapes which are not outstanding but still of value to the
region for values which include natural character, amenity, heritage values, scientific and
educational significance (NFL Policy 2).
NFL Policy 3 lists the criteria in relation to the protection of outstanding and where appropriate
other natural features and landscapes of value and under (d) refers to
“the extent to which the subdivision, use or development recognises or provides for the
relationship of tangata whenua and their culture and traditions with their ancestral lands,
water, sites, wâhi tapu and other taonga;”
In relation to the protection of amenity values, AMY Policy 1 refers to avoiding adverse effects
of resource use and development on rural amenity values and lists the qualities and
characteristics that contribute to amenity values in the Taranaki region.
As noted above, the Site is not located in an outstanding landscape but given that Mt Taranaki
is an ONFL and its significance to tangata whenua and the recognition that it is given in Te
Anga Putakerongo / Record of Understanding between Nga iwi o Taranaki and the Crown, the
potential landscape effects of the Project on Mt Taranaki need to be considered.
4.3 South Taranaki District Plan
As noted earlier, the Project is unusual, in that unlike other wind energy projects elsewhere in
New Zealand, it is not a wind farm comprising many wind turbines situated over an extensive
land area, generally hill country, but instead it comprises a row of just four evenly spaced wind
turbines situated on a flat site.
The Site is in the Rural Zone. The South Taranaki District Plan sets out the objectives and
policies for activities in the Rural zone. As noted above, industrial type land use activities
already operate in the Rural zone, including in the Manaia landscape character area identified in
the South Taranaki Landscape Assessment.
Policy 2.1.9 addresses the character and amenity of the rural environment and Policy 2.1.11
provides for the establishment and operation of new non-farming activities provided they avoid,
remedy, or mitigate adverse effects, including reverse sensitivity effects.
Agricultural farming is the dominant activity throughout the wider district and as a separate land
use activity, wind farms fit comfortably into the rural environment. Farming can continue
unaffected by the operation of a wind farm, especially given the minimal level of earthworks and
other changes that are required for the wind farm to successfully operate.
The small number of turbines and their linear configuration limit the area occupied by the wind
farm without any restriction around the curtilage, minimising the amount of quality farmland
removed from traditional agricultural production.
The district plan provisions also recognise the significance and value of renewable energy
resources and Objective 2.9.6 specifically provides for this. Potential adverse landscape and
amenity effects of renewable energy development and activities are to be avoided, remedied, or
mitigated (Objective 2.9.7). Where they are unable to avoided, remedied, or mitigated other
measures can be employed such as offsetting and/or environmental compensation (Policies
2.9.13 and 2.9.21).
Boffa Miskell Ltd | Kapuni Green Hydrogen Project | Landscape and Visual Effects Assessment | 8 June 2021 75.0 Landscape and Visual Effects
While landscape and visual effects assessment are closely related, they form separate
procedures. The assessment of the potential effects on the landscape forms the first step of
this process and is carried out as an effect on landscape elements and features and on
landscape character. The assessment of visual effects considers how the changes to the
physical landscape affect the viewing audience.
Landscape and visual effects are influenced by individual attitudes and perceptions. This
landscape and visual assessment is an expert technical assessment and does not presume to
represent the opinions and views of individuals
The first wind farms were developed in New Zealand over 20 years ago and are now a familiar
part of the landscape in several parts of New Zealand. In comparison to many other parts of the
world, New Zealand was ‘late’ in harnessing wind energy because of the successful and
widespread development of hydroelectric power.
Most of New Zealand’s wind farms are situated on elevated locations along ridges and hilltops
and most comprise large groups of turbines developed by the various large energy companies.
Many of New Zealand’s wind farm have the highest energy yields in the world. The
development of small wind farms with few turbines suits New Zealand’s topography and
population distribution but very few of these have been developed, unlike to what has occurred
in several other countries.
The Project, while a small development in terms of the number of turbines, is different to other
wind energy projects developed in New Zealand in how the energy that is produced by the
turbines will be converted to hydrogen through an electrolysis process and the hydrogen used in
the Ballance Plant and in fuelling heavy vehicles associated with the plant.
A considerable body of international research has been carried out in relation to public attitudes
to wind farms and wind turbines, much of which has focused on wind farms with large numbers
of turbines developed by commercial generators. Attitudes to wind farms vary depending on a
range of factors, depending on personal philosophy, whether the person is resident in the area,
a passer-by or comes to the area for recreation.
Research has shown that there is a preference for smaller, clustered groups of turbines over
larger-scale installations, and that smaller numbers of large turbines are considered preferable
to larger numbers of smaller turbines (Devine‐Wright, 2005; Barry et al, 2009; Stephenson et al
2010). In a paper by Barry et al (2009) it noted that many communities in New Zealand have
shown resistance to large wind farm developments and that small wind farms in community
ownership may be attractive to gaining community support.
Several international studies have shown that negative public opinion can be high during the
planning stage of a wind farm and significantly lower after the wind farm has been built (Karydis
2013).
From a 2009 survey carried out in New Zealand, there has been a wide range of factors in
submissions lodged in relation to wind farm developments that affected a submitter’s decision to
support or oppose a wind farm proposal (Stephenson, 2009). There is also a perception that
there is widespread support for renewable energy, particularly wind, but that people are not
expressing it formally in their submissions (Stephenson, 2010).
8 Boffa Miskell Ltd | Kapuni Green Hydrogen Project | Landscape and Visual Effects Assessment | 8 June 2021Various studies have investigated the ‘proximity hypothesis’ that those living closest to a wind
farm will have the most negative perception of it, but such attempts have proved unsuccessful
(Devine-Wright, 2005; Stephenson et al 2009). The significance of landscape context is a key
factor in attitudes to wind farms and that the impact of wind farms on landscape values is the
main determining factor in explaining opposition or support (Stephenson, 2009).
Various other factors affect people’s perception of wind farms (e.g. local impacts of
construction, peoples’ perception of the developer, turbine colour, tower design) (Devine-Wright,
2005; Stephenson, 2009).
Surveys of attitudes to wind farms in New Zealand and overseas suggests that communities
hold a range of views, from people who are strongly polarised for or against wind farms, to
those who hold more neutral positions. Attitudes may vary depending on whether one is a
casual passer-by or a resident in the vicinity of a wind farm, and the proximity of a residence to
such a wind farm.
Turbine manufacturers have directed a lot of attention into turbine design, not just to improve
turbine efficiency and output but also in relation to turbine aesthetics (i.e. tapered towers, shape
of the nacelle, blade connections to the hub, all components painted the same colour to provide
uniformity, etc) (Gipe, 2002).
5.1 Assessing Landscape Effects
Assessing landscape effects requires an understanding of the landscape resource and the
magnitude of change, which results from a proposed activity to determine the overall level of
landscape effects. The ability of an area of landscape to absorb change takes account of both
the attributes of the receiving environment and the characteristics of the proposed development.
The magnitude of landscape change judges the amount of change that is likely to occur to
areas of landscape, landscape features, or key landscape attributes. In undertaking this aspect
of an assessment, the size and scale of the change needs to be considered and the duration of
the change, including whether the change is reversible.
Clarity around the factors that have been considered is important, including consideration of any
benefits which result from the proposed development; Table 1 below outlines this process.
Table 1: Consideration of Landscape Effects
Contributing Factors Higher Lower
Ability to The landscape context has The landscape context has
absorb limited existing landscape many detractors and can
change detractors which make it easily accommodate the
(sensitivity)
Landscape
highly vulnerable to the type proposed development without
of change resulting from the undue consequences to
proposed development. landscape character.
The value of the The landscape includes The landscape lacks any
landscape important biophysical, important biophysical,
Boffa Miskell Ltd | Kapuni Green Hydrogen Project | Landscape and Visual Effects Assessment | 8 June 2021 9sensory, and shared and sensory, or shared and
recognised attributes. The recognised attributes. The
landscape requires landscape is of low or local
protection as a matter of importance.
national importance
(ONF/L).
Size or scale Total loss or addition of key Most key features or
features or elements. elements are retained.
Major changes in the key Key characteristics of the
characteristics of the landscape remain intact
Magnitude of Change
landscape, including with limited aesthetic or
significant aesthetic or perceptual change
perceptual elements. apparent.
Geographical Wider landscape scale. Site scale, immediate setting.
extent
Duration and Permanent. Reversible.
reversibility
Long term (over 10 years). Short Term (0-5 years).
5.2 Assessing Visual Effects
To assess the visual effects of a proposed development on a landscape, a visual baseline must
first be defined. The visual ‘baseline’ forms a technical exercise which identifies the area where
the development may be visible, the potential viewing audience, and the key representative
public and private viewpoints from which visual effects are assessed.
The viewing audience comprises the individuals or groups of people occupying or using the
properties, roads, footpaths, and public open spaces that lie within the visual envelope or ‘zone
of theoretical visibility (ZTV)’ of the Site and proposal. The sensitivity of the viewing audience is
assessed in terms of assessing the likely activity and response of the viewing audience to
change and understanding the value attached to views.
The term ‘Zone of Theoretical Visibility’ (ZTV) is used to describe the area over which a
development can theoretically be seen and is based on a Digital Terrain Model (DTM) and
overlaid on an appropriate map base. It is also known as a Zone of Visual Influence (ZVI),
Visual Envelope Map (VEM) or Viewshed Map. However, the term ZTV is preferred for its
emphasis on two key factors:
• Visibility maps represent where a development may be seen theoretically – that is, it may
not actually be visible due to localised screening of trees and other vegetation and
structures, which are not represented by the DTM; and
• The maps indicate potential visibility only - that is, the areas within which there may or will
be a line of sight. They do not convey the nature or significance of visual impacts, for
example whether visibility will result in positive or negative effects and whether these
will be significant or not.
While ZTV analyses are very useful to broadly define the theoretical extent of a viewshed, they
need to be interpreted with caution and considered as an indicative tool to identify features
visible from any given point. It is important to understand the parameters and data used to
10 Boffa Miskell Ltd | Kapuni Green Hydrogen Project | Landscape and Visual Effects Assessment | 8 June 2021generate a ZTV. ZTVs are calculated by computer, using any one of several software packages
and based upon a DTM that represents topography. The resulting ZTV is usually produced as
an overlay upon a base map, representing theoretical visibility within a defined study area.
As the ZTV mapping is based entirely on ‘bare ground’ topographic data, it does not
consider the screening effects of intervening vegetation or structures in the landscape,
unless LIDAR based vegetation data is used to generate the DTM. The level of reliability of the
contour information will influence the accuracy of the mapping. ZTV mapping does, however,
consider factors relating to the curvature of the earth and light refraction. While ZTV is a useful
assessment tool, it is important to recognise it has limitations depending on the level of
information and detail that has been used to generate it.
The assessment of visual effects also considers the potential magnitude of change which will
result from views of a proposed development. This takes account of the size or scale of the
effect, the geographical extent of views and the duration of visual change, which may
distinguish between temporary (often associated with construction) and permanent effects
where relevant. When determining the overall level of visual effect, the nature of the viewing
audience is considered together with the magnitude of change resulting from the proposed
development. Table 2 outlines this process.
Table 2: Consideration of Visual Effects
Contributing Factors Higher Lower Examples
Ability to Views from dwellings Views from places of Dwellings, places of
absorb change and recreation areas employment and other work, transport
where attention is places where the focus corridors, public tracks
The Viewing Audience
typically focused on the is typically incidental to
landscape. its landscape context.
(sensitivity)
Views from transport
corridors.
Value Viewpoint is recognised Viewpoint is not Acknowledged
attached to by the community such typically recognised or viewshafts, Lookouts
views as an important view valued by the
shaft, identification on community.
tourist maps or in art Infrequent visitor
and literature. numbers.
High visitor numbers.
Size or scale Loss or addition of key Most key features of Higher contrast/ Lower
features in the view. views retained. contrast.
Magnitude of Change
High degree of contrast Low degree of contrast Open views, Partial
with existing landscape with existing landscape views, Glimpse views
elements (i.e. in terms elements (i.e. in terms (or filtered); No views
of form scale, mass, of form scale, mass, (or obscured)
line, height, colour, and line, height, colour, and
texture). texture.
Full view of the Glimpse / no view of
proposed development. the proposed
development
Geographical Front on views. Oblique views. Front or Oblique views.
extent Near distance views, Long distance views. Near distant, Middle
change visible across a Small portion of change distant and Long
wide area. visible. distant views
Boffa Miskell Ltd | Kapuni Green Hydrogen Project | Landscape and Visual Effects Assessment | 8 June 2021 11Contributing Factors Higher Lower Examples
Duration and Permanent. Transient / temporary. Permanent (fixed),
reversibility Long term (over 15 Short Term (0-5 years). Transitory (moving)
years).
5.3 Shadow Flicker
Shadow flicker is caused by the rotation of turbine blades, which cast intermittent shadows that
appear to ‘flicker’ as the sun passes behind the turbine blades. This is most apparent when the
shadow passes across most typically a window of a dwelling. The duration of this effect can be
calculated using the geometry of the turbine and the relative locations of the turbine and the
receptor (i.e. through window or similar). The likelihood of the effect occurring, and the duration
and intensity of such an effect depends upon several factors:
• the distance of the dwelling from the turbine.
• the orientation of the dwelling relative to the turbine.
• the height and rotor diameter of the turbine.
• the time of day and time of year.
• the prevailing wind direction.
• the frequency of sunshine hours (i.e. cloud free days).
• the nature of the intervening terrain between dwelling and turbine.
• the impact of any intervening vegetation and/or structures.
International guidelines state that acceptable levels of exposure are deemed to be either:
• Acceptable Level = 30 hours per year (modelled)
• Acceptable Level = 30 minutes per day - actual (i.e. measured).
The attached Graphic Supplement in Appendix 2 sets out further details on the shadow flicker
assessment, including the assessment methodology and used to determine shadow flicker and
maps and diagrams to describe and illustrate the outcomes for this Project.
The results of the shadow flicker calculations are mathematically derived and are therefore
theoretical worse case scenarios. The calculations also include the following assumptions:
i) weather conditions are such that shadows are always cast (i.e. sunny at all times
of the day and throughout the year).
ii) the rotors are facing directly towards the ‘receptor’ at all times, meaning they are
at their “worse case” orientation (i.e. at their maximum size and sweep).
In practice, the shadow flicker effects would occur on considerably fewer days than this.
Shadow flicker has been considered in terms of visual effects for those properties and dwellings
within the assessment area (Figure 14).
12 Boffa Miskell Ltd | Kapuni Green Hydrogen Project | Landscape and Visual Effects Assessment | 8 June 20215.4 Nature of Effects
In combination with assessing the level of effects, the landscape and visual effects assessment
also considers the nature of effects in terms of whether this will be positive (beneficial) or
negative (adverse) in the context within which it occurs. Neutral effects can also occur where
landscape or visual change is benign.
A change in a landscape does not, of itself, necessarily constitute an adverse landscape or
visual effect. Landscape is dynamic and is constantly changing over time in both subtle and
more dramatic transformational ways; these changes are both natural and human induced.
What is important in managing landscape change is that adverse effects are avoided or
sufficiently mitigated to ameliorate the effects of the change in land use. The aim is to provide a
high amenity environment through appropriate design outcomes. Table 3 below outlines this.
Table 3: Nature of Effects
Nature of effect Use and Definition
Adverse (negative): The activity would be out of scale with the landscape or at odds with
the local pattern and landform which results in a reduction in
landscape and / or visual amenity values
Neutral (benign): The activity would be consistent with (or blend in with) the scale,
landform and pattern of the landscape maintaining existing
landscape and / or visual amenity values
Beneficial (positive): The activity would enhance the landscape and / or visual amenity
through removal or restoration of existing degraded landscape
activities and / or addition of positive elements or features
5.5 Assessing the Overall Level of Effects
The overall level of effects is based on a 7-point rating scale, which is based on the NZILA Best
Practice note as set out in Table 4 below.
Table 4: Determining the overall level of landscape and visual effects
Effect Rating Use and Definition
Very High: Total loss of key elements / features / characteristics, i.e.
amounts to a complete change of landscape character in views.
High: Major modification or loss of most key elements / features /
characteristics, i.e. little of the pre-development landscape
character remains and a major change in views. Concise Oxford
English Dictionary Definition
High: adjective- Great in amount, value, size, or intensity.
Boffa Miskell Ltd | Kapuni Green Hydrogen Project | Landscape and Visual Effects Assessment | 8 June 2021 13You can also read