Intense windstorms in the northeastern United States - CentAUR
←
→
Page content transcription
If your browser does not render page correctly, please read the page content below
Intense windstorms in the northeastern
United States
Article

Published Version

Creative Commons: Attribution 4.0 (CC-BY)

Open Access

Letson, F. W., Barthelmie, R. J., Hodges, K. I. and Pryor, S. C.
(2021) Intense windstorms in the northeastern United States.
Natural Hazards and Earth System Science, 21 (7). ISSN
1684-9981 doi: https://doi.org/10.5194/nhess-21-2001-2021
Available at http://centaur.reading.ac.uk/94536/

It is advisable to refer to the publisher’s version if you intend to cite from the
work. See Guidance on citing .
To link to this article DOI: http://dx.doi.org/10.5194/nhess-21-2001-2021

Publisher: European Geosciences Union

All outputs in CentAUR are protected by Intellectual Property Rights law,
including copyright law. Copyright and IPR is retained by the creators or other
copyright holders. Terms and conditions for use of this material are defined in
the End User Agreement .

www.reading.ac.uk/centaur

CentAUR
Central Archive at the University of Reading
Reading’s research outputs online
Nat. Hazards Earth Syst. Sci., 21, 2001–2020, 2021
https://doi.org/10.5194/nhess-21-2001-2021
© Author(s) 2021. This work is distributed under
the Creative Commons Attribution 4.0 License.

Intense windstorms in the northeastern United States
Frederick W. Letson1 , Rebecca J. Barthelmie2 , Kevin I. Hodges3 , and Sara C. Pryor1
1 Departmentof Earth and Atmospheric Sciences, Cornell University, Ithaca, New York, USA
2 SibleySchool of Mechanical and Aerospace Engineering, Cornell University, Ithaca, New York, USA
3 Environmental System Science Centre, University of Reading, Reading, United Kingdom

Correspondence: Frederick W. Letson (fl368@cornell.edu) and Sara C. Pryor (sp2279@cornell.edu)

Received: 16 October 2020 – Discussion started: 11 December 2020
Revised: 27 April 2021 – Accepted: 12 May 2021 – Published: 2 July 2021

Abstract. Windstorms are a major natural hazard in many           serial clustering, which is in contrast to the relatively strong
countries. The objective of this study is to identify and char-   serial clustering of windstorms in Europe.
acterize intense windstorms during the last 4 decades in the
US Northeast and determine both the sources of cyclones re-
sponsible for these events and the manner in which those
cyclones differ from the cyclone climatology. The wind-           1     Introduction
storm detection is based on the spatial extent of locally ex-
treme wind speeds at 100 m height from the ERA5 reanalysis        1.1    Hazardous wind phenomena
database. During the top 10 windstorms, wind speeds exceed
their local 99.9th percentile over at least one-third of land-    Hazardous wind phenomena span a range of scales from
based ERA5 grid cells in this high-population-density re-         extra-tropical cyclones down to downburst and gust fronts
gion of the USA. Maximum sustained wind speeds at 100 m           associated with deep convection (Golden and Snow, 1991).
during these windstorms range from 26 to over 43 ms−1 ,           Herein we focus on large-scale, long-duration “windstorms”
with wind speed return periods exceeding 6.5 to 106 years         associated with extra-tropical cyclones since they are likely
(considering the top 5 % of grid cells during each storm).        to have the most profound societal impacts. These large-scale
Property damage associated with these storms, with infla-         windstorms are a feature of the climate of North America
tion adjusted to January 2020, ranges from USD 24 mil-            and Europe and a major contributor to weather-related so-
lion to over USD 29 billion. Two of these windstorms are          cial vulnerability and insurance losses (Della-Marta et al.,
linked to decaying tropical cyclones, three are Alberta clip-     2009; Feser et al., 2015; Hirsch et al., 2001; Changnon, 2009;
pers, and the remaining storms are Colorado lows. Two of          Ulbrich et al., 2001; Haylock, 2011; Lukens et al., 2018;
the 10 re-intensified off the east coast, leading to develop-     Marchigiani et al., 2013).
ment of nor’easters. These windstorms followed frequently            This analysis focuses on windstorms in the northeastern
observed cyclone tracks but exhibit maximum intensities as        region of the United States as defined in the National Climate
measured using 700 hPa relative vorticity and mean sea level      Assessment (USGCRP, 2018) (Table 1, Fig. 1a). The north-
pressure that is 5–10 times the mean values for cyclones that     eastern USA experiences a relatively high frequency of dam-
followed similar tracks over this 40-year period. The time        aging storms, in particular during the cold season (Hirsch
evolution of wind speeds and concurrent precipitation for         et al., 2001), and exhibits relatively high exposure due to
those windstorms that occurred after the year 2000 exhibit        both the large number of (i) highly populated, high-density
good agreement with in situ ground-based and remote sens-         urban areas (Fig. 1d, SEDAC, 2020; U.S. Census Bureau,
ing observations, plus storm damage reports, indicating that      2019) and (ii) high-value (insured) assets. For example, New
the ERA5 reanalysis data have a high degree of fidelity for       York state ranks 10th of the 50 US states in total direct eco-
large, damaging windstorms such as these. A larger pool of        nomic losses related to natural hazards, with estimated losses
the top 50 largest windstorms exhibit evidence of only weak       of USD 12.54 billion in 2009 USD between 1960 and 2009
                                                                  (Gall et al., 2011).

Published by Copernicus Publications on behalf of the European Geosciences Union.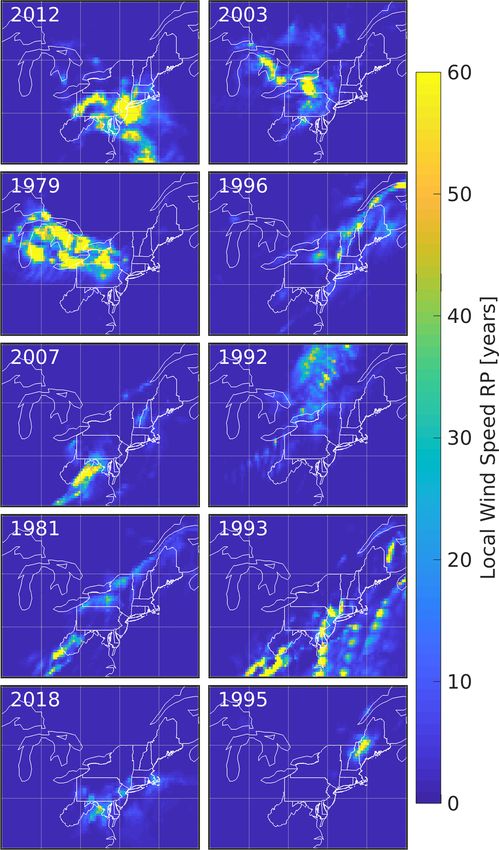
2002                                                  F. Letson et al.: Intense windstorms in the northeastern United States

   The northeastern states exhibit a very high prevalence         Table 1. Summary of the states that comprise the northeastern re-
of mid-latitude cyclone passages (Hodges et al., 2011; Ul-        gion as defined by the National Climate Assessment (USGCRP,
brich et al., 2009) and the associated extreme weather events     2018). State abbreviations and population from the 2010 US Census
(Bentley et al., 2019). They lie under a convergence zone         are also given (U.S. Census Bureau, 2019).
of two prominent Northern Hemisphere cyclone tracks as-
sociated with cyclones that form or redevelop as a result of            Name                   Abbreviation   2010 population
lee cyclogenesis east of the Rocky Mountains (Lareau and                United States          US                 308 745 538
Horel, 2012). The first is associated with extra-tropical cy-           Northeastern region    NE                  64 443 443
clones that have their genesis within/close to the US state of          Connecticut            CT                   3 574 097
Colorado and typically track towards the northeast (Colorado            Delaware               DE                     897 934
lows, CLs) (Bierly and Harrington, 1995; Hobbs et al., 1996).           District of Columbia   DC                     601 723
The second is characterized by cyclones that have their gen-            Maine                  ME                   1 328 361
esis in/close to the Canadian province of Alberta and track             Maryland               MD                   5 773 552
                                                                        Massachusetts          MA                   6 547 629
eastwards across the Great Lakes (Alberta clippers, ACs).
                                                                        New Hampshire          NH                   1 316 470
Alberta clippers generally move southeastward from the lee              New Jersey             NJ                   8 791 894
of the Canadian Rockies toward or just north of Lake Supe-              New York               NY                  19 378 102
rior (Fig. 1a) before progressing eastward into southeastern            Pennsylvania           PA                  12 702 379
Canada or the northeastern United States, with fewer than               Rhode Island           RI                   1 052 567
10 % of the cases in the climatology tracking south of the              Vermont                VT                     625 741
Great Lakes (Thomas and Martin, 2007). The Great Lakes                  West Virginia          WV                   1 852 994
are known to have a profound effect on passing cyclones
during ice-free and generally unstable conditions that pre-
vail during September to November (Angel and Isard, 1997).        20th-century reanalysis exhibits a positive trend in the 98th-
Particularly during the early part of the cold season, cyclones   percentile wind speed over parts of the USA, including the
that cross the Great Lakes are frequently subject to acceler-     northeastern states that are the focus of the current research
ation and intensification via enhanced vertical heat flux and     (Brönnimann et al., 2012).
low-level moisture convergence due to the lake–land rough-
ness contrast (Xiao et al., 2018). Cyclones such as Alberta       1.2    Socioeconomic consequences of windstorms
clippers that transit the Great Lakes during periods with sub-
stantial ice cover are subject to less alteration (Angel and      Economic losses associated with atmospheric hazards are
Isard, 1997). The northeastern states are also impacted by        substantial. Data from Munich Re indicate that annual
decaying tropical cyclones (TCs) that track north from the        “weather-related” losses at the global scale in 1997–2006
Gulf of Mexico or along the Atlantic coastline (Baldini et al.,   were USD 45.1 billion (inflation adjusted to 2006 USD)
2016; Varlas et al., 2019; Halverson and Rabenhorst, 2013).       (Bouwer et al., 2007). In 2013, globally aggregated losses
Research on windstorm risk in Europe found that, although         due to natural hazards were estimated at USD 125 billion
fewer than 1 % of cyclones that impact northern Europe are        (Kreibich et al., 2014). Data from the contiguous USA in-
post tropical cyclones, they tend to be associated with higher    dicate 168 “billion-dollar disaster events” linked to atmo-
10 m wind speeds (Sainsbury et al., 2020). Tropical cyclones      spheric phenomena during 1980–2013 (Smith and Matthews,
are also a major driver of extreme wind speeds along the US       2015). In the USA, three-quarters of total damages from nat-
eastern seaboard (Barthelmie et al., 2021), and events such       ural hazards derive from hurricanes, flooding, and severe
as Hurricane Sandy have been associated with large geo-           winter storms (including windstorms) (Gall et al., 2011).
physical hazards in the US Northeast (Halverson and Raben-        There is also evidence of a trend towards increasing eco-
horst, 2013; Lackmann, 2015). This region also experiences        nomic impact from natural hazards within the USA even af-
episodic nor’easters (NEs), extra-tropical cyclones that form     ter adjusting for inflation. According to one report, “nation-
or intensify off/along the US east coast and exhibit either a     wide, annual losses rose from USD 4.7 billion in the 1960s to
retrograde or northerly track, resulting in a strong northeast-   USD 6.7 billion in the 1970s, USD 7.6 billion in the 1980s,
erly flow over the northeastern states (Hirsch et al., 2001;      USD 14.8 billion in the 1990s, and USD 23.6 billion in the
Zielinski, 2002).                                                 2000s” due to a combination of more frequent disasters, dis-
   There is evidence that intense winter wind speeds at the       asters of larger scale, and changes in societal resilience (Gall
mid-latitudes have increased since 1950, due in part to in-       et al., 2011).
creased frequency of intense extra-tropical cyclones (Ma and         Windstorms present a hazard to the built environment;
Chang, 2017; Vose et al., 2014). While long-term trends such      transportation, especially to aviation (Young and Kristensen,
as this from reanalysis products are subject to the effects       1992); and multi-energy systems, including the electric grid
of changing data assimilation (Bloomfield et al., 2018; Be-       (Bao et al., 2020; Wanik et al., 2015). In 2016 the annual
fort et al., 2016; Bengtsson et al., 2004), the 56-member         cost of grid disruptions within the USA was estimated to

Nat. Hazards Earth Syst. Sci., 21, 2001–2020, 2021                                 https://doi.org/10.5194/nhess-21-2001-2021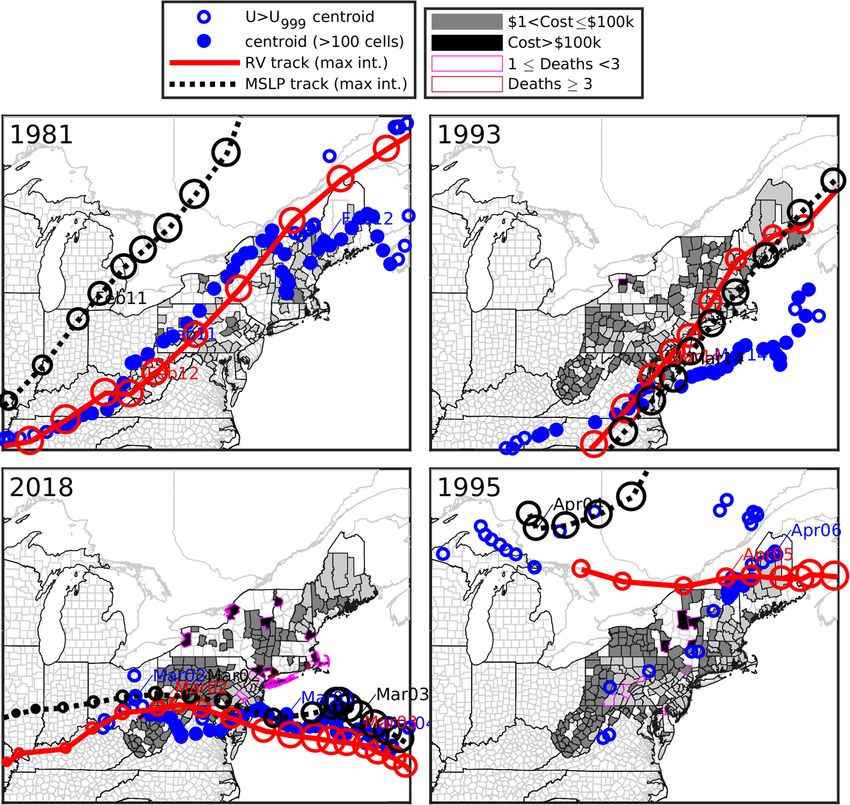
F. Letson et al.: Intense windstorms in the northeastern United States                                                                 2003

Figure 1. (a) 99.9th-percentile wind speed (U999 ) from ERA5 for each grid cell in the northeastern USA derived using hourly wind speeds
at 100 m a.g.l. during 1979–2018. Borders of the 12 northeastern states are shown in red. The Great Lakes are each labeled in white, with
the first three letters of their names: Superior (SUP), Michigan (MIC), Huron (HUR), Erie (ERI), and Ontario (ONT). (b) Time series of the
number of ERA5 grid cells over the northeastern states that exceed their local U999 value (out of 924 cells). The 50 largest-magnitude events
are circled in black, and the top 10 events are marked in red. (c) Locations of the 24 ASOS stations and 7 radar stations used for validation
of ERA5 wind speed and precipitation values. The dotted circles show the area with 200 km radius from each radar station. (d) Population
density of the Northeast at a spatial resolution of 30 arcsec (∼ 1 km; data from the 2010 US Census available from the Socioeconomic Data
and Applications Center (SEDAC, 2020)).

range from approximately USD 28 billion to USD 209 bil-                  Specific goals of the research reported herein are to do the
lion (Mills and Jones, 2016). Composite events character-                following:
ized by the co-occurrence of ice accumulation and wind are
particularly hazardous to the built environment, aviation, and             1. Present a new method for identifying and physically
energy infrastructure (Sinh et al., 2016; Jeong et al., 2019).                characterizing severe windstorms. This method is ap-
For example, in the 1998 northeastern ice storm ice deposi-                   plied to 40 years of hourly output from the ERA5 re-
tion combined with high winds led to the toppling of 1000                     analysis to extract the 10 most intense windstorms over
transmission towers, loss of power to 5 million people, and                   the US northeastern states and describe them in terms
840 000 insurance claims valued at USD 1.2 billion (Mills                     of their location, spatial extent, duration, and severity.
and Jones, 2016). This work seeks to advance understand-                      We further evaluate the degree to which these wind-
ing of the character and causes of extreme windstorms in the                  storms are composite extreme events, wherein high
Northeast.                                                                    wind speeds co-occur with extreme or hazardous pre-
                                                                              cipitation.
1.3   Objectives of this research
                                                                           2. Verify aspects of the windstorms as characterized based
This research is inspired by and is conceptually analogous to                 on ERA5 reanalysis output using wind speed observa-
development of the XWS (eXtreme WindStorms) catalogue                         tions from sonic anemometers and precipitation charac-
of storm tracks and wind gust footprints for 50 of the most                   teristics from radar and in situ rain gauges, plus storm
extreme European winter windstorms (Roberts et al., 2014).                    damage reports.

https://doi.org/10.5194/nhess-21-2001-2021                                      Nat. Hazards Earth Syst. Sci., 21, 2001–2020, 2021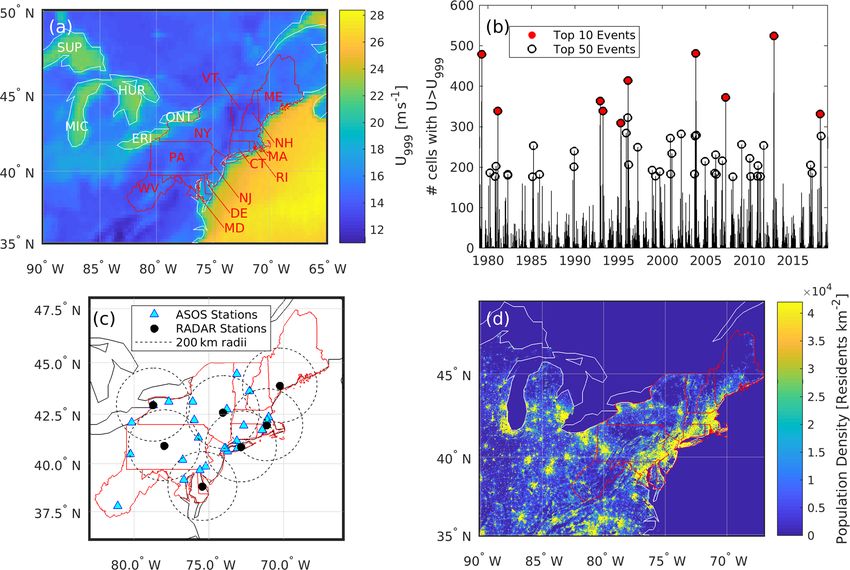
2004                                                  F. Letson et al.: Intense windstorms in the northeastern United States

    3. Contextualize these windstorms in the long-term cy-        roughness length. Here we use wind speeds at 100 m height
       clone climatology. Specifically, we track each wind-       because the events we seek to characterize are on regional
       storm over time and space using two indices of intensity   rather than local scale and are necessarily driven by winds
       derived from mean surface pressure and relative vortic-    aloft. Flow at this height is less likely to be impacted by
       ity and compare their location and intensity to those of   sub-grid-scale heterogeneity in surface roughness length and
       all cold-season cyclones affecting the northeastern USA    uncertainties induced by unresolved sub-grid scale variabil-
       from 1979 to 2018.                                         ity. Near-surface wind speeds are strongly coupled to wind
                                                                  speeds at 100 m (i.e., within the PBL), but wind speeds at
    4. Evaluate these windstorms in terms of the return periods   100 m are less strongly impacted by inaccuracies and/or un-
       (RPs) of extreme wind speeds derived using the Gum-        certainty in surface roughness length (z0 ) (Minola et al.,
       bel distribution applied using annual maximum wind         2020; Nelli et al., 2020). Applying an uncertainty of a fac-
       speeds for 1979–2018.                                      tor of 2 to z0 can lead to mean differences of up to 0.75 ms−1
                                                                  for near-surface (40 to 150 m a.g.l.) wind speeds (Dörenkäm-
This research is a part of the HyperFACETS project, which
                                                                  per et al., 2020). Estimates of wind gusts at a nominal height
uses a storyline-based analysis framework. Storylines are
                                                                  of 10 m are generated as a post-processing product from the
“physically self-consistent unfolding of past events, or of
                                                                  ERA5 reanalysis product using the sustained wind speed at
plausible future events or pathways” (Shepherd et al., 2018).
                                                                  10 m along with a term representing shear stress and a con-
They provide a method of framing a research inquiry in terms
                                                                  vective term (Minola et al., 2020). The association between
of three elements: a geographic region, a historically impor-
                                                                  these wind gust estimates and sustained wind speeds at 100 m
tant or notable event, and a set of process drivers for that
                                                                  are also presented and provide a link to previous research on
event.
                                                                  European windstorms that focuses on wind gusts.
                                                                     Cyclone tracking and intensity estimates presented herein
2     Data and methods                                            employ 3-hourly mean sea level pressure (MSLP) and rela-
                                                                  tive vorticity at 700 hPa (RV) fields from ERA5. Previous re-
2.1    ERA5 reanalysis                                            search has indicated relatively good consistency between cy-
                                                                  clone climatologies derived using ERA5 and other recent re-
Attempts to identify and characterize windstorms from a geo-      analyses (Gramcianinov et al., 2020; Sainsbury et al., 2020).
physical perspective and contextualize them in a climato-         RV values at 700 hPa are used rather than 850 hPa as in
logical setting have historically been hampered by limited        the XWS European analysis due to the presence of high-
data availability and/or quality from geospatially inhomo-        elevation areas in US cyclone source regions. Further, the
geneous observing networks. Further, time series from in          3-hourly fields from ERA5 used herein are direct products
situ wind measurement networks exhibit substantial inho-          of the reanalysis, whereas the 3-hourly values used in XWS
mogeneities due to factors such as station relocations, in-       were based on 6-hourly ERA Interim reanalyses combined
strumentation changes, changes in conditions around indi-         with ERA Interim forecast values for the intervening time
vidual measurement stations, and changes in measurement           steps (Roberts et al., 2014).
frequencies and/or integration periods (Pryor et al., 2009;          Compound events, windstorms which exhibit a co-
Wan et al., 2010). Thus, herein we employ once-hourly wind        occurrence of extreme precipitation and/or freezing rain with
speeds from the ERA5 reanalysis. The wind speeds are for a        high winds, are associated with amplified risk (Zscheischler
height of 100 m a.g.l. at the model time step of ∼ 20 min and     et al., 2018; Sadegh et al., 2018). Precipitation intensity and
a spatial resolution of 0.25◦ × 0.25◦ . This study focuses on     hydrometeor class from ERA5 are used to identify to what
windstorms within a study domain that extends from 35 to          degree each of the 10 windstorms identified here are com-
50◦ N and 65 to 90◦ W (Fig. 1a). The events are defined us-       pound events. The hydrometeor classes reported by ERA5
ing data from the 924 ERA5 land-dominated grid cells over         are rain, mixed rain and snow, thunderstorms, wet snow,
the 12 northeastern states (two-letter abbreviations given in     dry snow, freezing rain, and ice pellets and are differenti-
Table 1).                                                         ated based largely on the temperature structure in the reanal-
   The ERA5 reanalysis is derived using an unprecedented          ysis model (https://confluence.ecmwf.int/display/FUG/9.7+
suite of assimilated in situ and remote sensing observa-          Precipitation+Types, last access: 2 June 2021). Prior analy-
tions (Hersbach et al., 2020). It exhibits relatively high fi-    ses of ERA5 precipitation values have indicated skill relative
delity for wind speeds (Kalverla et al., 2019, 2020; Olau-        to in situ observations and gridded datasets over the USA
son, 2018; Pryor et al., 2020; Jourdier, 2020; Ramon et al.,      (Tarek et al., 2020; Sun and Liang, 2020).
2019). However, it is important to acknowledge that wind
parameters from any model do not fully reflect all scales         2.2   Observational data
of flow variability (Skamarock, 2004) and underestimate ex-
treme wind speeds (Larsén et al., 2012), particularly in ar-      Wind speeds and precipitation characteristics during the
eas with high orographic complexity and/or varying surface        windstorms are identified using ERA5 and are validated us-

Nat. Hazards Earth Syst. Sci., 21, 2001–2020, 2021                               https://doi.org/10.5194/nhess-21-2001-2021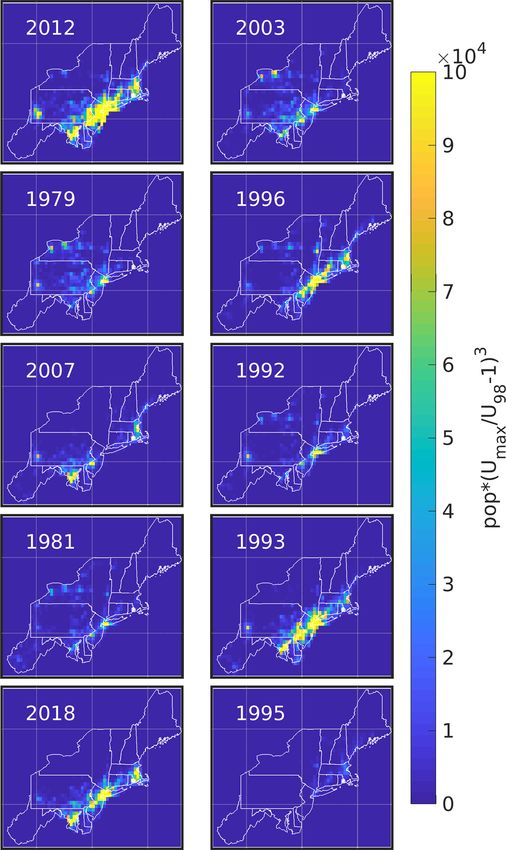
F. Letson et al.: Intense windstorms in the northeastern United States                                                         2005

ing in situ measurements from 24 National Weather Service          widely used (Young et al., 2017; Konisky et al., 2016). Dam-
(NWS) Automated Surface Observation System (ASOS) sta-             age and mortality estimates from this dataset provide an es-
tions and seven NWS radars (Fig. 1c). Since major upgrades         timate of the impact of each windstorm, with the caveat that
to the NWS systems were conducted in 2000, this eval-              population density and hence the potential for loss of life and
uation is focused on windstorms that occurred after that           damage vary markedly between US counties that also vary
year. Five-minute measurements of in situ wind speeds at           greatly in area (Fig. 1d).
10 m a.g.l. used in this evaluation derive from ice-free two-
dimensional sonic anemometers (Schmitt IV, 2009), while
                                                                   2.4   Method used to characterize windstorms
the in situ observations of precipitation intensity reported
from the ASOS network derive from heated tipping-bucket
rain gauges (Tokay et al., 2010). In the absence of widespread     A range of different techniques have been developed and ap-
in situ wind speed observations from tall towers (which            plied to identify and characterize atmospheric hazards in-
would be more comparable to the 100 m wind speeds from             cluding extreme windstorms. Some rely on an assessment
ERA5), these 10 m wind speed observations represent the            of event severity such as insured losses or human mortal-
best available validation dataset for the occurrence of high       ity/morbidity. Others prescribe a level of rarity (i.e., they are
winds throughout the Northeast states. NWS protocols docu-         probabilistic), while others prescribe a level of intensity (i.e.,
ment accumulated precipitation since the last hour, sampled        the occurrence of extreme values of some physical phenom-
every minute and reported every 5 min (Nadolski, 1998). For        ena) (Stephenson, 2008). Here we employ a methodology
the current comparison to ERA5, these are averaged to gen-         based on the intensity and spatial extent of extreme wind
erate hourly rainfall rates.                                       speeds. This approach is conceptually similar to storm sever-
   Precipitation rates from seven NWS dual-polarization            ity indices derived from European work based on the max-
radars (Kitzmiller et al., 2013) are used to provide an areally    imum 925 hPa wind speed within a 3◦ radius of the vortic-
averaged comparison of ERA5 (Fig. 1c). NWS radar precipi-          ity maximum and the area over which wind speeds at that
tation products are the result of extensive development efforts    height exceed 25 ms−1 (Roberts et al., 2014; Della-Marta et
(Cunha et al., 2015; Villarini and Krajewski, 2010; Straka et      al., 2009), while the current work considers over-threshold
al., 2000) and have been employed in a wide array of appli-        winds within a fixed domain 15 × 25◦ in extent. It also draws
cations (Letson et al., 2020; Seo et al., 2015; Krajewski and      from earlier work that used an index defined as the product
Smith, 2002). Precipitation intensity rates derived from radar     of the cube of the maximum observed wind speed over land,
reflectivity are reported in 41 400 cells using 1◦ azimuth an-     the areas impacted by damaging winds (>25.7 ms−1 ), and
gle and a range resolution of 2 km. In the current work, pre-      the duration of damaging winds (Lamb, 1991).
cipitation rates over the land areas of northeastern states from      This analysis employs hourly wind speeds at 100 m a.g.l.
radar and ASOS and ERA5 that are within 200 km of the              for 1979–2018 in all 924 land-dominated grid cells over
seven radars are averaged in time to match the hourly reso-        the northeastern states. The methodology applied to iden-
lution of ERA5 precipitation and interpolated in space to the      tify and characterize the 10 largest windstorms does not em-
0.25◦ × 0.25◦ ERA5 grid (Fig. 1c).                                 ploy an absolute threshold of wind speed, but rather ex-
                                                                   ceedance of locally determined thresholds defined by the
2.3   NOAA Storm Events Database                                   99.9th-percentile wind speed value (U999 ). A local U999
                                                                   threshold is used, rather than an absolute wind speed thresh-
The US National Oceanic and Atmospheric Administra-                old in meters per second, in part because storms affecting
tion (NOAA) provides detailed information on “the oc-              urban areas, which may not be prone to high wind speeds,
currence of storms and other significant weather phenom-           may still result in damage to infrastructure. While lower per-
ena having sufficient intensity to cause loss of life, in-         centile thresholds have been used in previous work (Walz
juries, significant property damage, and/or disruption to          et al., 2017; Klawa and Ulbrich, 2003), use of the 99.9th-
commerce” at the county level in the NOAA Storm                    percentile wind speed value is appropriate for identifying
Events Database (https://www.ncdc.noaa.gov/stormevents/,           the truly extraordinary conditions we seek to characterize
last access: 10 February 2021). These records are                  and is robust when applied to very long datasets with very
subject to some inhomogeneities associated with dig-               large sample sizes. Use of locally determined thresholds also
itization of transcripts prior to 1993 and standard-               enables direct comparison of the spatial scale and intensity
ized into 48 event types in 2013 (https://www.ncdc.                of windstorms derived using the ERA5 data at 100 m a.g.l.
noaa.gov/stormevents/details.jsp?type=collection, last ac-         and near-surface wind speed observations from 10 m a.g.l.
cess: 10 February 2021). They are compiled from a range of         Exceedance of the local 99.9th-percentile wind speed value
county, state, and federal agencies in addition to the NWS.        (U999 ) is considered in both cases based on the ∼ 20-year
Like all hazard loss datasets they are subject to reporting in-    record from each ASOS station and the 40 years of ERA5
accuracies and inconsistencies (Gall et al., 2009), but they       data, and comparisons are made at an hourly resolution by
represent a long and relatively consistent record and are          averaging all ASOS wind speeds within a given hour.

https://doi.org/10.5194/nhess-21-2001-2021                                Nat. Hazards Earth Syst. Sci., 21, 2001–2020, 2021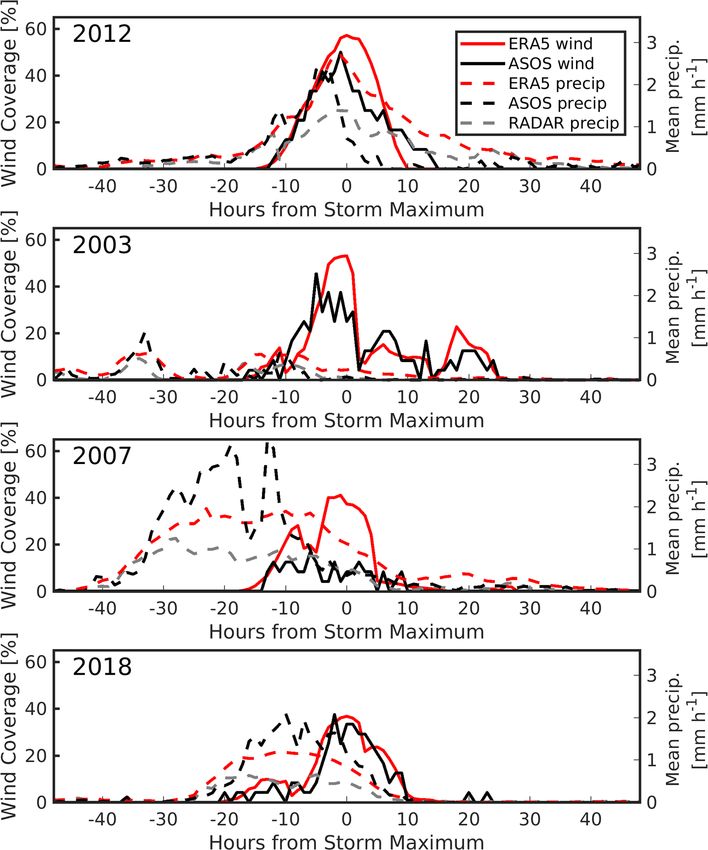
2006                                                      F. Letson et al.: Intense windstorms in the northeastern United States

Table 2. Summary of the top 10 windstorms listed in rank order of spatial extent. The time of max coverage (tp ) shows the time (in UTC)
and date (listed as year/month/day) with the greatest geographic extent of high wind speeds. No. cells indicates the count of ERA5 grid
cells (out of 924) with U >U999 at tp . The maximum precipitation accumulated in any northeastern state land grid cell is given for the 24 h
surrounding the storm peak. Maximum sustained wind speeds at 100 m (U ) and wind gusts (G10 ) at 10 m are given for the 924 northeastern
state land grid cells during each storm, for both tp and the entire wind storm period (97 h). Property damage for the northeastern states is
based on NOAA storm damage reports and is accumulated over the duration of the period for which the associated cyclone (defined using
RV) is evident. Inflation adjusted property damage is derived using inflation estimates from the US Bureau of Statistics (https://www.bls.
gov/data/inflation_calculator.htm, last access: 2 June 2021). For comparative purposes, results from an analysis using a 98th-percentile wind
speed threshold are shown in the final two columns. U >U98 storm rank denotes the rank of windstorms defined using that local threshold,
and no. cells U >U98 indicates the number of NE grid cells that exceed their local 98th-percentile value.

   Time of max          No. cells   Max U     Max U        Max         Max       Max      Property        Property    U >U98    No. cells
   coverage (tp )       U >U999       at tp    during      G10          G10      24 h      damage          damage       storm   U >U98
                                    [ms−1 ]     storm      at tp     during    precip    [M USD]         [M USD]         rank
                                               period    [ms−1 ]      storm     [mm]                      inflation
                                              [ms−1 ]                period                            adjusted to
                                                                    [ms−1 ]                          January 2020
   2012/10/30 00:00          524      34.27      41.8      34.44     42.43     146.03      25 304           29 100         3         864
   2003/11/13 20:00          481      26.04     29.95      36.58     37.18      39.02       1119             1600         29         717
   1979/4/6 20:00            479      28.53     31.88      31.98     33.99      34.19         586            2233         34         697
   1996/1/27 15:00           414      25.76     30.81      29.69     37.02      60.64       1298             2181          2         876
   2007/4/16 16:00           372      29.56     32.44      31.04     34.07      79.06         392              502        24         729
   1992/11/13 03:00          363      25.53     28.34       30.4     31.94      54.01          42               79         5         838
   1981/2/11 04:00           339      24.81     29.08      27.66     36.61      93.02           8               24        20         746
   1993/3/13 21:00           339      40.95     43.15      34.38     38.49      84.33          34               62        12         806
   2018/3/2 19:00            331      31.66      33.1      33.77     35.39      84.71         164              172        48         641
   1995/4/5 20:00            309      24.21     26.29      32.96     32.96      19.19         225              389       114         511

   As shown in Fig. 1a, there is marked spatial variability                 Research from Europe indicates evidence of serial cluster-
in the 99.9th-percentile wind speed (i.e., the wind speed ex-            ing of windstorms (Walz et al., 2018). Although our focus is
ceeded for slightly over 3500 h during the 40-year period).              primarily on the 10 most intense and extensive windstorms,
U999 ranges from over 28 ms−1 over the Atlantic Ocean                    a larger sample of 50 events is extracted using the method-
down to 12 ms−1 over some land grid cells due to the higher              ology described above but relaxing the temporal separation
surface roughness and topographic drag. Windstorms are                   from 14 to 2 d, to examine the degree to which spatially ex-
identified as periods when the largest number of ERA5 grid               tensive windstorms over the Northeast as manifest in ERA5
cells exceed their local (ERA5 grid-cell-specific) 99.9th-               are serially clustered (Fig. 1b). This analysis employs a Pois-
percentile wind speed value (U >U999 ). A further restriction            son distribution fit to the annual occurrence rate for these 50
is applied in that no event may be within 14 days of any other,          events and the dispersion index (D) of (Mailier et al., 2006)
to avoid double counting of any individual storm (Fig. 1b,
Table 2).                                                                      σ2
                                                                         D=       − 1,                                                      (1)
   The peak hour of U >U999 coverage within the Northeast                      µ
states for each of the 10 most intense storms is referred to
herein as the peak windstorm time (tp ), and the 97 h including          where σ 2 and µ are the variance and mean of the distribution
and surrounding (±48 h) tp is referred to as the storm period.           of the annual rates of occurrence. For a Poisson distributed
For each hour of each storm period a high-wind centroid is               random variable σ 2 and µ are equal (Wilks, 2011a). D>0 in-
identified using the mean latitude and longitude of all grid             dicates the presence of temporal clustering. The significance
cells where U >U999 .                                                    of D is evaluated using a bootstrapping analysis in which
   Precipitation associated with each of the 10 most intense             10 000 samples are drawn with replacement and the disper-
windstorms is also evaluated using ERA5 precipitation totals             sion index is calculated for each, similar to a method used in
and types. The analysis of precipitation focuses on a 24 h pe-           Pinto et al. (2016).
riod centered on the peak windstorm time (tp ). Precipitation
statistics including 24 h total precipitation, hourly precipita-         2.5    Development of a cyclone climatology
tion rates, and the frequency of each precipitation type are
                                                                         A cyclone detection and tracking algorithm (Hodges et al.,
characterized for all land grid cells in northeastern states that
                                                                         2011) is applied to 3-hourly ERA5 MSLP and 700 hPa RV
exceed their local U999 value at any point in this 24 h period.
                                                                         global fields that have been subjected to T42 spectral filtering

Nat. Hazards Earth Syst. Sci., 21, 2001–2020, 2021                                        https://doi.org/10.5194/nhess-21-2001-2021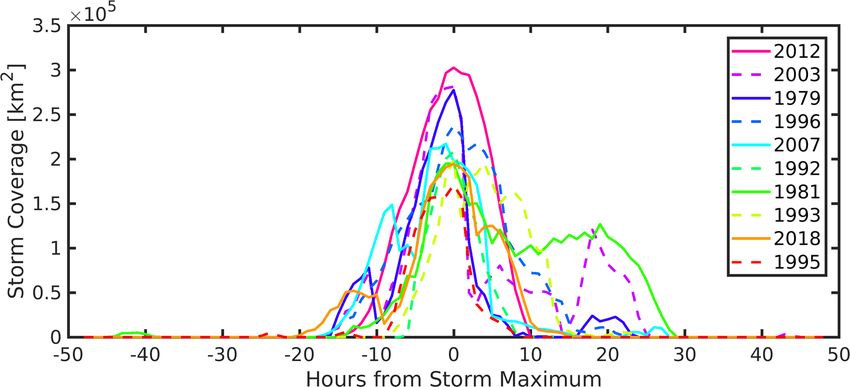
F. Letson et al.: Intense windstorms in the northeastern United States                                                        2007

for RV (corresponding to a 310 km resolution at the Equa-           2.6    Calculation of long-term period wind speeds
tor) and T63 filtering for MSLP (210 km at the Equator) with
the large-scale background removed for total wavenumbers            Peak wind speeds (Upeak ) during each of the windstorms are
≤ 5. These spectral filters are designed to restrict detection      expressed in terms of their RP (in years) to provide a metric
to tropical and mid-latitude cyclones (Hoskins and Hodges,          of the degree to which these events are exceptional. These
2002). The location and intensity of the cyclones are iden-         statistics are computed for each ERA5 grid cell by fitting
tified using the local maxima in RV and the minima (i.e.,           a double exponential (Gumbel) distribution to annual max-
negative deviations) in MSLP relative to the filtered fields.       imum wind speeds (Umax ) (Mann et al., 1998):
RV cyclone intensities are shown in units of 10−5 s−1 , and                                    −(Umax −α)/β
                                                                    P (Umax ; α, β) = e−e                     ,                 (2)
MSLP intensity estimates are given in hectopascals scaled
by −1. These anomalies are relative to removal of the large-        where the distribution parameters α and β are derived us-
scale background for n ≤ 5, where n is the total wavenumber         ing maximum-likelihood estimation. The Upeak estimates for
in the spherical harmonic representation of the field. The cy-      each ERA5 grid cell are then evaluated in terms of their RP
clones are tracked by first initializing a set of tracks based on   (in years) using (Wilks, 2011a; Pryor et al., 2012)
a nearest-neighbor method which are then refined by mini-                         1
mizing a cost function for track smoothness as in the XWS           RP =                   .                                    (3)
                                                                            1 − P (Upeak )
European analysis (Roberts et al., 2014). Cyclones only con-
tribute to the climatology if they persist for ≥ 8 time steps       This method is similar to that used for grid-point-based wind
(24 h). The cyclone detection algorithm is applied separately       speed return period calculations in previous work (Della-
to MSLP and RV, with the results being used to provide              Marta et al., 2009), which resulted in return periods of 0.1
a qualitative assessment of the uncertainty in the cyclone          to 500 years when considering 200 prominent windstorms in
tracks.                                                             Europe.
    Tracks associated with each windstorm are identified from          Uncertainty intervals in the return period wind speeds are
the geographic centroid of ERA5 grid cells where U >U999            assigned using the 95 % confidence intervals on the α and β
and secondly from the local maximum of MSLP (scaled by              parameters as derived using maximum-likelihood estimation.
−1) and RV anomalies that tracked into the Northeast study          2.7    Loss index
domain during the storm period. The date and location at
which the cyclone associated with each windstorm is first           Previous research has advocated use of a loss index (LI) to
identified by the tracking algorithm are used to identify the       identify societally relevant wind storms (Klawa and Ulbrich,
source area of each windstorm, and the location and time at         2003):
which the detection algorithm ceases to identify a cyclone are                                                        3
used to describe the end of the cyclone track. Subjective eval-
                                                                          X                             Umax (cell)
                                                                    LI =      NE grid cells
                                                                                            pop(cell)               − 1   ,  (4)
uation of the cyclone tracks associated with each windstorm                                             U98 (cell)
is used to identify the type of cyclone associated with each        where pop(cell) is the population of a reanalysis grid cell;
windstorm. A cyclone is identified as an AC if the cyclone          Umax is the 24 h maximum wind speed in that grid cell; and
track originates over the North American continent north of         U98 is the local, long-term 98th-percentile wind speed. Here
40◦ N, as a CL if the track originates over the North Amer-         we evaluate the degree of correspondence between this LI
ican continent south of 40◦ N, and as a decaying TC if the          applied here to wind speeds at 100 m and NOAA storm dam-
track originates south of 30◦ N over a water grid cell. The         age reports using linear fitting with zero intercept. Variance
term nor’easters is applied if the cyclone retrogrades towards      explanation (R 2 ) values for fits with forced zero intercept is
the coastline after moving offshore and/or is associated with       computed using
strong northeasterly flow over the northeastern states.                   P c2
    Consistent with past research (Hirsch et al., 2001), all of              Yi
                                                                    R2 =         ,                                              (5)
the top 10 windstorms identified using the largest spatial ex-              Yi2
tent of locally extreme wind speeds in the ERA5 data occur                 c2 is the estimated value of damage (Y ) for each storm
during cold-season months (October to April). Thus, the cy-         where Y i
clone track density used to contextualize the windstorms is         (i) and Y is the observed value for that event (Eisenhauer,
restricted to only those months. This analysis further focuses      2003) from NOAA storm damage reports.
solely on cyclones that track into the northeastern domain.
These restrictions allow direct evaluation of the degree to         3     Results
which the windstorms are typical of the prevailing cyclone
climatology.                                                        3.1    Windstorm identification and characterization

                                                                    The top 10 windstorms during 1979–2018 over the north-
                                                                    eastern states identified using the method described above

https://doi.org/10.5194/nhess-21-2001-2021                                  Nat. Hazards Earth Syst. Sci., 21, 2001–2020, 2021
2008 F. Letson et al.: Intense windstorms in the northeastern United States
The maximum wind speed at 100 m a.g.l. in any ERA5
grid cell at the peak hour ranges from 25 to 41 ms−1 , while
the maximum during the storm period ranges from 26 to
44 ms−1 (Table 2). These maximum wind speeds do not scale
with the storm intensity as measured by the number of grid
cells that exceed their local 99.9th-percentile wind speeds
(Table 2). For example, the windstorm during March 1993 is
associated with the highest absolute wind speeds but is man-
ifest in a relatively small number of ERA5 grid cells. Max-
imum wind gusts at 10 m a.g.l. (G10 ) exceed the sustained
wind speeds at 100 m a.g.l. at both the peak hour and over the
entire windstorm. Maximum G10 from ERA5 for all wind-
storms is well above the US National Weather Service “dam-
aging winds” threshold of 25.7 ms−1 (Trapp et al., 2006) (Ta-
ble 2). The spatial correlation coefficient between 100 m sus-
tained wind speeds and G10 at tp is >0.68 for all storms and
>0.8 for 8 out of the 10 storms, indicating that the 100 m
sustained wind speeds analyzed herein are strongly related
to near-ground wind gusts in the ERA5 reanalysis (Fig. 2).
All 10 windstorms are associated with substantial damage
reports within the Northeast states (Table 2, Fig. 3), and 9 of
the 10 storms were responsible for deaths in the Northeast
states (Fig. 3). There is not direct correspondence between
the ranking of the windstorms in terms of the number of
ERA5 grid cells with U >U999 and the amount of damage and
human mortality as reported in the NOAA storm data, but
the four highest-magnitude windstorms (2012, 2003, 1979,
and 1996; i.e., those ranked 1–4) all have property damage
totals above any of the other six windstorms (Table 2). Fur-
ther, although NOAA storm data indicate only modest to-
tal economic costs associated with property damage during
the 1992 windstorm, there are reports of widespread dam-
age in counties across much of the Northeast (Fig. 3). The
lack of complete correspondence between the centroid of
windstorms, as identified using the methodology presented
here, and property damage in the NOAA dataset is likely due
Figure 2. Maximum gust at 10 m a.g.l (G10 ) vs. hourly 100 m wind
to the following: (i) occurrence of localized extreme (dam-
speed (U ) in all Northeast grid cells during the peak hour (tp ) of
each of the top 10 storms. The spatial correlation coefficient (r) is
aging) winds that are manifest at scales below those repre-
also given for each storm. sented in the ERA5 reanalysis (e.g., downbursts from em-
bedded thunderstorms, sting jets, and other mechanisms; Li
et al., 2020; Clark and Gray, 2018) (a grid resolution of 20 km
or higher may be required to fully capture damaging winds;
Hewson and Neu, 2015); (ii) spatial variability in insured
are summarized in Table 2. During the peak hour (tp ) of each assets (Nyce et al., 2015; Brown et al., 2015); (iii) possi-
of these windstorms, 309 to 524 (33 % to 56 %) of the 924 ble inconsistences in storm-reporting practices across coun-
ERA5 land-dominated grid cells exhibit U >U999 (Table 2). ties (see NOAA storm data publications for details: https:
For context, 10 % of ERA5 grid cells co-exhibit U >U999 in //www.ncdc.noaa.gov/IPS/sd/sd.html, last access: 10 Febru-
U999 at cells with U >U999 at tp and inflation-adjusted property dam-
tp (Table 2). age exceeds 0.66, and r between the maximum wind speed
Nat. Hazards Earth Syst. Sci., 21, 2001–2020, 2021 https://doi.org/10.5194/nhess-21-2001-2021F. Letson et al.: Intense windstorms in the northeastern United States 2009 Figure 3. and inflation-adjusted property damage is 0.56. For a sample ceedance of the 98th-percentile threshold are common over size of 10, in a t test used to evaluate significance (Wilks, the US Northeast during the 40 years of ERA5 output. For 2011a), these correlation coefficients differ from 0 at confi- example, 139 events have sustained wind speeds in excess of dence levels of 95 % and 90 %, respectively. Excluding Hur- their local 98th percentile in over half of all ERA5 grid cells. ricane Sandy increases r between the number of grid cells Thus, herein, a higher threshold (99.9th percentile) is used to with U >U999 at tp and inflation-adjusted property damage distinguish 10 extraordinary windstorms. All 10 also appear to 0.86. Thus, this geophysical intensity metric captures as- on the list of storms chosen using a 98th-percentile threshold, pects of relevance to storm damage. with 9 of the 10 appearing in the top 50 (Table 2). In previous work, the local 98th-percentile value has been Several of the windstorms identified using our approach used to identify windstorms in Germany as it roughly corre- have been previously identified in independent analyses, fur- sponds to wind gusts at 10 m that may cause property dam- ther confirming the reliability of the detection method. For age (Klawa and Ulbrich, 2003). Events with widespread ex- example, Hurricane Sandy, the most intense windstorm in https://doi.org/10.5194/nhess-21-2001-2021 Nat. Hazards Earth Syst. Sci., 21, 2001–2020, 2021
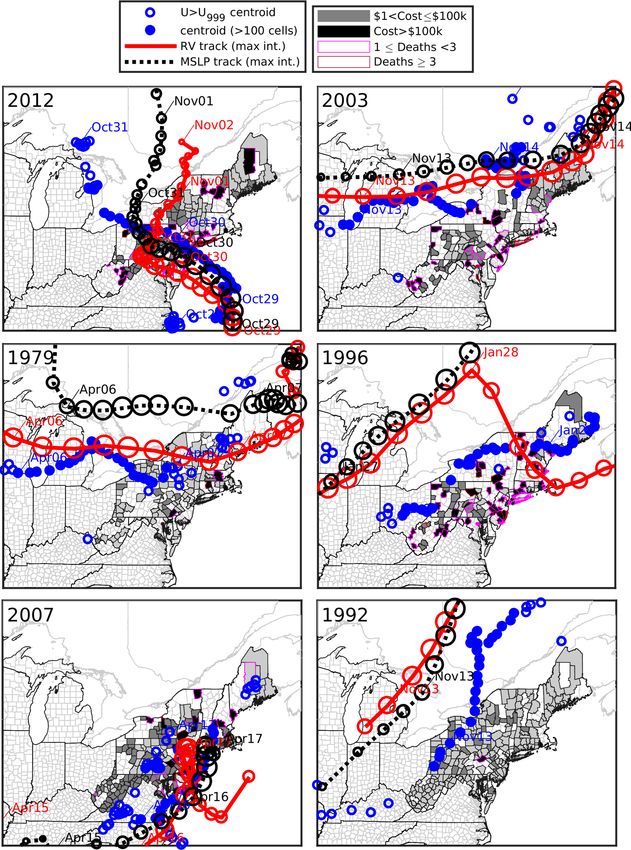
2010                                                     F. Letson et al.: Intense windstorms in the northeastern United States

Figure 3. Centroids of the windstorms computed as the geographic center of all ERA5 grid cells for U >U999 (blue). Markers are filled
when there are >100 cells over this threshold. Timing and location of the cyclone centers as diagnosed from MSLP and relative vorticity at
700 hPa are shown in black and red, respectively. Markers every 3 h along each track have a diameter corresponding to track intensity. The
underlying shading shows the county-level damage and deaths in the northeastern states associated with each event as diagnosed from the
NOAA storm reports.

this analysis (Table 2), is a historic storm that moved par-              Previous research has reported that reinsurance contracts
allel to the coast before making landfall in southern New              commonly employ a 72 h window to describe a “single
Jersey on 29 October and caused USD 50 billion of damage               event” (Haylock, 2011). All of the windstorms identified in
(Lackmann, 2015). According to ERA5 output at its peak,                this work transited the northeastern study domain in U999 ) is generally concentrated
speeds at 100 m a.g.l. that exceeded the locally determined            in the ±10 h around the storm peak time, tp (Fig. 4), although
U999 (Fig. 4). The eighth-most-intense windstorm (Table 2)             some windstorms had longer duration and a slower decay in
is the “Storm of the Century” of 12–14 March 1993, which               widespread intense wind speeds with significant coverage re-
formed in the Gulf of Mexico and caused widespread dam-                maining >10 h after tp (Fig. 4).
age in Florida and along the Atlantic coast before entering               Twenty-four-hour precipitation totals, used as an indicator
the Northeast (Huo et al., 1995).                                      of flooding potential, and maximum precipitation rates, used
   The synoptic-scale structure of extra-tropical cyclones             as an indicator of transportation hazards, vary substantially
is complicated (Hoskins, 1990; Earl et al., 2017). Maxi-               among the 10 windstorms, but virtually all of the windstorms
mum wind speeds are often, but not always, associated with             were associated with some form of intense or hazardous pre-
low-level jets that occur along the cold fronts of extra-              cipitation (Fig. 5). Consistent with observational evidence
tropical cyclones (Hoskins, 1990; Browning, 2004). Consis-             (Munsell and Zhang, 2014), Hurricane Sandy (windstorm
tent with that expectation, the centroid of ERA5 grid cells            during 2012) is associated with total 24 h precipitation ac-
with U >U999 tends to move in parallel with the cyclone track          cumulation exceeding 100 mm in five grid cells within the
locations but is generally displaced to the south/southeast            Northeast, and nearly half (46 %) of grid cells exhibit pre-
(Fig. 3).                                                              cipitation accumulations of over 20 mm. Heavy precipita-

Nat. Hazards Earth Syst. Sci., 21, 2001–2020, 2021                                      https://doi.org/10.5194/nhess-21-2001-2021
F. Letson et al.: Intense windstorms in the northeastern United States                                                                2011

Figure 4. Spatial extent of the windstorms measured in square kilo-
meters over the northeastern states using a time index relative to
tp . The spatial extent is described as the area of ERA5 grid cells
wherein the U >U999 . Values are shown for 48 h preceding and fol-
lowing each windstorm peak.

tion, both in terms of maximum precipitation intensity and
total accumulated precipitation, is also associated with the
1993 windstorm resulting from a decaying TC that formed a
NE (Fig. 5). Windstorms with lowest precipitation totals oc-
curred in 2003, 1979, and 1995 and are associated with ACs.
Freezing rain, which in conjunction with high winds is a par-
ticular hazard to electrical infrastructure and transportation,
is present during the windstorms in 1992, 1981, and 1993
(Fig. 5). There is also snow indicated in at least one location
in the domain in every storm, except for Hurricane Sandy.
Thus, 6 of the 10 windstorms might be classified as com-
pound events due to the occurrence of freezing rain and/or
widespread heavy rain identified using the American Mete-
orological Society threshold of >0.76 mm h−1 (AMS, 2012)
in >40 % of grid cells which also exceed U999 .
                                                                      Figure 5. Histograms of precipitation totals and maximum precip-
   Four of the top 10 windstorms occurred after 2000 (2012,
                                                                      itation rates and precipitation types for the 24 h centered on each
2003, 2007, and 2018, Table 2), and thus high-quality ASOS
                                                                      storm peak. All ERA5 land-based grid cells in the northeastern
and radar data are available for comparison with estimates            states which exceed their local U999 value at any point in the 24 h
from ERA5 for these events. For the 2012, 2003, and 2018              period are included. The frequencies are the fraction of such grid
windstorms there is good agreement between the spatial ex-            cells in each class. Precipitation types are as follows: no precipita-
tent of locally extreme wind speeds from ERA5 and ASOS,               tion (0), rain (1), thunderstorm (2), freezing rain (3), snow (5), wet
and the duration of intense wind speeds (Fig. 6). The agree-          snow (6), mixture of rain and snow (7), and ice pellets (8).
ment is less good for the 2007 windstorm possibly due to the
low density of ASOS stations in the US state of Maine, where
the ERA5 output indicates the wind maximum was manifest               acterizing extra-tropical cyclones (Bengtsson et al., 2009).
for a substantial fraction of the storm period (Fig. 3). For the      Mean ERA5 precipitation rates in Northeast states during
other three windstorms the fraction of ERA5 grid cells in the         these 10 storms are consistently somewhat higher than es-
northeastern states with U >U999 closely matches the frac-            timates from radar but below ASOS point measurements, re-
tion of ASOS stations in the same area that exceed their local        flecting spatial variability in rainfall intensity at scales below
U999 threshold during each hour of the storm period (Fig. 6).         those manifest in a network of point measurements (Villarini
The timing of storm precipitation in the ERA5 data is also            et al., 2008).
in good agreement with observational estimates from radar                A larger sample of 50 windstorms is also drawn from the
and ASOS stations, consistent with assimilation of radar pre-         40-year time series to examine the serial dependence. In this
cipitation and in situ station data (Lopez, 2011; Hersbach et         analysis the 14 d exclusion window used in the identification
al., 2019). The period with the most intense precipitation oc-        of the top 10 windstorms is reduced to a 2 d window. While
curred concurrently with the high wind speeds during Hurri-           the top 10 windstorms considered in detail herein all have a
cane Sandy but largely well before tp in the 2007 and 2018            spatial extent of between 309 and 524 grid cells, the storms
windstorms (Fig. 6), consistent with previous work char-              ranked 11th through 50th in the set used to characterize se-

https://doi.org/10.5194/nhess-21-2001-2021                                   Nat. Hazards Earth Syst. Sci., 21, 2001–2020, 2021
2012 F. Letson et al.: Intense windstorms in the northeastern United States
probability of multiple damaging windstorm events occur-
ring within a single year.
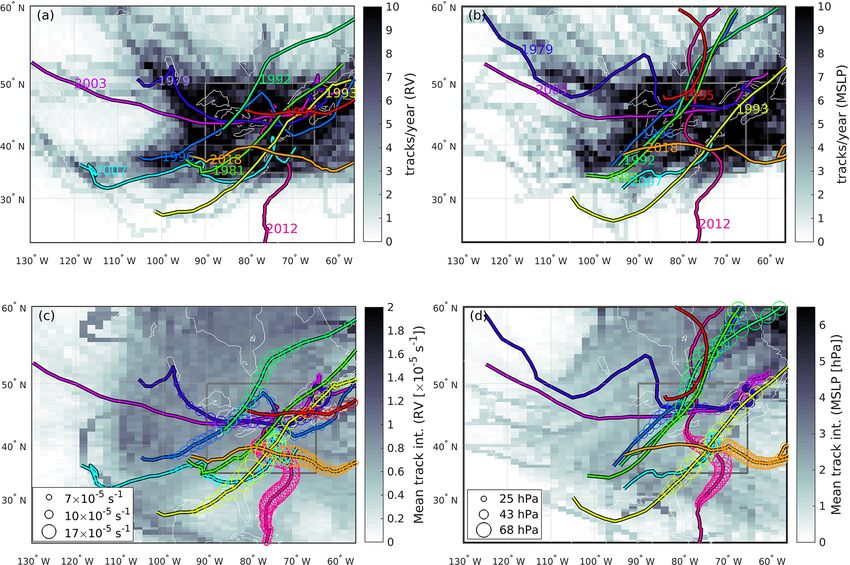
3.2 Cyclone detection and tracking
Consistent with past research employing other reanalysis
datasets (Ulbrich et al., 2009), results from application of
the cyclone detection and tracking algorithm to ERA5 out-
put also indicate the US Northeast exhibits a high frequency
of transitory cyclones (Fig. 7). Also in accord with expecta-
tions, the tracks followed by the top 10 windstorms are gen-
erally characteristic of those dominant cyclone tracks and de-
rive from a mixture of intense NEs, ACs, CLs, and decaying
TCs (Table 3, Fig. 7).
For most cyclones independent tracking of the center us-
ing MSLP and RV yields results that are highly consistent
(Fig. 3). Nevertheless, some discrepancies exist. These likely
arise, at least in part, due to the spectral field smoothing. An-
other possibility is that, if there is a strong background flow
due to a strong pressure gradient, the vorticity can be offset
relative to the pressure minimum (Sinclair, 1994).
Cyclone intensities for the top 10 windstorms are an order
of magnitude above the mean intensities for cold-weather cy-
clones at the same locations over the USA for both RV and
MSLP (Fig. 8). The median intensity of RV tracks for the
Figure 6. Time series of high wind coverage and mean precipitation 10 storms is 7 × 10⁻⁵ s−1 as compared to 6 × 10⁻⁴ s−1 for
rate during the four windstorms that occurred after the year 2000. all cold-season tracks affecting the Northeast. The median
Each subplot includes the fraction of ERA5 grid cells with over- intensity of MSLP tracks for the 10 storms is 25 hPa as com-
threshold wind speeds (U >U999 ); the number of ASOS stations pared to 1.2 hPa for all cold-season Northeast storms (Fig. 7,
with over-threshold wind speeds; and the mean precipitation rate Table 3). Both the 2012 and the 1993 windstorms (ranked no.
(in land areas of Northeast states within 200 km of a radar station) 1 and no. 8, respectively; see Table 2) are the result of decay-
from ERA5, NWS radar, and ASOS point observations. ing tropical cyclones, with the 1993 system transitioning to
become a NE (Figs. 3 and 7, Table 3). The 2012 windstorm
exhibited extremely high intensity and is also associated with
riality have a mean extent of 216 grid cells and range in ex- the largest area (number of grid cells) with U >U999 . It was
tent from 176 to 309 cells, further indicating that the top 10 also associated with by far the largest amount of property
storms are distinct in the 40-year time series (Fig. 1). One damage and deaths (Fig. 3, Table 2). Five of the 10 storms
windstorm (on 19 January 1996) is excluded by use of a 14 d are associated with Colorado lows, consistent with the high
separation window from the list of the top 10 storms but is prevalence of such cyclones (Booth et al., 2015) (Fig. 7).
included if a 2 d exclusion period is used. It would have been These storms generally impacted the smallest areas and tend
ranked number 10. to be associated with substantial but lower amounts of prop-
The probability distribution of the annual counts of wind- erty damage than TCs or ACs (Table 2).
storms is relatively well described by a Poisson distribu- The 2003, 1979, and 1995 windstorms are associated with
tion. The resulting dispersion value (D) is 0.18, indicating Alberta clippers (Table 3) that exhibit initially low intensi-
evidence for serial dependence or, alternatively stated, that ties but rapidly intensify as they pass across the Great Lakes
these windstorms are clustered in fewer years than would region (∼ 45◦ N, 80◦ W). Cyclone intensities for these three
be expected for independent events. Of 10 000 bootstrapped storms increased by an average of 16 % for RV and 33 % for
samples, 99.97 % had dispersion indices above zero. While MSLP during their crossing of the Great Lakes longitudes
this D value (0.18) is symptomatic of serial clustering for (92 to 76◦ W). Consistent with a priori expectations, these
windstorms that impact the northern USA, much higher se- windstorms occurred when Great Lakes ice cover was mini-
rial clustering was reported for regions of Europe in ear- mal (https://www.glerl.noaa.gov/data/ice/atlas/ice_duration/
lier research using the 20th-century ERA reanalysis and a duration.html, last access: 2 June 2021). Both 2003 and 1979
98th-percentile wind speed threshold (Walz et al., 2018). The windstorms (ranked no. 2 and no. 3, respectively) exhibit
lower amount of serial clustering of windstorms in the north- large spatial scales (Fig. 4) and resulted in substantial prop-
eastern states at the annual timescale is indicative of a lower erty damage (Table 2).
Nat. Hazards Earth Syst. Sci., 21, 2001–2020, 2021 https://doi.org/10.5194/nhess-21-2001-2021F. Letson et al.: Intense windstorms in the northeastern United States 2013
Table 3. Windstorm details (windstorms are ordered as in Table 2). Cyclone type is based on subjective evaluation of results from the cyclone
detection and tracking algorithm. AC – Alberta clipper. TC – tropical cyclone. CL – Colorado low. NE – nor’easter. Max intensity is the
maximum cyclone intensity along the storm-associated cyclone tracks for RV (×10−5 s−1 ) and MSLP (scaled by −1, hPa). No. cells with
Umax indicates the number of grid cells for which the maximum wind speed for the storm year occurred within the storm period. Median
RP is the 50th-percentile return period for maximum wind speed in each northeastern grid cell during each storm period, while p95 is the
95th-percentile RP. Also shown is the median RP for grid cells that exhibited U >U999 at the storm peak. All RP values include a 95 %
confidence interval in parentheses.
Cyclone track start Cyclone track end
Cyclone Time Lat Long Time Lat Long Max No. cells Median p95 RP [years] Median RP of
type [◦ N] [◦ W] [◦ N] [◦ W] intensity: with RP [years] (95 % CI) cells exceeding
RV Umax (95 % CI) U999 [years]
[10−5 s−1 ] (95 % CI)
/ MSLP
[−1 hPa]
TC 2012/10/18 11.61 61.1 2012/11/2 46.92 74.95 14.3/49.1 530 4.6 (2.9–9.3) 105.8 (29.7–583) 12.2 (5.8–34.8)
09:00 00:00
AC 2003/11/11 52.97 129.82 2003/11/23 50.39 68.5 10.5/36.9 494 2.3 (1.8–3.6) 34.9 (12.9–138.3) 5.5 (3.3–12.1)
00:00 06:00
AC 1979/4/4 50.61 105.62 1979/4/8 46.98 63.88 10.0/32.1 412 1.6 (1.4–2) 43.6 (15.6–178.9) 6.4 (3.7–14.6)
00:00 21:00
CL 1996/1/26 37.91 105.01 1996/2/1 57.08 41.55 10.5/45.4 488 3.5 (2.4–6.7) 19.4 (8.3–62.7) 5.1 (3.1–10.9)
00:00 06:00
CL/NE 2007/4/11 36.44 118.73 2007/4/17 39.56 69.32 12.4/39.6 462 1.6 (1.4–2.1) 18.1 (7.9–59.3) 3.7 (2.5–7.3)
21:00 18:00
CL 1992/11/12 42.71 86 1992/11/15 57.06 45.63 11.2/50.1 343 1.5 (1.3–1.8) 6.5 (3.7–14.8) 3 (2.1–5.4)
21:00 12:00
CL 1981/2/11 37.44 94.5 1981/2/16 63.41 37.65 8.9/56.3 523 2.2 (1.7–3.4) 22.2 (9.4–72.1) 6.6 (3.7–15.1)
00:00 06:00
TC/NE 1993/3/12 27.37 101.4 1993/3/15 51.88 52.39 15.3/49.2 536 2.1 (1.7–3.2) 36.8 (13.6–144.1) 5.4 (3.2–12)
06:00 18:00
CL 2018/3/1 38.14 93.72 2018/3/6 42.13 53.31 13.3/40.9 310 1 (1–1) 14.1 (6.5–43.5) 4.9 (3–10.5)
03:00 06:00
AC 1995/4/4 45.88 80.74 1995/4/10 62.63 58.16 9.5/24.2 94 1 (1–1) 14.4 (6.7–42.4) 2.3 (1.8–3.6)
15:00 06:00
Tracking of windstorms is a key determinant of societal from the southeast to the northwest, but their centers diag-
impacts. The 2018 windstorm is associated with a CL that nosed from MSLP remain east of the region, as do those from
stalled over the Atlantic coast and re-intensified to form a RV in 1992 and 1996. The geographic centroids of high wind
NE. Although this event is not the most geographically ex- speeds track through Virginia, Pennsylvania, and New York
pansive, its track over very high density population areas in all three events, but the advection velocity of the cyclones
and high value assets led to high associated storm dam- and the point in their life cycle vary (Fig. 7). Accordingly,
age (Fig. 3). The 2012 and 2018 windstorms passed over inflation-adjusted damage amounts range from USD 24 mil-
highly populated areas, including New York, and are asso- lion for the 1981 windstorm to USD 2181 million for the
ciated with recorded damage in the hundreds of millions of 1996 windstorm (Figs. 3 and 7).
dollars (Fig. 3, Table 2). Conversely, the 1993 windstorm
high-wind-speed centroid is out over the Atlantic Ocean, 3.3 Windstorm return periods
which may partly explain the lower loss of life and prop-
erty damage associated with this event (Fig. 3). The AC- All 10 windstorms are associated with long-return-period
associated windstorms (2003, 1979, and 1995) track west– (RP>50 years) wind speeds in at least some ERA5 grid cells.
east and have maximum intensity centers across the north Data from some grid cells within the Northeast indicate re-
of the region. They are thus associated with lower damages turn periods of over 100 years for the 2012 windstorm. Defin-
over the USA than the other windstorms. Cyclones associ- ing a single return period for each windstorm is difficult due
ated with the windstorms in 1992, 1996, and 1981 tracked to the multiple degrees of freedoms, but the median (50th
percentile) and highest 5 % (95th percentile) of ERA5 grid
https://doi.org/10.5194/nhess-21-2001-2021 Nat. Hazards Earth Syst. Sci., 21, 2001–2020, 2021You can also read


