Geographic-information-system-based topographic reconstruction and geomechanical modelling of the Köfels rockslide - Natural Hazards and Earth ...
←
→
Page content transcription
If your browser does not render page correctly, please read the page content below
Nat. Hazards Earth Syst. Sci., 21, 2461–2483, 2021
https://doi.org/10.5194/nhess-21-2461-2021
© Author(s) 2021. This work is distributed under
the Creative Commons Attribution 4.0 License.

Geographic-information-system-based topographic reconstruction
and geomechanical modelling of the Köfels rockslide
Christian Zangerl1 , Annemarie Schneeberger1,2 , Georg Steiner1,3 , and Martin Mergili1,4
1 Department   of Civil Engineering and Natural Hazards, Institute of Applied Geology, University of Natural Resources and
Life Sciences (BOKU), Vienna, 1190, Austria
2 Institute of Geography, University of Innsbruck, Innsbruck, 6020, Austria
3 Amt der Kärntner Landesregierung, Klagenfurt, 9021, Austria
4 Department of Geography and Regional Science, University of Graz, Graz, 8010, Austria

Correspondence: Christian Zangerl (christian.j.zangerl@boku.ac.at)

Received: 16 July 2020 – Discussion started: 9 September 2020
Revised: 17 May 2021 – Accepted: 24 June 2021 – Published: 23 August 2021

Abstract. The Köfels rockslide in the Ötztal Valley (Ty-         mass, advancing from shallow to deep-seated zones, espe-
rol, Austria) represents the largest known extremely rapid       cially by the development of internal shear zones, as well
landslide in metamorphic rock masses in the Alps. Although       as localized domains of increased block failure. The simu-
many hypotheses for the trigger were discussed in the past,      lations further highlighted the importance of considering the
until now no scientifically proven trigger factor has been       dominant structural features of the rock mass. Considering
identified. This study provides new data about the (i) pre-      back-calculations of the strength properties, i.e. the friction
failure and failure topography, (ii) failure volume and poros-   angle of the basal shear zone, the results indicated that under
ity of the sliding mass, and (iii) numerical models on ini-      no groundwater flow conditions, an exceptionally low fric-
tial deformation and failure mechanism, as well as shear         tion angle of 21 to 24◦ or below is required to promote fail-
strength properties of the basal shear zone obtained by back-    ure, depending on how much internal shearing of the sliding
calculations. Geographic information system (GIS) methods        mass is allowed. Model runs considering groundwater flow
were used to reconstruct the slope topographies before, dur-     resulted in approximately 6◦ higher back-calculated critical
ing and after the event. Comparing the resulting digital ter-    friction angles ranging from 27 to 30◦ . Such low friction an-
rain models leads to volume estimates of the failure and de-     gles of the basal failure zone are unexpected from a rock
position masses of 3100 and 4000 million m3 , respectively,      mechanical perspective for this strong rock, and groundwa-
and a sliding mass porosity of 26 %. For the 2D numeri-          ter flow, even if high water pressures are assumed, may not
cal investigation the distinct element method was applied to     be able to trigger this rockslide. In addition, the rock mass
study the geomechanical characteristics of the initial failure   properties needed to induce failure in the model runs if no
process (i.e. model runs without a basal shear zone) and to      basal shear zone was implemented are significantly lower
determine the shear strength properties of the reconstructed     than those which would be obtained by classical rock me-
basal shear zone. Based on numerous model runs by vary-          chanical considerations. Additional conditioning and trigger-
ing the block and joint input parameters, the failure process    ing factors such as the impact of earthquakes acting as pre-
of the rock slope could be plausibly reconstructed; however,     cursors for progressive rock mass weakening may have been
the exact geometry of the rockslide, especially in view of       involved in causing this gigantic rockslide.
thickness, could not be fully reproduced. Our results sug-
gest that both failure of rock blocks and shearing along dip-
ping joints moderately to the east were responsible for the
formation or the rockslide. The progressive failure process
may have taken place by fracturing and loosening of the rock

Published by Copernicus Publications on behalf of the European Geosciences Union.
2462                                C. Zangerl et al.: GIS-based topographic reconstruction and geomechanical modelling

1   Introduction                                                      In our study we used new high-resolution (1 m raster data)
                                                                   ALS-based (airborne laser scanning) digital terrain models,
In mountain areas, life and property are often put at risk by      new geological mapping data and pre-existing data from
landslide processes (e.g., Dai et al., 2002; Nadim et al., 2006;   seismic measurements to re-build and re-analyse the pre-
Margottini et al., 2013; Sassa et al., 2014). Rapid collapses      and post-failure topographies and geometries of the rock-
of huge mountain slopes – and resulting process chains –           slide. Based on this topographic reconstruction by using ge-
have repeatedly evolved into catastrophic events (e.g., Evans      ographic information system (GIS) analysis methods, a ge-
and DeGraff, 2002; Govi et al., 2002; Genevois and Ghirotti,       ometrical and kinematical rockslide model was developed.
2005; Evans et al., 2009a, b). An adequate understanding           Conclusions can be made about the failed and deposited vol-
of the mechanisms of the initial failure and extremely rapid       umes and consequently the change of rock mass porosity in-
movement processes is one key for the implementation of ef-        duced by the rapid sliding and fracturing and loosening pro-
fective risk reduction strategies. The analysis of past – even     cesses.
fossil – events may contribute to a better understanding of           Concerning geomechanics of the rockslide at initial failure
landslide processes and therefore help us to develop and to        state and movement, several attempts were made to investi-
improve methods for hazard and risk mitigation (Kilburn and        gate the mechanisms and to back-calculate rock mass proper-
Pasuto, 2003).                                                     ties. Erismann et al. (1977) developed a kinematic and ther-
   Known as the largest landslide in metamorphic rock              modynamic model to explain the energy release necessary
throughout the European Alps, the Köfels rockslide repre-          for the formation of the frictionites that were found at the
sents such a fossil landslide (see Sect. 2 for a detailed de-      Köfels site (see Sect. 2). Brückl and Parotidis (2001) set up a
scription). In contrast to numerous deep-seated rockslides         2D elastic and elasto-plastic continuum model to estimate the
in foliated metamorphic rocks characterized by movement            geomechanical rock mass properties of the Köfels rockslide.
rates of a few centimetres to decimetres per year and with-        In their approach they applied the 2D finite element method
out indications of total slope failure (Zangerl et al., 2015),     to explore the initial phase of the failure process by studying
the Köfels rockslide is a prominent case study for a sudden        the creeping and strength degradation of the rock mass. The
slope failure with extremely rapid movement velocities. This       model suggests that the Köfels rockslide was formed due to
can be clearly demonstrated by the occurrence of friction-         the progressively weakening strength of the rock mass, which
ites which were found at outcrops on the deposited sliding         was initiated at the foot of the slope and propagated uphill.
mass (Erismann et al., 1977). Even though this giant land-         Furthermore, the model calculations determined surprisingly
slide has been the subject of numerous studies focussing on        low friction angles of the rock mass, ranging between 20 and
the genesis of the frictionites, age of the event, spatial dis-    24◦ , to induce slope failure. In another approach, Brückl
tribution of the source area, volume of the rockslide mass         and Parotidis (2005) proposed a model with focus on time-
and geomechanical aspects concerning the trigger and fail-         dependent strength degradation and slope failure under low
ure mechanisms (e.g., Pichler, 1863; Milton, 1964; Preuss,         stress regimes such as rock mass creep and subcritical crack
1974, 1986; Erismann et al., 1977; Preuss et al., 1987; Eris-      growth. They suggest that subcritical crack growth is a pri-
mann and Abele, 2001; Brückl et al., 2001, 2010; Brückl and        mary geomechanical process which, after glacier retreat, is
Parotidis, 2001, 2005; von Poschinger, 2002; Sørensen and          able to explain the considerable rock mass strength weaken-
Bauer, 2003; Prager et al., 2009, Nicolussi et al., 2015), the     ing needed for failure.
conditioning and triggering factors of the Köfels rockslide           However, the extraordinary low-strength properties of the
still remain unknown and speculative.                              rock mass that were back-calculated by 2D continuum ap-
   Computer models focussing on the rockslide geometry and         proaches for the failure state raise questions:
geomechanical processes may help to increase our under-
standing of the mechanisms of rock slope failure. Although           – Can we plausibly reconstruct the topography to provide
models are always a rough simplification of reality, some are          a realistic pre-failure topography for the geomechanical
useful to explore specific aspects such as initial failure pro-        modelling?
cesses, slope deformations, rockslide volumes or critical val-
ues of geomechanical parameters at failure. In the context of        – How could the initial failure and slope deformation pro-
this study two types of models, i.e. topographical and geome-          cess have taken place?
chanical models, are relevant. Brückl et al. (2001) were the
first ones who reconstructed the 3D pre-failure topography           – How can the strength of such a strong granitic rock mass
and failure geometry of the Köfels rockslide on the basis of           reduce to such small values needed to promote failure?
seismic measurements and terrain models, and they derived
parameters such as failure and deposition volumes, porosity,         – Are there any structural particularities in the Köfels
the initial and average sliding angles, and the release of po-         rockslide area that may have contributed to slope fail-
tential energy.                                                        ure and what is the influence of the pre-existing fracture
                                                                       network?

Nat. Hazards Earth Syst. Sci., 21, 2461–2483, 2021                                https://doi.org/10.5194/nhess-21-2461-2021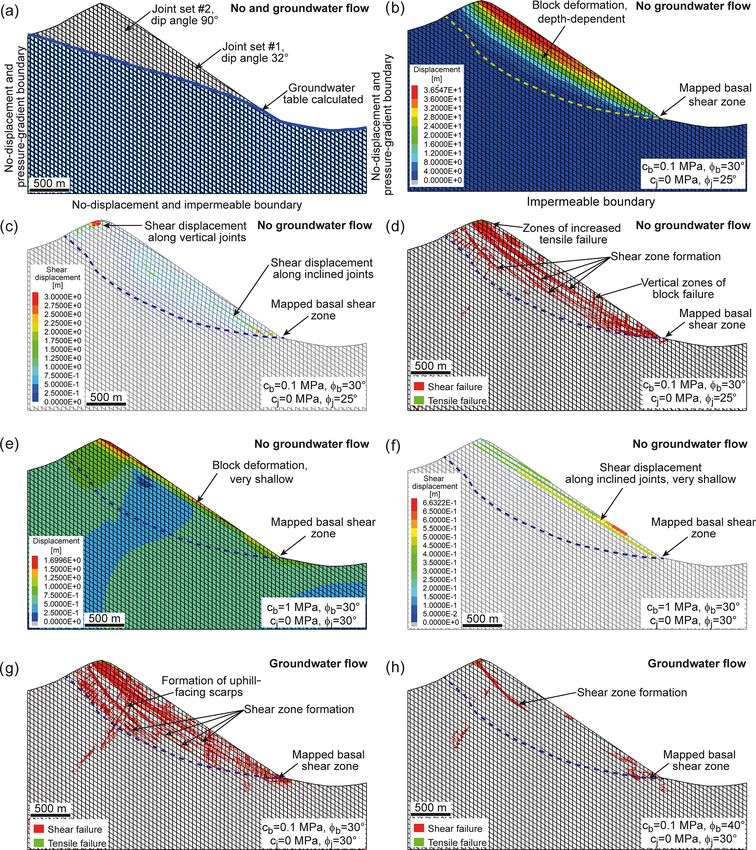
C. Zangerl et al.: GIS-based topographic reconstruction and geomechanical modelling                                           2463

  – Why do we observe only one such giant and extremely            2     Study area and data
    rapid rockslide characterized by a flat to moderately
    dipping failure surface in the Ötztal–Stubai crystalline       2.1    Geographic and geologic setting
    basement?
                                                                   The Köfels rockslide (Figs. 1 and 2) occurred in the central
Given that, so far, only 2D continuum models have been             part of the north–south striking Ötztal Valley (Tyrol, Aus-
applied to investigate the failure mechanisms of the Köfels        tria), at present at an elevation between 950 and 1100 m a.s.l.
rockslide, we believe that, though representing a valid ap-        Surrounded by up to 3000 m high summits, this area is deeply
proach, additional types of models, e.g. discontinuum mod-         incised in the poly-metamorphic Ötztal complex, a major
els, are useful to adequately capture the complexity of the        thrust unit belonging to the Upper Austro-alpine basement
phenomenon. Discontinuum models such as the distinct el-           nappes (Prager et al., 2009). Lithologically, different types
ement method have the advantage that the geometry of the           of metamorphic rocks, i.e. paragneisses, quartzites and mica
rockslide mass and the discrete basal shear zone can be im-        schists, with intercalations of orthogneisses, amphibolites
plemented directly based on geometrical and structural field       and eclogites are encountered (Hammer, 1929; Purtscheller,
observations and GIS reconstructions. Geomechanically, the         1978). The complex ductile and brittle structural setting re-
basal shear zone, i.e. stepped rupture surface, can be consid-     sults from polyphase and heteroaxially deformations and is
ered in the model as a discrete narrow zone. In order to fill      attributed to at least three distinct orogeneses and their corre-
this gap, we set up a 2D discontinuum model of the Köfels          sponding regional metamorphic overprint. In contrast to nu-
rockslide based on the geometry obtained by the topographic        merous petrological and geochronological studies, the brittle
reconstruction and by applying the Universal Distinct Ele-         deformation history and the related structures of the Ötztal
ment Code (UDEC; Itasca, 2020). The initial failure process        basement have not been studied so far in detail but would
was studied by considering the main structural characteris-        be highly relevant for geomechanical purposes. However,
tics based on geological field surveys. The aim was to inves-      Prager et al. (2009) provide some data concerning the discon-
tigate how the rockslide geometry and the basal shear surface      tinuity network in the surroundings of the Köfels rockslide.
(zone) was formed during the initial failure process. In addi-        During the Quaternary period, the Ötztal Valley was in-
tion, back-calculations of the critical angle of friction along    fluenced by repeated glacier fluctuations causing valley in-
the basal shear zone assuming no groundwater flow condi-           cision and glacial and fluvial erosion, as well as sediment
tions and groundwater flow are conducted under quasi-static        accumulation. Valley deepening and steepening lead to sub-
conditions. These back-calculations were done to determine         stantial stress redistributions in the rock slopes, which in turn
the shear strength properties, i.e. friction angle and cohesion,   initiates time-dependent progressive failure processes in the
of the predefined and field-based basal shear zone needed          fractured rock mass and may expose preferentially orientated
to promote failure. The models were performed to explore           failure surfaces.
the influence of fracture water pressure in the rock mass and
basal shear zone resulting from high groundwater levels for        2.2    The Köfels rockslide
provoking this giant landslide.
   The numerical modelling study was supplemented by a             The age of the Köfels rockslide was determined several times
geological field survey searching for instability-relevant dis-    through radiocarbon dating of wood buried by the rockslide
continuities of different origin and scale. This was done to in-   deposits (Ivy-Ochs et al., 1998), surface exposure dating of
vestigate the impact of discontinuities which ideally are dip-     rockslide boulders (Kubik et al., 1998) and actually by tree-
ping moderately towards the east, acting as weakness zones         ring analysis and radiocarbon dating of new wood samples
and thus reducing the overall rock mass strength. Particular       (Nicolussi et al., 2015). The last dating campaign, yielding
focus was given to the identification of low-strength brittle      9527–9498 cal BP, led to a significant refining of the timing
fault zones composed of gouges and breccia characterized           of the Köfels landslide event and even was able to constrain
by a high persistence.                                             the season during which the event occurred.
   Next, we introduce the study area, the Köfels rockslide            The main source of the slide is located in competent frac-
(Sect. 2). Then, we explain the methods applied for the            tured orthogneisses (augengneiss) around the small village of
topographic reconstruction and geomechanical modelling             Köfels. Only the southern head scarp area of the rockslide is
(Sect. 3). We present (Sect. 4) and discuss (Sect. 5) the re-      composed of paragneissic rock. The head scarp located at the
sults before concluding with the key messages of this study        western slope of the central Ötztal Valley is very steep with
(Sect. 6).                                                         inclinations of up to 40–80◦ . Comprising a failure volume
                                                                   of more than 3000 million m3 the Köfels rockslide demon-
                                                                   strates a particular event of very rapid large-scale failure in
                                                                   metamorphic rock mass (Brückl et al., 2001). Typically, such
                                                                   rapid rockslides characterized by a moderately inclined basal
                                                                   failure surface occur in carbonatic rock masses (Prager et

https://doi.org/10.5194/nhess-21-2461-2021                                 Nat. Hazards Earth Syst. Sci., 21, 2461–2483, 2021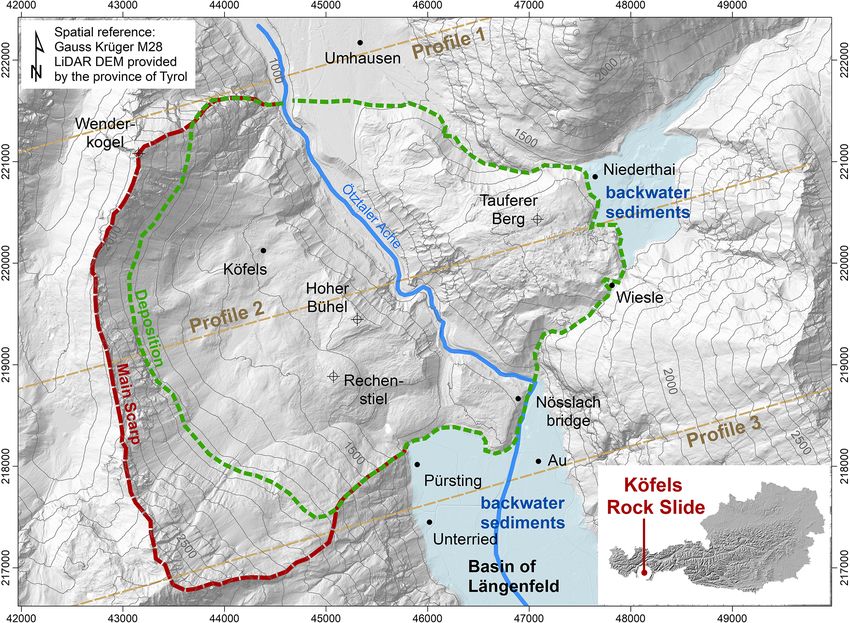
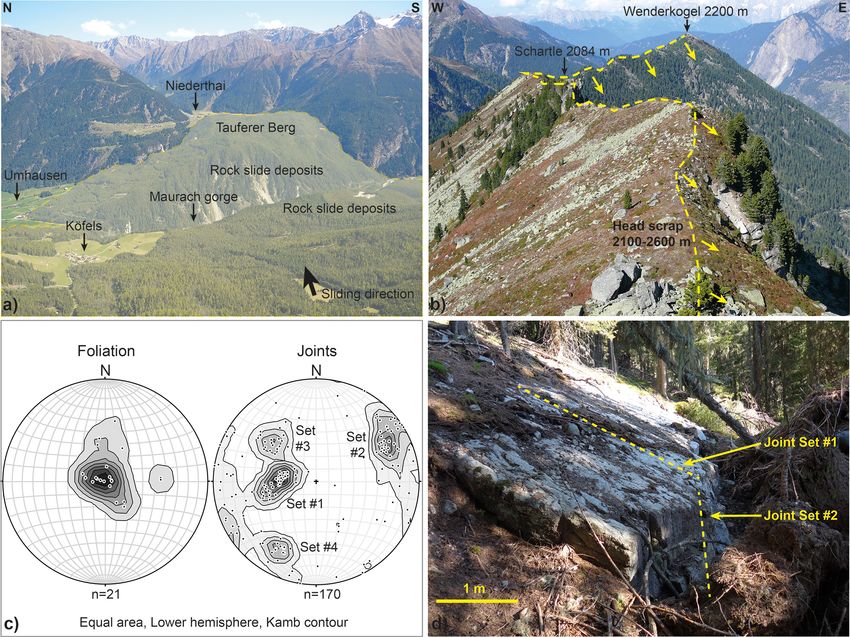
2464                                  C. Zangerl et al.: GIS-based topographic reconstruction and geomechanical modelling

Figure 1. (a) Panoramic view of the Köfels rockslide deposits from head scarp towards the east with the Maurach Gorge cutting through the
deposits (centre) and the backwater sediments in Niederthai (right), (b) view of the head scarp from south to north, (c) measured foliation
and joint planes (poles to planes) in the surroundings of the central part of the head scarp, and (d) outcropping rupture surface formed along
a moderately dipping plane of joint set #1 and linked with joint set #2 (stepped failure plane). Stereonet pole and contour plots were created
using the Stereonet software (Allmendinger, 2018; Cardozo and Allmendinger, 2013).

al., 2008). The displacement of the sliding rock mass was                the field. It seems even more plausible that the immense in-
initiated at the east-facing slope south of Wenderkogel (see             ternal rock mass deformation during the movement and the
Figs. 1 and 2) and stopped at the opposite slope in the east             adaptation to the terrain surface were based on the forma-
at the entrance of the tributary valley, the Horlachtal Valley,          tion of numerous internal shear zones. The disintegration of
where it collided with massive bedrock. The centre of mass               the rock mass during the slide event caused a very hetero-
displaced by around 2.6 km (Sørensen and Bauer, 2003),                   geneous highly fractured and partly crushed rock mass, with
reaching a velocity of approximately 50 m/s (Erismann et al.,            shear zones composed of gouges and breccias and zones with
1977). The main rockslide deposit blocked the Ötztal Valley              blocks of more than 10 m diameter (Sørensen and Bauer,
and formed a prominent valley spur of fractured and disin-               2003). Furthermore, zones that are characterized by high
tegrated orthogneiss. Erismann and Abele (2001) proposed                 fracture frequencies only marginally increased in comparison
that the mass was split into two parts with the lower one                to those commonly observed in undisturbed fractured rock
arresting due to the collision within the steep valley slope             masses. This distinctive fragmentation of rock led to radon
and the upper one which continued its movement, thus cre-                gas emissions and locally radioactive springs which affected
ating an additional internal sub-horizontal shear zone. The              the population in Umhausen and caused noticeably high can-
Tauferer Berg (see Figs. 1 and 2) was formed when the upper              cer rates (Purtscheller et al., 1995).
mass continued its movement towards the Horlachtal Valley                   After the slide event, a temporary lake flooded the basin
for approximately 1 more kilometre and ran up for approx-                of Längenfeld, impounded by the valley spur (Ampferer,
imately 100 m. Though plausible, evidence for a distinct in-             1939). As a result of the flooding backwater sediments were
ternal shear zone was claimed by Preuss (1986), but proof                deposited in the basin of Längenfeld, as well as in the
for the existence of such a feature has not yet been found in            blocked tributary of the Horlachtal Valley at Niederthai. Ac-

Nat. Hazards Earth Syst. Sci., 21, 2461–2483, 2021                                        https://doi.org/10.5194/nhess-21-2461-2021
C. Zangerl et al.: GIS-based topographic reconstruction and geomechanical modelling                                      2465

Figure 2. Overview map of the Köfels rockslide area.

cording to drilling data from von Klebelsberg (1951) and         rockslide (Prager et al., 2009; Brückl and Parotidis, 2005;
Ampferer (1939), the lacustrine sediments reach a maximum        Abele, 1994). Moreover, permafrost degradation is suspected
thickness of 92 m. Later on, the river Ötztaler Ache cut into    to have influenced the failure of many Holocene deep-seated
the rockslide deposits, forming the Maurach gorge by fluvial     rockslides (Abele, 1994) – a phenomenon that gains new
erosion (see Figs. 1 and 2; Erismann and Abele, 2001).           relevance considering the degrading permafrost in today’s
   When the mountain slope collapsed, an amount of about         mountains influenced by modern climatic changes (e.g. Gru-
1.65 × 10⁷ GJ of energy was released. This value was esti-       ber and Haeberli, 2007; Huggel et al., 2012). Abele (1994)
mated by Erismann and Abele (2001) with respect to volume,       and Weidinger (2006) describe active tectonics, i.e. earth-
density and vertical displacement of the rock mass. The high     quakes, as one main background condition provoking large
amount of released energy led to partial melting of the or-      rockslide events due to dynamic loading. Considering the
thogneissic rock at the progressively exposed sliding surface    present low seismic activity in the Ötztal Valley, Sørensen
but also around internal shear zones and the development         and Bauer (2003) question an earthquake as a possible trig-
of a fused rock (i.e. pumice, frictionites, hyalomylonites),     ger for the event.
the presence of which was interpreted in various ways over
the years (e.g., Pichler, 1863; Preuss, 1974; Erismann et al.,   2.3   Data
1977; Masch et al., 1985; Weidinger et al., 2014).
   Though subject of research for more than one century, the     An up-to-date digital elevation model (DEM), gained by air-
question of the causes and maybe the “single” trigger for the    borne laser scanning (lidar), of the investigated area was
Köfels rockslide remains still open. Most probably a combi-      obtained from the governmental service for maps of Ty-
nation of various conditioning and interacting triggering fac-   rol, TIRIS, at a spatial resolution of 1 m. Topographic and
tors led to the release of this giant slide.                     geologic information on the situation before and after the
   Given that the collapse of Köfels occurred several thou-      Köfels rockslide are given through studies of von Klebels-
sand years after valley deglaciation, time-dependent progres-    berg (1951), Brückl (2001), Heuberger (1994), and Prager et
sive failure processes such as sub-critical crack growth and     al. (2009). Data from several boreholes from von Klebels-
fracture propagation were caused by over-steepening of the       berg (1951) were used in this work. Additionally, reflection
valley flanks which is assumed to have provoked unstable         and refraction seismic measurements were conducted be-
conditions in the slope. This long-term disintegration of rock   tween 1986 and 1990 (Brückl and Heuberger, 1993; Brückl
is seen as a prerequisite for the development of a large-scale   et al., 1998, 2001). In the framework of a hydroelectric power
                                                                 project an investigation drift was drilled into the Tauferer

https://doi.org/10.5194/nhess-21-2461-2021                             Nat. Hazards Earth Syst. Sci., 21, 2461–2483, 2021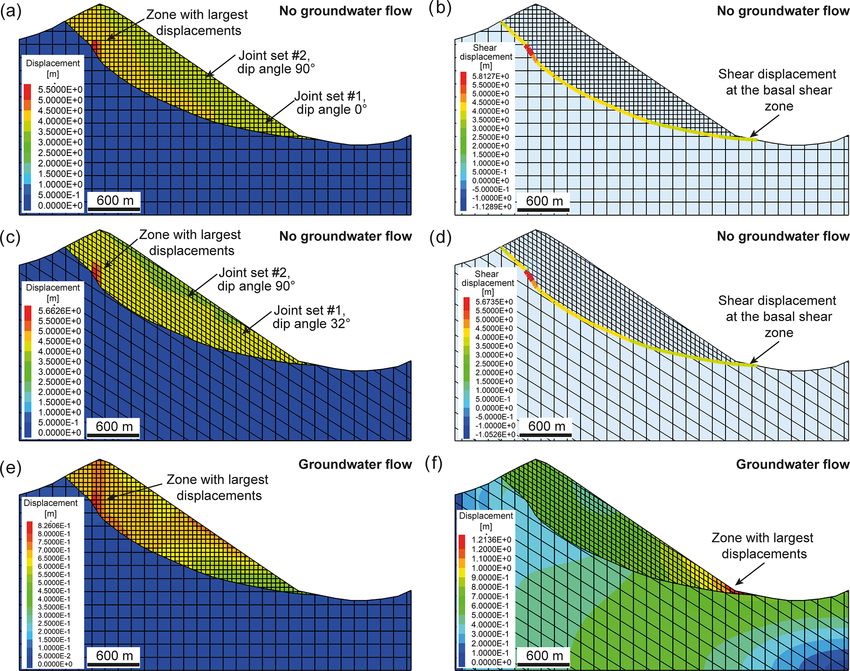
2466 C. Zangerl et al.: GIS-based topographic reconstruction and geomechanical modelling
Köfels rockslide. These sediments were buried by the rock-
slide mass and their upper boundary used for the reconstruc-
tion of the topographic scenario in the valley as it was before
the Köfels rockslide. The deepest horizon with a maximum
depth of 400 m was interpreted as the compact rock surface –
identical with the sliding plane of the rockslide at the flanks
of the valley (Brückl et al., 2001).
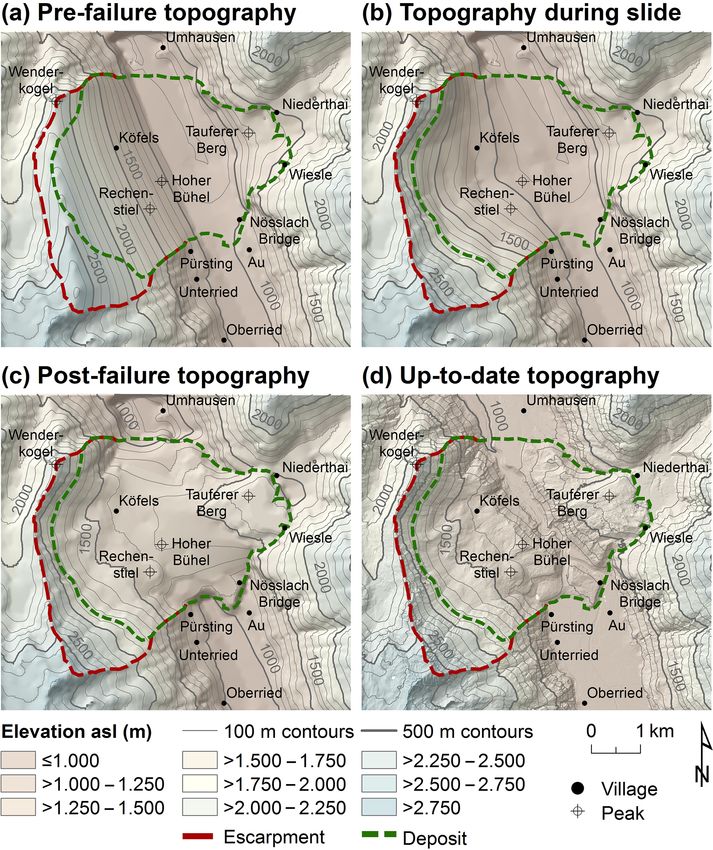
The available data are then used to three-dimensionally re-
construct four topographic situations, assuming a U-shaped
pre-failure valley topography, as well as a curved failure sur-
face:
1. the pre-failure topography before the Köfels rockslide
event and before the alluvium north and south of the
site was deposited
2. the topography of the failure surface with the deposits
completely removed from the model to illustrate the
basal shear zone and without the alluvial deposits north
and south of the rockslide
3. the post-failure topography without the alluvial deposits
Figure 3. Borehole data (BH), echo soundings (ESs) and seismic and with the Köfels rockslide deposit in the valley be-
profiles (SPs) used for the topographic reconstruction of the Köfels
fore the incision by the Ötztaler Ache
rockslide.
4. the up-to-date topography where the Maurach gorge
Berg in 1952 which provides additional information about was created by the incision of the Ötztaler Ache into
the geological setting of the site (Brückl et al., 2001; Ascher, the deposits and the alluvium deposited in the basins of
1952). Figure 3 provides an overview of the geophysical and Längenfeld and Umhausen (see Fig. 2).
drilling data used for the study. Within the rockslide mass only information from seismic
profiles and the investigation adit was given. In the failure
3 Methods area only a little data were available. The reconstruction of
the pre-failure topography of the Köfels rockslide was built
3.1 Reconstruction of rockslide topography, volume on the contour lines of the escarpment of the up-to-date
and porosity DEM. The hypothetic pre-failure slope between the edges
of the escarpment was assumed plane. This simple way of
Three topographic profiles were constructed based on the reconstruction does not require additional assumptions not
drilling and seismic data provided by von Klebelsberg supported by observations.
(1951), Heuberger (1994), and Brückl et al. (2001): Pro- The failure and the deposition volumes of the Köfels
file 1 is set north of the rockslide zone through the basin of rockslide mass were computed from the three reconstructed
Umhausen, Profile 2 lies within the sliding surface, and Pro- DEMs:
file 3 is south of the rockslide zone in the basin of Längenfeld
i=m
(see Figs. 2 and 3). X
VF = A zi, 1 − zi, 2 , (1)
Figures 2 and 3 show the location of the WSW–ENE pro-
i=1
files 1 and 3. The two profiles display the pre-failure topog- i=m
raphy reconstructed from the seismic and borehole data and VD =
X
A zi, 3 − zi, 2 , (2)
the up-to-date situation. The seismic profiles were projected i=1
to the topographic sections and transformed into point data
used as input for the GIS-based topographic reconstruction. where VF and VD are the failure and deposition volumes, and
All spatial analysis tasks were performed using the ArcGIS zi, 1 , zi, 2 and zi, 3 represent the reconstructed elevation of the
software (Esri, 2014). pixel i, the numbers referring to the stages given above. A is
For the reconstruction of the past topographic scenarios, the area of one pixel, and m is the number of pixels.
an intermediate horizon of the reflection seismic data was Based on the results of the volumetric calculation in Ar-
assumed as the top of compacted sediments made up of an cGIS, the porosity of the rock mass before and after failure
old valley infill, which was interpreted to be older than the of the Köfels rockslide was estimated. Porosity is defined as
Nat. Hazards Earth Syst. Sci., 21, 2461–2483, 2021 https://doi.org/10.5194/nhess-21-2461-2021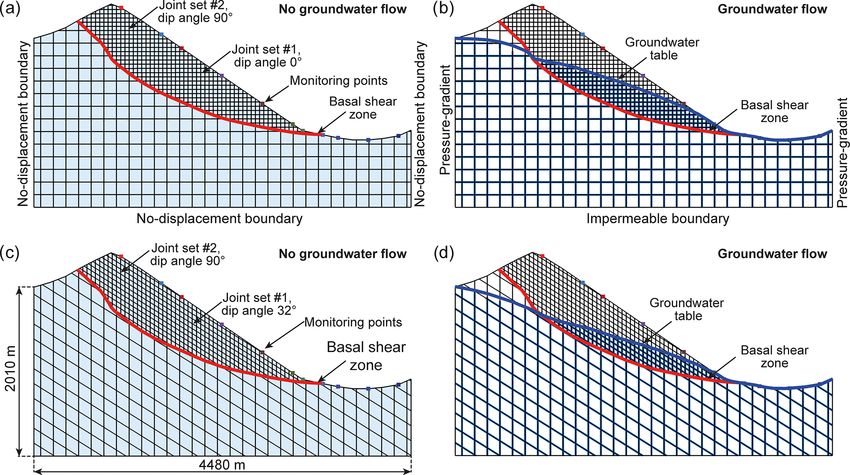
C. Zangerl et al.: GIS-based topographic reconstruction and geomechanical modelling                                          2467

the ratio of void space to the total volume of soil or rock            a to study the initial failure mechanism before the basal
(Fetter, 2001):                                                          rupture zone was formed
         Vp                                                            b to assess the impact of the pre-existing fracture network
n=            ,                                             (3)
      Vs + Vp                                                            on the failure geometry of the rockslide
where n is the porosity, Vp is the volume of void space, and           c to investigate the role of discontinuity and rock block
Vs is the volume of solids.                                              properties and constitutive relationships
3.2     Discontinuity mapping and rock mass                            d to back-calculate the shear strength properties of the
        characterization                                                 basal shear zone at the failure state and its bandwidth
                                                                         under the framework of the comprehensively recon-
In order to characterize the discontinuity network and the               structed pre-failure topography
rock mass strength a field survey based on outcrop and scan-
line mapping was performed at the slopes of the head scarp.            e to determine internal deformation behaviour of the
Particular focus was given to detect brittle fault zones com-            rockslide mass and the influence of the shape of the
posed of gouge and breccia, which are dipping moderately                 basal shear zone on it
towards the east and therefore could have acted, at least
                                                                       f to draw conclusions on the role of water pressure as
partly, as the basal shear zone of the Köfels rockslide. Es-
                                                                         a possible trigger mechanism of the event by evaluat-
timation of rock mass strength and shear strength of dis-
                                                                         ing the required shear strength properties against typical
continuities was done based on field surveys for rock mass
                                                                         values of fractured rock masses.
characterization, application of empirical methods (Hoek and
Brown, 1997) and analyses of existing laboratory tests to pro-     For the numerical study 2D distinct element models based
vide data for the comparison with results obtained by the nu-      on the code UDEC (Itasca, 2020) were designed. This soft-
merical modelling study.                                           ware tool characterizes a discontinuous rock mass by an as-
                                                                   sembly of discrete blocks with contacts or interfaces in be-
3.3     Distinct element modelling of the Köfels rockslide         tween. A continuum mesh of finite-difference zones provides
                                                                   the deformability of the blocks according to elastic or elasto-
3.3.1    Modelling strategy
                                                                   plastic constitutive models. During the calculation procedure
A discontinuum model (i.e. distinct or discrete element            the deformable blocks interact mechanically at their surfaces
method) has not yet been applied for geomechanical mod-            and corners. Block velocities and displacements are deter-
elling of the Köfels rockslide (see Sect. 1). The major ad-        mined, with the calculation procedure being repeated until a
vantage of discontinuum modelling compared to a classical          balanced state of equilibrium or ongoing failure is reached.
continuum approach is that (i) the structural anisotropy of
the rock mass caused by a discrete fracture network can be         4     Results
considered and (ii), typical for slides, a distinct, field-based
and, in relationship to the model size, thin basal sliding zone    4.1    Reconstruction of rockslide topography, volume
which is able to accumulate large shear displacements can be              and porosity
implemented and modelled.
   In this study we performed more than 50 model runs and          Figures 5 and 6 illustrates the results of the three-stage topo-
established two types of distinct element model scenarios          graphic reconstruction of the Köfels rockslide. Whilst stage
(scenarios I and II). Model scenario I was built to investigate    2 represents a theoretical situation that has never occurred in
the initial failure and deformation mechanism of the rock-         this way (however, it is necessary to reconstruct the rockslide
slide, primarily characterized by internal deformation of the      volumes; see Eqs. (1) and (2)), stages 1 and 3 represent hypo-
slope and the development of the fully persistent basal rup-       thetic morphologies directly before and after the event. Note
ture surface (shear zone). To achieve this, the model consid-      that the very smooth pre-failure topography of the failure
ered the main characteristics of the in situ fracture network      area most probably does not resemble the original shape of
(i.e. shear and opening displacements), as well as rock block      the mountain slope before failure (see Figs. 5 and 6a); how-
deformation and failure (i.e. the Mohr–Coulomb constitutive        ever, given the fact that there are no data supporting more ad-
model). However, a basal shear zone was not implemented.           vanced reconstruction methods, we considered this approach
Model scenario II was built to perform back-calculations of        a reasonable approximation. Stage 4 represents the situation
the shear strength properties of the basal shear zone at fail-     observed today. Comparing Fig. 6c and d indicate that those
ure state. Both scenarios were calculated either by consid-        morphologic processes have shaped the site since the event,
ering dry conditions or groundwater flow by applying a wa-         most significantly the incision of the Maurach gorge by the
ter pressure in the discontinuities. The aim of this modelling     Ötztaler Ache River into the rockslide deposits and the de-
campaign was                                                       position of lake sediments in the basins of Umhausen and

https://doi.org/10.5194/nhess-21-2461-2021                                 Nat. Hazards Earth Syst. Sci., 21, 2461–2483, 2021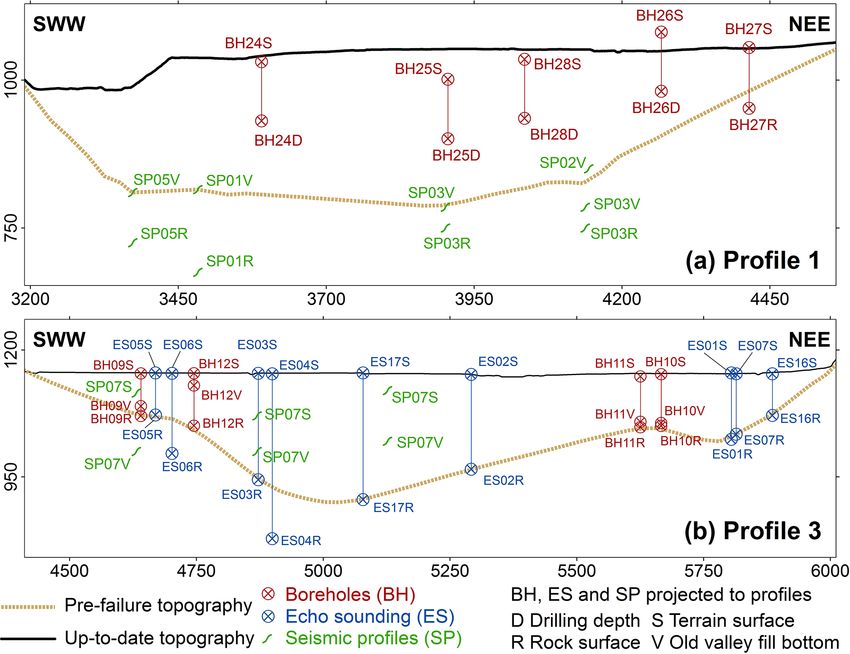
2468 C. Zangerl et al.: GIS-based topographic reconstruction and geomechanical modelling
Figure 4. Profiles through the valley bottom in the Köfels rockslide area (see Figs. 2 and 3). (a) Profile 1 in the north of the Köfels site in the
basin of Umhausen. (b) Profile 3 in the south of the Köfels site in the basin of Längenfeld. Note that the point data and seismic profiles (see
Fig. 3) are projected to the profile planes and therefore do not necessarily correspond to the topographic surfaces shown.
Längenfeld, as well as the Horlachtal Valley (see Figs. 1, 2 the orthogneissic rocks around the central part of the head
and 5). scarp. Data comprising discontinuity orientation, frequency,
Applying Eqs. (1) and (2) to the reconstructed topogra- spacing, length, roughness and strength were sampled by
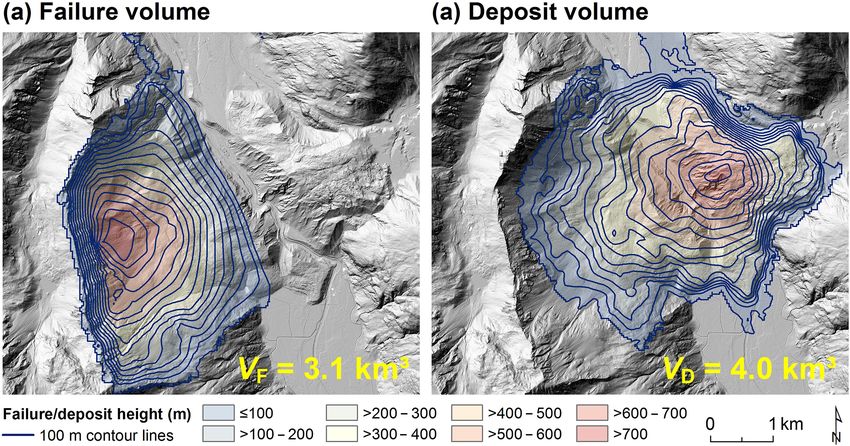
phies, a failure volume of VF = 3100 million m3 and a de- scanline and outcrop surveys to determine the structural
position volume of VD = 4000 million m3 were obtained anisotropy and to estimate roughly the strength properties of
(Fig. 7). Based on these volumetric reconstructions of fail- the rock mass. The orthogneissic rock is foliated, therefore
ure and deposition masses, considerations about the poros- highly anisotropic with a mean dip direction and dip angle
ity before and after the Köfels rockslide were made. Typical of 114/07 (Fig. 1c). At mesoscale, the rock mass is fractured
porosities for intact granitic rocks caused by microfractures by four joint sets. One primary joint set, labelled as set #1, is
are around 1 %–2 %, not considering any mesoscale joints dipping moderately towards the east and varying by around
(Zangerl et al., 2003). Taking into account joints in the rock a mean dip direction/dip angle of 090/32 (Fig. 1c). Joints as-
mass the porosity increase to 2 %–5 % (Fetter, 2001). Assum- signed to set #1 are dipping sub-parallel to the exposed scarp
ing a pre-failure porosity of the fractured granitic rock mass surface and thus are part of the basal shear zone. Remarkably,
of 5 % and a constant volume of the solid content of the rock these joints feature a medium to very high persistence, reach-
mass Vs before and after the collapse of the mountain slope, ing lengths of several tens of metres and a surface roughness
Eq. (3) predicts a porosity of the fractured rock mass after defined as rough and stepped (ISRM 1978). According to the
the sliding event of approximately 26 %. Consequently, we approach of Barton and Choubey (1977) a mean joint rough-
estimated an increase in the mean porosity from a few per- ness coefficient of JRC = 10 was determined. Occasionally,
centage points to 26 % resulting from the disintegration of some surfaces of fractures orientated sub-parallel to set #1
the rock mass during the Köfels rockslide. are coated with quartz minerals, representing vein fillings
which were most likely sheared and exposed during the rock-
4.2 Discontinuity and rock mass characterization slide events. The appearance of striations on these fractures
suggest a tectonic origin, i.e. shear fractures or fault planes.
A further dominant joint set (#2) is dipping steeply towards
The overall structural setting of the Köfels rockslide scarp
west-southwest (dip direction/dip angle of 242/70; Fig. 1c).
area has already been comprehensively described in Prager
However, in some areas surrounding the head scarp, set #2
et al. (2009). Nevertheless, in this study new discontinuity
dips steeply towards the east (Fig. 1c). The stepped topogra-
data were obtained during an outcrop mapping campaign in
Nat. Hazards Earth Syst. Sci., 21, 2461–2483, 2021 https://doi.org/10.5194/nhess-21-2461-2021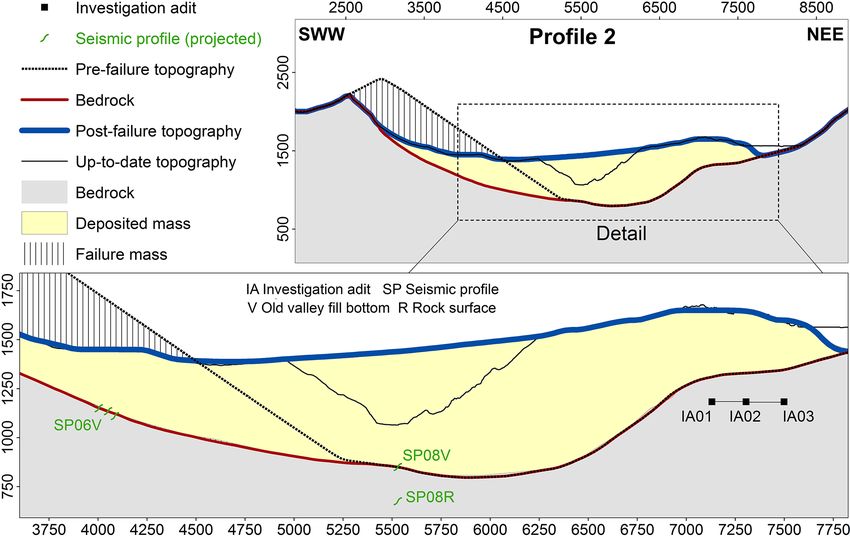
C. Zangerl et al.: GIS-based topographic reconstruction and geomechanical modelling                                                  2469

Figure 5. Profile 2 (see Figs. 2 and 3) through the Köfels site with the three reconstructed stages and the up-to-date topography.

phy of the scarp flank observed in the upper scarp area orig-             spacing a GSI = 55 were obtained for the orthogneissic rock.
inated by the intersection of these two joint sets, forming a             Uniaxial compressive strength (UCS) tests performed on or-
stepped failure surface (Fig. 1d). In addition, two less promi-           thogneisses show a mean UCS value of 125 MPa (nine tests
nent joint sets, i.e. set #3 clustering around a mean of 133/47           were performed on similar rocks in the context of a dam
and overlapping with set #1, as well as set #4 with a mean of             project). In order to consider the influence of long-term load-
030/65, were measured (Fig. 1c).                                          ing on the strength of the intact rock (rock creeping, sub-
   Based on field measurements in the orthogneissic rock                  critical crack growth), the uniaxial compressive strength is
mass a mean total joint spacing of around 0.6 m and a mean                reduced to 40 % of the test results, which yields 50 MPa
block size of approximately Vb = 0.3 m3 were obtained. Spe-               (Damjanac and Fairhurst, 2010). In order to assess the lower
cial attention was given during the field campaigns to detect             limit of the rock mass strength, the GSI was further re-
brittle fault zones of tectonic origin with a preferable ori-             duced to 45 by assuming an intact rock parameter mi = 15
entation, dipping moderately to the east and with fault zone              (Hoek and Brown, 1997). Based on these parameters and the
infillings of gouge and breccia. These brittle fault zones, if            Hoek–Brown failure criterion, a rock mass shear strength of
available, could have acted as low-strength weakness zones                crm = 2 MPa and ϕrm = 35◦ was estimated. The intact rock
and therefore been responsible to a certain degree for the                shear strength of orthogneissic rock was determined by tri-
rockslide formation. Although a detailed exploration of the               axial laboratory testing and obviously is much higher in the
terrain was carried out, no such structures could be found. In            range of ci = 16 to 41 MPa and ϕi = 31 to 40◦ (tests were
addition, the spatial analysis of high-resolution lidar-based             performed on similar rocks in the context of a dam project).
digital elevation models (DEMs; 1 m raster) also provide no               The shear strength of the joints could not be measured in situ
evidence for such brittle faults. On the contrary, most brittle           and was therefore estimated based on the Barton’s empirical
fault zones mapped are inclined steeply and are striking west-            approach (Barton and Choubey, 1977). The shear strength of
northwest–east-southeast (major set), east-northeast–west-                unfilled joints is influenced by the roughness, the strength
southwest (minor) and north-northwest–south-southeast. As                 of the joint surface and the normal stress acting on the dis-
already mentioned above, only mesoscale fractures coated                  continuity. On the basis of geometrical considerations and
with striations were found in the scarp area, representing                modelling results, it was assumed that the in situ normal
structures with shear markers. Based on the current level of              stresses acting on the basal shear zone were in the range be-
knowledge there is no clear evidence that low-strength brittle            tween 4 and 18 MPa. According to the method of Barton and
fault zones were involved as part of the basal rupture surface            Choubey (1977) a friction angle ranging from 32 to 35◦ , by
in the initial progressive failure process of the rockslide.              neglecting cohesion (c = 0 MPa), was roughly estimated.
   In order to assess the strength of the rock mass, the geolog-
ical strength index (GSI) characterization method proposed
by Cai et al. (2004) and Hoek and Brown (1997) was applied.
From the field survey a GSI ≥ 55 and from block size/joint

https://doi.org/10.5194/nhess-21-2461-2021                                       Nat. Hazards Earth Syst. Sci., 21, 2461–2483, 2021
2470                                 C. Zangerl et al.: GIS-based topographic reconstruction and geomechanical modelling

Figure 6. DEM of the three reconstructed stages and the up-to-date topography: (a) pre-failure, (b) bedrock, (c) post-failure and (d) up-to-
date. The spatial resolution of the DEMs is 30 m in (a–c) and 1 m in (d).

4.3     Distinct element modelling results                              constructed basal shear zone was not included. However, the
                                                                        mapped structural anisotropy was considered by building a
4.3.1    Modelling scenario I: initial deformation and                  fractured rock mass model based on vertical and eastwards
         failure mechanism of the rockslide                             dipping joints (dip angle of 32◦ ). Both joint sets are fully per-
                                                                        sistent and are spaced at 50 m. A finite-difference mesh was
Model geometry, boundary conditions and material                        calculated for deformable blocks by a zone edge length of
properties                                                              10 m and a rounding length of 0.3 m. This avoids the prob-
                                                                        lem of contact overlap possibly resulting from the interac-
As a basis, Profile 2 (see Figs. 2 and 3) was chosen to study           tion of blocks occurring close to or at two opposing block
the initial deformation and failure mechanism based on the              corners (UDEC; Itasca, 2020). A Mohr–Coulomb constitu-
Universal Distinct Element Code (UDEC; Itasca, 2020) by                 tive model was chosen from UDEC’s plastic model group to
modelling both deformation and failure of blocks, as well as            simulate block deformation and failure. The failure envelope
shearing and opening of joints. As input the reconstructed              for this model corresponds to the Mohr–Coulomb criterion
pre-failure topography was taken to create the surface of               with a tension cut-off (tensile yield function). The shear flow
the slope. Since this model type focuses on the initial for-            rule is non-associated, and the tensile flow rule is associated
mation mechanism of the rockslide, the field-based and re-              (UDEC; Itasca, 2020). Input requirements comprise as pa-

Nat. Hazards Earth Syst. Sci., 21, 2461–2483, 2021                                       https://doi.org/10.5194/nhess-21-2461-2021
C. Zangerl et al.: GIS-based topographic reconstruction and geomechanical modelling 2471
rameters the elastic bulk and shear modulus, the rock density, basal shear zone). However, the shape of the rockslide was
the cohesion and internal angle of friction, and in some cases adequately reproduced. By analysing the shear displacement
the tension limit. For joints the Coulomb slip area contact of joints and shear failure pattern of blocks (Fig. 8d) in the
model was taken to calculate shear displacement and slip. rock mass, it was determined that a combination of struc-
All selected physical, mechanical and hydraulic properties turally driven shear displacement and block failure was re-
are summarized in Table 1. sponsible for the observed slope deformation characteristics.
No displacement boundaries were applied on the left, right Increased magnitudes of shear displacement were observed
and lower model boundaries (Fig. 8a). The in situ stresses at the inclined joints in the middle and lower parts of the
were initialized in terms of a vertical gradient based on slope, reaching depths almost down to the location of the
gravity and the horizontal stresses being half of the verti- basal shear zone (Fig. 8c). In addition, large shear displace-
cal stresses by assuming a k-ratio of 0.5. At the model ori- ments were also observed near the summit on vertical joints
gin (0, 0) the two horizontal stresses were assigned to σxx = presumably induced by extensional stress regimes and rock
σzz = 25.6 MPa and the vertical stress to σyy = 51.2 MPa. In mass subsidence. The pattern of block shear failure zones
models with groundwater flow a groundwater table was as- presented in Fig. 8d clearly indicates the formation of several
sumed with respect to characteristic groundwater flow pat- persistent shear zones, with failure processes occurring par-
terns where the unsaturated zone between the surface and ticularly frequently at the foot of the slope and in the summit
the water table is typically deep at the head of the slope, area. Again, the deepest shear zone formed is too shallow and
whereas the water table at the base of the slope is close to does not reach the location of the real shear zone except at
or at the surface (Fig. 8a, e.g. Fetter, 2001). For models cal- the foot of the slope. Results presented in Fig. 8b, c and d are
culating groundwater flow, the lower model boundary was based on the input parameters for blocks of cb = 0.1 MPa and
set to no-flow (impermeable boundary). The left and right ϕb = 30◦ and for joints of cj = 0 MPa and ϕj = 25◦ . Chang-
groundwater model boundaries were defined by a hydraulic ing the friction angle of the joints to 30 or 35◦ while keeping
gradient based on hydrostatic water pressure according to the the other parameters constant has no major impact on the
assumed water table. The maximum water pressure was set modelling results. However, when varying the block friction
to 19.72 MPa at the left boundary along the y axis and to angle to input values of 20, 25, 30, 35 and 40◦ , in which
8.96 MPa at the right boundary along the y axis (Fig. 8a). the block cohesion remains constant at cb = 0.1 MPa, the re-
In order study the deformation and failure characteristics sults obtained are different. Whereas a block friction angle
of the rock slope, selected block and joint parameters were between 20 and 35◦ led to ongoing rock mass displacements
varied. Concerning the elasto-plastic blocks, cohesion was reaching tens of metres, model runs with ϕb = 40◦ stabilize
set to 0.1 and 1 MPa, internal friction angle to 20, 25, 30, after a few metres. Furthermore, the sensitivity of the model
35 and 40◦ , and tensile strength to 0 and 0.1 MPa. Joint co- behaviour to varying block cohesion between 0.1 and 1 MPa
hesion and tensile strength was set to 0 MPa by varying the is expressed in strongly different displacement magnitudes,
friction angle between 25, 30 and 35◦ (Table 1). This model i.e. 50 versus 1.7 m, and is characterized by shallow block
scenario focuses on intact block failure, its location and spa- displacements (Fig. 8e, f). In contrast, we have identified
tial arrangement, and the type of failure (i.e. tensile or shear only a minor influence of block tensile strength on model
failure) and provides insights into the general mechanisms of behaviour. This is evident because tensile failure occurred
slope failure and formation of the rockslide geometry, as well primarily near the surface and at shallow depths (Fig. 8d).
as into the initiation and progressive formation of a continu-
ous basal shear zone. Model scenario I – with groundwater flow
Model scenario I – without groundwater flow Model runs considering groundwater flow show similar re-
sults as dry models (Fig. 8). It has to be mentioned that
For this type of model run a comprehensive parameter study due to UDEC’s limitations, water pressure is only applied to
was performed by varying block plasticity and joint proper- joints but not to blocks. A block friction angle of ϕb = 30◦ ,
ties (see above and Table 1). In Fig. 8b the spatial distribution while cb = 0.1 MPa and the shear properties of the joints
of block displacement is shown, indicating a continuous de- were set to cj = 0 MPa and ϕj = 30◦ , caused a similar spa-
crease in magnitude from surface to depth primarily caused tial distribution of block shear failure zones as observed un-
by block deformation. It is also evident that localized line- der no groundwater flow conditions (compare Fig. 8d and
shaped zones (e.g. several internal shear zones) were formed, g). Multiple shear zones at different depths were also cre-
which suggests progressive fracturing and loosening of the ated in this model, an indication that intensive fracturing and
rock mass most likely penetrating from shallow to deeper loosening processes of the rockslide mass occurred. How-
domains (Fig. 8d). A comparison with the location of the re- ever, the simulation results did not confirm the hypothesis of
constructed basal shear zone indicates that simulated slope a single basal shear zone located at the trace of the recon-
deformations are not penetrating to depths which are deep structed basal shear zone. Remarkably, the model run shown
enough to reproduce the slope situation (i.e. location of the in Fig. 8g clearly indicates the formation of antithetic shear
https://doi.org/10.5194/nhess-21-2461-2021 Nat. Hazards Earth Syst. Sci., 21, 2461–2483, 20212472 C. Zangerl et al.: GIS-based topographic reconstruction and geomechanical modelling
Figure 7. (a) Failure and (b) deposition heights and volumes of the Köfels rockslide mass computed in ArcGIS. The contour lines indicate
the height difference between the (a) pre-failure and (b) post-failure topography and the topography of the sliding surface.
Table 1. Rock block and discontinuity properties for the distinct element modelling study for scenarios I and II, categorized into rockslide
mass, underlying rock mass, basal shear zone and fractured rock mass. Hydraulic parameters (azero , ares and jperm ) are only relevant for
model runs considering groundwater flow. Modelling scenario II is based solely on an elastic constitutive relationship for blocks, whereas
for scenario I the blocks are simulated by applying a Mohr–Coulomb constitutive model.
Model scenario Scenario I Scenario II
Material property Fractured Rockslide Underlying Basal shear
rock mass mass rock mass zone
Block density, ρ (kg/m3 ) 2600 2600 2600 –
Block bulk modulus, K (GPa) 22 22 22 –
Block shear modulus, G (GPa) 17 17 17 –
Block cohesion, cb (MPa) 0.1, 1 – – –
Block internal friction angle, ϕb (◦ ) 20, 25, 30, – – –
35, 40
Block tensile strength, σt (MPa) 0, 0.1 – – –
Discontinuity normal stiffness, jkn (GPa/m) 100 100 100 100
Discontinuity shear stiffness, jks (GPa/m) 100 100 100 100
Discontinuity cohesion, c (MPa) 0 0 0 0
Discontinuity friction, φj or φbs (◦ ) 25, 30, 35 20, 30, 40 40 20, 21, 22, 23,
24, 25, 26, 27,
28, 29, 30, 31
Hydraulic aperture for zero normal stress, azero (m) 0.00026 0.00018 0.00026 0.00026
Hydraulic residual aperture, ares (m) 0.00026 0.00018 0.00026 0.00026
Discontinuity permeability constant, jperm (1/Pa s) 83.3 83.3 83.3 83.3
Nat. Hazards Earth Syst. Sci., 21, 2461–2483, 2021 https://doi.org/10.5194/nhess-21-2461-2021C. Zangerl et al.: GIS-based topographic reconstruction and geomechanical modelling 2473 Figure 8. Results of modelling scenario I: (a) model set-up presenting the joint network and the calculated groundwater situation, (b) depth- dependent distribution of block displacements by implementing a block cohesion of cb = 0.1 MPa and internal friction angle of φb = 30◦ , (c) spatial distribution of shear displacements along joints (cb = 0.1 MPa, φb = 30◦ ), (d) formation of multiple shear and antithetic zones due to block shear failure in a line-shaped arrangement (cb = 0.1 MPa, φb = 30◦ ), (e) model run showing very shallow block displacements when block cohesion was increased from cb = 0.1 to cb = 1 MPa (φb = 30◦ ), (f) shallow-occurring shear displacements along joints for cb = 1 MPa and φb = 30◦ , (g) model run considering groundwater flow showing the formation of multiple shear and antithetic zones (i.e. uphill-facing scarps) due to block shear failure (cb = 0.1 MPa, φb = 30◦ ), and (h) model run with groundwater flow showing the formation of a single shear zone being initiated mainly in the summit area and at the foot of the slope when the friction angle is increased to φb = 40◦ (cb = 0.1 MPa). All model runs presented reached stabilization. https://doi.org/10.5194/nhess-21-2461-2021 Nat. Hazards Earth Syst. Sci., 21, 2461–2483, 2021
2474                                C. Zangerl et al.: GIS-based topographic reconstruction and geomechanical modelling

zones, i.e. structures which were often observed in the con-        shear zone, the shear strength and tensile strength properties
text of deep-seated rockslides and are appearing on the sur-        of the joints were varied in the rockslide mass (Table 1). The
face as uphill-facing scarps. Whereas block displacements of        friction angle of the basal shear zone was varied between 20
the previous model reached magnitudes of several decame-            and 28◦ for models without groundwater flow and between
tres, increasing the block friction angle to ϕb = 40◦ while         25 and 31◦ considering groundwater flow. As an assumption,
leaving the other parameters unchanged reduced the overall          the cohesion of the basal shear zone was set to c = 0 MPa for
displacement to less than 3.5 m. Even though slope displace-        all models. The determination of the critical angle of friction
ments were rather small, the simulation result suggests the         of the basal shear zone at failure was done by monitoring the
initiation of a shear zone mainly developing near the summit        maximum shear displacement along the basal shear zone, the
and less apparent near the foot (Fig. 8h). Nevertheless, the        block displacements (see monitoring points in Fig. 9a and
depth of the shear zone is clearly too small to be consistent       c) and the unbalanced forces of the model, ideally reaching
with on-site observations.                                          values close to zero.

4.3.2   Modelling scenario II: back-calculation of shear            Model scenario II – without groundwater flow
        strength properties of the basal shear zone
                                                                    Concerning the model type without groundwater flow, the
Model geometry, boundary conditions and material                    friction angle for the basal shear zone was varied between
properties                                                          20 and 31◦ , whilst all other parameters were kept constant.
                                                                    However, to study also the impact of internal rockslide de-
Profile 2 (see Figs. 2 and 3) was also taken for the                formability, the friction angle of the discontinuity network
back-calculation study based on distinct element modelling          was set to 20, 30 and 40◦ . As a result, the back-calculated
(UDEC; Itasca, 2020) with a fully persistent basal failure          critical friction angles where failure was beginning were not
zone. The pre-failure topography was implemented to cre-            a single value but rather a range varying from 21 to 24◦ . In
ate the surface of the slope, whilst the topography of the          addition, it was found that a stepwise reduction of the fric-
sliding surface provides the input for the basal shear zone         tion angle led to increasing displacements, reaching nearly
(Fig. 9). The main deformation within the system takes place        6 m in the transition zone, associated with a re-stabilization
through the movement along the basal failure zone (i.e. slid-       of the rockslide mass (Fig. 10a, b, c and d). Only a further
ing and rotation of blocks, as well as opening and interlock-       reduction of the friction angle finally led to the progressing
ing of interfaces). In order to obtain numerical models that        rockslide displacement without stabilization. One major fac-
are manageable from the point of view of computer perfor-           tor influencing the back-calculated critical friction angle was
mance and computation time, the spacing of the joint sets           related to the shear strength properties of the joints in the
was specified to 50 m in the rockslide mass and 150 m in the        rockslide mass affecting the deformability (Fig. 11). On the
underlying bedrock (Fig. 9a and c). Two types of discontinu-        one hand, a joint friction angle of ϕj = 40◦ increases overall
ity networks were studied. The first type is characterized by       stability, which in turn requires a low friction angle of the
a fully persistent vertical and horizontal joint set and the sec-   basal shear zone values of ϕbs = 21◦ to simulate failure. On
ond type by a fully persistent vertical and inclined joint set      the other hand, a rather low value of ϕj = 20◦ assigned to the
(dip angle of 32◦ ). One reason to use a discontinuity geom-        joints of the rockslide mass increase the critical friction angle
etry based on a vertical and horizontal fully persistent joint      of the basal shear zone to ϕbs = 24◦ . A value in between, i.e.
set was to have good control over the groundwater flow con-         ϕj = 30◦ , results in a critical value of ϕbs = 23◦ for the basal
ditions in the models by achieving isotropic hydraulic con-         shear zone. Further, it was found that the influence of the
ductivity. However, a structurally more realistic model ge-         discontinuity orientation on slope deformation behaviour is
ometry was added to this study. The finite-difference mesh in       rather small. Based on a joint friction angle of ϕj = 40◦ , no
the model was assigned a size of 20 m in the rockslide mass         difference in the displacement behaviour was observed be-
and 50 m in the underlying granitic gneiss block. Roundings         tween the model type with vertical and horizontal joints and
of block corners were applied with a radius of 0.3 m. The           the model type with vertical and inclined joints.
mechanical and hydraulic boundaries, as well as the ground-            The magnitude and spatial distribution of shear displace-
water table, were defined the same as in modelling scenario         ment is affected by the shape of the basal shear zone
I (Fig. 9b, d). Blocks were considered as linear elastic as de-     (Fig. 10b, d). Exemplarily, for the model types shown in
fined by Hooke’s law, considering components of stress to           Fig. 10b and d (ϕj = 30◦ , ϕbs = 22◦ ) the largest shear dis-
be linear functions of components of strain (Jaeger et al.,         placements were obtained in the upper part of the slope along
2007). Physical, mechanical and hydraulic properties used           the steepest section of the basal shear zone, reaching about
for the simulation are shown in Table 1. The Coulomb slip           5.8 and 5.7 m. Towards the upper and lower sections of the
area contact model was assigned to the two joint sets and the       shear zone, shear displacement continuously reduces to val-
basal shear zone. To investigate the impact of the discontinu-      ues of 3.75 m. The rockslide mass located above the steeply
ity network on the back-calculated friction angle of the basal      inclined section represents the domain which is most affected

Nat. Hazards Earth Syst. Sci., 21, 2461–2483, 2021                                  https://doi.org/10.5194/nhess-21-2461-2021
You can also read


