Technical note: Introduction of a superconducting gravimeter as novel hydrological sensor for the Alpine research catchment Zugspitze - HESS
←
→
Page content transcription
If your browser does not render page correctly, please read the page content below
Hydrol. Earth Syst. Sci., 25, 5047–5064, 2021
https://doi.org/10.5194/hess-25-5047-2021
© Author(s) 2021. This work is distributed under
the Creative Commons Attribution 4.0 License.

Technical note: Introduction of a superconducting gravimeter as
novel hydrological sensor for the Alpine research
catchment Zugspitze
Christian Voigt1 , Karsten Schulz2 , Franziska Koch2 , Karl-Friedrich Wetzel3 , Ludger Timmen4 , Till Rehm5 ,
Hartmut Pflug1 , Nico Stolarczuk1 , Christoph Förste1 , and Frank Flechtner1,6
1 Section  1.2 Global Geomonitoring and Gravity Field, GFZ German Research Centre for Geosciences,
Telegrafenberg, 14473 Potsdam, Germany
2 Institute for Hydrology and Water Management, University of Natural Resources and Life Sciences (BOKU),

Muthgasse 18, 1190 Vienna, Austria
3 Institute of Geography, Augsburg University, Alter Postweg 118, 86159 Augsburg, Germany
4 Institute of Geodesy, Leibniz University Hannover (LUH), Schneiderberg 50, 30167 Hannover, Germany
5 Environmental Research Station Schneefernerhaus (UFS), Zugspitze 5, 82475 Zugspitze, Germany
6 Institute of Geodesy and Geoinformation Science, Technische Universität Berlin (TUB),

Kaiserin-Augusta-Allee 104–106, 10553 Berlin, Germany

Correspondence: Christian Voigt (christian.voigt@gfz-potsdam.de)

Received: 5 February 2021 – Discussion started: 8 March 2021
Revised: 16 August 2021 – Accepted: 18 August 2021 – Published: 20 September 2021

Abstract. GFZ (German Research Centre for Geosciences)           Zugspitze. Besides the experimental set-up and the available
set up the Zugspitze Geodynamic Observatory Germany              data sets, the gravimetric methods and gravity residuals are
with a worldwide unique installation of a superconducting        presented based on the first 27 months of observations from
gravimeter at the summit of Mount Zugspitze on top of            29 December 2018 to 31 March 2021. The snowpack is iden-
the Partnach spring catchment. This high alpine catchment        tified as being a primary contributor to seasonal water stor-
is well instrumented, acts as natural lysimeter and has sig-     age variations and, thus, to the gravity residuals with a signal
nificant importance for water supply to its forelands, with      range of up to 750 nm s−2 corresponding to 1957 mm snow
a large mean annual precipitation of 2080 mm and a long          water equivalent measured with a snow scale at an altitude
seasonal snow cover period of 9 months, while showing a          of 2420 m at the end of May 2019. Hydro-gravimetric sen-
high sensitivity to climate change. However, regarding the       sitivity analysis reveal a snow–gravimetric footprint of up to
majority of alpine regions worldwide, there is only lim-         4 km distance around the gravimeter, with a dominant gravity
ited knowledge on temporal water storage variations due to       contribution from the snowpack in the Partnach spring catch-
sparsely distributed hydrological and meteorological sensors     ment. This shows that the hydro-gravimetric approach deliv-
and the large variability and complexity of signals in alpine    ers representative integral insights into the water balance of
terrain. This underlines the importance of well-equipped ar-     this high alpine site.
eas such as Mount Zugspitze serving as natural test labora-
tories for improved monitoring, understanding and predic-
tion of alpine hydrological processes. The observatory su-
perconducting gravimeter, OSG 052, supplements the exist-        1   Introduction
ing sensor network as a novel hydrological sensor system for
the direct observation of the integral gravity effect of total   One of the grand societal challenges is ensuring sufficient
water storage variations in the alpine research catchment at     water supply under climate change conditions. The European
                                                                 Alps are of crucial importance to supply water for ecologi-

Published by Copernicus Publications on behalf of the European Geosciences Union.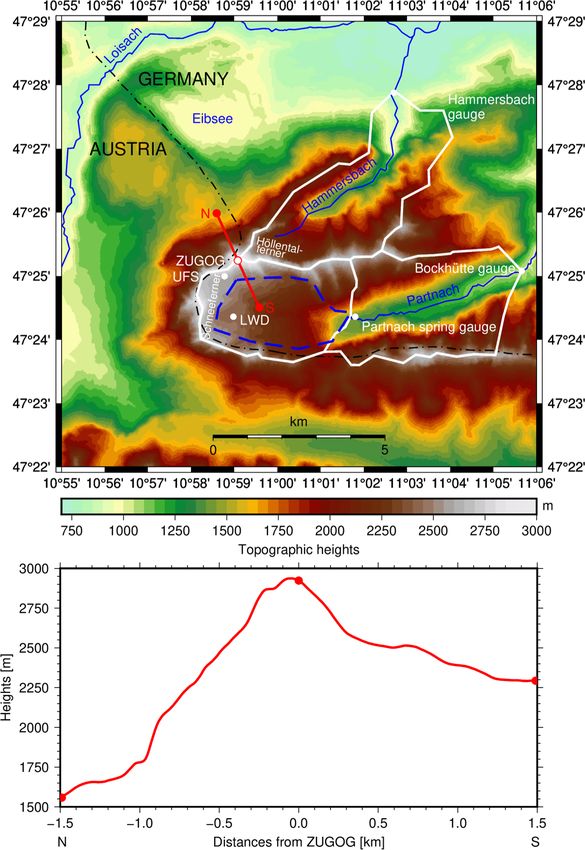
5048                                         C. Voigt et al.: Technical Note: Introduction of a superconducting gravimeter

cal, energy and societal purposes and, with a relatively large
fraction of annual precipitation received and stored, they are
often referred to as water towers (Immerzeel et al., 2020;
Beniston et al., 2018; Viviroli et al., 2007). The IPCC (Inter-
governmental Panel on Climate Change; 2014) indicates that
“in many regions, changing precipitation or melting snow
and ice are altering hydrological systems, affecting water re-
sources in terms of quantity and quality”, thereby empha-
sising the need for efficient future water management strate-
gies, even in currently water secure regions (Immerzeel et
al., 2020). To develop such strategies, a comprehensive un-
derstanding and quantification of changing hydrological pro-
cesses in mountainous regions, including short- and long-
term observations and model predictions are urgently re-
quired.
   However, due to the high installation and maintenance
costs of monitoring equipment, and the often harsh envi-
ronmental conditions causing instrument failure and difficult
accessibility, hydro-meteorological observatories and subse-
quent data for high alpine catchments are scarce. The Part-
nach spring catchment (Fig. 1) in the southeast of the sum-
mit of Mount Zugspitze, also known as Research Catch-
ment Zugspitze (RCZ), covers an area of about 11 km2 lo-
cated in the Northern Limestone Alps and is one of the best-
instrumented high alpine catchments for monitoring snow
hydrological processes (Bernhardt et al., 2018). Its main
characteristics are a mean annual precipitation of 2080 mm,
with 80 % as snowfall from autumn to late spring above ap-
prox. 1800 m and an average temperature of −4.5 ◦ C dur-
ing the climatic reference period 1981 to 2010 (Weber et al.,
2016). The altitudes vary between 2962 m (summit of Mount         Figure 1. Topographic heights around the Zugspitze Geodynamic
Zugspitze) and 1430 m at Partnach spring.                         Observatory Germany (ZUGOG), the Environmental Research Sta-
   The Partnach spring drains the entire RCZ due to a syn-        tion (UFS) and the hydro-meteorological station (LWD), the alpine
clinal geological structure, with impermeable claystones un-      catchments (white lines) and Partnach spring (11 km2 ) as part of
derlaying the highly karstified Wetterstein limestone, and can    Bockhütte (25 km2 ), with their corresponding gauge stations, and
therefore be regarded as a natural lysimeter, allowing for de-    the Hammersbach catchment (14 km2 ), with its planned gauge sta-
tailed water balance and water movement studies (Wetzel,          tion, the estimated groundwater body below Zugspitzplatt (blue
2004; Rappl et al., 2010). Given this unique geological sit-      dashed line) and a topographic north–south profile through ZUGOG
                                                                  transverse to the maximum slopes (red line).
uation and the available instrumentation, the RCZ is part of
the Global Energy and Water Exchanges (GEWEX) Interna-
tional Network of Alpine Research Catchments (INARCH;
Pomeroy et al., 2015). The remains of Germany’s highest           the Bavarian Avalanche Warning Service (LWD), including
glacier – the northern and southern Schneeferner – are also       a portable lidar sensor for spatially distributed snow height
located in the RCZ (Hagg et al., 2012), as well as permafrost     monitoring. Detailed water balance and karst water discharge
in the rock walls of Mount Zugspitze (Krautblatter et al.,        studies at the Partnach spring investigated runoff responses to
2010). The RCZ is part of the Bockhütte catchment with an         rainfall and snowmelt dynamics and characterised the karst
area of 25 km2 . The Hammersbach catchment covers an area         groundwater aquifer (Hürkamp et al., 2019; Morche and
of 14 km2 in a northeasterly direction from Mount Zugspitze       Schmidt, 2012; Rappl et al., 2010; Wetzel, 2004). Numer-
and includes the Höllentalferner glacier. Karst hydrologi-        ous snow–hydrological studies investigated the spatiotem-
cal characteristics can be found in Lauber and Goldscheider       poral dynamics of snow cover and the snow water equiva-
(2014).                                                           lent (SWE; Bernhardt et al., 2018), combining monitoring
   The environmental research station Schneefernerhaus            techniques, such as terrestrial photogrammetry (Härer et al.,
(UFS), located in the RCZ, is easily accessible with cable        2013, 2016), remote sensing (Härer et al., 2018) or lidar
cars and operates a dense hydro-meteorological sensor net-        observations (Weber et al., 2016, 2020, 2021) with differ-
work jointly with the German Weather Service (DWD) and            ent complex snow–hydrological modelling. Some limitations

Hydrol. Earth Syst. Sci., 25, 5047–5064, 2021                                      https://doi.org/10.5194/hess-25-5047-2021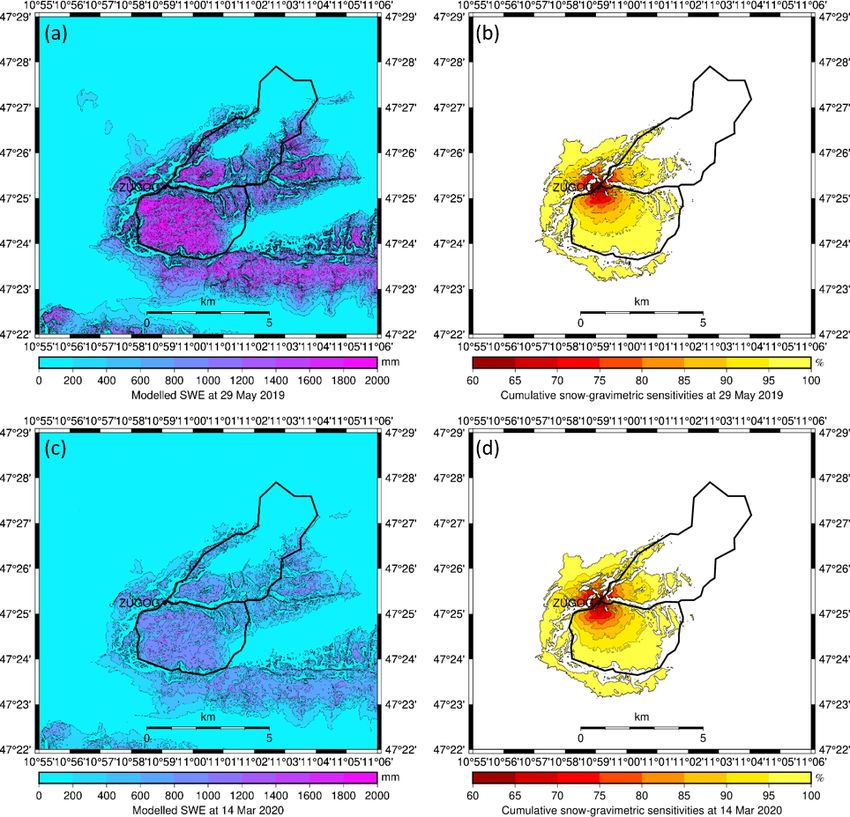
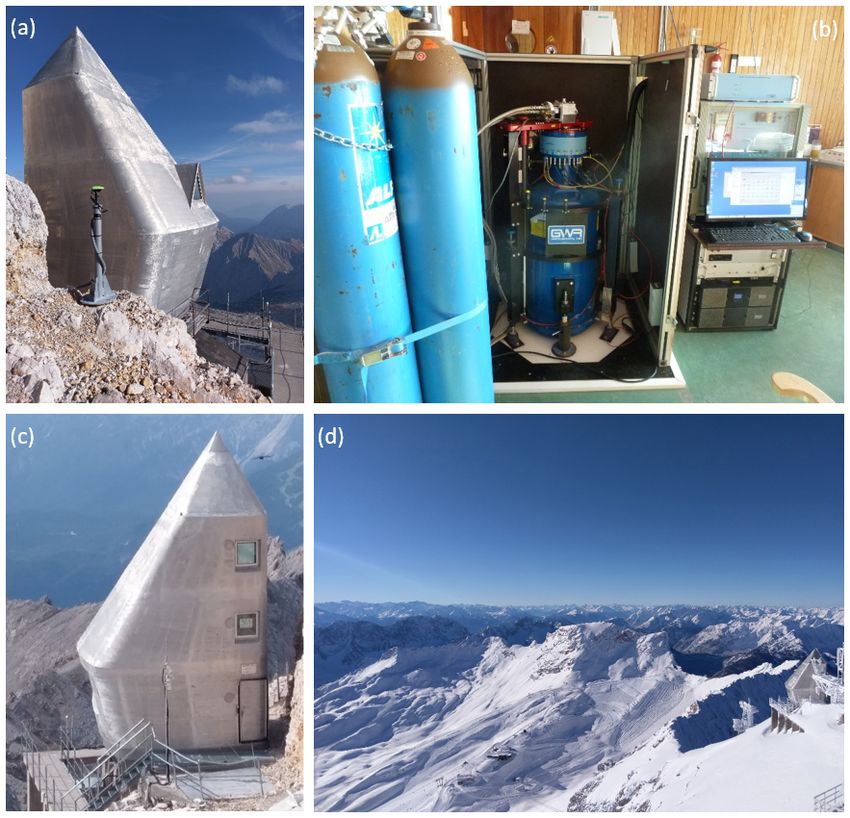
C. Voigt et al.: Technical Note: Introduction of a superconducting gravimeter                                                5049

arising from these studies were the small number of cloud-        al. (2021) estimated a geophysical trend of −20 nm s−2 yr−1 ,
free remote sensing scenes in the visible and near-infrared       with an uncertainty of 3 nm s−2 yr−1 (single standard devia-
spectrum to derive spatially distributed snow cover maps at       tion 1σ ) from AG observations between 2004 and 2019 as
high temporal resolutions and the limited spatial extent of       a consequence of alpine mountain uplift and hydrological
the terrestrial photogrammetry and lidar observations in the      mass loss. Monthly RG observations have been done with a
RCZ (Härer et al., 2016; Weber et al., 2016, 2020). Both pho-     transportable spring gravimeter since 2014 by the Technical
togrammetry and lidar observation techniques are only capa-       University of Munich (TUM) in attempt to analyse periodic
ble of measuring snow heights, but not hydrologically rele-       permafrost changes and detect cavities in a tunnel (Kamm-
vant SWE values, directly and thus rely on additional snow        stollen) of Mount Zugspitze (Scandroglio et al., 2019). The
density data from local snow pit or snow weight measure-          most important gap in the hybrid gravimetric approach was
ments. While snow cover and snow height data are able to          closed by the installation of the SG at the summit of Mount
condition the snow–hydrological model behaviour to some           Zugspitze, enabling the separation of short-term, seasonal,
degree (Weber et al., 2021), it was recently shown that in-       interannual and long-term gravity changes.
tegral data from satellite (Bahrami et al., 2020) and terres-        In this study, we discuss to what extent the OSG 052
trial gravimetry (Güntner et al., 2017) providing a footprint-    can contribute to a better understanding of hydrological pro-
averaged time series of the terrestrial water storage anomaly     cesses in high alpine catchments. This addresses the bene-
(TWSA) can greatly improve the identification of water bal-       fits and improvements of the hydro-gravimetric approach but
ance components and relevant hydrological processes on            also its challenges and limitations. After a presentation of the
catchment scale.                                                  available data sets from gravimetry to hydrology and meteo-
   The last few years of terrestrial gravimetric research have    rology in the RCZ (Sect. 2), the applied gravimetric methods
seen a transformation of superconducting gravimeter (SG)          for the separation of the hydrological signal from the grav-
installations from low noise sites for the analysis of global     ity observations are shown (Sect. 3). Section 4 contains the
geophysical phenomena to specific sites of interest for the       hydro-gravimetric results and sensitivity analysis with regard
monitoring of near-surface mass transport processes. These        to various water storage components. Section 5 summarises
include the development of SGs as hydrological sensors for        the main results and provides an outlook on future hydro-
the direct, integral and non-invasive monitoring of water stor-   gravimetric projects.
age variations in a minimised field enclosure near Tucson,
Arizona, USA (Kennedy et al., 2014), and at Wettzell, Ger-
many (Güntner et al., 2017), as well as SG installations for      2     Observations
the monitoring of karst hydrological processes at the Larzac
plateau, France (Fores et al., 2017), and at Rochefort, Bel-      2.1    The Zugspitze Geodynamic Observatory Germany
gium (Watlet et al., 2020). Creutzfeldt et al. (2013) used SG
measurements at Wettzell, Germany, for the estimation of          The Zugspitze Geodynamic Observatory Germany (ZU-
storage–discharge relationships in a small headwater catch-       GOG) was set up by the German Research Centre for Geo-
ment. Very recently, Chaffaut et al. (2021) reported about        sciences (GFZ) at the summit of Mount Zugspitze, Ger-
an SG installation at the summit of the Strengbach catch-         many’s highest mountain, with an altitude of 2962 m, in a
ment in the French Vosges mountains for the analysis of wa-       former laboratory of the Max Planck Institute for Extraterres-
ter storage dynamics. In this catchment, however, seasonal        trial Physics (MPE) built in 1963 for the observation of cos-
snow cover only plays a minor role. In addition, SGs are          mic rays (Fig. 2). The 10 m high tower-like aluminium struc-
applied in connection with absolute gravimeters (AGs) and         ture of the lab, with an area of approx. 50 m2 , has a very steep
relative spring gravimeters (RGs) in hybrid approaches for        roof to keep it free from snow. In addition, the position at the
hydro-gravimetry (Naujoks et al., 2010), volcano monitor-         summit prevents hydrological mass variations above the sen-
ing (Carbone et al., 2019) and geothermal mass movements          sor and simultaneously increases the hydro-gravimetric foot-
(Schäfer et al., 2020). These hybrid approaches exploit the       print (see also Chaffaut et al., 2021). Inside the lab, there is
advantages of the various types of gravimeters, with AGs          a room with two concrete piers on the ground floor. While
providing long-term gravity changes, SGs the continuous           the first concrete pier is occupied by the SG, the second one
high-precision temporal gravity changes at the measurement        is intended for absolute and relative gravimeters, as well as
sites and RGs the additional spatiotemporal variations in the     other instruments. On the first floor are basic sleeping facil-
area of interest (Hinderer et al., 2015).                         ities for overnight stays, if necessary. A ventilation system
   Gravimetric methods are already applied in the RCZ.            reduces the heat produced by the compressor of the SG. This
Episodic AG observations were carried out since 2004 with         is necessary as the lab itself heats up considerably during
a FG5 absolute gravimeters by the Leibniz University Han-         sunny days. In addition, a thermally insulated box around the
nover (LUH) for the analysis of long-term gravity changes at      SG includes heaters to keep the sensor at a stable ambient
Mount Zugspitze and for a long-range gravimeter calibration       temperature of around 25 ◦ C (±1 ◦ C). Temperature and hu-
base (Timmen et al., 2006; Peters et al., 2009). Timmen et        midity sensors were installed in the lab. AC (mains) power is

https://doi.org/10.5194/hess-25-5047-2021                                      Hydrol. Earth Syst. Sci., 25, 5047–5064, 2021
5050                                         C. Voigt et al.: Technical Note: Introduction of a superconducting gravimeter

available throughout the lab. The power supplies of all elec-    ferred instead of the widely used ultrasonic sensors because
tronics and compressor are secured by uninterruptible power      the snow cover is not horizontal. A small meteorological sta-
supplies (UPSs). The lab is accessible all year round with ca-   tion outside the lab observes temperature and humidity, as
ble cars from Germany and Austria. The UFS provides per-         well as wind speed and direction. All data sets are part of a
sonnel and technical support, as well as infrastructure during   remotely controlled monitoring system.
maintenance trips.
   In September 2017, the OSG 052 was warmed up to               2.2    Hydrological and meteorological data sets in the
room temperature at its former location in Sutherland, South            research catchment Zugspitze
Africa, and sent to the manufacturer GWR Instruments, Inc.
in San Diego for maintenance after observing in parallel with    ZUGOG has been connected to the UFS as the home base of
the dual sphere OSG D-037 between 2008 and 2017 (Förste          a large research consortium operating a dense hydrological
et al., 2016). This included refurbishment of the thermal lev-   and meteorological sensor network for more than 20 years.
ellers, an upgrade of the electronics from version GEP-2 to      Long-term meteorological data sets from 1900 are available
GEP-3, a modification of the dewar to enable cooling from        on an hourly to yearly basis from the Climate Data Cen-
room temperature down to 4 K with the accompanying re-           ter (CDC) of DWD for the station at the summit of Mount
frigeration system, a replacement of the GPS antenna and         Zugspitze (station ID 5792), including relative humidity, air
a barometer specifically calibrated for a working altitude of    temperature, precipitation height and form, wind speed and
3000 m, as well as an Intel mini personal computer for the       direction and air pressure. LWD provides several hydro-
operation of the UIPC (User Interface PC software; GWR)          logical and meteorological data sets from a station at the
software with Windows 7. After returning to GFZ, the OSG         Zugspitzplatt at an altitude of 2420 m, including the SWE of
052 was moved to ZUGOG in September 2018 by truck, cog-          the snowpack recorded by a snow scale. Moreover, in the last
wheel train and helicopter at operating temperatures of 4 K.     few years, three further meteorological stations were set up
The first weeks of gravity observations with the OSG 052         at the Zugspitzplatt and on two mountain ridges in the frame
showed an instrumental malfunction, with a very large neg-       of the Virtual Alpine Observatory (VAO) project.
ative drift of about −50 nm s−2 d−1 and several small offsets       Augsburg University operates the gauge stations at Part-
(cf. Schäfer et al., 2020). At the end of October 2018, the      nach spring and Bockhütte for discharge monitoring (Fig. 1),
instrument was warmed then re-cooled. The manufacturer           while another gauge station is planned for the Hammers-
(GWR) now recommends that SGs be transported at room             bach catchment. However, massive snowfall and correspond-
temperature and the dewar be evacuated just prior to cooling     ing spring discharge in spring 2019 severely damaged the
with the refrigeration system. According to GWR, develop-        gauge station at Partnach spring and the data for the year
ment is currently in progress to eliminate these requirements.   2019 are completely missing. A workaround was installed in
   The OSG 052 has been in nominal operation since 29 De-        the spring of 2020, and a comprehensive maintenance of the
cember 2018. ZUGOG participates in the International Geo-        whole station is scheduled for the summer of 2021. Glaciol-
dynamics and Earth Tide Service (IGETS; Boy et al., 2020),       ogists of the Bavarian Academy of Sciences and Humanities
providing level 1 raw gravity and atmospheric pressure data      have mapped the glacier areas and volumes since the 1960s
with sampling rates of 1 s and 1 min (Voigt et al., 2019) on     (Timmen et al., 2021, Mayer et al., 2021, Hagg et al., 2012).
a regular basis to the publicly accessible IGETS database        Since 2007, the Bavarian Environmental Agency has perma-
hosted by GFZ (Voigt et al., 2016a). Absolute gravity val-       nently monitored the permafrost degradation within Mount
ues from FG5X-220 measurements by LUH at ZUGOG can               Zugspitze in a borehole equipped with temperature sensors
be found in the Absolute Gravity Database (AGrav) hosted         (Gallemann et al., 2017, 2021).
by International Gravimetric Bureau (BGI) and the Ger-              The data sets are compiled in the Alpine Environmental
man Federal Agency for Cartography and Geodesy (BKG;             Data Analysis Center (AlpEnDAC) as part of the VAO. Over-
Wilmes et al., 2009). In addition, the continuous Global Nav-    all, this high alpine region has one of the highest densities of
igation Satellite Systems (GNSS) station ZUGG nearby ZU-         meteorological stations worldwide and serves therefore as an
GOG (Ramatschi et al., 2019) has been in operation since         ideal reference for testing new measurement and modelling
9 September 2018 nearby the lab for the monitoring of sur-       approaches.
face displacements (Fig. 2a). Several environmental sensors
monitor local hydrological and meteorological variations. A      3     Gravimetric methodology
snow scale and three laser-based snow height sensors quan-
tify the accumulated snow masses on the horizontal plane in      3.1    Pre-processing and calibration
front of the lab during the winter months (Fig. 2c). After the
experiences from the first winter 2018–2019, the pole with       The essential prerequisite for the application of the OSG
the snow height sensors had to be extended from 2.5 to 4 m.      052 as a hydrological sensor is the separation of the hydro-
Another laser-based snow height sensor has a view to the         logical signal from raw gravity observations. The required
slope directly below the SG. Laser-based sensors were pre-       steps are explained for the period from 29 December 2018

Hydrol. Earth Syst. Sci., 25, 5047–5064, 2021                                     https://doi.org/10.5194/hess-25-5047-2021
C. Voigt et al.: Technical Note: Introduction of a superconducting gravimeter                                               5051

Figure 2. (a) The Zugspitze Geodynamic Observatory Germany (ZUGOG) with Global Navigation Satellite Systems (GNSS) station in
front. (b) OSG 052 installed on the ground floor at ZUGOG. (c) ZUGOG with snow height sensors and snow scale in front. (d) ZUGOG
with a winter view of a part of the alpine research catchment Zugspitze including the northern and southern Schneeferner glaciers.

to 31 March 2021 (27 months of observation). Raw grav-             ical FIR low-pass filters “N2H1M001” and “N14H5M01”
ity observations are voltage variations in 1 s sampling, along     from ETERNA 3.4.
with the observed barometric pressure variations and stored           For the transition from voltage to gravity variations, the
in daily files of the Tsoft format (Van Camp et al., 2005).        amplitude factor of the OSG 052 is estimated on the basis of
These are compiled into monthly files and converted into the       two absolute gravimeters and one calibrated spring gravime-
GGP file format of IGETS (Voigt et al., 2016a). For the deci-      ter (Table 1). The first estimation was done in 2011 at Suther-
mation from 1 s to 1 min sampling, a double precision Cheby-       land with FG5-301 by BKG. In order to validate this result
shev filter “g1s1m”, with a filter length of 1009 s, is applied    after repeated transport of the SG and refurbishment at GWR,
(Crossley, 2010). For the reduction of the gravity data and the    the second estimation was done in September 2018 at ZU-
removal of spikes and offsets, as well as the filling of longer    GOG with FG5X-220 by LUH (Timmen et al., 2021); how-
gaps, the programmes DETIDE and DESPIKE of ETERNA                  ever, it was done with a reduced accuracy due to the mal-
3.4 (Wenzel, 1997) are used. Besides some steps on 7 Jan-          function of the SG at this time (see Sect. 2.1). Hence, a third
uary 2019 during the final centring of the sphere, the time        estimation was carried out over 4 weeks in September and
series showed only two additional steps, on 24 October 2019        October 2019 at ZUGOG on the basis of the relative spring
during a power failure due to UPS testing and on 7 Decem-          gravimeter CG6-69 of GFZ calibrated in the gravimeter cal-
ber 2020 after exchanging the CMOS battery on the GEP              ibration system of Hannover (Timmen et al., 2020). Within
remote card, which are eliminated manually with the pro-           a least squares adjustment, the amplitude factor of OSG 052
gramme Tsoft. Finally, the monthly files in 1 min sampling         and a best-fitting polynomial reflecting the irregular drift of
are further decimated to one long time series in 1 h sampling      the CG6 are determined. The best-fitting solution (small-
by the programme DECIMATE, using symmetrical numer-                est standard deviation for the amplitude factor) is found for
                                                                   blocks of 3 d, polynomials of degree 3, and 50 % overlap of

https://doi.org/10.5194/hess-25-5047-2021                                       Hydrol. Earth Syst. Sci., 25, 5047–5064, 2021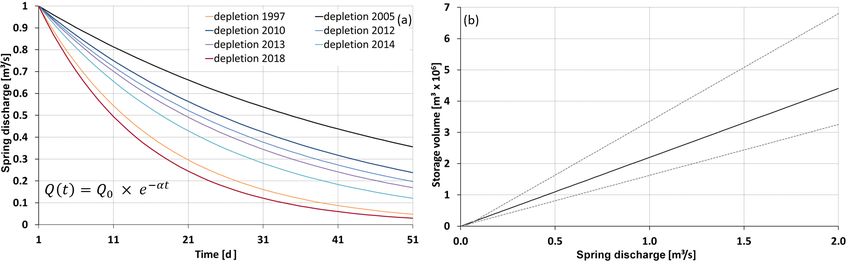
5052 C. Voigt et al.: Technical Note: Introduction of a superconducting gravimeter
Table 1. Amplitude factors of the OSG 052 estimated from three calibrations.
No. of calibration Method Site Period Amplitude factor 1σ uncertainty
(nm s−2 V−1 ) (nm s−2 V−1 )
1 FG5-301 (BKG) Sutherland 23–26 Nov 2011 −748.3 0.5
2 FG5X-220 (LUH) Zugspitze 15–20 Oct 2018 −746.68 1.30
3 CG6-69 (GFZ) Zugspitze 27 Sep–24 Oct 2019 −750.03 0.25
Mean value −749.59 0.22
the blocks. The final amplitude factor is −749.59 nm s−2 V−1 dow usually applied for the analysis of diurnal and semi-
(1σ = 0.22 nm s−2 V−1 ) as a weighted mean from calibra- diurnal waves are deactivated for the simultaneous analysis
tions 1–3. The achieved accuracy is sufficient with regard to of the monthly waves, resulting in higher standard deviations
gravity residuals with a range of 750 nm s−2 (Fig. 3g), as am- for the shorter waves. Instead, a Chebyshev polynomial of
plitude factor deviations of 1 nm s−2 V−1 correspond to max- degree 2 is applied in order to eliminate any long-term in-
imum deviations of 1 nm s−2 in gravity residuals, which rep- strumental trend signal or long-term variations in gravity.
resents a conservative estimate of the accuracy of the gravity Longer tidal waves (half-year periods and longer) are con-
observations at ZUGOG. sidered by nominal values, i.e. amplitude factors of 1.16 and
The time delay of the OSG 052 is determined within a phases of 0◦ . Along with the tidal waves, the single admit-
step response experiment developed by GWR on 1 March tance factor between gravity and barometric pressure is deter-
2019 at ZUGOG. In total, 16 introduced step voltages are mined with −3.65 nm s−2 hPa−1 (1σ = 0.04 nm s−2 hPa−1 ).
analysed with the programme ETSTEP of ETERNA 3.4 In order to reduce the large seasonal gravity signal, a sec-
(Wenzel, 1997), and the time delay is estimated to 10.53 s ond admittance factor is determined between gravity and
(1σ = 0.03 s). the snow water equivalent (SWE), with 0.2965 nm s−2 mm−1
The instrumental drift of the OSG 052 is estimated to (1σ = 0.0007 nm s−2 mm−1 ; cf. Sect. 4.2). The gravity vari-
be −20 nm s−2 yr−1 based on two absolute measurements ations induced by solid Earth and ocean tides are predicted
with FG5X-220 by LUH at 26–27 September 2019 and with the local tidal parameters from Table 2 and are shown
30–31 March 2021 with 2477 and 5166 drops, respectively for the analysed period in Fig. 3b.
(Fig. 3g). With regard to the uncertainty of 10–20 nm s−2
(1σ ) for the absolute measurements and the knowledge that 3.3 Non-tidal gravity reductions
the SG drift is small and linear towards increasing gravity, the
null hypothesis for the drift cannot be disproved statistically, Besides tidal variations, the gravity observations include sig-
and no drift is applied within the subsequent analysis. Further nificant non-tidal effects (shown in Fig. 3). For a more de-
absolute measurements planned for the future will increase tailed compilation of temporal gravity field variations see,
the redundancy of the drift estimation and longer temporal e.g., Voigt et al. (2016b), while Mikolaj et al. (2019) quan-
differences between the absolute measurements will make tify time domain uncertainties for the different gravity reduc-
the drift estimation more robust. Unfortunately, the first abso- tions. The signal admittance factor of −3.65 nm s−2 hPa−1 ,
lute measurements from 15–20 October 2018 cannot be used estimated together with the tidal analysis, includes the maxi-
as additional reference value for the drift estimation, as the mum correlated signal between observed gravity and baro-
SG had to be warmed up and cooled again for re-initialisation metric pressure. For a refined modelling of gravity varia-
at the end of December 2018 (Sect. 2.1) so that there is no tions induced by mass redistributions in the atmosphere, the
connection to the current continuous SG time series. Atmospheric Attraction Computation Service (ATMACS;
Klügel and Wziontek, 2009) provides effects from local to
3.2 Tidal analysis global scales, with a temporal resolution of 3 h based on
3D ECMWF (European Centre for Medium-Range Weather
In order to reduce the gravity effects from solid Earth and Forecasts) weather data. However, the limited spatial res-
ocean tides, a local tidal model is computed based on 2 years olution of the weather models of 7 km for Europe shows
of observations (29 December 2018–31 December 2020) that the complex topography around the station cannot be
with the programme ANALYZE of ETERNA 3.4 (Wen- represented sufficiently. In order to account for the limited
zel, 1997) for the analysis of monthly, diurnal, semidiur- spatial resolution and to improve the temporal resolution,
nal and shorter tidal waves. The estimated amplitude fac- the following procedure is used. The gravity observations
tors and phase leads according to the ETERNA wave group- are reduced by the effects of solid Earth and ocean tides,
ing for a 1 year gravity time series are displayed in Ta- Earth rotation and SWE variations, as well as regional and
ble 2. The numerical high-pass filtering and a Hann win- global atmospheric effects from ATMACS. In this way, the
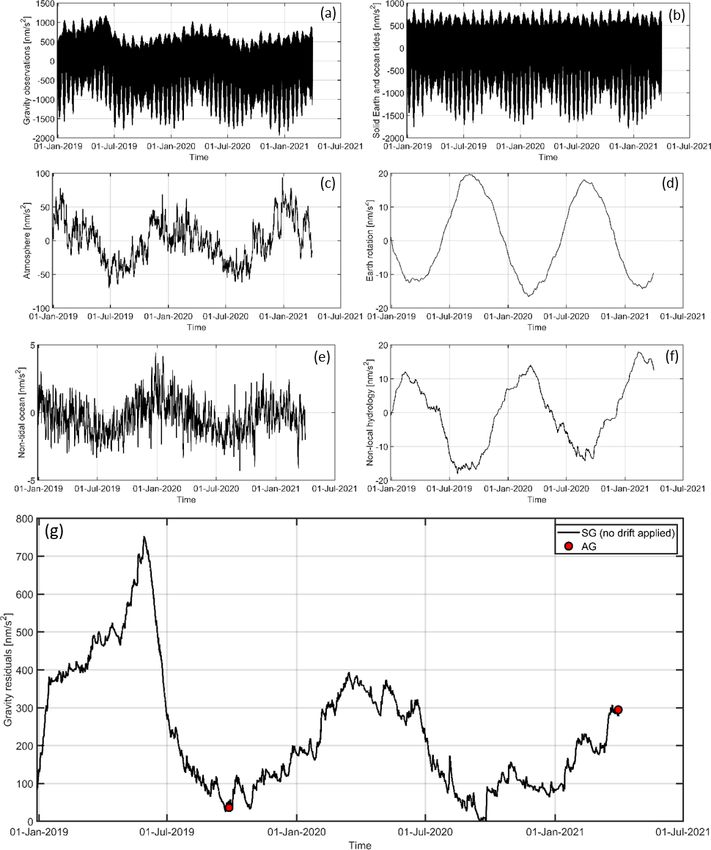
Hydrol. Earth Syst. Sci., 25, 5047–5064, 2021 https://doi.org/10.5194/hess-25-5047-2021C. Voigt et al.: Technical Note: Introduction of a superconducting gravimeter 5053 Figure 3. Signal separation from gravity observations (a) to gravity residuals (g), including two absolute measurements (red circles) by reducing gravity variations induced by solid Earth and ocean tides (b), atmospheric mass redistributions (c), Earth rotation (d), non-tidal ocean (e) and non-local hydrological mass redistributions (f). Please note the different scaling of the axes. https://doi.org/10.5194/hess-25-5047-2021 Hydrol. Earth Syst. Sci., 25, 5047–5064, 2021
5054                                            C. Voigt et al.: Technical Note: Introduction of a superconducting gravimeter

Table 2. Estimated amplitude factors and phase leads from a least squares adjustment of 23 tidal waves based on 2 years of gravity observa-
tions with OSG 052 at ZUGOG.

                     Frequencies (cpd)      Wave        Theoretical    Amplitude           Std    Phase lead        Std
                  From                To             amp. (nm s−2 )         factor                       (◦ )        (◦ )
                  0.020885     0.054747     MM             21.1656       1.01201      0.18789       9.1622      10.6146
                  0.054748     0.091348     MF             40.0581       1.11718      0.04843       5.8775       2.4845
                  0.091349     0.122801     MTM             7.6699       1.42938      0.16566      −6.1562       6.6347
                  0.122802     0.501369     MQM             1.2250       1.24028      0.60193       5.1859      27.8178
                  0.501370     0.911390     Q1             59.3059       1.14954      0.00152      −0.1425       0.0756
                  0.911391     0.947991     O1            309.7475       1.15060      0.00031       0.0454       0.0154
                  0.947992     0.981854     NO1            24.3484       1.14980      0.00302       0.3313       0.1505
                  0.981855     0.998631     P1            144.1019       1.15094      0.00066       0.0240       0.0327
                  0.998632     1.001369     S1              3.4048       1.38514      0.03875      23.9574       1.6028
                  1.001370     1.023622     K1            435.4574       1.13835      0.00022       0.1490       0.0110
                  1.023623     1.035379     TET1            4.6578       1.15618      0.02065       1.1388       1.0233
                  1.035380     1.057485     J1             24.3569       1.15438      0.00384       0.0779       0.1905
                  1.057486     1.071833     SO1             4.0394       1.13676      0.02372       0.9770       1.1951
                  1.071834     1.470243     OO1            13.3201       1.15354      0.00642       0.1334       0.3188
                  1.470244     1.880264     2N2            10.5279       1.15943      0.00249       2.4868       0.1229
                  1.880265     1.914128     N2             65.9181       1.17379      0.00053       2.0941       0.0260
                  1.914129     1.950419     M2            344.2804       1.18640      0.00011       1.5090       0.0052
                  1.950420     1.984282     L2              9.7321       1.17467      0.00407       1.7836       0.1984
                  1.984283     2.002736     S2            160.1632       1.18501      0.00023       0.1346       0.0112
                  2.002737     2.451943     K2             43.5108       1.18753      0.00087       0.4461       0.0422
                  2.451944     3.381378     M3              4.5825       1.07740      0.00484      −0.0481       0.2573
                  3.381379     4.347615     M4              0.0566       0.25408      0.25504      95.3389      57.5061
                  4.347616     7.000000     M5              0.0007      29.93575     20.46948      30.4792      39.1786

gravity residuals primarily reflect the effects of local at-            v1.1.0 (Mikolaj et al., 2016) is applied on the basis of 3 h
mospheric mass redistributions. The admittance factor be-               total ocean bottom pressure anomalies (data set “oba”) from
tween these gravity residuals and the observed barometric               the GRACE Atmosphere and Ocean De-Aliasing Level-1B
pressure variations are estimated to be −2.92 nm s−2 hPa−1              (AOD1B RL06) products (Dobslaw et al., 2017) and is
(1σ = 0.03 nm s−2 hPa−1 ). For the total atmospheric reduc-             shown in Fig. 3e.
tion, the local part of ATMACS is replaced by this admit-                  Hydrological gravity variations can be subdivided into
tance factor multiplied by the observed pressure variations             those from local scales (up to several metres around the
in 1 h sampling and added to the regional and global atmo-              gravimeter) over alpine catchment scales (from several me-
spheric effects from ATMACS (Fig. 3c).                                  tres to kilometres) to non-local scales (from several kilo-
   Temporal variations of the Earth’s rotation vector with re-          metres). Non-local hydrological gravity variations include
spect to the Earth’s body are described by the pole coordi-             both attraction effects and surface loading, while for local
nates and the Earth rotation angle and provided as Earth Ori-           to catchment scales only the attraction effects from mass re-
entation Parameters (EOPs) by the International Earth Ro-               distributions are considered. Non-local hydrological effects
tation and Reference Systems Service (IERS). For the com-               are provided by the EOST loading service (Boy, 2021) us-
putation of the thereby induced gravity variations, the pro-            ing, e.g. the Modern-Era Retrospective analysis for Research
gramme PREDICT of ETERNA 3.4 (Wenzel, 1997) is ap-                      and Applications, version 2 (MERRA-2; Gelaro et al., 2017),
plied with the long-term file EOP 14 C04 (IAU1980) pro-                 with spatial resolutions of 0.5 and 0.625◦ in latitude and lon-
vided by IERS, and the amplitude factors are set to 1.16,               gitude, respectively, and 1 h temporal resampling. These ef-
considering the elastic properties of a deformable solid Earth          fects are displayed in Fig. 3f.
(Fig. 3d).                                                                 Figure 3 shows the process of signal separation from grav-
   Non-tidal ocean loading at Mount Zugspitze is caused by              ity observations of OSG 052 to gravity residuals by reduc-
the attraction of non-tidal water mass variations in the At-            ing all shown and explained effects for the period from 29
lantic Ocean and the Mediterranean Sea and the vertical dis-            December 2018 to 31 March 2021. These gravity residu-
placement of the Earth’s crust due to the loading of these              als are the primary target signal for hydro-gravimetric stud-
water masses. For the computation of these small effects                ies at Mount Zugspitze reflecting predominantly total wa-
with a range of 5 nm s−2 , the MATLAB toolbox mGlobe                    ter storage variations on different scales. An exceptionally

Hydrol. Earth Syst. Sci., 25, 5047–5064, 2021                                             https://doi.org/10.5194/hess-25-5047-2021
C. Voigt et al.: Technical Note: Introduction of a superconducting gravimeter 5055
large seasonal gravity range of up to 750 nm s−2 is visible From the first 27 months of observations, the high in-
compared to other SG installations in Central Europe, with terannual variability in water storage maxima amounts to
seasonal variations of approx. 100 nm s−2 range (Abe et al., 752 nm s−2 at 29 May 2019 and 393 nm s−2 at 14 March
2012). However, the gravity residuals include uncertainties 2020, significantly differing according to the time of year and
in the model-based signal separation, which are typically in amplitude by a factor of 2 due to seasonal snowpack vari-
at the level of a few nanometers per second squared (here- ations. The seasonal minima, however, are very close in time
after nm s−2 ) root mean square error (Mikolaj et al., 2019). and amplitude, with a difference of −24 nm s−2 between 16
In addition, non-hydrological signals from alpine geological September 2020 and 21 September 2019, respectively, agree-
mass redistributions are also included in the gravity resid- ing with the trend of −20 nm s−2 yr−1 estimated from abso-
uals. Typical examples are avalanches, rockfalls and land- lute gravity observations between 2004 and 2019 by Tim-
slides occurring on timescales from seconds to days. Regu- men et al. (2021). They suggest that the main contribution
lar controlled avalanche blasting with an impact of approx. is caused by glacier diminishing, and a smaller part is ex-
−5 nm s−2 on the gravity signal have already been noticed. plained by mountain uplift (1 mm causes −2 nm s−2 ). With a
On long timescales, the impact of mountain uplift and its multi-year continuous gravity time series from OSG 052, it
separation from climate-driven long-term hydrological vari- is possible to study the evolution of seasonal and – in com-
ations must be considered (Timmen et al., 2021). bination with absolute gravity observations – also long-term
An important task is the reduction of local hydrological water storage variations.
signals in order to enhance the sensitivity towards the catch- For the hydrological decomposition of the gravity resid-
ment scale. While the steep roof of the lab and its position uals into individual water storage components, complemen-
above the slope at the summit are very advantageous, most tary data from meteorological and hydrological techniques
of the disturbing signals are expected from snow masses on a are needed. According to Newton’s law of gravitation, the
horizontal plane with an area of 5 m×10 m directly in front of gravimetric method is known to be most sensitive to local
the lab (Fig. 2c) where a local snow monitoring network was mass variations with a signal attenuation by 1/r 2 (r being the
set up. Here, considerable amounts of snow accumulate dur- distance between gravimeter and source mass). As gravime-
ing the winter due to precipitation, drift of snow and snow ters are solely sensitive in a vertical direction, attenuations
cleared off a nearby visitors’ platform with a snow blower. occur for mass variations towards the horizontal direction
An estimation of the maximum signal from snow heights of (see also Creutzfeldt et al., 2008). Hence, the essential ques-
4 m and densities of 300 kg m−3 reveals a significant grav- tion is how sensitive the gravity residuals are with regard to
ity effect of 25 nm s−2 superimposed by somewhat smaller individual water storage components from local to catchment
event-like signals during heavy snowfall events. As this is scales. This question will be addressed in the following sec-
only a fraction of 1 : 30 with regard to the total gravity resid- tions.
ual range and due to initial problems as a consequence of
very harsh conditions during winter 2018–2019 (frozen snow 4.2 Snowpack
height sensors, torn cables and too low sensor pole height), a
model-based description of the local snowpack situation has Representative observations of the snow water equivalent
not yet been set up completely. (SWE) for the Zugspitzplatt are available from the LWD sta-
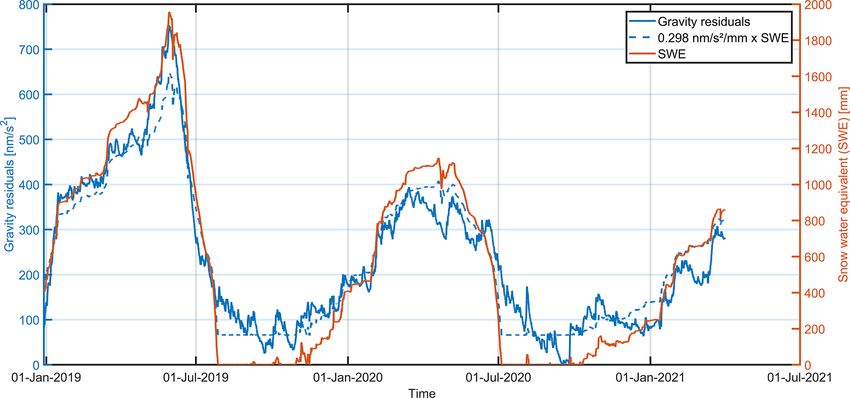
tion (Fig. 1). The spatiotemporal variations in the snowpack
around the summit of Mount Zugspitze are the main contrib-
4 Hydro-gravimetric results and sensitivity analysis utors to the gravity residuals from autumn to spring. Figure 4
shows the gravity residuals, the SWE multiplied by the esti-
4.1 Water balance
mated regression factor between gravity residuals and SWE
The subsequent hydro-gravimetric analysis based on the of 0.298 nm s−2 mm−1 (1σ = 0.003 nm s−2 mm−1 ). The high
gravity residuals from Fig. 3g focus, for the first time, on correlation of 0.963 between the gravity residuals and SWE
a high alpine region largely dominated by seasonal snow (sample size 19 771) is clearly visible, and both follow simi-
cover. The gravity residuals reflect the total water storage lar seasonal patterns.
variations from local to catchment scales as the balance of In general, the winter seasons of 2018–2019 and 2019–
precipitation, glacial melt, retention in the karst, spring dis- 2020 were very different. The first winter season is charac-
charge and evapotranspiration. While the large complexity terised by a sharp increase in SWE of approx. 300 nm s−2
and variability in the hydrological parameters make the hy- in mid-January and in the second half of May due to mas-
drological modelling very difficult, continuous gravity obser- sive snowfall. The maximum SWE is extraordinarily high,
vations are integrative and are thus highly beneficial, serving with a value of 1957 mm measured at the LWD station, com-
as constraints for the hydrological modelling on catchment pared to an annual mean of the maximum SWE at approx.
scale. 1350 mm since the installation of the snow scale in 2014.
On the contrary, the second winter season with a maximum
SWE of 1147 mm at the LWD station represents a winter
https://doi.org/10.5194/hess-25-5047-2021 Hydrol. Earth Syst. Sci., 25, 5047–5064, 20215056 C. Voigt et al.: Technical Note: Introduction of a superconducting gravimeter
Figure 4. Gravity residuals (solid blue), snow water equivalent (solid red) from LWD station at Zugspitzplatt and SWE multiplied with the
estimated regression factor of 0.298 nm s−2 mm−1 between gravity residuals and snow water equivalent (dashed blue line).
with a small to normal amount of snow. While in 2019 the maximum seasonal gravity residuals on 29 May 2019 and 14
seasonal gravity and SWE maxima coincide at 29 May, there March 2020. In order to take into account the topography for
is a difference of more than 1 month between gravity and the spatial snow distribution, the high-resolution digital ter-
SWE maxima in 2020, i.e. 14 March and 19 April, respec- rain model DGM50 M745 by BKG from 2006, with a grid
tively. However, in 2020 there was no distinctive SWE peak spacing of 100 × 100 (long20 m × lat30 m), is used. The follow-
but rather a longer period with SWE values near maximum ing assumptions are made for the snowpack distribution at
between these two dates. Higher temperatures in April 2020 the specific dates:
led to an early onset of snowmelt in the lower part of the
catchment, with recharge of the karst water body beginning 1. computing the gravity effect from topography by inte-
and increasing spring discharge at Partnach spring. gration of all rectangular prisms of 20 m × 30 m areas
Besides the high correlation between gravity and SWE and constant heights;
from the LWD station at Zugspitzplatt, there are still
2. putting a homogeneous snowpack of maximum SWE of
significant additional signals remaining with a range of
1957 and 1075 mm, respectively, on top of every rect-
250 nm s−2 in the differences between gravity residuals and
angular prism for the topography;
0.298 nm s−2 mm−1 × SWE (Fig. 4). The reasons are mani-
fold. First, the single point observations of the SWE at LWD 3. decreasing the snowpack linearly on slopes with a value
station are not fully representative of the large variations in of 50 % at 45◦ slope and 0 % at 90◦ slope; and
the SWE and its distribution at catchment scale, particularly
considering the altitude and temperature gradient within the 4. decreasing the snowpack linearly even further for lower
area. During periods of massive snowfall, e.g. from 29 De- elevations between 2000 and 1500 m with 0 % snow-
cember 2018 to mid-January 2019, this leads to remaining pack at 1500 m (only valid for the late spring of the ex-
signals of up to 150 nm s−2 . Second, signals from other water amples).
storage components are not considered within the regression
analysis. Major remaining signals of up to 200 nm s−2 occur Figure 5 shows the assumed spatial distribution of the
during the main melting periods and corresponding spring snowpack around Mount Zugspitze on 29 May 2019 and 14
discharge from May to July (Fig. 6). Moreover, rain events March 2020 (Fig. 5a and c, respectively) and the cumula-
during the short summer season cause rapid gravity increases tive snow–gravimetric sensitivities with regard to the ZU-
of up to 100 nm s−2 , e.g. from 3 to 4 August 2020, followed GOG gravimeter site (b and d, respectively) with the essential
by an equally fast but only partial decrease and a slower sub- results summarised in Table 3. The assumed snow distribu-
sequent decline due to the lagged drainage back to the gravity tions provide gravity values of 764 nm s−2 (752 nm s−2 ob-
level before the specific rain event (Timmen et al., 2021). served) and 420 nm s−2 (393 nm s−2 observed), respectively,
Sensitivity analysis of a simple snowpack distribution as- for the two dates corresponding to deviations of 2 % and
sumption in the surroundings are carried out for the times of 6 % between assumption and observation. The gravity con-
tributions from all areas coloured from deep red to yellow in
Hydrol. Earth Syst. Sci., 25, 5047–5064, 2021 https://doi.org/10.5194/hess-25-5047-2021C. Voigt et al.: Technical Note: Introduction of a superconducting gravimeter 5057
Figure 5. Assumed SWE of the snowpack at maximum seasonal gravity residuals (a, c) and corresponding cumulative snow–gravimetric
sensitivities (b, d) with regard to ZUGOG at 29 May 2019 and 14 March 2020, respectively. The boundaries of the Partnach spring and
Hammersbach catchments are shown as a black line. Sensitivities are shown only up to 99.87 % and 99.76 %, respectively, for the given
examples, omitting residuals of 1 nm s−2 of the total signal.
Table 3. Gravity contributions from modelled snowpack of various areas with regard to ZUGOG at maximum seasonal gravity residuals on
29 May 2019 and 14 March 2020.
29 May 2019 14 March 2020
Area 1g (nm s−2 ) 1g (%) 1g (nm s−2 ) 1g (%)
Total 763.9 100.0 420.4 100.0
Snow–gravimetric footprint (deep red to yellow areas in Fig. 5) 762.9 99.9 419.4 99.8
Partnach spring catchment (RCZ) 542.0 71.0 297.6 70.8
Hammersbach catchment 46.3 6.1 25.5 6.1
https://doi.org/10.5194/hess-25-5047-2021 Hydrol. Earth Syst. Sci., 25, 5047–5064, 20215058 C. Voigt et al.: Technical Note: Introduction of a superconducting gravimeter Figure 6. Spring discharge characteristics of the Partnach spring during 2018. Figs. 5b and d are defined as the snow–gravimetric footprint, 4.3 Karst groundwater and spring discharge with contributions of 99.87 % (29 May 2019) and 99.76 % (14 March 2020), respectively. Areas contributing together a remaining gravity signal of 1 nm s−2 are omitted (Table 3). Besides snow distribution and snow water equivalent, the liq- The results show that the gravimeter observations are sen- uid water balance in the karstified RCZ is influencing the sitive to the snowpack on catchment scales up to 3.5 km SG signal. Throughout the year, a typical course of spring horizontal and 4 km slant distances to the gravimeter with discharge with four characteristic periods can be observed a resulting snow–gravimetric footprint of approx. 40 km2 at the Partnach spring gauge (Fig. 6). From the end of Oc- (Fig. 5). The major contribution comes from prisms in the tober to April no recharge of the karst system takes place, RCZ with 71 % in both examples. The Hammersbach catch- and the Partnach spring falls dry. With rising temperatures ment has a much less significant contribution of 6 % only as in April, melting processes begin in the lower parts of the this lies on the opposite side of Mount Zugspitze and has very catchment, and the first meltwater pulses are observed at the steep slopes near the summit. The additional gravity con- Partnach river gauge. A melting period in the upper part of tribution from the snowpack in the remaining eastern parts RCZ starts later in May lasting until the beginning of July. of the Bockhütte catchment is negligible. The assumed spa- The karst system of RCZ is mainly fed by meltwater, and tial distribution of the snowpack suggests that the remain- discharge at the Partnach spring is continuously high. Liq- ing 23 % contribution to the total gravity signal come from uid precipitation leads to pronounced spring discharge peaks snow masses of the nearby summit area northwest of ZU- on top of the increased basal discharge level. During this pe- GOG. These effects in close vicinity should be much smaller riod of time, spring discharge at the Partnach spring is a mix- in reality, compared to our very simple assumption of snow ture of meltwater from areas with increasing elevations and distribution, as the maximum snowpack at the summit is cer- liquid precipitation. After melting ends, long lasting rainfall tainly less than the values from the LWD station due to usu- and storm precipitation dominate spring discharge character- ally strong winds at the summit ridge, which are neglected istics with steep rising and falling limbs. The well-developed up to this point. Also the topography to the northwest of ZU- karst system of RCZ with conduit flow causes these rapid GOG is very steep, in parts vertical, which allows for less spring discharge reactions of the Partnach spring. With low- snow accumulation and frequent discharge in the form of ering temperatures during autumn, snow accumulation starts avalanches. Still, the local snowpack distribution in the di- in higher elevations of RCZ, and recharge of karst ground- rect vicinity of the SG needs special attention due to artifi- water is reduced because liquid precipitation is more seldom. cial snow accumulation around the summit which are moni- Sometimes daily melting cycles of the glacier remains of the tored by a snow scale and snow height sensors (Fig. 2c). This northern and southern Schneeferner can be observed during knowledge will improve the snow–gravimetric sensitivities this usually dry period. At the end of autumn, low temper- towards catchment scales. atures and snowfall in higher elevations terminate recharge Hydrol. Earth Syst. Sci., 25, 5047–5064, 2021 https://doi.org/10.5194/hess-25-5047-2021
C. Voigt et al.: Technical Note: Introduction of a superconducting gravimeter                                                5059

and karst groundwater head falls, step by step, beneath the        scale at the LWD station provides maximum SWE values,
level of the Partnach spring.                                      while the precipitation height is set as a homogeneous layer.
   During seasonal snowmelt periods in spring and especially          The same hydro-gravimetric approach might be applied to
after the snowpack has fully disappeared in summer, other          the estimation of daily evapotranspiration rates (Van Camp
signals become the main contributors to the water storage          et al., 2016) during dry days in late summer (August and
variations observed by the gravimeter. The largest part of the     September) when the seasonal spring discharge has mainly
melting snow fills the vadose zone of the karstified under-        finished. In general, evapotranspiration is small in high
ground body below the Zugspitzplatt (Fig. 1). If the ground-       alpine areas, especially due to less available soil moisture in
water level is rising with beginning recharge of the vadose        shallow alpine soils or even the absence of soils at all, sparse
zone, the spring discharge starts at the Partnach spring which     vegetation and less demand of plants and decreases with in-
is usually well observed by a gauge station. However, the          creasing altitude (Gurtz et al., 1999). Maximum evapotran-
spring discharge data are not available for 2019 (Sect. 2.2).      spiration rates of 2–3 mm d−1 for high alpine environments
From the seasonal gravity minima at 21 September 2019 and          inducing gravity effects of 1.8 to 2.7 nm s−2 , respectively, at
16 September 2020, respectively, being very close in time de-      the ZUGOG gravimeter site are at the limit of what can be
spite the very different snow masses, a large variability in the   observed by the gravimeter.
spring discharge processes as a consequence of the seasonal           Finally, glacier melting and permafrost degradation also
snowpack can be stated.                                            contribute to groundwater and spring discharge with predom-
   For the hydrological interpretation of gravity signals from     inant climate-driven long-term signals but also significant in-
ZUGOG, it is crucial to quantify the water volume stored in        terannual variations, e.g., as a consequence of very dry and
the vadose karst zone of RCZ. Thereto, pseudo-continuous           hot summers (Scandroglio et al., 2019). In addition, cavi-
depletion curves are constructed by splicing short falling hy-     ties inside Mount Zugspitze filled with water through per-
drograph intervals together (e.g. Lamb and Beven, 1997).           mafrost degradation might influence the gravimetric signal
The recession constant “α” is calculated for several years be-     on a catchment scale, depending on the distance and direc-
cause the recession behaviour of the Partnach spring varies        tion to the gravimeter and their sizes. These additional sig-
from year to year due to unknown processes in the karst sys-       nals will be best captured by the combination of absolute,
tem (Fig. 7a). Based on a mean recession constant α, a water       superconducting and relative gravimetry and other geodetic
storage model for the vadose karst zone is developed by an         techniques in a future hybrid approach.
addition of daily discharge volumes during the depletion pe-
riod. As Fig. 7b shows, storage volume in the vadose zone
varies between 1.6 and 3.38 × 10⁶ m3 . Under the assumption        5   Summary and conclusions
of a homogeneous layer of a 6 km2 wide groundwater body
(Fig. 1), these numbers correspond to water storage changes        The superconducting gravimeter OSG 052 is introduced as
of 0.27 and 0.56 m, respectively, that can be translated to        a novel hydrological sensor for the direct observation of the
groundwater level changes depending on the aquifer poros-          integral gravity effect of total water storage variations in the
ity. Sensitivity analysis with regard to the ZUGOG site reveal     high alpine Partnach spring catchment (Research Catchment
corresponding gravity values between 12 and 24 nm s−2 , re-        Zugspitze – RCZ), and a high-quality and publicly available
spectively. With an uncertainty of a few nm s−2 , the gravi-       continuous gravity time series of 27 months is provided. The
metric approach should be able to distinguish interannual          RCZ is among the best-equipped high alpine catchments with
groundwater storage variations and allow for comparison            lysimeter characteristics and is now supplemented by a su-
with the water balance and karst water discharge studies at        perconducting gravimeter to address the complex hydrologi-
the Partnach spring. Besides seasonal spring discharge and         cal situation dominated by snow cover, melting glaciers and
corresponding karst groundwater variations, rainfall events        degrading permafrost, as well as karst groundwater.
on timescales from hours to days produce significant peak-            Spatiotemporal variations in the snowpack are the main
like signals not only in the spring discharge but also in the      contributor to the gravity residuals. Gravity residuals from
gravimetric time series. A homogeneous layer of 1 mm pre-          the OSG 052 and the SWE measured with a snow scale
cipitation height on top of the digital terrain model applied      at an altitude of 2420 m are highly correlated (0.963) and
(Sect. 4.2) results in a gravity increase of 0.9 nm s−2 . This     reveal a regression factor of 0.298 nm s−2 mm−1 (1σ =
shows that the gravity variations can be used as reference for     0.003 nm s−2 mm−1 ). The large range of gravity residuals
the estimation of the total sum of precipitation (Delobbe et       up to 750 nm s−2 corresponds to the maximum of 1957 mm
al., 2019) in this alpine terrain with large variability in pre-   snow water equivalent on 29 May 2019, measured at the
cipitation instead of using point measurements with precip-        LWD station located on the Zugspitzplatt. Sensitivity anal-
itation collectors. The higher precipitation admittance factor     ysis on the basis of a simplified assumption on snow dis-
(factor of 3 compared to 0.298 nm s−2 mm−1 for the SWE)            tribution in this area reveal a snow–gravimetric footprint
results from the large geographical heterogeneity of the SWE       of 3.5 km horizontal and 4 km slant distances around the
in the RCZ. The SWE of the snowpack recorded by the snow           gravimeter, covering an area of 40 km2 . This result, together

https://doi.org/10.5194/hess-25-5047-2021                                       Hydrol. Earth Syst. Sci., 25, 5047–5064, 2021
5060                                              C. Voigt et al.: Technical Note: Introduction of a superconducting gravimeter

Figure 7. Depletion curves of the karst groundwater of RCZ for selected years (a) and calculated storage volumes of the groundwater body
at different levels of spring discharge (b). The solid line shows the relationship for a mean recession constant “α” of 0.4, and the dashed lines
are enclosing the range of 1 standard deviation.

with the low uncertainty of the gravity residuals of a few                 a hydrological model to an efficient, physically based, spa-
nm s−2 , enables various detailed future hydro-gravimetric                 tially distributed karst snow hydrological model describing
analysis as the snow masses from the RCZ contribute to more                relevant physical processes in the RCZ.
than two-thirds of the total gravity signal.                                  Further improvements and enhancements are also planned
   Based on this concept study, it is certainly useful to also             for the gravimetric part. The set-up of a more detailed and
study the non-linearity of the relationship between gravity                small-scale snowpack description, especially in the direct
residuals and SWE, i.e. is there a significant dependence                  vicinity of the SG with artificial snow accumulations, is es-
on snow height? Moreover, the description of the snow-                     sential in order to increase the sensitivity towards the whole
pack distribution will be refined in future studies for the en-            catchment. For this purpose, a high-resolution digital terrain
tire Zugspitze region and the three catchments of Partnach                 model (DTM) with a grid spacing of 1 m × 1 m will be used
spring, Bockhütte and Hammersbach. The aim is to set up                    in the future in combination with a detailed 3D surveying of
snowpack models such as SNOWPACK/Alpine3D (Lehning                         the buildings at the summit. With regard to atmospheric grav-
et al., 2006) or use cold region hydrological model frames                 ity effects, the complex alpine topography surrounding ZU-
like the Canadian Hydrological Model (CHM; Marsh et al.,                   GOG should be taken into account either by using a weather
2020) at this location, and, in addition, to statistically de-             model with a higher spatial resolution or by setting up a local
scribe the main snowpack distribution via lidar measure-                   model based on an array of available barometers (Riccardi
ments, similar to those presented in Grünewald et al. (2013).              et al., 2007). Additional absolute gravity measurements, in-
With these approaches, the descriptions of the spatial snow-               cluding amplitude calibrations will improve the SG drift es-
pack distribution will be improved in this very complex high               timation and support long-term studies, while the GNSS sta-
alpine terrain by including detailed descriptions of the snow-             tion nearby ZUGOG reveals the long-term vertical displace-
pack itself, the effect of the energy balance on the snowpack,             ment of the site. It is further intended to install a continu-
potential wind redistributions and further meteorological and              ously recording ZLS Burris spring gravimeter in a vertical
gravimetrical influences on the snow cover regarding eleva-                distance of 500 m below OSG 052 inside Mount Zugspitze
tion, aspect and slope and by using the gravity residuals as               in a technical room next to the rails of the cogwheel train
boundary conditions.                                                       to quantify the ongoing mass redistributions and time delays
   During the mainly snow-free season in summer, other                     inside the mountain. In addition, the integration of episodic
water storage components dominate the gravity residuals.                   relative gravity measurements both from the tunnel of Mount
Spring discharge and karst groundwater variations are driven               Zugspitze and from the RCZ, at least 4 times per year with a
not only by snowmelt and rain but also by glacier melting and              target uncertainty of 10 nm s−2 (1σ ), would be highly benefi-
permafrost degradation. While the discharge of the Partnach                cial in a future hybrid gravimetric approach in order to better
spring and Bockhütte catchments are generally well observed                capture the spatiotemporal gravity variations on catchment
by gauge stations, the estimation of catchment-wide total                  scales and would allow for a more thorough constraining of
rainfall amounts and evapotranspiration rates will strongly                the hydrological model. A great benefit will be the continu-
benefit from including the gravity residuals into the analysis.            ous absolute gravity reference at ZUGOG with known grav-
The high-resolution model of the spatiotemporal variations                 ity variations and no need to rely on models for the reduction
in the snowpack amount and distribution will be coupled with               in the relative gravimetric measurements.

Hydrol. Earth Syst. Sci., 25, 5047–5064, 2021                                                 https://doi.org/10.5194/hess-25-5047-2021
You can also read