Carbon investment into mobilization of mineral and organic phosphorus by arbuscular mycorrhiza
←
→
Page content transcription
If your browser does not render page correctly, please read the page content below
Biology and Fertility of Soils (2021) 57:47–64
https://doi.org/10.1007/s00374-020-01505-5

    ORIGINAL PAPER

Carbon investment into mobilization of mineral and organic
phosphorus by arbuscular mycorrhiza
Alberto Andrino 1          &   Georg Guggenberger 1 & Leopold Sauheitl 1 & Stefan Burkart 2 & Jens Boy 1

Received: 9 April 2020 / Revised: 17 August 2020 / Accepted: 20 August 2020 / Published online: 1 September 2020
# The Author(s) 2020

Abstract
To overcome phosphorus (P) deficiency, about 80% of plant species establish symbiosis with arbuscular mycorrhizal fungi
(AMF), which in return constitute a major sink of photosynthates. Information on whether plant carbon (C) allocation towards
AMF increases with declining availability of the P source is limited. We offered orthophosphate (OP), apatite (AP), or phytic acid
(PA) as the only P source available to arbuscular mycorrhiza (AM) (Solanum lycopersicum x Rhizophagus irregularis) in a
mesocosm experiment, where the fungi had exclusive access to each P source. After exposure, we determined P contents in the
plant, related these to the overall C budget of the system, including the organic C (OC) contents, the respired CO2, the
phospholipid fatty acid (PLFA) 16:1ω5c (extraradical mycelium), and the neutral fatty acid (NLFA) 16:1ω5c (energy storage)
at the fungal compartment. Arbuscular mycorrhizal (AM) plants incorporated P derived from the three P sources through the
mycorrhizal pathway, but did this with differing C-P trading costs. The mobilization of PA and AP by the AM plant entailed
larger mycelium infrastructure and significantly larger respiratory losses of CO2, in comparison with the utilization of the readily
soluble OP. Our study thus suggests that AM plants invest larger C amounts into their fungal partners at lower P availability. This
larger C flux to the AM fungi might also lead to larger soil organic C contents, in the course of forming larger AM biomass under
P-limiting conditions.

Keywords Apatite . Organic phosphorus . Phytate . Inorganic phosphorus . Arbuscular mycorrhiza . PLFA 16:1ω5c . NLFA
16:1ω5c . Photosynthesis . Stable carbon isotopes

Introduction                                                                 2009), explores a large volume of soil and does this at a lower
                                                                             cost as compared with roots. Such low-cost modes of P acqui-
Phosphorus is the most limiting nutrient for plant growth after              sition are expected to be favored by natural selection and
nitrogen (N), especially in soils from tropical ecosystems,                  during the assembly of plant communities by competition
where secondary minerals immobilize P (Johnston et al.                       (Raven et al. 2018). One reason for the better cost to benefit
2019). As a consequence, almost 80% of plant species estab-                  ratio is that AMF hyphae represent the lower construction and
lish symbiotic associations with arbuscular mycorrhizal fungi                maintenance costs for infrastructure (2–20-μm diameter),
(AMF) (Smith and Read 2008). This symbiotic relationship,                    compared with root hairs (100–500-μm diameter) (Hodge
being several hundreds of million years old (Lambers et al.                  2017). The AMF are able to mobilize the otherwise poorly
                                                                             accessible phosphate ions beyond the P depletion zone
Electronic supplementary material The online version of this article         (Osorio et al. 2017), and are responsible for nearly 80% of
(https://doi.org/10.1007/s00374-020-01505-5) contains supplementary          the plant P uptake (Douds and Johnson 2007).
material, which is available to authorized users.
                                                                                 Mycorrhizal benefits are greater under P-limiting soil con-
                                                                             ditions than in P-rich ones. In exchange for the P acquisition,
* Alberto Andrino
  andrino@ifbk.uni-hannover.de                                               AMF represent a major sink for recently fixed plant photosyn-
                                                                             thates (Nottingham et al. 2010), investing the host plant C into
1
                                                                             the fungal growth, respiration, and biological maintenance
     Institute of Soil Science, Leibniz Universität Hannover,
     Herrenhäuser Straße 2, 30419 Hannover, Germany
                                                                             (Jansa et al. 2011). Photosynthetic rates are often higher in
2
                                                                             mycorrhizal than in non-mycorrhizal plants (Augé et al.
     Institute of Climate Smart Agriculture, Thünen-Institut, Bundesallee
     65, 38116 Braunschweig, Germany
                                                                             2016), as a result of improved plant nutrition, especially of
48                                                                                                      Biol Fertil Soils (2021) 57:47–64

P, in mycorrhizal plants (Gavito et al. 2019). The AM plants        mobilize the differently accessible P pools in the soil, by a
allocate 4–20% of the total C fixed into the AMF structures         cosmopolitan AMF such as R. irregularis. For that, we will
(Parniske 2008), and up to 5% of net photosynthesis is lost by      employ the same dual-compartment system, where exclusive-
hyphal respiration (Moyano et al. 2007). AMF may also act as        ly the AMF hyphae have access to the different P sources in a
a gateway for direct delivery of recent plant photosynthates to     fungal compartment (FC) as in the experiment of Andrino
the hyphospheric microbes within hours (Kaiser et al. 2015),        et al. (2019). In the present study, we will quantify the full C
exhibiting an intimate relationship and suggesting a synergis-      budget of the mycorrhizal symbiosis by measuring the re-
tic cooperation (Zhang et al. 2016).                                spired CO2, total organic C accumulated, and fungal biomass
    Plant P acquisition strategies require photoassimilates as      at the FC, and assess the C-P stoichiometry to acquire P from
energy form (Li et al. 2019). In this regard, Turner (2008)         primary minerals such as AP, as opposed to the mobilization
hypothesized that the different soil P forms can be placed          of free orthophosphate (OP) and PA. Furthermore, we will
along a gradient of increasing energy investment required           investigate the fate of the newly assimilated photosynthates
for their acquisition, since insoluble organic form (e.g., phytic   in the plant-AMF-microbiota continuum, attempting to under-
acid, PA) and P-containing primary minerals (e.g., apatite,         stand whether plant and fungus react in a coordinated manner,
AP) have comparatively high pre-processing costs, even at           when mobilizing P sources with differing accessibility. We
high concentrations, and these costs may steeply rise, as con-      hypothesize that less accessible P sources, namely PA and
centration declines (Raven et al. 2018).                            AP, will cause larger photoassimilate investments by the host
    Apatite is the most important primary mineral containing P      plant and will result in differing trading costs per P unit in
(Nezat et al. 2008). It accounts for over 95% of all P in the       comparison with easily accessible P sources such OP.
Earth’s crust, thus playing a vital role in providing P to all
ecosystems (Ptáček 2016). The AMF may tap into the crys-
talline structure of the AP through the exudation of acids and      Material and methods
mobilizing the released P (Ness and Vlek 2000), but there is
not a single report on the acquisition costs.                       To compare the acquisition costs of incorporating P from dif-
    Organic P constitutes 20–80% of the total P in the soil,        ferently accessible sources through the mycorrhizal pathway,
with PA representing > 50% of the organic P (Shen et al.            we conducted two experiments. Experiment 1 allowed us to
2011). Turner (2008) identified PA as the P source most             test the ability of the AMF to mobilize P from the different
resistant to hydrolysis, and the metabolically most expen-          sources offered at the FC during a time-course experiment
sive source among the soil P compounds. In plants estab-            over 112 days, but more importantly, to estimate whether
lishing an ectomycorrhizal association (ECM), C allocation          there is a differentiated plant C investment into the AMF.
into the extraradical hyphae increases proportionally at the        Experiment 2 was carried out to compare the current acquisi-
absence of readily available P and/or under low P condi-            tion costs in the form of recent photoassimilates using stable
tions (Smits et al. 2012); furthermore, ECM might play a            isotope 13C at the specific time point elucidated in the exper-
critical role in the decomposition of organic P, essential to       iment 1. This was done only at treatments, where it was pos-
meet host plant P requirements and maintain the balance of          sible to quantify the incorporation of the different P sources.
soil labile P (Fan et al. 2018). We recently confirmed the
ability of the cosmopolitan AMF R. irregularis DAOM                 Experiment 1
197198 to mobilize free PA and PA bound to the iron oxide
goethite. Their mobilization proved to be the most expen-           Solanum lycopersicum L. inoculation with Rhizophagus
sive for the mycorrhized plant, in terms of C investment            irregularis DAOM 197198
(Andrino et al. 2019). On the one hand, AMF may exudate
their own acid phosphomonoesterase, to mineralize organic           A system of one plant and one fungus was selected to test our
P forms and access P sources that non-mycorrhizal plants            hypotheses. One-one models are limited to tackle with the
are unable to mobilize (Sato et al. 2015). On the other one,        diversity of possible responses that a natural system can offer,
soil microbes may cooperate intimately with the AMF by              while they are excellently suited for elucidating processes and
providing inorganic P released by the decomposition of              understanding the underlying mechanisms developed by sin-
organic sources, in exchange for C exuded by the hyphae.            gle AMF species (Zou et al. 2015). Tomato seeds var.
But the mechanisms by which these exudates trigger the              Moneymaker (Volmary GmbH, Münster, Germany) were
process of P mineralization in bacteria are still unknown           surface-sterilized with H2O2 (5%, 10 min), rinsed with sterile
(Zhang et al. 2018).                                                distilled water (3×) and germinated on the surface of a moist-
    In the present study, we aim at identifying some factors        ened filter paper inside a petri dish (3 days, 27 °C). The
controlling the interrelation of the energy investment (C) by       R. irregularis DAOM 197198 model organism (Daubois
the model tomato plant (Solanum lycopersicum L.) to                 et al. 2016) was selected as mycorrhizal symbiont due to its
Biol Fertil Soils (2021) 57:47–64 49
ubiquitous occurrence and adaptation to agricultural practices AM arterial hyphae are much finer than roots at 20–30 μm,
(Köhl et al. 2016). The inoculum of the strain DAOM 197198 and their fine distal absorptive hyphae are only about 2–7-μm
consisting of spores and root fragments (Symplanta GmbH & in diameter according to Leake and Read (2017). The PTFE
Co. KG. Darmstadt, Germany) was reproduced in a trap plant membrane allowed the AM hyphae to cross but did not allow
culture (Brundrett et al. 1996). Germinated tomato seeds were mass flow and diffusion of ions to the PC; thus, sources were
transplanted into 75-ml pots QP96 (HerkuPlast Kubern only accessible to the AM plant via the hyphae (Mäder et al.
GmbH, Ering, Germany) with 0.4 g containing 35–50 AMF 1993).
propagules (roots, spores, hyphae) and 70-ml autoclaved and
acid washed quartz sand, while non-mycorrhizal controls (M Phosphorus sources offered at the fungal compartment
−) received 0.4 g of non-inoculated chopped roots. The quartz
sand was used as plant and fungal growth substrate due to its Three P sources were offered at the fungal compartment.
suitability for the AM mycelium development (Olsson and Orthophosphate (OP) was used as inorganic and readily avail-
Johansen 2000). Mycorrhizal and control plants were grown able source in the form of KH2PO4. Phytic acid (PA) (Sigma-
at a greenhouse for 4 weeks (photoperiod 16/8 h light/dark, Aldrich, Taufkirchen, Germany) was chosen as the organic
temperature 24/20 °C light/dark, 50–60% relative air humid- source. A total content of 10 mg P was applied in the form
ity, photon flux density of 175–230 μmol m−2 s−1). Plants of OP or PA and dissolved in 16 ml autoclaved MilliQ water
were watered every day with 10 ml deionized water, and on and mixed with 60 g autoclaved acid washed quartz sand
alternate days the pots were fertilized with 5 ml low P placed inside each fungal compartment. Ten milligram P con-
(0.32 mM) modified Long Ashton nutrient solution pH 6.5 tent was decided on the basis to sustain the plant P necessities
(Hewitt 1966). A quality control was carried out before the during the next 3 months after planting the seedlings into the
transplantation into the mesocosm, to monitor whether the mesocosms. As third P source, we have chosen AP as a pri-
AM plants were mycorrhized. For this, tomato mycorrhizal mary mineral source (2-mm diameter) (Krantz Company,
roots from AM plants and controls were stained using the Bonn, Germany). An average P content of 18.72% within
ink and vinegar staining technique for visualizing the AMF the AP was characterized using a field emission scanning
colonization (Vierheilig et al. 1998). The percentage of electron microscope equipped with an energy-dispersive spec-
mycorrhization was higher than 60% for plants transplanted trometer (Phillips/FEI XL-30, Hillsboro, Oregon, USA).
into the mesocosms. Easily available P in water was determined for the AP by
shaking 1 g of the mineral with 30 ml of autoclaved MilliQ
Temporal dynamics water pH 7 (n = 3) in a 50-ml falcon test tube. The tubes were
placed on an orbital shaker at 250 rpm for 7 days to determine
Four-week-old mycorrhized tomato seedlings were planted maximum amount of P released from the AP in MilliQ water.
into each mesocosm and placed at a greenhouse (photoperiod The centrifuged supernatant (3000×g, 15 min) was filtered
16/8 h light/dark; temperature 24/20 °C light/dark; 50–60% through a 0.45-μm syringe filter (PVDF) and 1 ml was mixed
relative humidity; photon flux density of 175– with 1 ml 30% HNO3, and the mixture was filled up to 10 ml
230 μmol m−2 s−1). Once a week, mesocosms were rotated with MilliQ water. Total P concentration was measured by
within the greenhouse to achieve homogeneous growth con- ICP-MS Agilent 7500C (Agilent Technologies Ireland Ltd.,
ditions. To observe the temporal dynamics on the P acquisi- Cork, Ireland) and resulted in 0.03 mg ± 0.004 mg P g−1 AP in
tion by the AM plants and the controls, they were sampled five the MilliQ water. An amount of 3 g AP containing 562 mg
times within 112 days. The first sampling time was at the day total P and 0.09 mg easily available P was added to 60 g quartz
of transplanting (day 0) to determine initial plant P content sand and 16 ml autoclaved MilliQ water. Apatite was added in
(n = 5), followed by four sampling times at days 35, 56, 86, a greater amount as compared with OP and PA, to know
and 112. At each sampling time, three biological replicates of whether AMF could exclusively mobilize more P than the
each treatment were sampled. easily available fraction. Apatites are mostly of sedimentary
The mesocosms consisted of a plant compartment (PC) and origin (Arif et al. 2017), and the different formation processes
a FC, into which only the AMF hyphae were able to grow and have an impact in their physical, chemical and crystallograph-
mobilize the P sources offered there (Fig. 1a). Between both ic properties and consequently in their effectiveness as a P
compartments, two barriers separated mycorrhizal roots and source (Arcand and Schneider 2006). For this reason, it was
mycelium: a 20-μm pore size polyamide mesh (Franz Eckert decided that AP should be in excess, thus preventing P from
GmbH, Waldkirch, Germany) (Watkins et al. 1996; Fitter being a limiting nutrient since the water available fraction was
et al. 1998) and a polytetrafluoroethylene (PTFE) membrane already very low (0.03 mg P/g AP). Furthermore, the other
with a pore size of 5–10-μm (Pieper Filter GmbH, Bad two P sources OP and PA were homogeneously distributed
Zwischenahn, Germany). AMF hyphae exhibit a high degree throughout the FC, having been dissolved in ultra-pure water,
of plasticity in terms of its architecture (Püschel et al. 2020). while 2-mm AP particles were mixed with the quartz sand.50 Biol Fertil Soils (2021) 57:47–64
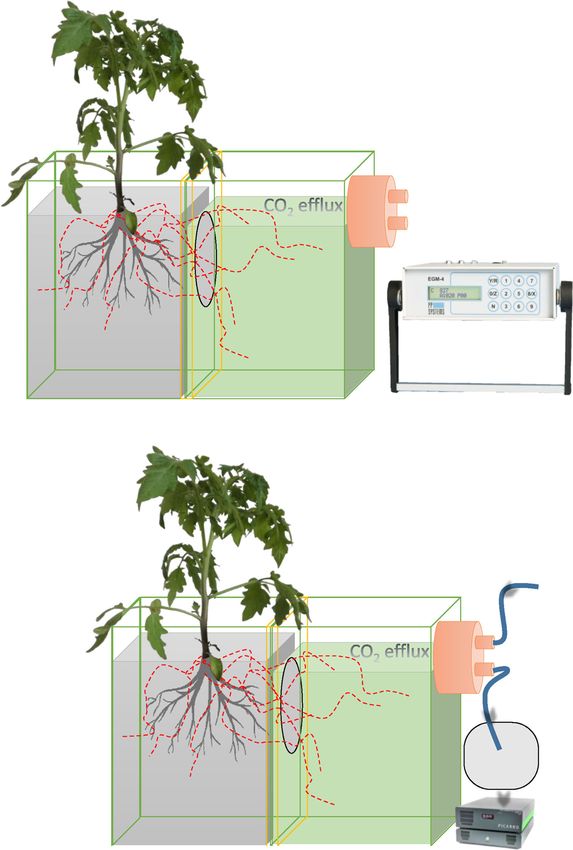
Fig. 1 Scheme of mesocosms
containing an arbuscular a
mycorrhizal plant in the left
compartment and a fungus in the
right compartment, also
containing one of the three
different P forms: orthophosphate
* A B
A. Polyamide
mesh 20 μm
B. PTFE membrane
in solution as readily available P 5-10 μm
form, apatite as mineral P source,
and hytate as organic P source or
a blank with no P. The plant Air Volume= 40 ml
compartment is separated from
the fungal compartment by a
double-mesh system, so that only
the mycelium is able to access to
the different P sources. (a) The
fungal compartment of the Phosphorus source
mesocosms is connected to the
EGM-4 infrared gas analyzer for M+ OP
CO2 measurement (experiment
1). (b) Scheme of the mesocosms
setup used to measure the CO2
content and the δ13CO2 ratio re-
AM hyphae
Plant compartment
* PA AP
Fungal compartment
spired at the fungal compartment. (190 ml) (55 ml)
The gas bags were filled with the
air respired from the fungal com-
partment and then were measured
in the Picarro G1101-I (experi-
ment 2). Abbreviations are OP,
orthophosphate; AP, apatite; PA,
b
phytic acid; M+, mycorrhizal
plant with no P
CO2
Air Volume= 40 ml
415 ppm
4 ml /min
δ13CO2
−11‰
Phosphorus source
M+ OP
AM hyphae
Plant compartment
* PA AP
Fungal compartment
Gas-bag
(0.6 l)
(190 ml) (55 ml)
Thus, AP was also supplied in excess, to increase the proba- Plant P content
bility of the hyphae exploiting the 2-mm granules mixed in the
FC. At each of the five sampling times, shoots and roots were air-
The water content at the fungal compartments was checked dried (70 °C, 48 h), weighed, and ball-milled (Retsch GmbH,
once a week and maintained with autoclaved MilliQ water at a Haan, Germany). An aliquot of the grinded shoot and root
volumetric water content of 19% (equivalent to field capacity) samples was incinerated at 480 °C for 8 h, digested with
with the aid of a time-domain reflectometry probe Trime Pico 1 ml 30% HNO3, filtered through a 0.45-μm syringe filter
connected to a Trime-FM version P2 (Imko Micromodultechnik (PVDF) and analyzed by ICP-MS (Agilent 7500C, Agilent
GmbH, Ettlingen, Germany). Technologies Ireland Ltd., Cork, Ireland). The amount of totalBiol Fertil Soils (2021) 57:47–64 51
P incorporated by the AM plant over time was calculated as chloroform, 20 ml of acetone, and 20 ml of methanol, respec-
the difference of the total P content at each sampling time and tively. The PLFA and NLFA samples were exposed to mild
the average total P content initially present in the transplanted alkaline methanolysis. Transformation of phospholipids and
plants at day 0 (n = 5). neutral lipids into free fatty acid methyl esters (FAMEs) was
based on Frostegård et al. (1991) with modifications by
Carbon dioxide production and organic C in the fungal Bischoff et al. (2016). FAMEs were separated by gas chroma-
compartment tography using an Agilent 7890A GC system (Agilent
Technologies Ireland Ltd., Cork, Ireland) equipped with a 60-
At each sampling time, 2 g from each fungal compartment m Zebron capillary GC column (0.25-mm diameter and
were air-dried (70 °C, 48 h), weighed, and ball-milled. The 0.25-μm film thickness; Phenomenex, Torrance, California,
total C content was determined on an Elementar vario Isotope USA) and quantified with a flame ionization detector, using
cube C/N analyzer (Elementar GmbH, Hanau, Germany) and He as carrier gas. Nonadecanoic acid (25 μg) and glyceryl
was considered organic C (OC), as there was no inorganic C tridodecanoate (25 μg) were used as internal standards during
in the fungal compartment. For the calculation of the total OC the extraction, and tridecanoic acid methyl ester (15 μg) was
in the fungal compartment, the total C content (mg g−1) was added to each sample and standard before GC analysis as a
multiplied by the total weight of substrate in the fungal com- recovery standard. For the fatty acid identification, the relative
partment. The CO2 production rate (mmol CO2 m2 h−1) was retention times were compared with that of the internal standard
measured in the fungal compartment with an EGM-4 infrared using the Agilent GC ChemStation (B.03.02.341) software. In
gas analyzer (PP-systems, Hitchin, UK), a closed dynamic our study, PLFA and NLFA 16:1ω5c were measured to esti-
system (Vermue et al. 2008), during the whole experiment at mate the biomass and energy storage of R. irregularis in the
5 days per week (Fig. 1a). The cumulative CO2-C production fungal compartment, respectively (Stumpe et al. 2005). Three
was interpolated using a cubic spline function and calculated ratios were calculated to evaluate the C-P trading costs between
in milligram at each fungal compartment for each sampling the AMF and the host plant to acquire the different P sources.
day (Gentsch et al. 2018). The cumulative CO2-C/OC ratio was The ratios between 16:1ω5c PLFA to plant P uptake (Eq. 2) and
used as a proxy of the metabolic activity at the fungal compart- NLFA to plant P uptake (Eq. 3) served to estimate the invest-
ment (Eq. 1). In the case of those AM plants mobilizing PA, ment made by the tomato plants into their fungal partner in either
when calculating the CO2-C to OC ratio, 3.84 mg C was biomass or energy storage to obtain P from each source, respec-
subtracted from the total OC found in the FC, as that is the tively. The ratio between NLFA 16:1ω5c and PLFA 16:1ω5c
amount of C present in the 37.72 mg of PA containing 10 mg P. (Eq. 4) was used as an index for the R. irregularis growth strat-
egy of (Rinnan and Bååth 2009). A high NLFA 16:1ω5c to
cumulative CO2 −C ðmgÞ PLFA 16:1ω5c ratio denotes C allocation to storage products
CO2 −C=OC ¼ ð1Þ
organic C ðmgÞ in form of neutral lipids, in order to meet the catabolic needs of
the fungus. Additionally, this ratio allows to discriminate be-
tween bacterial and fungal origin of the 16:1ω5c fatty acid.
R. irregularis: biomass and energy storage estimation When the NLFA 16:1ω5c to PLFA 16:1ω5c was > 1, the fatty
acid originated from AM fungi and not from bacteria (Cozzolino
The fatty acid composition of R. irregularis DAOM 197198 et al. 2016).
includes molecules from C16:0 to C22:2 with 16:1ω5 as ma-
jor fatty acid (Wewer et al. 2014). The PLFA 16:1ω5c is a
PLFA 16 : 1ω5c ðtotal μg per fungal compartmentÞ
biomarker to estimate the amount of extraradical AMF PLFA 16 : 1ω5c=P ¼
P incorporated ðmg per plantÞ
mycelia (Olsson and Johansen 2000). The NLFA 16:1ω5c
ð2Þ
biomarker estimates the amount of energy the fungus allocates
for storage and is found in vesicles, spores, and extraradical
mycelium (Bååth 2003). It is metabolized in the mycelium
through the glyoxalate cycle providing the major fungal respi- NLFA 16 : 1ω5c ðtotal μg per fungal compartmentÞ
NLFA 16 : 1ω5c=P ¼
P incorporated ðmg per plantÞ
ratory substrate (Van Aarle and Olsson 2003).
Lipids were extracted twice from 16 g of the different fungal ð3Þ
compartments, belonging to different treatments and harvesting
points, using a chloroform-methanol-citrate buffer 0.15 M pH 4
(1:2:0.8 v:v:v). Extracts were fractionated by solid-phase extrac- NLFA 16 : 1ω5c ðtotal μg per fungal compartmentÞ
NLFA=PLFA ¼
tion with activated silica gel (Sigma-Aldrich, pore size 60 Å, PLFA 16 : 1ω5c ðtotal μg per fungal compartmentÞ
70–230 mesh) into neutral lipid fatty acids (NLFA), glycolipids, ð4Þ
and phospholipid fatty acids (PLFA) by elution with 5 ml of52 Biol Fertil Soils (2021) 57:47–64
13
Experiment 2 CO2 abundance in the respired CO2 of each mesocosm. As
these samples were taken before labeling, the corresponding
The decision on the sampling day for experiment 2 was made values were defined as the background.
on the basis of the results from experiment 1. The ideal label- Thereafter, all mesocosms were brought to a labeling box
ing point for experiment 2 was defined at the moment when all (60 × 120 × 50 cm, H × W × D) with forced ventilation (Fig.
treatments showed the maximum P incorporation from the S2) to promote homogeneous 13CO2 distribution during the
different P sources. The same growing conditions described pulse labeling. At the moment of closing the box, the
in experiment 1 were replicated for two identical groups of internal CO2 concentration was 452 ppm had a δ13C ratio of
plants, which were grown until the date determined at exper- − 12.23‰. Another identical set of mesocosms was reserved
iment 1. The first group of plants was pulse-labeled with 13C to determine the natural abundances in the plant tissues and
stable isotope and the second one was not labeled as control. the substrates of both compartments during the course of the
Each identical group contained three biological replications experiment. The labeling box was placed inside a greenhouse
for each P source and a mycorrhized control plant without P. (20 °C, 50–60% relative air humidity, photon flux density of
The labeling experiment aimed at determining the amount of 195 μmol m−2 s−1). The 13CO2 tracer used for pulse labeling
freshly assimilated C invested on the one hand, into leaves, consisted of 2 g Ca13CO3 (99 atom% 13C) (Sigma-Aldrich,
shoots, roots, substrates of the plant compartment, and on the Steinheim, Germany). The labeling box was closed at 10:00 h,
other one, into the respired CO2 and the different microbial and the tracer was dissolved in 1 M H2SO4 injected through
communities at the fungal compartment. the wall of the chamber. At 12:00 h, the labeling was stopped
by opening the box and moving the labeled mesocosms to
Photosynthetic rates another room.
The CO2 concentration and its 13C signature in the fungal
The photosynthetic capacity of the tomato plants was mea- compartment was determined by a Picarro G1101-I (Picarro
sured with the LI-6400 (Licor, Lincoln, NE, USA) on re- Inc., Sunnyvale, USA) (Fig. 1b and S2). To allow for a higher
cently fully expanded third or fourth leaves from top, 1 day sampling intensity, a programmable valve system was devel-
before the 13CO2 pulse labeling. The photosynthetic rate oped to simultaneously collect a set of samples and then mea-
was used to test the effect of the different P sources on the sure them consecutively. Gas samples were collected in 0.6-l
host's carbohydrate metabolism, as P deficiency may cause gas sampling bags Tedlar® PLV with Thermogreen® LB-2
a rapid decrease in photosynthetic rates (Maathuis 2009). Septa (Sigma-Aldrich, Steinheim, Germany). Different pre-
Values were recorded at 22 °C in the leaf cuvette, a photon tests were carried out to find out the optimum sample volume
flux density of 1000 μmol m−2 s−1, approx. 50% relative for the Picarro device to obtain a steady measurement. It was
humidity, airflow rate of 400 μmol s−1, an external CO2 found that at least 300 ml per bag were sufficient for a 10-min
concentration of 360 ppm, and the CO2 mixer to reference continuous measurement. The mesocosms were connected to
400 ppm. the programmable valve system, and the airflow was adjusted
to 4 ml min−1 for each of the 12 mesocosms. Once the airflow
13
C pulse labeling: 13C incorporation into respired CO2, plant through each mesocosm was steady, the first batch of gas bags
tissues, and substrates was connected from 13:00 to15:00 h (Fig. S2) as described for
background sampling, followed by six other sampling times,
Mesocosms were placed into a phyto-chamber (20–22 °C, 50– covering a total of 25.5 h since the end of the 13CO2 pulse
60% relative air humidity, photon flux density of 195 μmol/ labeling (Fig. S2).
m/s) and connected to a multi-valve system through a gas inlet Leaves, shoots, roots, plant, and fungal compartment sub-
and outlet at the fungal compartment to test for air leaks. strates were sampled 27 h after the labeling finished. The
Purified air with a CO2 concentration of 415 ppm and a samples were freeze-dried and ball-milled, and aliquots were
δ13C ratio of − 11‰ (Zero Air generator UHP-35ZA-S, weighed into tin capsules for isotope ratio mass spectrometry
Parker Hannifin, Cleveland, USA) was then pumped for analysis. The content of total C and the δ13C ratio in the
120 min through the fungal compartment (4 ml min−1), and samples was determined with the elemental analyzer Isotope
the stability of the flow rate was checked every 10 min. Once cube (Elementar GmbH, Hanau, Germany) connected to an
the absence of leaks in the gas circuit between the mesocosms Isoprime 100 isotope ratio mass spectrometer (Elementar
and the valve system has been verified, 12 sampling bags GmbH, Hanau, Germany) via a continuous flow inlet using
(three bags per treatment) were connected to the programma- helium (99.999% purity; Linde, Munich, Germany) as carrier
ble valve system and began filling for the next 120 min (Fig. gas. Calibration was carried out with certified solid standards
1b and S2). After all bags were filled, they were measured from the International Atomic Energy Agency (IAEA,
sequentially at the Picarro G1101-I cavity ring-down spec- Vienna, Austria) sucrose (IAEA-CH-6), cellulose (IAEA-
trometer (Picarro Inc., Sunnyvale, USA) to determine the CH-3), and caffeine (IAEA-600). The enrichment of 13CBiol Fertil Soils (2021) 57:47–64 53
was reported as atom % of 13C (at%13C), which was calculat- respectively, of the different PLFA and NLFA biomarkers with-
ed with Eq. 5 for all plant, substrate, and gas samples, in the multi-standard solution and the samples.
The corrected PLFA and NLFA δ13C values were calcu-
lated to at%13C using Eq. 5. The proportion of freshly assim-
δ13C ilated C into each PLFA or NLFA sample (%CF_PLFA or
100 x AR x
1000 þ 1
at%13C ¼ ð5Þ %CF_NLFA) was calculated using a two-pool mixing model
δ13C explained in Eq. 6. To calculate the content of freshly assim-
1 þ AR x
1000 þ 1 ilated C into PLFA or NLFA biomarkers (CPLFA or CPLFA) of
each sample, the %CF_PLFA or %CF_NLFA (calculated with Eq.
where AR represents the absolute ratio of 13C:12C relative to
6) was divided by 100, and the result was multiplied by the
the Vienna PeeDee Belemnite standard (0.011182) and δ13C
total PLFA or NLFA content of the labeled sample (L) and the
is the value in calibrated ‰ (Slater et al. 2001).
total C content within each PLFA or NLFA molecule (Eq. 8),
The proportion of freshly assimilated C (%CF) in the dif-
ferent pools (plant tissues, substrates, and respired CO2) was
calculated based on a two-pool mixing model as given in Eq. %CF PLFA Mðμg PLFA FC−CÞ
CPLFA ðμg FCÞ ¼ μg PLFAL
6. Here, at%13C is the 13C enrichment in the labeled (L) or 100 Mðμg PLFA FCÞ
unlabeled (UL) treatment, or the tracer (T), respectively. ð8Þ
where 13CPLFA (μg FC) is the freshly assimilated C into PLFA
at%13CL−at%13CUL or NLFA biomarkers, M(PLFA-C) is the molar mass of the C
%CF ¼ 100 ð6Þ
at%13CT−at%13CUL in the PLFA or NLFA molecule, and M(PLFA) is the molar
mass of the PLFA or NLFA molecule. Once the freshly as-
To calculate the content of freshly assimilated C (CF) in similated C contents were obtained in each of the biomarkers
each sample (plant, substrate, gas), the %CF (calculated with for each treatment, they were grouped according to the micro-
Eq. 6) was divided by 100 and the result was multiplied by the bial group to which they belong (Table 1).
total C content of the labeled sample (L) (Eq. 7):
Leaf areas
at%13CF
CF ðmg or μgÞ ¼ CL ð7Þ The total leaf area (cm2) for each plant was measured with a
100
LI-3100C (Licor, Lincoln, NE, USA) after finishing the pulse-
All the freshly assimilated C contents (CF) were summed chase labeling experiment. Deficiency in P nutrition has been
up, and the relative allocation of fresh C to the different pools recognized as an important factor reducing the size of the leaf
(plant, substrate, gas) was calculated for each treatment. area and consequently limiting light interception and the pho-
tosynthetic capacity of leaves (Rodríguez et al. 1998).
13
C PLFA and 13C NLFA analysis
Data analysis
Phospholipids and neutral lipids were extracted, saponified to
the respective free fatty acids, and derivatized following the For both experiments, normality of the data was verified with
protocol described for experiment 1. A set of external standards the Shapiro-Wilk’s test and homogeneity of variances using
(multi-standard) consisting of 17 fatty acids belonging to differ- the Levene’s test. One-way ANOVA analysis and the Duncan
ent microbial groups (Table 1) and internal standards (Sigma- post hoc test was employed for mean separation (p < 0.05)
Aldrich, Taufkirchen, Germany) were derivatized and measured between the different P sources offered at the fungal compart-
together with the PLFA and NLFA fungal compartment sam- ment for the different variables at each time point. Data anal-
ples. The 13C enrichment and the concentration in each FAME ysis was performed using SPSS v.24 for Windows (IBM
were measured in triplicate with an Agilent 7890A GC system Corporation 2016).
(Agilent Technologies Ireland Ltd., Cork, Ireland) coupled with
an Isoprime 100 IRMS (Elementar GmbH, Hanau, Germany)
via a combustion interface and a continuous flow inlet using Results
helium (99.999% purity Linde, Germany) as gas carrier. The
area below each chromatogram peak and the δ13C values of Experiment 1
the 17 substances plus internal standards were processed with
the IonOS 2.0 software (Isoprime, Elementar GmbH, Hanau, P derived from the all three sources was incorporated into the
Germany) to calculate the concentrations and the at%13C, different AM plants, starting from day 35 and lasting until the54 Biol Fertil Soils (2021) 57:47–64
Table 1 List of analyzed fatty acid biomarkers and their associated Experiment 2
microbial group
Fatty acid Microbial groups (code) References Since AM plants with access to a P source exhibited the larg-
biomarker est P incorporation and did not show any significant differ-
ences in the amount of P incorporated from each source at day
16:1ω5c Fungal markers present in (Van Aarle and Olsson
18:1ω7c AMF (F) 2003)
84, a new set of plants was labeled on the same day for com-
18:1ω9c
paring the current costs of P acquisition from the different
sources.
18:2ω6,9
In case of respired 13CO2 derived from freshly assimilated
14:0 General bacterial marker (B) (Willers et al. 2015)
15:0 C (μg) measured in the fungal compartment (Fig. 5), the M-
17:0 control, without mycorrhiza and without P, showed a non-
18:0 constant 13CO2 respiration over the 25.5 h pulse-chase exper-
16:1ω7c Gram-negative bacteria (B−) iment. In contrast, the OP and M+ treatments exhibited an
cy19:0 increasing content of 13C (μg) in the respired CO2 8 h after
a15:0 Gram-positive bacteria (B+) the pulse labeling. The treatment containing AP exhibited sig-
a17:0 nificantly larger respired 13CO2 (μg) as compared with OP,
i15:0 M+, and M− from the ninth hour onwards. In the case of PA
i16:0 treatment, there were significant differences to the other treat-
i17:0 ments after the first 3 h of the pulse-chase experiment. The AP
20:4ω6c Protozoa and nematodes and PA treatments kept a steadily increasing trend regarding
(PN) the respired 13CO2 (μg) which lasted until the end of the
10Me16:1 Actinomycetes (A) experiment (Fig. 5). Moreover, the sum of 13CO2 respired
over 25.5 h monitored was significantly largest in case of
PA, in comparison with treatments containing OP, AP, or
end of the experiment at day 112 (Fig. 2). Control mycorrhizal M+ (Fig. 6).
plants without access to a P source (M+) did not show any P Twenty-seven hours after labeling, the largest 13C content
incorporation. No significant differences were observed in P (mg) in the leaves was found in the AM plants accessing a P
incorporation on day 35, but there were significant differences source in comparison with the M+ control. AM plants mobi-
on day 56 for AM plants accessing PA. At day 84, all AM lizing OP and PA showed the largest 13C content (mg) in
plants with access to a P source exhibited the largest P incor-
poration without a significant difference between the treat- 2.5
ments regarding P uptake, and the mineral P source yielded
greater amount than the 0.09 mg P available by the pure dis- a
P incorporated (mg/plant)
2.0
solution of AP. At day 112, the inorganic P forms OP and AP a
facilitated significantly more P for plant growth than for PA b
(Fig. 2). Furthermore, shoot and root biomass (Fig. S1) exhib- 1.5 c
ited that control plants (M+) show a tendency to increase root a ab
biomass, contrary to the shoots at days 84 and 112, compared b a
1.0 a
with the other three treatments with access to a P source.
aa
The ratio of cumulative CO2-C production (mg) to OC a
content (mg) in the fungal chamber was significantly larger 0.5
for those AM plants that had access to AP during the experi-
ment, as compared with that of OP, PA, and the M+ control
(Fig. 3). 0.0
0 35 56 84 112
Those AM plants that incorporated P from PA showed
Days
higher PLFA and NLFA 16:1ω5c to P ratios than the OP
and AP treatments at days 35 and 84 (Fig. 4a and b). At day M+ OP PA AP
112, only the PLFA 16:1ω5c to P ratio was significantly Fig. 2 Phosphorus incorporated into the arbuscular mycorrhizal plant
larger for AP and PA as compared with the OP. With incuba- along the time-course experiment (mean values ± standard error, n = 3).
tion time, at days 84 and 112, the NLFA 16:1ω5c to PLFA No P was incorporated in the M+ treatment. Within each P source, treat-
ments with significant differences are indicated by different small letters
16:1ω5c ratio increased for all AM plants mobilizing a P (p < 0.05) as analyzed by one-way ANOVA. Abbreviations are OP, or-
source in the fungal compartment in contrast to the M+ control thophosphate; AP, apatite; PA, phytic acid; M+, mycorrhizal plant with
(Fig. 4c). no PBiol Fertil Soils (2021) 57:47–64 55
1.6 b were up to an order of magnitude lower than the rest of the
Ratio: Cumulative CO2-C (mg)/
1.4 b bacterial markers. The Gram-positive (B+) and Gram-
negative (B−) PLFA biomarkers showed a minor percentage
1.2
b of 13C (< 0.3% B+; < 3.4% B−) derived from freshly assimi-
Organic C (mg)
1.0
lated C for all treatments containing a P source when com-
b
pared with the M+ treatment (7.4% B+; 8.8% B−) (Fig. 7b).
0.8 The NLFA AMF biomarkers exhibited the largest content of
a a ab 13
ab C (μg) derived from freshly assimilated C for the PA treat-
0.6 a ment followed by AP and OP in contrast to the M+ control
a
0.4 (Fig. 7c).
a
a
0.2
0.0
Discussion
0 35 56 84 112
Days We tested the ability of R. irregularis taking up P from three
different sources of different availability. To that end, we per-
OP PA AP
formed two consecutive experiments; in experiment 1, we
Fig. 3 Ratio of respired cumulative CO2-C (mg) and the accumulated investigated whether a C for P trading by the AM plants exists
organic C (mg) for the fungal compartment containing the different P
sources (mean values ± standard error, n = 3). Within each P source, at mobilization of P derived from sources with different avail-
treatments with significant differences are indicated by different small ability. In experiment 2, we explored the fate of freshly assim-
letters (p < 0.05) as analyzed by one-way ANOVA. Abbreviations are ilated C derived to nourish the AMF mobilizing the different P
OP, orthophosphate; AP, apatite; PA, phytic acid sources. We decided on the 84th day of the sampling, because
AM plants exhibited the larger P incorporation and not exhib-
leaves, followed by AM plants with access to AP in the fungal ited any significant differences in the amount of P incorporat-
compartment. Furthermore, the 13C content (mg) in the leaves ed from each source.
represented around 60% of the total freshly assimilated C in
case of AM plants mobilizing OP, which is more than for all Experiment 1
others. In addition, AM plants with access to OP exhibited
larger leaf areas and photosynthesis rates than the PA, AP, Phosphorus uptake from different accessible sources
or M+ treatments. In the shoot tissues, the largest 13C content by the arbuscular mycorrhiza symbiosis
(mg) was found in the AM plants that accessed PA in com-
parison with treatments containing OP, AP, or M+ (Fig. 6). In The P sources were exclusively mobilized by the AMF and
case of the root samples, AM plants mobilizing AP over their incorporated in different amounts into the plant tissues (Fig.
mycorrhizal partner exhibited a larger 13C content (mg) as 2). Additionally, the results of higher shoot to root biomass
compared with those mobilizing PA, OP, or M+. The 13C (Fig. S1) in those treatments mobilizing a P source are con-
content (mg) in the plant and fungal compartment substrates sistent with those ones previously discussed by Veresoglou
derived from freshly assimilated C was larger in all the AM et al. (2012), since fungal symbionts are more efficient scav-
plants that accessed a P source in comparison to the M+ con- engers for soil nutrients than plant roots; thus, root dry weight
trol (Fig. 6). allocation would be lower with mycorrhizal fungi, as they
Among the 17 studied PLFA biomarkers, only 11 were would substitute for root uptake. Hence, it is expected that
labeled with 13 C (14:0, a15:0, i15:0, 15:0, 16:1w7c, alleviation of host nutrient limitation due to inoculation by
16:1w5c, 17:0, 18:2w6, 9, 18:1w9c, 18:1w7c, 18:0). The AMF may decrease plant root-to-shoot ratio, compared with
PLFA AMF biomarker contained more than 96% of 13C de- non-mycorrhizal plants due to improved plant nutrient status
rived from freshly assimilated C within the PLFA biomarkers (Holste et al. 2016). The AM fungal extraradical mycelium
for all AM plants accessing a P source, in contrast to the M+ can directly acquire phosphate ions in the form of OP beyond
test with only 84% assimilated 13C into the AMF biomarkers the P depletion zone (Hodge 2017). Thus, our results demon-
(Fig. 7a). For the NLFA samples, only the AMF biomarker strated the suitability of the double-membrane system which
(16:1w5c) showed 13C enrichment. The 13C contents (μg) in prevented the influence of the roots on the P uptake, and
the AMF biomarkers differed between the treatments; those therefore proved the importance of R. irregularis taking up
treatments with access to PA, AP, and OP showed larger 13C P derived from the different sources.
contents (μg) compared with the M+ treatment (Fig. 7a). The The PA needs to be hydrolyzed by phytases of plant or
relative amounts of recently assimilated C in the general bio- microbial origin for its mineralization and phosphate release
markers of bacteria (B) were not plotted in Fig. 7b, as they (Baldwin et al. 2001). R. irregularis DAOM 197198 is able to56 Biol Fertil Soils (2021) 57:47–64
a c
3.2 54.7
b b a a
a
Ratio: NLFA 16:1ω5c (µg)/
Ratio: PLFA 16:1ω5c (µg)/ 18.2
P incorporated (mg/plant)
1.6 b
b
PLFA 16:1ω5c (µg)
a
0.8 6.1 a
a
b a
0.4 a 2.0
a a b b
a a
0.2 a a 0.7
a
0.1 0.2
a
0.1 a 0.1
0.0 0.0
0 35 56 84 112 0 35 56 84 112
Days Days
OP PA AP
OP PA AP
b b
41.0 a
20.5 a
Ratio: NLFA 16:1ω5c (µg)/
P incorporated (mg/plant)
10.2 a
5.1
2.6
1.3
0.6
b
0.3 a b a a
a ab
0.2 a
0.1
0.0
0 35 56 84 112
Days
OP PA AP
Fig. 4 Ratios of PLFA 16:1ω5c to P incorporated within the tomato plant (mean values ± standard error, n = 3). Within each P source and day,
(a), of NLFA16:1ω5c to P incorporated (logarithmic scale) within the treatments with significant differences are indicated by different small
tomato plant (b), and of NLFA 16:1ω5c to PLFA 16:1ω5c (logarithmic letters (p < 0.05) as analyzed by one-way ANOVA. Abbreviations are
scale) from the different P sources along the time-course experiment OP, orthophosphate; AP, apatite; and PA, phytic acid
secrete a type of acid phosphatase, which contributes to the 1967). Souchie et al. (2010) observed a greater clover growth
PA mineralization (Tisserant et al. 2012). Several studies have rates in those treatments mycorrhized with AMF and fed with
shown the ability of Rhizophagus species to hydrolyze AP, as the solely P source in comparison with the non-
organic P and transfer it through the mycelium and making a mycorrhized treatments. The AM hyphae appear to enter AP
significant contribution to plant P uptake from sources such as mineral structures, while plant roots barely can take up P from
lecithin, RNA, and PA (Koide and Kabir 2000; Sato et al. 2015). primary minerals as they are too unreactive (Koele et al.
Utilization of organic P is thus assumed to contribute to AM 2014). Burghelea et al. (2015) observed in a similar approach
plant P nutrition as inorganic P. Likewise, we did not observe as ours, that over 124 days, AM mycorrhized plant growth
significant differences between the amounts of P mobilized from was enhanced in presence of rhyolite rocks, due to an efficient
PA and OP during most of the time of the experiment. P mining. Different authors have demonstrated the ability of
We observed that the AM plant mobilizing the AP clearly AMF to mobilize P from AP, e.g., Rhizophagus fasciculatus
incorporated more P than was soluble in water, a fact that and Rhizophagus tenuis (Powell and Daniel 1978),
points out to an active biological weathering. It is widely Rhizophagus manihotis (Ness and Vlek 2000), Rhizophagus
accepted that AM plants can access the P contained in the clarum (Alloush and Clark 2001), and Gigaspora margarita
AP by joint action of roots and hyphae (Murdoch et al. (Ramirez et al. 2009), and Koele et al. (2014) found mineralBiol Fertil Soils (2021) 57:47–64 57
Fig. 5 Cumulative CO2 7 8 h night period
Respired CO2 derived from freshly
respiration from the fungal (1:00 AM- 9:00 AM)
compartment (μg) derived from 6
the freshly assimilated C after the
13
C pulse labeling. Mean values 5
assimilated C (µg)
and standard errors of the respired
CO2 (μg) of three independent b b b
mesocosms at different time 4 b b
points for each treatment. Within
each P source, treatments with 3 b
significant differences are indi- ab ab
ab ab
cated by different small letters 2
(p < 0.05) as analyzed by one- a a a a
way ANOVA. Abbreviations are a a
1 a
OP, orthophosphate; AP, apatite;
PA, phytic acid; M+, mycorrhizal
0
plant with no P; M−, non-
mycorrhizal plant
OP PA AP M+ M-
weathering “tunnels” under both arbuscular and saprotrophic fungi, and bacteria. Two recent papers have also
ectomycorrhizal associations coupled to P uptake from AP. investigated the abilities of R. irregularis in phosphate mobi-
They pointed out to the rhizosphere acidification as one likely lization from AP (Taktek et al. 2017; Pel et al. 2018). Both
mechanism for the AP weathering by soil mycorrhizal fungi, publications showed the AMF utilizing poorly soluble AP to
Leaf area (LA) (cm2) Freshly assimilated Carbon (mg and % of the total)
M+ OP M+ OP PA AP
LA (a) LA (c)
LEAF (a) LEAF (b) LEAF (b) LEAF (ab)
211 +/- 58.3 474.7 +/- 27.8
2.31 +/- 1.04 5.84 +/- 1.46 6.08 +/- 2.37 3.78 +/- 1.58
(49.6%) (59.2%) (48.2%) (43%)
PA AP
SHOOT (a) SHOOT (ab) SHOOT (c) SHOOT (b)
LA (ab) LA (bc) 2.05 +/- 0.26 3.46 +/- 1.44 5.98 +/- 0.92 4.08 +/- 0.56
376 +/- 176.7 261.8 +/- 59.8 (44.2%) (35.2%) (47.4%) (46.4%)
ROOT (a) ROOT (a) ROOT (a) ROOT (b)
Photosynthetic capacity 0.27 +/- 0.09 0.43 +/- 0.17 0.45 +/- 0.08 0.84 +/- 0.25
(PHOTO) (µmol CO2 m 2 sec 1) (5.8%) (4.4%) (3.6%) (9.6%)
M+ OP M+ OP
Pc (a) Pc (b) Pc (b) Pc (b)
PA AP 0.014+/-0.009 0.09 +/- 0.05 0.08 +/- 0.02 0.07 +/- 0.01
PHOTO (a) PHOTO (c)
(0.3%) (1%) (0.6%) (0.8%)
2.7 +/- 0.9 4.9 +/- 0.5
Fc (a) Fc (b) Fc (b) Fc (b)
PA AP 0.000+/-0.000 0.005+/-0.001 0.009+/-0.005 0.005+/-0.003
(0%) (0.05%) (0.07%) (0.06%)
PHOTO (ab) PHOTO (bc)
3.5 +/- 0.5 4.3 +/- 0.2 Sum CO2 (a) Sum CO2 (a) Sum CO2 (b) Sum CO2 (a)
0.003+/-0.002 0.003+/-0.001 0.02 +/- 0.016 0.01+/-0.003
(0.06%) (0.03%) (0.2%) (0.1%)
Fig. 6 Scheme containing the results of parameters measured before labeling is shown on the right side. In bold letters inside each colored cell,
(photosynthetic capacity), during (freshly assimilated C), and after (leaf the mean value and the standard error is shown (n = 3) for each parameter.
area) the 13C pulse labeling experiment of the different mesocosms. The Between brackets, the mean percentage of freshly assimilated C into the
photosynthetic capacity of the plants that accessed the different P sources plant organs, the fungal and plant compartments (Pc), and the cumulative
immediately before the 13C pulse labeling is shown on the lower left side, CO2 respiration is shown. Within each P source, treatments with signif-
the leaf area for the different treatments is shown on the upper left side, icant differences are indicated by different small letters (p < 0.05) as an-
and the freshly assimilated C at the different plant organs, fungal alyzed by one-way ANOVA. Abbreviations are OP, orthophosphate; AP,
compartment (Fc), and the cumulative CO2 respiration from the fungal apatite; PA, phytic acid; M+, mycorrhizal plant without P
compartment for the different treatments 24 h after the 13C pulse-chase58 Biol Fertil Soils (2021) 57:47–64
A B B B
a 83.7% 96.2% 99.1% 99.6% c
a ab b ab
1.0 0.30
a a b ab
Freshly assimilated C (µg) into AMF
Freshly assimilated C (µg) into AMF
0.9
0.25
0.8
0.7
NLFA biomarkers
PLFA biomarkers
0.20
0.6
0.5 0.15
0.4
0.10
0.3
0.2
0.05
0.1
0.0 0.00
P AMF_M+ OP PA AP N AMF_M+ OP PA AP
Mean Minimum/Maximum Mean Minimum/Maximum
A AB B B
b 8.8% 3.4% 0.7% 0.3%
0.008 a a a a
0.007
Freshly assimilated C (µg) into
bacterial PLFA biomarkers
0.006
A A A A
0.005
7.4% 0.3% 0.2% 0.1%
0.004 a a a a
0.003
0.002
0.001
0.000
B+_M+ OP PA AP B-_M+ OP PA AP
Mean Minimum/Maximum
Fig. 7 Set of graphics displaying recently assimilated C results within compartments for the different P sources (mean values ± standard error,
different fractions of the microbial populations. (a) Box-plot showing the n = 3). Within each P source on top of each box-plot significant differ-
freshly assimilated C (μg) into AMF PLFA biomarkers within the fungal ences between the content of freshly assimilated C (μg) into PLFA or
compartment for the different P sources (mean values ± standard error, NLFA biomarkers are shown with different small letters, as result of a
n = 3). (b) Box-plot showing the freshly assimilated C (μg) into bacterial one-way ANOVA (p < 0.05). Treatments with significant differences be-
PLFA biomarkers within the fungal compartment for the different phos- tween the percentages of freshly assimilated C into PLFA or NLFA
phorus sources (mean values ± standard error, n = 3). On the right side, biomarkers are indicated by different capital letters (p < 0.05) as analyzed
the B+ stands for Gram-positive PLFA bacterial biomarker, and on the by one-way ANOVA. Abbreviations are OP, orthophosphate; AP, apa-
right side, B− for Gram-negative bacteria. (c) Box-plot showing the fresh- tite; PA, phytic acid; M+, mycorrhizal plant with no P
ly assimilated C (μg) into AMF NLFA biomarkers in the fungalBiol Fertil Soils (2021) 57:47–64 59
deliver phosphate to host plants. Compared with the study of for AMF being associated to the different mobilization strate-
Taktek et al. (2017), we used a complete plant and not a gies. According to Jansa et al. (2011), long-lived hyphae
transformed root culture. We also found another significant represent an advantage in mobilizing hardly accessible P
difference with the investigation of Pel et al. (2018). sources like AP or PA, once approached. Contrasting to this,
Contrastingly to our experimental design, they did not spatial- they hypothesized short-lived hyphae in case of OP exploita-
ly separate the AP from the roots. Thus, our mesocosms of- tion in soil, as here a quick exploration of larger soil volumes
fered an advantageous design, where exclusively the hyphae is key, and the process of scavenging OP from soil solution
of R. irregularis were able to mobilize the phosphate from OP, itself does not require comparable amounts of energy. Hence,
PA, and the AP. our results may support the hypothesis of Jansa et al. (2011),
meaning that even when the P source is reached by the AMF,
Metabolic activity and development of R. irregularis it still is growing to assist the mobilization of less accessible
under variable P sources sources, on which mineralization and/or weathering processes
will take place. Finally, the NLFA 16:1ω5c to PLFA
We used the respired CO2-C to OC ratio, as a proxy for the 16:1ω5c ratio (Fig. 4c), an indicator of the preferential C
metabolic activity in the fungal compartment. The mesocosm allocation into lipid storage (Bååth 2003), suggests that AM
design guaranteed that all C measured in the fungal compart- plants mobilizing OP and AP required less energy storage,
ment was exclusively carried by the AMF. The sources of compared with those plants mobilizing PA at day 84. The
respired CO 2 in the fungal compartment include AM plants mobilizing PA exhibited a larger investment into
R. irregularis autotrophic respiration, plus the heterotrophic AMF mycelium and metabolism in contrast to the ones mo-
one derived from the associated microbiota and dead hyphae/ bilizing AP that showed a smaller investment into the AMF
bacteria. The CO2-C to OC ratio was significantly higher for infrastructure but significantly higher metabolism. Our exper-
treatments containing PA and AP than OP until day 84 (Fig. iment revealed different P acquisition strategies that resulted
3), indicating a higher metabolic activity of AMF, in order to in different C costs for the AM plant. This is in accordance
mobilize P from the least available sources. Thus, in our one- with the hypothesis proposed by Turner (2008), in which the
one system, the AMF seems to adjust its energy requirements acquisition of the different P compounds are classified by the
precisely to the accessibility of the P sources. These results energy investment that must be made to access the phosphate
correspond to those already obtained in our previous study, ions. Thus, under our experimental conditions, where AM
where the less accessible P sources associated to iron oxides plants took up P exclusively via the mycorrhizal pathway,
exhibited the highest metabolic activities (Andrino et al. we can deduce different trading costs of C for P, depending
2019). Hence, it can be inferred that treatments containing less on the P source.
accessible P sources exhibited higher C investments in auto-
trophic and heterotrophic metabolic processes during P incor- Experiment 2
poration in the AM plant.
In addition to the metabolic activity, we used the ratios To evaluate the current C-P trading costs made by the AM
PLFA and NLFA 16:1ω5c to the total plant P uptake as indi- plants mobilizing the different P sources, another set of 84-
cators of energy investment into infrastructure and energy day-old plants were labeled with 13CO2, since no significant
storage per P incorporated, respectively (Fig. 4a and b). The differences were observed during experiment 1 regarding the
PLFA 16:1ω5c to P and NLFA 16:1ω5c to P ratios showed amount of P incorporated at day 84. The selected time point
higher values in those treatments mobilizing P from PA and offered us a unique opportunity to compare whether the dif-
AP, compared with OP. One likely justification to increase the ferent acquisition strategies described in experiment 1 entailed
fungal infrastructure in the presence of P forms like PA and different energy investments to mobilize the P by tracing the
AP is the need to develop more extraradical hyphae to mobi- pathways of the recent plant assimilates along the trophic
lize and transport P more efficiently to the host plant, as AMF chain of AMF and adjacent microbiota.
tend to develop more extensively under low-nutrient condi-
tions (Bryla and Eissenstat 2005). At low P availability, Raven Photosynthetic rates and leaf areas
(2018) hypothesized a greater C investment on AMF myceli-
um would be needed to support an increased construction and We measured the photosynthetic activity of each AM plant
maintenance costs of the mycelium, as is likely the case in the 1 day before the 13CO2 pulse labeling. All AM plants mobi-
PA and AP treatments, which need to be mineralized or lizing a P source showed significantly higher photosynthetic
weathered, respectively, before P uptake. Jansa et al. (2011) rates than the M+ control. Additionally, the AM plants mobi-
hypothesized on the existence of different mechanisms for P lizing OP exhibited the largest photosynthetic rates. As for the
mobilization by AMF: scavenging of OP, solubilizing AP, photosynthesis rates, also the foliar areas were greater in the
and hydrolyzing PA. They assumed different turnover rates AM plants mobilizing a P source, and plants mobilizing OP60 Biol Fertil Soils (2021) 57:47–64
showed the greatest foliar areas (Fig. 6). At least three other The 13C contents in the leaves, shoots, roots, and substrates
studies have reported similar results to ours (Parádi et al. 2003; from plant and fungal compartments were significantly larger
Wu and Xia 2006; Birhane et al. 2012), where AM plants with for treatments mobilizing OP, PA, and AP than those for the
bigger leaf areas also showed a higher photosynthetic CO2 M+ treatment. This fits to the report of Johnson (2010) that
fixation. They attributed to a larger total P content in plant AM plants might partition more C belowground under P-
tissues as the main cause for the enhanced photosynthetic limiting conditions to develop the capacity for soil P extrac-
function, coupled to an enhanced C fixation derived into the tion. The model of Johnson (2010) predicts a mutualistic out-
AMF, in comparison with non-AM plants. Thus, our results come of AM symbioses, depending on the stoichiometry of
point towards AM plants mobilizing P from the different available N and P. There will be mutualistic benefits at no N
sources and increased their photosynthetic activity and leaf limitation and low P availability because a non-limited N sup-
area sizes, to keep a larger photosynthate transfer into the ply tends to increase the photosynthetic capacity of the host
AMF. plant. In our experimental design, the N was not limited since
it was applied in the nutrient solution weekly. Our results
Freshly assimilated C measured in the respired CO2 corroborate Johnson’s postulates, since all AM plants that
and the plant tissues mobilized and incorporated a P source exhibited larger photo-
synthetic capacity, foliar areas, and 13C contents in all the
We used the respired CO2 at the fungal compartment as a plant tissue compartments compared with that of the M+ treat-
proxy for the current metabolic activity in the fungal compart- ment (Fig. 6), to supply more C to the AMF for mining the P
ment, as AMF receive the recently fixed photosynthates from sources of lower availability.
their host plants, using it for their growth, respiration, and
biological maintenance (Jansa et al. 2011). In nutrient- Freshly assimilated C incorporated into different microbial
deficient soils, the AMF extraradical mycelium can account communities
as a major source of CO2 efflux, thus becoming an important
pathway of C flux from host plants to the atmosphere (Tomè We traced the fate of the freshly assimilated C into the microbial
et al. 2016). We focused our efforts on accurately registering communities of the fungal compartments by fatty acid bio-
the first respiration hours in the fungal compartment, as markers (Fig. 7. Our results revealed that treatments with P ap-
Grimoldi et al. (2006), Moyano et al. (2007), and Bahn et al. plication frequently showed the largest 13C content in the AMF
(2009) demonstrated that AM mycelia may provide a rapid hyphae along with the significantly lowest 13C values in the
and important pathway of C flux from plants to the soil and bacterial biomarkers. Only a fraction was delivered to AMF ac-
atmosphere, providing evidence of direct respiratory losses by companying microbiota, since we inoculated the tomato plants
AMF. Johnson et al. (2002) also highlighted the value of thor- with the strain of R. irregularis DOAM 197198 not grown in a
ough surveys to track short-term C transfer dynamics of AM monoxenic culture, thus carrying the microorganisms naturally
plants to soil, as many studies perform pulse labeling trials associated with its hyphosphere. Zhang et al. (2016) pointed out
with relatively long fixation periods or have collected samples that the AMF interactions with specific bacteria depend upon
many hours after the end of labeling and consequently may background P availability. The AMF may act as a rapid hub
have overlooked the maximum C yields from roots to AMF. for recent photosynthates providing important niches to
Unlike experiment 1, in experiment 2, the short observation hyphae-associated soil bacterial communities which are general-
time implies that only autotrophic respiration was determined ly composed of specific assemblages of species that differ from
at the fungal compartment. However, as we observed in ex- those in the bulk soil (Kaiser et al. 2015). The hyphae of AMF
periment 1 (Fig. 3), the results of experiment 2 also exhibited may provide an increased area for interactions with other soil
higher metabolic rates in those AM plants mobilizing PA and microorganisms, especially bacteria, which may in turn synergis-
AP than taking up OP (Fig. 5). In line with Bahn et al. (2009), tically interact with AMF and thereby promote plant growth
we detected that the new photoassimilates were transported (Taktek et al. 2015). Among the most effective bacterial phos-
and respired belowground within the first 3 h after the pulse phate solubilizers are species of the B+ genera Streptomyces,
labeling started, for the AM plants mobilizing PA. And similar Kocuria, Arthrobacter, Nocardiodes, Microbacterium, Bacillus,
to our results, Johnson et al. (2002) showed that the release of and the B− genera Pseudomonas, Enterobacter, Burkholderia,
13
CO2 from AMF peaked 9–14 h after labeling and during the Serratia, Citrobacter, Xanthomonas, Rhizobium, Azospirillum,
first 21 h. Most of the C lost by the plants was respired by the and Klebsiella (Battini et al. 2016; Osorio et al. 2017). The
AMF and mostly declined after the first 24 h. At the end of the mechanisms to access the more stable P forms include phospha-
respiration monitoring in the fungal compartment, AM plants tase synthesis (e.g., acid phosphatase, phytase), soil pH lowering,
mobilizing P from the PA showed the significantly largest and/or ligand exchange reactions mediated by low molecular
cumulative 13CO2 (Fig. 6, pointing to a greater C investment weight organic acids (Osorio et al. 2017). Although not signifi-
to mobilize as for the other treatments. cantly different from the M+ control, treatments with PA and APYou can also read