Transformation and ageing of biomass burning carbonaceous aerosol over tropical South America from aircraft in situ measurements during SAMBBA
←
→
Page content transcription
If your browser does not render page correctly, please read the page content below
Atmos. Chem. Phys., 20, 5309–5326, 2020
https://doi.org/10.5194/acp-20-5309-2020
© Author(s) 2020. This work is distributed under
the Creative Commons Attribution 4.0 License.

Transformation and ageing of biomass burning carbonaceous
aerosol over tropical South America from aircraft in situ
measurements during SAMBBA
William T. Morgan1 , James D. Allan1,2 , Stéphane Bauguitte3 , Eoghan Darbyshire1 , Michael J. Flynn1 , James Lee4 ,
Dantong Liu1 , Ben Johnson5 , Jim Haywood5,6 , Karla M. Longo7,a , Paulo E. Artaxo8 , and Hugh Coe1
1 Department   of Earth & Environmental Sciences, University of Manchester, Manchester, UK
2 National  Centre for Atmospheric Science, University of Manchester, Manchester, UK
3 Facility for Airborne Atmospheric Measurements, Cranfield University, Cranfield, UK
4 Department of Chemistry, University of York, York, UK
5 Met Office, Exeter, UK
6 College of Engineering, Mathematics and Physical Sciences, University of Exeter, Exeter, UK
7 National Institute for Space Research (INPE), São José dos Campos, Brazil
8 Physics Institute, University of São Paulo, São Paulo, Brazil
a now at: NASA Goddard Space Flight Center and USRA/GESTAR, Greenbelt, MD, USA

Correspondence: Hugh Coe (hugh.coe@manchester.ac.uk)

Received: 14 February 2019 – Discussion started: 28 February 2019
Revised: 10 March 2020 – Accepted: 15 March 2020 – Published: 6 May 2020

Abstract. We present a range of airborne in situ observa-         production with atmospheric ageing. We observe ratios of
tions of biomass burning carbonaceous aerosol over tropi-         0.075–0.13 µg sm−3 ppbv−1 in the west of our study region
cal South America, including a case study of a large tropical     over the Amazon tropical forest in air masses less influenced
forest wildfire and a series of regional survey flights across    by precipitation and a value of 0.095 µg sm−3 ppbv−1 over
the Brazilian Amazon and Cerrado. The study forms part of         the Cerrado environment in the east (where sm−3 refers to
the South American Biomass Burning Analysis (SAMBBA)              standard metre cubed). Such values are consistent with emis-
project, which was conducted during September and October         sion factors used by numerical models to represent biomass
2012. We find limited evidence for net increases in aerosol       burning OA emissions. Black carbon particle core sizes typ-
mass through atmospheric ageing combined with substantial         ically range from mean mass diameters of 250 to 290 nm,
changes in the chemical properties of organic aerosol (OA).       while coating thicknesses range from 40 to 110 nm in air
Oxidation of the OA increases significantly and rapidly on        masses less influenced by precipitation. The primary driver
the scale of 2.5–3 h based on our case study analysis and is      of the variability we observe appears to be related to changes
consistent with secondary organic aerosol production. The         at the initial fire source. A key lesson from our study is that
observations of limited net enhancement in OA coupled with        simply aggregating our observations as a function of atmo-
such changes in chemical composition imply that evapora-          spheric ageing would have been misleading due to the com-
tion of OA is also occurring to balance these changes. We ob-     plex nature of the regional aerosol and its drivers, due to the
serve significant coatings on black carbon particles at source,   many conflating and competing factors that are present.
but with limited changes with ageing in both particle core           Our study explores and quantifies key uncertainties in the
size and coating thickness.                                       evolution of biomass burning aerosol at both near-field and
   We quantify variability in the ratio of OA to carbon           regional scales. Our results suggest that the initial conditions
monoxide across our study as a key parameter representing         of the fire are the primary driver of carbonaceous aerosol
both initial fire conditions and an indicator of net aerosol      physical and chemical properties over tropical South Amer-

Published by Copernicus Publications on behalf of the European Geosciences Union.
5310                                           W. T. Morgan et al.: Transformation and ageing of biomass burning aerosol

ica, aside from significant oxidation of OA during atmo-          global models (Reid et al., 2005; Shrivastava et al., 2017).
spheric ageing. Such findings imply that uncertainties in the     Reid et al. (2005) reviewed a large body of work, includ-
magnitude of the aerosol burden and its impact on weather,        ing the chemistry of fresh smoke and particle evolution, with
climate, health and natural ecosystems most likely lie in         large variability in terms of composition and the timescale
quantifying emission sources, alongside atmospheric disper-       of growth rates and the complexity of the “photochemical
sion, transport and removal rather than chemical enhance-         soup” that embodies aged smoke plumes. Furthermore, they
ments in mass.                                                    note the difficulty in comparing regional smoke with individ-
                                                                  ual fires, as the former is subject to a vast array of complex
                                                                  drivers, while the latter is often relatively better constrained
                                                                  in terms of their specific burn characteristics and evolution.
1   Introduction                                                  Many such studies have used carbon monoxide as a largely
                                                                  inert chemical tracer on the scale of anticipated changes in
Biomass burning represents a significant source of aerosol        biomass burning emissions through ageing and then com-
particles on the global scale and thus has a substantial im-      pared this with OA mass concentrations downwind to investi-
pact on the Earth system. At the regional level, where large-     gate any net changes. Previous airborne studies have reported
scale and seasonal burning practices are conducted annu-          both an increase in OA mass (DeCarlo et al., 2008; Yokelson
ally, significant anthropogenic perturbations may occur. The      et al., 2009) and a decrease (Hobbs, 2003; Akagi et al., 2012;
Brazilian Amazon rainforest and Cerrado are such regions,         Jolleys et al., 2012), with the majority of studies reporting
where an annual burning season typically running from Au-         no detectable net addition of OA mass (Capes et al., 2008;
gust to October results in the build-up of a large atmospheric    Cubison et al., 2011; Hecobian et al., 2011; Forrister et al.,
aerosol burden that can affect climate (e.g. Andreae, 2004),      2015; Jolleys et al., 2015; May et al., 2015; Liu et al., 2016).
weather (e.g. Kolusu et al., 2015), human health (e.g. Red-       Ground-based studies have also reported conflicting results,
dington et al., 2015) and the regional ecosystem (e.g. Crutzen    with Lee et al. (2008) reporting enhancements in plumes
and Andreae, 1990; Pacifico et al., 2015). The co-emission        from two prescribed fires in the US, Zhou et al. (2017) report-
of large amounts of both gas- and particle-phase pollutants       ing no net enhancement for wildfire emissions in the US and
from biomass burning complicates assessments of its impact        while southern African biomass burning plumes have shown
as they undergo physical and chemical processes downwind.         net enhancements with ageing (Vakkari et al., 2014, 2018).
   Biomass burning is the largest source of black carbon          One consistent trend within such studies is the increasing ox-
(BC) particles when considering the global scale (Bond et al.,    idation of the organic aerosol with atmospheric ageing (Shri-
2013). One of the key complicating factors in relation to BC      vastava et al., 2017, and references therein). Such observa-
is the co-emission and subsequent mixing with other chemi-        tions imply that SOA is being produced, and a number of
cal components (e.g. Bond et al., 2013); aerosol components       studies (e.g. Capes et al., 2008; Cubison et al., 2011; Jol-
that predominantly scatter solar radiation can increase the ab-   leys et al., 2012, 2015; May et al., 2015; Zhou et al., 2017)
sorption by BC (e.g. Bond et al., 2006), with the mixing state    have hypothesised that this is frequently balanced by the di-
of the particles being vital (Liu et al., 2017). Furthermore,     lution and evaporation of POA mass to explain the limited
the relative abundance of BC compared to other (scattering)       net changes observed in the field. Furthermore, in studies
components in the aerosol will strongly govern the radiative      where net enhancements are observed, the magnitude of the
impact from a specific emission source (Haywood and Shine,        enhancements are smaller than those observed in urban or
1995). Koren et al. (2004, 2008) illustrated that absorption by   biogenic emissions (Shrivastava et al., 2017).
biomass burning smoke over the Amazon can inhibit cloud              The goal of this paper is to characterise the transforma-
formation or even induce so-called cloud “burn-off”. Dar-         tion and ageing of biomass burning aerosol over the Ama-
byshire et al. (2019) presented average vertical profiles of      zon basin, with a focus on the carbonaceous component.
BC coating thickness across Brazil, with significantly thin-      The experimental study was conducted during the airborne
ner coatings in the east than the west of the Amazon basin.       component of the South American Biomass Burning Analy-
   As well as BC, biomass burning produces abundant emis-         sis (SAMBBA) during September/October 2012. SAMBBA
sions of organic carbon species in the gas and particle phase     aimed to investigate the impact of biomass burning in the re-
(e.g. van der Werf et al., 2017). As well as direct emissions     gion on the Earth system and on human health. SAMBBA
of primary organic aerosol (POA), biomass burning pro-            represented the first airborne deployment of an aerosol mass
duces significant emissions of semi-volatile or intermediate-     spectrometer and single-particle soot photometer in Brazil,
volatility non-methane organic carbon species that may po-        providing previously unobtainable characterisation of non-
tentially play a role in secondary organic aerosol (SOA) for-     refractory aerosol species and BC-containing particles and
mation (Yokelson et al., 2013b; Stockwell et al., 2015; Shri-     their microphysical properties with high time resolution and
vastava et al., 2017). A number of field studies have at-         sensitivity. Such measurements allow us to investigate the
tempted to quantify changes in organic aerosol (OA) produc-       composition of OA and mixing state of BC as a function
tion downwind of fire sources, which is a key parameter for       of atmospheric ageing for a case study analysis of a large

Atmos. Chem. Phys., 20, 5309–5326, 2020                                            www.atmos-chem-phys.net/20/5309/2020/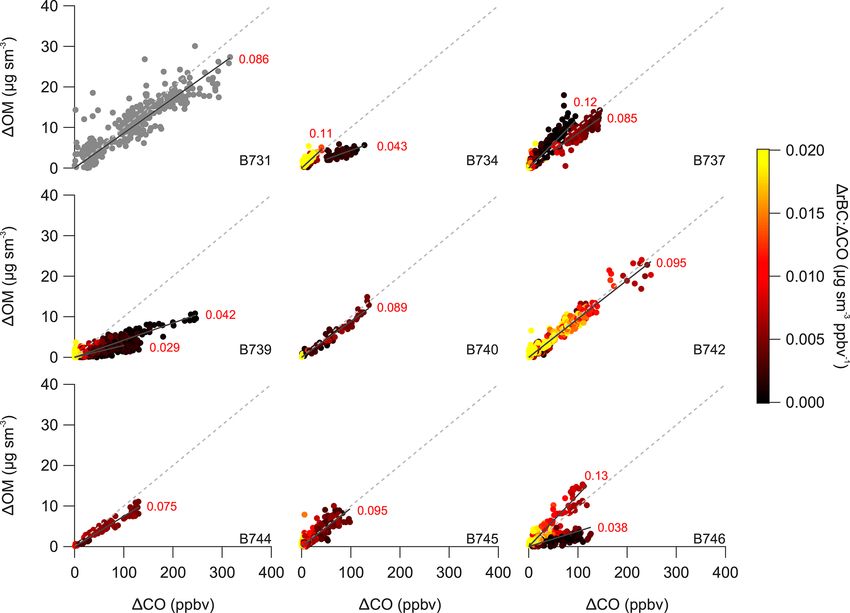
W. T. Morgan et al.: Transformation and ageing of biomass burning aerosol                                                  5311

fire plume as well as regional-scale measurements across the      Acheson Graphite, manufactured by Acheson Inc., USA) to
Amazon basin. The analysis presented here serves as the           calculate BC mass using a scaling factor of 0.75 (Baumgard-
bridge between near-source fire emissions characterised by        ner et al., 2012) to account for differences between the ref-
Hodgson et al. (2018) and a regional-scale synthesis by Dar-      erence BC standard and ambient BC. As in previous stud-
byshire et al. (2019). Compared to previous and subsequent        ies, we assume a 30 % uncertainty in the SP2 BC mass (e.g.
biomass burning seasons, 2012 was a relatively normal year        McMeeking et al., 2010, 2012). Following the method pre-
when compared to the past decade (Darbyshire et al., 2019),       sented by Liu et al. (2014) and Taylor et al. (2015) a rBC
which has seen reduced deforestation compared to the his-         spherical equivalent core diameter, Dc , is derived and related
torical record, albeit with less significant reductions in fire   to the particle diameter, Dp , which represents both the rBC
count (e.g. Aragão et al., 2018). As such, the observations       core and its associated coating. By assuming a full concentric
presented here provide a characterisation of biomass burning      encapsulation of the spherical core, the coating thickness of
aerosol under relatively typical conditions.                      single rBC particles is estimated using a core refractive index
                                                                  of 2.26 + 1.26i and coating refractive index of 1.50 + 0i.
                                                                     An Aerodyne Research Inc. (ARI, Billerica, MA, USA)
2     Method                                                      compact time-of-flight aerosol mass spectrometer (AMS,
                                                                  Drewnick et al., 2005; Canagaratna et al., 2007) measured
2.1    Instrumentation                                            non-refractory OA and inorganic component mass (sulfate,
                                                                  nitrate, chloride and ammonium). In terms of OA, the AMS
All measurements presented here were conducted on the UK          measures all non-refractory organic matter (OM) rather than
Facility for Airborne Atmospheric Measurement (FAAM)              just organic carbon (OC), and we thus refer to OM when dis-
British Aerospace 146 (BAe-146) atmospheric research air-         cussing the AMS data specifically while using OA when re-
craft. As a whole, SAMBBA (SAMBBA, 2014) was com-                 ferring to the organic component more broadly. Details on
posed of 18 science flights conducted between 14 Septem-          the instrument setup on the FAAM research aircraft and cali-
ber and 3 October 2012. For the purposes of our regional          bration protocols have been detailed elsewhere (Crosier et al.,
analysis, we investigate nine of these flights, which focussed    2007; Morgan et al., 2009, 2010). Measured mass concen-
on boundary layer sampling of the regional biomass burning        trations are subject to an uncertainty of approximately 30 %
haze (see Darbyshire et al., 2019, for a broader discussion       (Bahreini et al., 2009). In addition to the standard operating
and context for SAMBBA). The flights and their operating          procedure of the AMS, we collected data at 1 s time resolu-
regions are summarised in Table 1. The primary base of op-        tion during discrete fire plume sampling by employing the
erations was Porto Velho in Rondônia state.                       fast mass spectrum mode of the instrument (Kimmel et al.,
   The aerosol instrumentation used in this study sampled via     2011).
Rosemount inlets (Foltescu et al., 1995). These inlets have          Additional information regarding quality assurance proce-
been shown to be satisfactory for sub-micrometre aerosol          dures for the SP2 and AMS during SAMBBA can be found
measurements (Trembath et al., 2012), which is typical of the     in Hodgson et al. (2018).
SAMBBA dataset as a whole based on size distribution mea-            Carbon monoxide mixing ratios were measured using a
surements. Nafion driers were used to dry the aerosol sample,     vacuum ultraviolet (VUV) fast fluorescence CO analyser,
which in combination with ram heating as the sampled air en-      with measurement uncertainties of approximately 2 % (Hop-
ters the aircraft and decelerates, reduced the measured sam-      kins et al., 2006; O’Shea et al., 2013).
ple relative humidity to a range from 20 % to 60 %. Losses
associated with the Nafion driers represent an additional un-     2.2   Background concentration calculations
certainty in our measurements, which we do not account for.
All concentrations are reported at standard temperature and       Excess mixing ratios and concentrations of individual
pressure (STP, 273.15 K and 1013.25 hPa respectively) and         species x, denoted as 1x, are necessary in order to inves-
are denoted with an “s” in their unit where appropriate; for      tigate chemically driven changes as well as other processes
example sm−3 refers to standard metre cubed.                      such as dilution and wet removal. For the following regional-
   A Droplet Measurement Technologies (DMT, Boulder,              scale analysis, we use the fifth percentile for each species
CO, USA) single-particle soot photometer (SP2, Stephens           during a straight-and-level run (SLR) as the ambient back-
et al., 2003) measured BC physical properties during this         ground values of species x to determine 1x. For the case
study. The SP2 measures what is generally referred to as re-      study analysis, we identified the smoke plumes manually
fractory BC or rBC, as defined by Petzold et al. (2013). De-      based on the time series of CO, OM and rBC and then deter-
tails of the instrument setup on the FAAM research aircraft       mined the ambient background values while sampling out-
and data processing relevant to this study have been detailed     side the smoke plumes for each cross-plume SLR using the
elsewhere (Liu et al., 2010; McMeeking et al., 2010). The         same method as the regional-scale analysis. Tropospheric
incandescence signal of the instrument was calibrated us-         mixing can lead to changes in the background air composi-
ing Aquadag BC particle standards (Aqueous Deflocculated          tion, which can lead to uncertainties in the determination of

www.atmos-chem-phys.net/20/5309/2020/                                              Atmos. Chem. Phys., 20, 5309–5326, 2020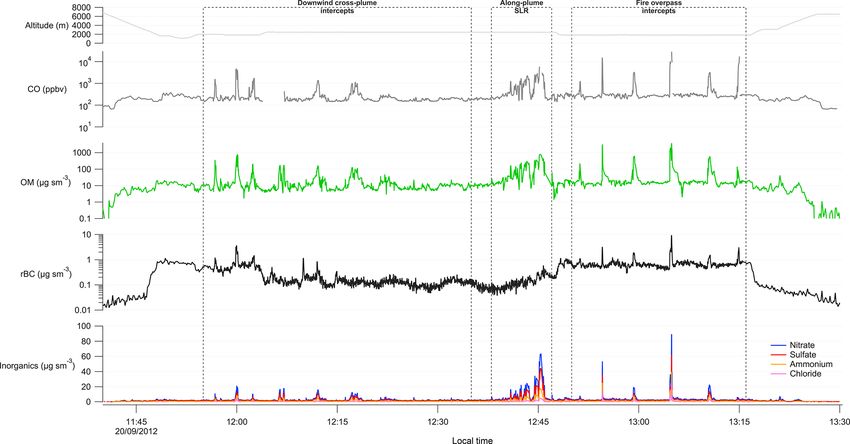
5312 W. T. Morgan et al.: Transformation and ageing of biomass burning aerosol
Table 1. Flight summary of the operations included in this study. All flights were conducted during 2012. Local time (LT) is UTC−4.
Take-off and land times include airport used: PVH – Porto Velho; PMW – Palmas. The phases correspond to the synoptic meteorological
conditions during the study, where relatively dry conditions were prevalent in Phase 1 (P1), before the period when the monsoonal transition
was being established in Phase 2 (P2).
Flight Date Take-off (LT) Land (LT) Phase Operating region
B731 14 Sep 10:00 (PVH) 14:35 (PVH) P1 Rondônia
B734 18 Sep 08:00 (PVH) 12:15 (PVH) P1 Rondônia
B737 20 Sep 10:45 (PVH) 14:45 (PVH) P1 Rondônia
B739 23 Sep 08:00 (PVH) 12:00 (PVH) P2 Rondônia
B740 25 Sep 07:45 (PVH) 11:00 (PVH) P2 Rondônia
B742 27 Sep 09:00 (PMW) 12:30 (PMW) P2 Tocantins
B744 28 Sep 09:00 (PVH) 12:30 (PVH) P2 Rondônia
B745 28 Sep 14:00 (PVH) 17:30 (PVH) P2 Rondônia
B746 29 Sep 09:00 (PVH) 13:00 (PVH) P2 Rondônia/Mato Grosso
1x (Yokelson et al., 2013a); our sampling and method aims
to mitigate for such changes as our SLRs are relatively short
(10–30 min) and within the atmospheric boundary layer, typ-
ically sampling a fairly homogenous haze burden over a sin-
gle SLR or flight. This limits large changes in mixing plus
we manually inspect our time series and background values
to identify clear shifts due to changing air masses, e.g. large-
scale spatial gradients (B734) or wet scavenging (B739), and
recalculate background values over shorter flight segments
if necessary. For the case study analysis, our measurements
are very close to source, and we observed constant back-
ground concentrations throughout our plume intercepts. As
a result, we expect uncertainties in the determination of 1x
to be small.
3 Tropical forest fire case study
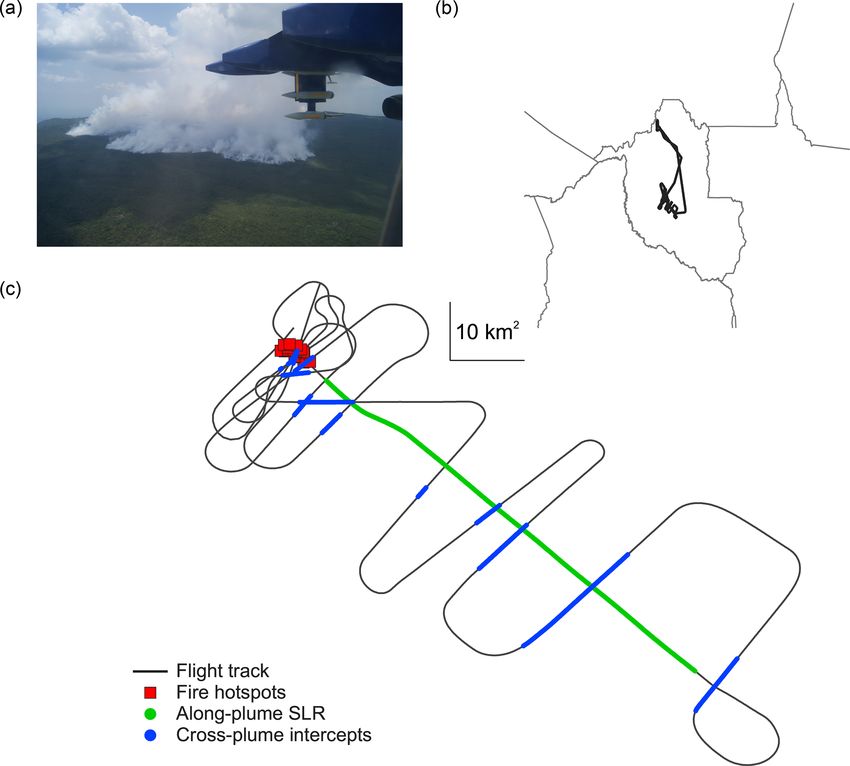
The following section presents a case study of a tropical Figure 1. Spatial overview of case study analysis for flight B737.
forest fire sampled on flight B737 on 20 September 2012 (a) Photograph taken from the aircraft of the fire, courtesy of
in Rondônia state. Take-off was at 14:45 UTC (10:45 local William T. Morgan. (b) Flight track of B737 in relation to the wider
study region. (c) Low-level flight track of the case study, indicating
time), lasting 3 h 45 min. The state is characterised by trop-
both cross-plume intercepts and the along-plume straight-and-level
ical moist broadleaf forest, as well as extensive deforesta-
run (SLR). Also shown are Moderate Resolution Imaging Spectro-
tion. A large smouldering tropical forest fire was sampled radiometer (MODIS) hotspot data from the Terra overpass coinci-
and is shown in Fig. 1 alongside the flight track of the air- dent with our flight sampling. The 10 km2 box represents the scale
craft during the low-level sampling of the fire and smoke for the flight track.
plume. Hodgson et al. (2018) reported near-source measure-
ments of the fire, concluding that the fire was likely natural
in origin as it was located well away from deforestation areas
and was in a national park many kilometres from the nearest forest fires, as well as being largely composed of OM (97.1 %
road. They reported a modified combustion efficiency (MCE, of the sub-micrometre mass, Hodgson et al., 2018).
Ward and Radke, 1993) of 0.79±0.02, which is relatively low The in situ plume sampling was conducted as a sequence
compared to typical deforestation fires; for example Ferek of crosswind intercepts downwind of the fire at approxi-
et al. (1998) reported a value of 0.87 for such fires in Brazil. mately 2500 m above sea level, an along-plume SLR at the
The fire was characterised by substantial emissions of carbon same altitude and a series of overpass intercepts directly
monoxide and very low emissions of rBC compared to prior above the fire at an altitude of approximately 1800 m above
literature on Brazilian deforestation fires and global tropical sea level. As the fire was located on a 900 m high plateau, the
Atmos. Chem. Phys., 20, 5309–5326, 2020 www.atmos-chem-phys.net/20/5309/2020/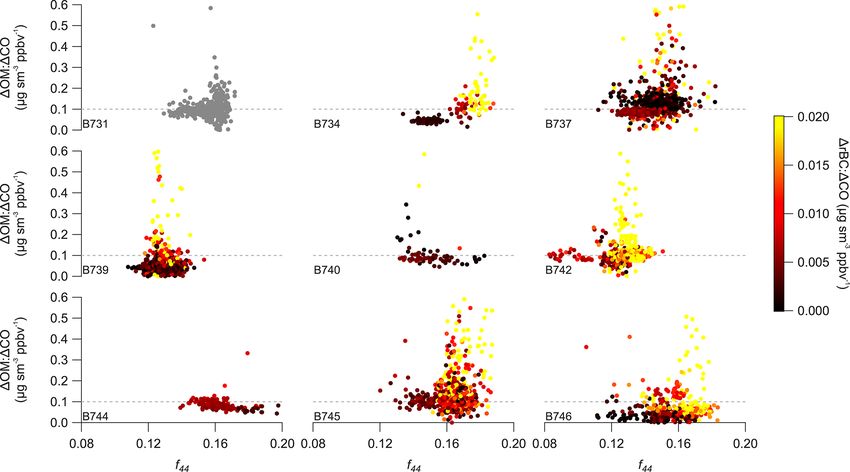
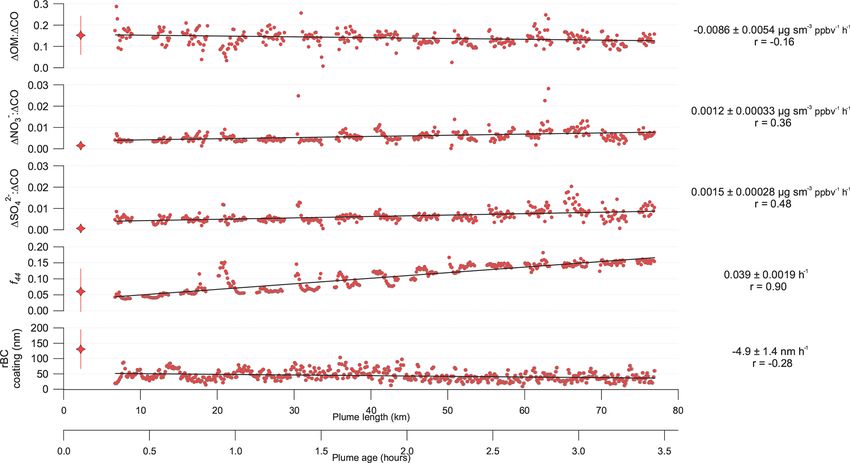
W. T. Morgan et al.: Transformation and ageing of biomass burning aerosol                                                    5313

near-source sampling was conducted approximately 900 m             signal at m/z 44 to the total organic mass, which corresponds
above ground-level. These flight sections are illustrated in       to the CO+  2 ion and is denoted as f44 , is used as an indica-
Figs. 1 and 2.                                                     tor for the level of oxidation of the organic aerosol. We ob-
   We do not have a quantitative estimate of fire size for         served a substantial increase in f44 along the length of the
the B737 case study, although, based on MODIS hotspot              plume from approximately 0.05 to 0.15, with a correlation
data corresponding to our sample location, the maximum fire        coefficient of 0.90. This equates to an increase in O : C of
size is approximately 5 km2 and was likely smaller during          approximately 0.29 to 0.73 over the course of the sampling,
our sampling. Furthermore, based on the velocity of the air-       which is calculated using the equation from Canagaratna
craft and the width of cross-plume intercepts, we estimate         et al. (2015). We observe a small reduction in coating thick-
that the plume was approximately 3–4 km wide in the near           ness of the rBC-containing particles of −4.9 ± 1.4 nm h−1
field before expanding to approximately 21 km when 56 km           with a correlation coefficient of −0.28. The coating thick-
downwind of the fire. The atmospheric stability profile tends      ness observed during the along-plume sampling is lower than
towards instability in the flight conditions during our case       that from the above-fire intercepts, although the variabil-
study, with absolutely unstable air below approximately 2 km       ity is large in the latter. We do not observe any change in
where the lapse rate is 10.9 K km−1 and conditionally unsta-       the 1rBC : 1CO ratio along the length of the plume sam-
ble air from 2 to 3 km where the lapse rate is 7.44 K km−1 .       pling; based on the cross-plume intercepts, the mean ratio
   The time series of gas- and particle-phase species shown        was 0.098 ± 0.013 µg sm−3 ppmv−1 , which was lower than
in Fig. 2 illustrates the significant enhancements in their con-   the above-fire intercept value of 0.37±0.22 µg sm−3 ppmv−1
centrations during plume intercepts, as well as the gradual        reported in Hodgson et al. (2018). We observe a minor
increase in their concentrations as the aircraft approached the    absolute decrease in rBC core diameter along the plume
fire. CO mixing ratios were in excess of 5000 ppb on the ap-       (−4.4 ± 2.3 nm h−1 ), with a correlation coefficient of −0.16;
proach to the fire, climbing to over 15 000 ppb when directly      the geometric mean mass diameter along the plume was
above it during the overpass intercepts. OM mass concentra-        249 ± 49 nm, compared to 270 ± 30 nm from the above-fire
tions reached almost 800 µg sm−3 on the along-plume SLR            intercepts. The lower values in the plume run compared to
and over 3500 µg sm−3 during the above-fire intercepts.            the above-fire intercepts for these rBC parameters may point
   Measurements from the along-plume SLR are shown in              towards a small shift in the fire conditions, although the vari-
Fig. 3 relative to the distance from the fire, as well as the      ability in the plume is large.
approximate age of the plume at the point of sampling.                Figure 4 shows examples of average OM mass spectra at
The distance from the fire is calculated as the great circle       different stages of the plume’s evolution, with approximately
distance of the aircraft from the latitude and longitude of        1-order-of-magnitude decreases in concentration. Consistent
the fire (approximately 11.0◦ S, 63.6◦ W). The age of the          with the f44 evolution above, the organic aerosol becomes
plume is calculated using the average wind speed, which            increasingly oxidised downwind of the fire and closely re-
was 6.2 ± 1.7 m s−1 . We note there was a small gradient in        sembles the background regional aerosol after approximately
wind speed along the length of the plume of 0.02 m s−1 km−1 ,      2.5 h of ageing. Above the fire, m/z 43 dominates (7.6 %),
corresponding to an average increase of 1.2 m s−1 along the        corresponding to CH and CHO ions, with further enhance-
length of the plume. We omit this from our calculations due        ments from other hydrocarbon peaks, especially m/z 29, 41,
to the variability in wind speed also observed, while not-         55 and 57. m/z 60, which is associated with levoglucosan
ing that the latter plume ages reported are potentially biased     and other anhydrous sugars, is also elevated (3.9 % of the or-
towards higher values. The plume extended approximately            ganic signal); levoglucosan is often reported as a tracer for
65 km downwind based on the concentrations reaching re-            biomass burning aerosol. To illustrate the evolution of the
gional background values, which equates to approximately           mass spectra, we calculate the mean absolute difference be-
3 h in terms of plume age.                                         tween the plume spectra and the background as the square
   The evolution of the 1OM : 1CO ratio along the length           root of the sum of the square differences between their or-
of the plume indicates negligible net change in OM mass            ganic peak intensities. We also calculate the linear correlation
downwind of the fire, with the ratio exhibiting a small net        coefficient between them. The mean absolute difference and
decline over the course of the measurements and a low cor-         correlation between the mass spectrum and the background
relation coefficient of −0.16. Compared to the near-source         is 0.0023 and 0.66 respectively, illustrating their similarity.
measurements directly above the fire, the 1OM : 1CO ra-            Approximately 1 h downwind, a similar pattern is observed
tio is slightly enhanced in the near field, although the vari-     but now with increased signal at m/z 44 (6.2 %), while main-
ability in the above-fire ratio is large relative to the differ-   taining the signal at m/z 43 (7.5 %) and reduced signal at the
ence. Small net enhancements in sulfate and nitrate relative       hydrocarbon peaks noted above. The contribution of m/z 60
to CO are observed along the length of the plume, with cor-        has reduced to 2.7 % at this point. The mean absolute dif-
relation coefficients of 0.36 and 0.48 respectively. In addi-      ference and correlation between the mass spectrum and the
tion, the along-plume measurements are enhanced relative to        background is 0.0016 and 0.87 respectively, illustrating their
the above-fire intercepts. The relative intensity of the organic   similarity. After 2.5 h, the contribution from the hydrocarbon

www.atmos-chem-phys.net/20/5309/2020/                                               Atmos. Chem. Phys., 20, 5309–5326, 2020
5314 W. T. Morgan et al.: Transformation and ageing of biomass burning aerosol
Figure 2. Time series of altitude, carbon monoxide (CO), organic matter (OM), refractory black carbon (rBC) and inorganic aerosol compo-
nents during the case study analysis for flight B737. Downwind cross-plume intercepts, the along-plume straight-and-level run (SLR), and
fire overpass intercepts across the plume are indicated by the dashed boxes. The fire itself was located on a 900 m high plateau.
peaks has reduced substantially and m/z 44 dominates the 4 Regional biomass burning haze analysis
organic mass spectrum (13.3 %). The contribution of m/z 44
increases further in the background organic aerosol (15.7 %).
The mean absolute difference and correlation between the The following section examines regional biomass burning
mass spectrum and the background is 0.00064 and 0.99 re- flights during SAMBBA to investigate the ageing and evo-
spectively, illustrating their similarity. The contribution of lution of the carbonaceous aerosol on the regional scale. Fol-
m/z 60 has diminished further after 2.5 h (1.0 %), while be- lowing the case study in Sect. 3, we relate the evolution of
ing close to zero in the background (0.4 %). the regional OM based on changes in f44 as an indicator of
The evolution in the organic mass spectra is further illus- the age of the biomass burning smoke sampled. We couple
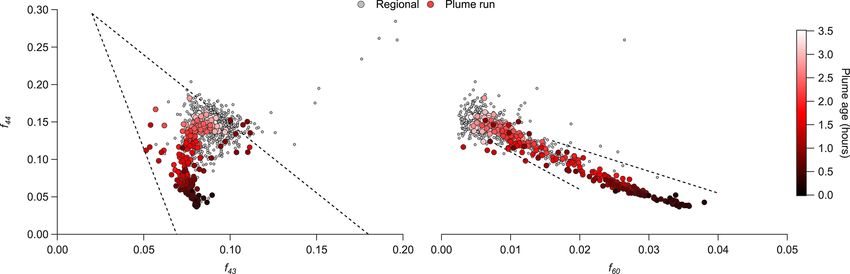
trated in Fig. 5, where f44 is compared with f43 and f60 this with the ratio of rBC to CO as an indicator of the air
for the plume run and regional background aerosol. Rela- mass history based on the assumption that both are relatively
tive to the increase in f44 along the plume and its eventually inert tracers that are strongly controlled by the initial condi-
comparable magnitude to the regional background, f43 ini- tions at source; the ratio also provides an indication for the
tially decreases within approximately the first 45 min of the influence of precipitation, which would reduce the rBC mass
plume’s evolution, before a partial increase and stable mag- concentration to a larger extent than CO. Including this ra-
nitude up to the 2 h mark. f43 then increases over the rest of tio in our analysis framework provides a means of isolating
the plume run until reaching the regional background value. net changes in OM mass concentration during ageing from
The points fall within the f44 and f43 “triangle” space re- changes driven by air mass history.
ported by prior studies focussed on organic aerosol less in- We focus on boundary layer regional haze, which is deter-
fluenced by biomass burning (Morgan et al., 2010; Ng et al., mined based on the procedure outlined in Darbyshire et al.
2010). Comparing f44 and f60 illustrates a gradual reduction (2019), where near-source plumes were identified based on
in f60 as the plume ages and becomes increasingly oxidised a series of threshold concentrations for multiple pollutants
downwind, falling within the space reported by Cubison et al. and then flagged separately. This allows us to exclude such
(2011) and Lack et al. (2013), who reported a similar linear plumes from the wider regional haze that we are interested in
progression. here.
Figure 6 illustrates the geographical scope of the flight
campaign, with the majority of flights sampling within
Rondônia state, as well as western Mato Grosso and To-
Atmos. Chem. Phys., 20, 5309–5326, 2020 www.atmos-chem-phys.net/20/5309/2020/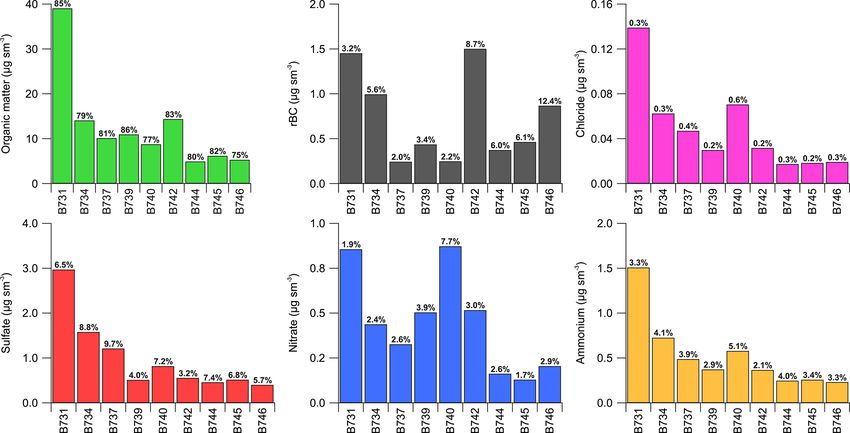
W. T. Morgan et al.: Transformation and ageing of biomass burning aerosol                                                                  5315

Figure 3. Various aerosol chemical and physical parameters as a function of plume length and age for the case study analysis from flight B737.
Organic matter (OM), nitrate and sulfate are normalised by carbon monoxide (CO) to account for dilution of the smoke plume downwind.
Further details on the calculations are provided in Sects. 2.2 and 3. Red star markers on the left-hand side of the figure are averaged across
the fire overpass intercepts across the plume with the bars denoting the 2σ standard deviation range around the mean value (OM, nitrate and
sulfate ratios are taken from Hodgson et al., 2018). Individual data points are shown as red circles from the along-plume straight-and-level
run (SLR), with a linear regression slope included to illustrate any apparent trends. Slopes of the linear regression are given on the right-hand
side of the figure along with their 95 % confidence interval. The correlation coefficient, r, is also provided.

cantins. Deforestation and degradation fires in tropical for-              chemical composition, ranging from 75 % of the total on
est environments are the primary source within Rondônia                    flight B746 to 86 % of the total on flight B739. Sulfate mass
and Mato Grosso, while Cerrado fires dominate in Tocantins.                fractions ranged from 3.2 % to 9.7 % and are typically larger
As well as the geographical regions identified, the analy-                 than nitrate mass fractions, which generally fell between
sis can be split into distinct meteorological phases follow-               1.7 % and 3.9 % with flight B740 as an outlier with 7.7 %.
ing Brito et al. (2014) and Darbyshire et al. (2019). From 14              Chloride mass fractions were low, ranging from 0.2 % to
to 22 September (flights B731–B737), relatively dry condi-                 0.6 %. Based on ion balance calculations of the inorganic
tions were prevalent and were characteristic of the dry sea-               aerosol species, the aerosol was typically neutralised. rBC
son. Following this period, the monsoonal transition was be-               mass concentrations varied from 2.0 % to 6.1 % on flights
ing established and was characterised by increased precipi-                within Rondônia state, with the largest concentrations on
tation across the western and southern Amazon basin. The                   flights B731 and B734. Note the data coverage for the SP2
number of fires was consequently reduced during this transi-               was more limited on flight B731 than the other flights. Aver-
tion phase. Further details and analysis of the meteorological             age rBC mass concentrations (1.5 µg sm−3 ) were greatest on
fields are available in Darbyshire et al. (2019).                          flight B742 in Tocantins, contributing 8.7 % of the total sub-
   Figure 7 summarises the aerosol chemical composition                    micrometre mass concentration. The largest contribution by
for each flight using data from SLRs in boundary layer re-                 rBC was 12.4 % on flight B746, which sampled within both
gional haze. Flight B731 in Rondônia state was the most                    western Mato Grosso and Rondônia.
polluted, with total sub-micrometre mass concentrations                       Figure 8 illustrates the relationship between excess con-
of 46 µg sm−3 . Lower average concentrations are observed                  centrations of OM and CO for each flight. For additional
across the remainder of the flights, with B734 in Rondô-                   context, the points are coloured by the ratio of rBC to CO.
nia and B742 in Tocantins being the next greatest in terms                 Broadly speaking, there is a strong linear relationship be-
of total sub-micrometre mass concentrations of 18 and                      tween OM and CO, with correlation coefficients ranging
17 µg sm−3 respectively. OM dominates the sub-micrometre                   from 0.57 to 0.98. However, the ratio varies both between

www.atmos-chem-phys.net/20/5309/2020/                                                         Atmos. Chem. Phys., 20, 5309–5326, 2020
5316                                              W. T. Morgan et al.: Transformation and ageing of biomass burning aerosol

Figure 4. Aerosol mass spectrometer organic mass spectra from different segments of the case study analysis from flight B737. The above-
fire mass spectrum is from sampling directly above the fire during a cross-plume intercept, with the two downwind mass spectra measured
during the along-plume straight-and-level run (SLR), while the background mass spectrum is in the regional aerosol haze away from the
main fire plume study region.

Figure 5. Comparison of f44 vs. f43 and f60 during the case study analysis for B737, where fx refers to the fraction of the organic aerosol
mass signal at a given mass-to-charge ratio measured by the aerosol mass spectrometer. Also shown is regional haze data during the same
flight. Points from the along-plume straight-and-level run (SLR) are coloured according to the approximate plume age. Dashed lines in the
f44 vs. f43 show the triangle space reported by prior studies focussed on organic aerosol less influenced by biomass burning (Morgan et al.,
2010; Ng et al., 2010). Dashed lines in the f44 vs. f60 are from previous studies on biomass burning organic aerosol ageing, with the upper
line from Cubison et al. (2011) and the lower line from Lack et al. (2013).

and within flights. Variability within individual flights, e.g.         tio changes with variability in OM oxidation and ageing.
B734, B737, B739 and B746, is coincident with differences               Within an individual flight, we observe a limited relation-
in the ratio of rBC to CO, which likely reflects differences in         ship between the ratio and the level of oxidation of the OM,
air mass history across the region(s) sampled on the flight.            with predominantly low correlation coefficients ranging from
   Figure 9 shows the relationship between the ratio of OM              −0.09 to 0.09, except for B734 (0.51) and B740 (−0.26).
and CO compared with f44 to examine whether the ra-                     On some flights (B731, B734, B745) there are enhancements

Atmos. Chem. Phys., 20, 5309–5326, 2020                                                    www.atmos-chem-phys.net/20/5309/2020/
W. T. Morgan et al.: Transformation and ageing of biomass burning aerosol 5317
Figure 12 presents histograms of the median rBC coat-
ing thickness across the individual flights, which appears
to vary appreciably from flight to flight, as well as within
some individual flights. The lowest coating thicknesses we
observe are in the range from 10 to 20 nm on our case study
flight, with regional measurements typically ranging from 40
to 120 nm; such observations indicate that the vast major-
ity of rBC-containing particles within the boundary layer are
at least partially coated. We found no clear and consistent
relationship between coating thickness and f44 across the
dataset. The broad bimodal-like structure in coating thick-
ness in flight B737 could be linked with differences in the
ratio of rBC and CO, with the thicker coatings of 80–100 nm
associated with a larger ratio; conversely, the thinner coat-
ings of less than 60 nm are coincident with the smaller ratios
observed. However, there was no clear pattern in this link-
age in flights B740 and B744, which also had a bimodal-like
Figure 6. Flight tracks of the aircraft while sampling within re- structure in coating thickness. Regional-scale variability in
gional haze that are included in our regional analysis. Scale in rBC coating thickness appears to be predominantly driven
lower right-hand corner pertains to the enlarged map focussed on by fire-source and/or air mass differences rather than ageing
our study region. See Sect. 4 and Table 1 for further details.
of the aerosol population after emission. We also observed
no clear link between the physical size of the rBC core and
f44 , with geometric mean mass diameters typically between
for f44 greater than approximately 0.16, although in the case 250 and 290 nm.
of B734 and B745 they appear at least partially related to
a change in the ratio of rBC and CO; the limited SP2 data
coverage for B731 precludes analysis, although we note that 5 Discussion
there is also a reduction in the ratio at greater f44 values. In
addition, the uncertainty in the ratio of 1OM to 1CO will Whether considering the case study analysis in Sect. 3 or re-
tend to be larger for low concentrations of either or both, gional analysis in Sect. 4, we observe either limited or no net
leading to more extreme values; this predominantly occurs enhancement in the ratio of OM to CO. However, we do ob-
for the most aged air masses in terms of f44 . Comparing serve substantial increases in f44 , which is interpreted as an
across all flights, changes in the ratio of OM and CO com- indicator for the O : C content of the OM. Such a trend with
pared to the level of oxidation appear related to changes in atmospheric ageing is consistent with SOA being produced
the ratio of rBC and CO, which suggests a link with air downwind of source following dilution but that this is ap-
mass history and any perceived change in net condensation proximately balanced by the loss of POA emitted at source.
or evaporation of OM. A number of studies have observed such features in other
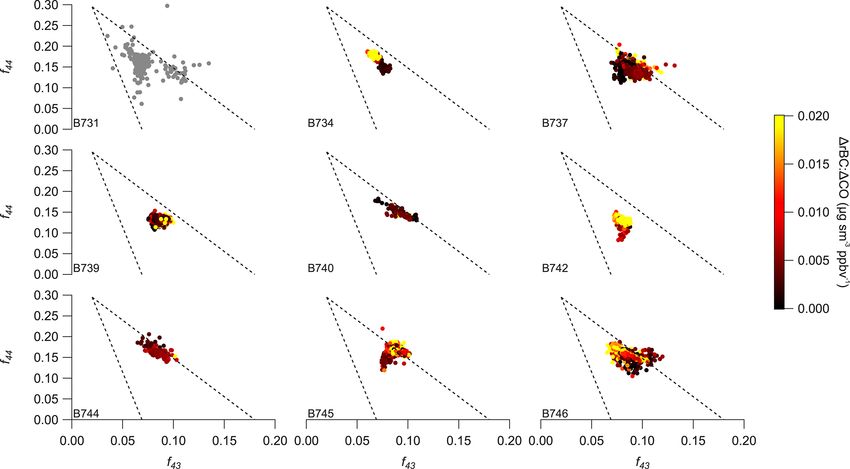
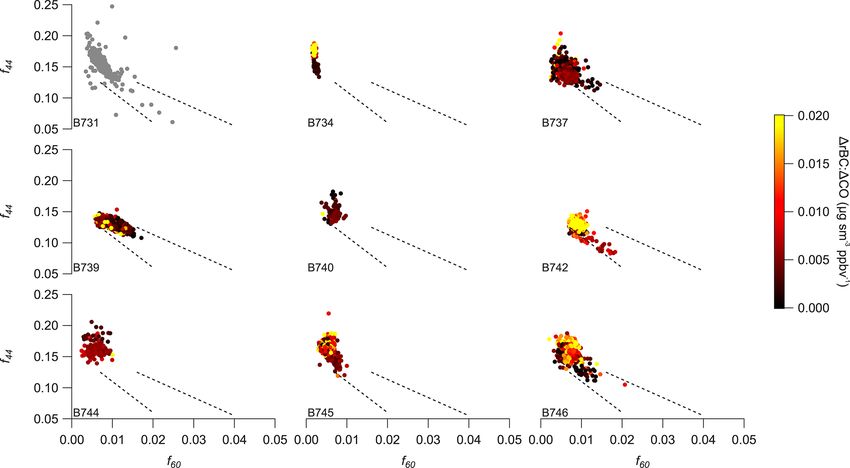
Figures 10 and 11 examine f44 compared with f43 and f60 biomass burning environments and hypothesised such a pro-
in a similar manner to Fig. 5 in Sect. 3. The majority of the cess (e.g. Cubison et al., 2011; Jolleys et al., 2012, 2015;
regional haze data shown in Fig. 10 fall within the triangle May et al., 2015; Zhou et al., 2017). An additional feature of
space reported by prior studies focussed on OM less influ- our observations of the single plume case study is the appar-
enced by biomass burning (Morgan et al., 2010; Ng et al., ent plateau in f44 approximately 2.5 h downwind of source;
2010). Some flights display a broader range of values sug- we also observe a similar plateau in net ozone production
gesting that the flights sampled a more diverse range of air and reduction in nitrogen dioxide downwind. After reaching
masses in terms of their chemistry and ageing. The behaviour this plateau, the level of oxidation is comparable to the re-
described in Sect. 3 in relation to the evolution during the gional background, with highly similar organic mass spectra
early stages of the plume’s age is present in flights B731, as well. Such observations suggest that whatever chemical
B742 and B745, which suggests sampling of fresher biomass process drives the ageing of OM, it is relatively fast under
burning smoke on those flights; on flights B742 and B745, the environmental conditions of our measurements. We note
such features are distinct in terms of the ratio of rBC and CO that our case study is likely of a natural fire and that it is
as well. In terms of the f44 and f60 space shown in Fig. 11, highly smouldering compared to previous fires sampled in
the regional sampling is predominantly confined to lower f60 Brazil (Hodgson et al., 2018), which may have a bearing on
values, as well as displaying the linear tendency noted for the our observations. While we cannot directly ascertain the re-
case study in Sect. 3 and previous work (e.g. Cubison et al., gional evolution of f44 with atmospheric ageing, our results
2011; Lack et al., 2013). imply similar phenomena are present as f44 increases with
www.atmos-chem-phys.net/20/5309/2020/ Atmos. Chem. Phys., 20, 5309–5326, 2020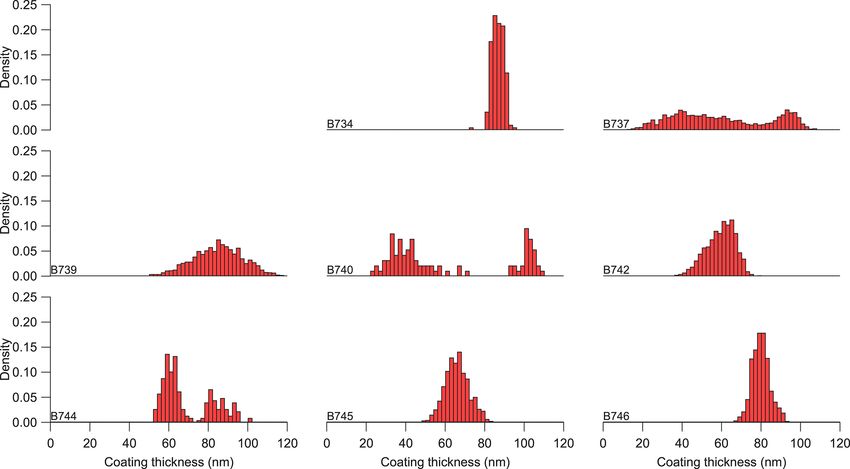
5318                                                W. T. Morgan et al.: Transformation and ageing of biomass burning aerosol

Figure 7. Sub-micrometre aerosol chemical composition overview for the regional analysis with the data split into individual flight operations
in the regional boundary layer aerosol haze. Data are from straight-and-level runs (SLRs) only with the bars denoting mean concentrations
and the text above each bar providing the mass fraction as a percentage. B742 took place over Tocantins, while B746 was primarily over
Mato Grosso with some measurements over Rondônia. The rest of the flights were conducted over Rondônia.

Figure 8. Comparison of organic matter (OM) with carbon monoxide (CO) across individual flights from the regional analysis. Points are
coloured according to the ratio of refractory black carbon (rBC) to carbon monoxide (CO) except for B731 where limited rBC data were
available. The black dashed line shows the 0.1 µg sm−3 ppbv−1 as a consistent baseline for context across all flights, with the solid black
lines showing the linear regression for either the whole flight or smaller segments where two lines are shown for a single flight. Red text next
to the linear regression lines is the slope of the line of best fit in µg sm−3 ppbv−1 .

Atmos. Chem. Phys., 20, 5309–5326, 2020                                                      www.atmos-chem-phys.net/20/5309/2020/
W. T. Morgan et al.: Transformation and ageing of biomass burning aerosol                                                                5319

Figure 9. Comparison of the ratio organic matter (OM) to carbon monoxide (CO) vs. f44 across individual flights from the regional analysis.
f44 refers to the fraction of the organic aerosol mass signal at a mass-to-charge ratio of 44 measured by the aerosol mass spectrometer. Points
are coloured according to the ratio of refractory black carbon (rBC) to carbon monoxide (CO) except for B731 where limited rBC data were
available. The grey dashed line shows the 0.1 µg sm−3 ppbv−1 as a consistent baseline for context across all flights.

Figure 10. Comparison of f44 vs. f43 from the regional analysis across individual flights, where fx refers to the fraction of the organic
aerosol mass signal at a given mass-to-charge ratio measured by the aerosol mass spectrometer. Points are coloured according to the ratio
of refractory black carbon (rBC) to carbon monoxide (CO) except for B731 where limited rBC data were available. Dashed lines show the
triangle space reported by prior studies focussed on organic aerosol less influenced by biomass burning (Morgan et al., 2010; Ng et al., 2010).

decreasing OM concentrations as well as reaching a defined                tions would lead to some evaporation of OM in the near field
end point at approximately 0.20 in the f44 vs. f43 and f60                but with significant SOA production downwind that could
spaces.                                                                   balance the initial loss of particulate matter, which would be
   Bian et al. (2017) examined the role of a number of fac-               consistent with our observations of limited net enhancement
tors that could control SOA production in ambient plumes,                 in OM. Based on thermodynamic analysis of the SAMBBA
including fire area as a driver of dilution rate, mass emission           experiment by Darbyshire et al. (2019), our regional sam-
flux and atmospheric stability. Based on Bian et al. (2017),              pling was typically conducted in unstable air, which is con-
our estimated initial fire size and atmospheric stability condi-          sistent with our observed limited net enhancement in OM.

www.atmos-chem-phys.net/20/5309/2020/                                                       Atmos. Chem. Phys., 20, 5309–5326, 2020
5320                                              W. T. Morgan et al.: Transformation and ageing of biomass burning aerosol

Figure 11. Comparison of f44 vs. f60 from the regional analysis across individual flights, where fx refers to the fraction of the organic
aerosol mass signal at a given mass-to-charge ratio measured by the aerosol mass spectrometer. Points are coloured according to the ratio
of refractory black carbon (rBC) to carbon monoxide (CO) except for B731 where limited rBC data were available. Dashed lines are from
previous studies on biomass burning organic aerosol ageing, with the upper line from Cubison et al. (2011) and the lower line from Lack
et al. (2013).

Figure 12. Histograms of refractory black carbon coating thickness from the regional analysis across individual flights.

   Aqueous processing of biomass burning emissions has                   Jimenez et al., 2009), so such processes have implications for
been identified as a potential source of SOA (e.g. Gilardoni             the lifetime and radiative impact of biomass burning smoke.
et al., 2016; Tomaz et al., 2018), which is likely an important             Our regional analysis illustrates the importance of evalu-
component in Amazonia. However, we are not in a position                 ating changes in the ageing of regional OM within a frame-
to assess the role of such processes through our observations.           work that also accounts for differences in air mass history.
More oxidised OM is thought to be more hygroscopic (e.g.                 Differences in vegetation, fire dynamics and environmental
                                                                         conditions can result in significant diversity in the absolute

Atmos. Chem. Phys., 20, 5309–5326, 2020                                                    www.atmos-chem-phys.net/20/5309/2020/
W. T. Morgan et al.: Transformation and ageing of biomass burning aerosol 5321
and relative emissions of different pollutants from biomass Aside from the comparison between the above-fire inter-
burning that will manifest in the regional aerosol burden. We cepts and the along-plume sampling in the case study, we
also observe significant variability from flight to flight, even do not observe clear changes in rBC coating thickness with
within the same region, that is likely a consequence of differ- plume age. Our observations indicate that rBC is rapidly
ing meteorological conditions e.g. the influence of precipita- coated in the near field based on our case study, as well
tion, as well as changes in fire dynamics. Were we to interpret as other near-field sampling during SAMBBA, in contrast
our observed changes in the ratio of OM to CO as a func- to many urban sources and environments (e.g. Liu et al.,
tion of f44 , we would see enhancements of 2–3 in some in- 2017). This is consistent with previous measurements of
stances that are most likely driven by differences in air mass North American wildfire emissions, which also showed sig-
history and fire dynamics rather than chemical processing – nificant coatings on near-field rBC particles (Schwarz et al.,
1rBC : 1CO was key in illustrating such differences where 2008; Sedlacek et al., 2012). On the regional scale, we ob-
enhancements in OM to CO were often easily distinguished serve no clear link between coating thickness and f44 , with
by large changes in rBC to CO. variability in coating thickness appearing to be driven by
Our results indicate that uncertainties in the magnitude fire-source and/or air mass differences. Prior measurements
of the aerosol burden most likely lie in quantifying emis- of biomass burning emissions over boreal Canada by Taylor
sion sources, alongside atmospheric dispersion, transport et al. (2014) reported that scavenging of rBC via wet deposi-
and removal rather than chemical enhancements in mass. tion preferentially removed the largest and most coated parti-
Across our study, 1OM : 1CO ratios range from 0.029 to cles. Such processes may explain some of our observed vari-
0.13 µg sm−3 ppbv−1 in the west of the Amazon basin, with ability in coating thickness on the regional scale, although
a value of 0.095 µg sm−3 ppbv−1 in the Cerrado environment we observe limited variability in rBC core size across the
sampled on flight B742. Numerical models that attempt to dataset. Our measurements indicate that the vast majority
represent the magnitude of the atmospheric aerosol burden of rBC-containing particles within the boundary layer are at
typically use fixed emission factors for distinct ecosystems; least partially coated, with the lowest coating thicknesses of
for example those used in the fourth version of the Global 10–20 nm observed in our case study flight and the majority
Fire Emissions Database (GFED4, van der Werf et al., 2017) of our regional measurements indicating thicknesses of 40–
report 1OM : 1CO ratios of 0.10 and 0.09 µg sm−3 ppbv−1 120 nm. Such coatings will lead to a lowering of rBC life-
for tropical forest and savannah fires respectively (assum- time as rather than being hydrophobic the rBC-containing
ing an OM : OC ratio of 1.6 for biomass burning OA fol- particles will be at least mildly hygroscopic, making them
lowing Yokelson et al., 2009, and Akagi et al., 2012). In more susceptible to cloud activation and wet removal. Fur-
the western Amazon basin, our central estimate for the thermore, such coatings have implications for the radiative
1OM:1CO ratio when considering all flights together is impact of black-carbon-containing particles via enhanced ab-
0.09–0.10 µg sm−3 ppbv−1 , closely matching the value for sorption (Liu et al., 2017). The lack of change in coating
tropical forests in GFED4. Based on the local- and synoptic- thickness appears consistent with the limited enhancement in
scale situations during flights B739 and B746, we suspect OM, although given that our results imply a process of both
that the lower observed ratios on these flights are a conse- evaporation and condensation of OA-related species there are
quence of wet removal; the lower ratio associated with lim- potentially complex particle dynamics occurring within the
ited rBC in B734 is less clear based on the large-scale synop- rBC-containing fraction that warrant further investigation.
tic situation, so we do not speculate on a cause in this case.
If these three flights with lowered observed 1OM : 1CO ra-
tios are excluded from the analysis, then our regional values 6 Conclusions
range from 0.075 to 0.13 µg sm−3 ppbv−1 in the west of the
Amazon basin, indicating significant variability compared to We observe limited to no enhancement in OM mass pro-
any assumed fixed emission factor. However, we note that duction during atmospheric ageing of biomass burning over
variability of 25 %–30 % is much lower than the discrep- Brazil for both a case study of a likely natural tropical for-
ancy reported between measurements and models quantify- est fire and regional sampling over the Amazon and Cer-
ing the aerosol burden over tropical South America, where rado. Variability in the ratio of OM to CO is predominantly
factors ranging from 1.5 to 6 are required to match satel- driven by regional differences likely related to changes at
lite and ground-based observations of aerosol optical depth the initial fire source, as well as air mass differences likely
(Reddington et al., 2016, and references therein). as a consequence of wet scavenging of the aerosol. What
In terms of inorganic species, we observe small net en- enhancements we do observe are small in absolute terms
hancements in sulfate and nitrate relative to CO in the case compared to regional-scale variability across our study. Such
study analysis. We do not observe clear enhancements in ni- variability at the regional scale can be significant, with
trate at the regional scale, while we do observe minor abso- flight-averaged 1OM : 1CO ratios ranging from 0.075 to
lute increases in sulfate on some flights. 0.13 µg sm−3 ppbv−1 across our study region in cases where
we suspect the influence of precipitation to be minor. We did
www.atmos-chem-phys.net/20/5309/2020/ Atmos. Chem. Phys., 20, 5309–5326, 20205322 W. T. Morgan et al.: Transformation and ageing of biomass burning aerosol
not observe a systematic difference between the west of our where the entire SAMBBA dataset may be accessed at https:
study region and the Cerrado in terms of 1OM : 1CO, al- //catalogue.ceda.ac.uk/uuid/2ff89840a89840868acff801f8859451
though we only have one flight in the latter region. While (SAMBBA, 2014). AMS mass spectral features, SP2 size distri-
significant, we note that the scale of the variability is much bution and coating thickness data are available on request. Data
smaller than typical factors required to match satellite and masks for categorising flight patterns into plume-sampling and
other sampling types (vertical profiles and SLRs) are currently
ground-based observations of aerosol optical depth to nu-
available on request. Active fire data used in the paper are available
merical model estimates of the aerosol burden. We do ob- publicly from NASA (see acknowledgements for further details).
serve substantial changes in the chemical composition of
OM, with significantly increased oxidation downwind, im-
plying SOA formation that is being balanced by evaporation Author contributions. WTM analysed the data and wrote the paper.
of OM. During our case study, we observed an increase in JDA, ED, JL and DL provided additional data analysis support, in-
O : C of approximately 0.25 ± 0.09 h−1 , reaching a plateau cluding data processing and quality assurance. SB and JL operated
after approximately 2.5–3.0 h of atmospheric ageing and a the gas-phase instruments, while JDA and MJF operated the aerosol
comparable magnitude to the background regional aerosol. instruments during the field campaign. BJ, JH, KML, PEA and HC
Such changes may enhance the hygroscopicity of the OA, led the planning of the field campaign and were co-principal inves-
and given its dominance of the aerosol burden (75 %–86 % tigators on the SAMBBA project.
of the sub-micrometre mass in our study), this will have im-
plications for the life cycle and radiative impact of biomass
burning aerosol in the region. Competing interests. The authors declare that they have no conflict
We observe limited changes in the microphysical prop- of interest.
erties of rBC subsequent to emission, with neither signifi-
cant changes in particle core size nor significant changes in
Acknowledgements. We would like to acknowledge the substan-
coating thickness. We observe substantial coatings on rBC-
tial efforts of the whole SAMBBA team before, during and af-
containing particles at source. Given the limited changes with ter the project. Active fire data were produced by the Univer-
ageing, our results suggest that any absorption enhancements sity of Maryland and acquired from the online Fire Informa-
will be dictated by the initial conditions in the near field and tion for Resource Management System (FIRMS; https://earthdata.
precipitation influences, rather than ageing, although we have nasa.gov/data/near-real-time-data/firms/abouts; specific product:
not investigated particle morphology changes that may occur. MCD14ML, last access: 4 June 2018).
Such coatings likely reduce the lifetime of rBC as they are
likely to be at least mildly hygroscopic, especially compared
to uncoated hydrophobic rBC particles. Financial support. Eoghan Darbyshire was supported by a NERC
The complex nature of the regional aerosol and its drivers studentship (grant nos. NE/J500057/1 and NE/K500859/1). This
implies that aggregating our observations from the entire work was supported by the NERC SAMBBA project (grant no.
study as a function of atmospheric ageing is unwise due to NE/J010073/1). Paulo E. Artaxo was supported by FAPESP (Fun-
the many conflating and competing factors present. The con- dação de Amparo à Pesquisa do Estado de São Paulo; grant nos.
2017-17047-0 and INCT 2014/50848-9). This research was also
tinuing puzzle over the contrasting observations of the evolu-
supported by the LBA (the Large Scale Biosphere-Atmosphere Ex-
tion of OM:OC ratios with atmospheric ageing remains, al- periment in Amazonia) central office, operated by INPA (Instituto
though our results appear consistent with the framework pre- Nacional de Pesquisas Espaciais).
sented by Bian et al. (2017). Further detailed quantification
of the processes driving these should be further explored in
the literature, as well as chamber and ambient studies specif- Review statement. This paper was edited by Sergey A. Nizkorodov
ically designed to probe such processes. and reviewed by three anonymous referees.
Overall, our results suggest that the initial conditions are
the biggest driver of carbonaceous aerosol composition and
physical properties in the region, aside from significant oxi-
dation of OA during atmospheric ageing. Uncertainties in the
magnitude of the aerosol burden and its impact most likely References
lie in quantifying emission sources, alongside atmospheric
Akagi, S. K., Craven, J. S., Taylor, J. W., McMeeking, G. R.,
dispersion, transport and removal rather than chemical en-
Yokelson, R. J., Burling, I. R., Urbanski, S. P., Wold, C. E.,
hancements in mass.
Seinfeld, J. H., Coe, H., Alvarado, M. J., and Weise, D. R.:
Evolution of trace gases and particles emitted by a cha-
parral fire in California, Atmos. Chem. Phys., 12, 1397–1421,
Data availability. All raw time series data from the FAAM research https://doi.org/10.5194/acp-12-1397-2012, 2012.
aircraft are publicly available from the Centre for Environmental Andreae, M. O.: Smoking Rain Clouds over the Amazon, Science,
Data Analysis (http://www.ceda.ac.uk/, last access: July 2014), 303, 1337–1342, https://doi.org/10.1126/science.1092779, 2004.
Atmos. Chem. Phys., 20, 5309–5326, 2020 www.atmos-chem-phys.net/20/5309/2020/You can also read


