Consequences of school closure on access to education: Lessons from the 2013-2016 Ebola pandemic - ScienceOpen
←
→
Page content transcription
If your browser does not render page correctly, please read the page content below
International Review of Education
https://doi.org/10.1007/s11159-021-09900-2

    ORIGINAL PAPER

Consequences of school closure on access to education:
Lessons from the 2013–2016 Ebola pandemic

William C. Smith1

© The Author(s) 2021

Abstract
The COVID-19 pandemic has seen an unprecedented shutdown of society. Among
the various safety measures taken, much attention has been given to school closure
as a non-pharmaceutical mitigation tool to curb the spread of the disease through
ensuring “social” (physical) distancing. Nearly 1.725 billion children in over 95%
of countries worldwide have been affected by school closures implemented in April
2020 as the virus continued to spread. In the field of education, policymakers’ atten-
tion has been directed at keeping students on board through remote learning and
addressing the immediate needs of schools upon reopening. The study presented
in this article focuses on who remains absent after schools resume. Using publicly
available survey data from the USAID Demographic Health Surveys Program and
the UNICEF Multiple Indicator Cluster Survey from before and after the 2013–2016
Ebola pandemic in Guinea and Sierra Leone in West Africa, the author examined
changes in school enrolment and dropout patterns, with targeted consideration given
to traditionally marginalised groups. At the time, schools closed for between seven
to nine months in the two countries; this length and intensity makes this Ebola pan-
demic the only health crisis in the recent past to come close to the pandemic-related
school closures experienced in 2020. The author’s findings suggest that post-Ebola,
youth in the poorest households saw the largest increase in school dropout. Exceed-
ing expected pre-Ebola dropout rates, an additional 17,400 of the poorest secondary-
age youth were out of school. This evidence is important for minimising the likely
post-COVID-19 expansion in inequality. The author’s findings point to the need for
sustainable planning that looks beyond the reopening of educational institutions
to include comprehensive financial support packages for groups most likely to be
affected.

Keywords school closure · health crisis · dropout · Ebola · West Africa · COVID-
19 · differences-in-differences

* William C. Smith
  w.smith@ed.ac.uk
1
      Moray House School of Education and Sport, University of Edinburgh, Edinburgh, UK

                                                                                          13
                                                                                 Vol.:(0123456789)
W. C. Smith Résumé Conséquences de la fermeture des écoles sur l’accès à l’éducation : les enseignements de la pandémie d’Ebola de 2013 à 2016 – La pandémie de COVID-19 a infligé un arrêt sans précédent à la société. Parmi les diverses mesures de sécurité qui ont été prises, une attention particulière à été accordée à la fermeture des écoles devenue un outil non pharmaceutique pour freiner la propagation de la maladie par le biais d’une distancia- tion « sociale » (physique) ainsi garantie. Près de 1,725 milliard d’enfants dans plus de 95 % des pays du monde entier ont été concernés par les fermetures d’établissements scolaires entrées en vigueur en avril 2020, alors que le virus continuait de se propager. Dans le domaine de l’éducation, les politiques se sont appliquées à permettre aux écoliers de continuer à étudier au moyen de l’apprentissage à distance et à répondre aux besoins immédiats des écoles lors de leur réouverture. L’étude présentée dans cet article est essentiellement consacrée à ceux qui restent absents une fois que l’école a repris. S’appuyant sur des données accessibles au public du Programme d’enquêtes démographiques et sanitaires de l’USAID (l’Agence des États-Unis pour le développe- ment international) et l’Enquête par grappes à indicateurs multiples de l’UNICEF avant et après la pandémie d’Ebola de 2013–2016 en Guinée et en Sierra Leone, en Afrique de l’Ouest, l’auteur s’est penché sur les changements concernant les inscrip- tions dans les établissements scolaires et les schémas d’abandon de la scolarité en portant une attention particulière aux groupes traditionnellement marginalisés. À cette époque-là, les écoles ont fermé leurs portes pendant sept à neuf mois dans les deux pays. La durée et l’intensité de ces fermetures ont fait de la pandémie d’Ebola la seule crise sanitaire du passé récent à se rapprocher en la matière de celle de COVID-19 en 2020. Les conclusions de l’auteur indiquent qu’après la pandémie d’Ebola, la plus forte hausse des abandons scolaires a été enregistrée chez jeunes des foyers les plus démunis. Dépassant les taux d’abandon d’avant Ebola auxquels on s’attendait, 17 000 écoliers supplémentaires faisant partie des plus pauvres au niveau de l’enseignement secondaire ont abandonné l’école, une preuve importante pour œuvrer à réduire au minimum l’augmentation probable des inégalités après la pandémie de COVID-19. Les conclusions de l’auteur montrent qu’il est nécessaire de planifier durablement en se projetant au-delà de la réouverture des écoles afin d’inclure de vastes aides finan- cières pour les groupes qui seront probablement touchés. Introduction The COVID-19 pandemic is unlike anything the world has seen over the past cen- tury.1 As of 18 June 2020, nearly 8.5 million individuals have been infected, and almost half a million people have died (Worldometer 2020). In response, and despite 1 Three large, global pandemics occurred in the 20th century: the “‘Spanish influenza’ in 1918, ‘Asian influenza’ in 1957, and ‘Hong Kong influenza’ in 1968. The 1918 pandemic killed an estimated 40–50 million people worldwide. That pandemic, which was exceptional, is considered one of the deadliest disease events in human history. Subsequent pandemics were much milder, with an estimated 2 million deaths in 1957 and 1 million deaths in 1968” (WHO 2007, p. 2). 13
Consequences of school closure on access to education: Lessons…

resulting economic hardship, governments around the world have shut down society
to stem the spread of the disease through “social” (physical) distancing. School clo-
sures have been nearly universally used as a mitigation tool. While a recent review
found limited research and a marginal association between school closures and dis-
ease transmission (Viner et al. 2020), past studies exploring influenza outbreaks
have highlighted the potential effectiveness of school closures in slowing down
transmission (Jackson et al. 2013), and revealed that affected countries have rou-
tinely relied on this measure (UK DOH 2014). At the peak of COVID-19-related
school closures in April 2020, over 95% of countries worldwide had fully or par-
tially closed schools, affecting an unprecedented 1.725 billion children around the
globe (UNESCO 2020).
   At the time of writing,2 schools are slowly starting to reopen in some countries,
with mixed success. For example, concerns over safety have led England to halt
plans to further open primary schools (Coughlan 2020), and in South Korea and
Israel, some schools were closed once more after infection rates flared (Gaudiano
and Goldberg 2020). Around the world, governments, teachers’ unions and universi-
ties are planning for educational institutions to reopen so that face-to-face learning
can be resumed. The potential negative consequences of having youth out of school,
and the complex challenges of opening facilities during an ongoing pandemic,
have focused attention on short-term response and recovery – including ensuring
schools and campuses are “COVID-19 secure”, and helping those who return to
school make up for lost time in their studies. But what about children and youth who
remain absent? In the study I present in this article, I explored the impact of school
closures during the 2013–2016 Ebola pandemic3 in Guinea and Sierra Leone in
West Africa on school enrolment patterns. Drawing on household survey data from
directly before and after the pandemic, I used descriptive and inferential statistics to
explore: (1) if, and to what extent, school disruptions during the Ebola pandemic in
Guinea and Sierra Leone changed the expected pattern for enrolment among school-
age youth, and (2) if, and to what extent, alterations disproportionately affected mar-
ginalised groups.
   The results from this study show a post-pandemic surge in school dropouts
concentrated in secondary-age youth from the poorest households in Guinea and
Sierra Leone. This effect resulted in an additional 17,410 more youth dropping out
of school across the two countries than would have been expected in pre-outbreak
times. These findings have implications for education planners as they prepare for
recovery from the COVID-19 crisis. By highlighting those students at greatest risk

2
  This article was drafted in July 2020.
3
  While nearly all Ebola outbreaks have come to be classified as epidemics, the 2013–2016 crisis is
understood as a pandemic. Although the majority of cases were concentrated in three countries in West
Africa (Guinea, Sierra Leone and Liberia), associated cases were identified across 7 other countries on
3 continents (Shultz et al. 2016). According to The Dictionary of Epidemiology, an epidemic is defined
as “the occurrence in a community or region of cases of an illness, specific health-related behaviour, or
other health-related events clearly in excess of normal expectancy” (Porta 2014). A pandemic is defined
as “an epidemic occurring worldwide, or over a very wide area, crossing international boundaries and
usually affecting a large number of people” (ibid.).

                                                                                            13
W. C. Smith of not returning, this study encourages education systems to adopt a sustainable, tar- geted approach, using ambitious but realistic timelines as they attempt to restart and rebound. The next sections provide a review of school disruptions and their relationship with educational outcomes, followed by a look at school closures and past large- scale health crises. The 2013–2016 Ebola pandemic is then introduced, along with the data and methods I used in my analysis. Following a presentation of the results, a discussion section contrasts key characteristics of the Ebola pandemic and the COVID-19 pandemic. In the conclusion, I sum up some preliminary lessons which could prove useful for education planning purposes. School disruptions and educational outcomes School disruptions include both planned and unplanned stoppage of education through the closure of facilities. Common reasons for school disruptions include outbreaks of infectious disease (Cauchemez et al. 2014), natural disasters (Andrabi et al. 2020; Bangkok ADPC 2008; Esnard et al. 2018) and inclement weather (Stu- art et al. 2013). In a study of unplanned school closures in the United States (US) between 2011 and 2013, 79% of closures were due to inclement weather, 14% to natural disasters and 4% to infrastructure issues. Only 4% of closures lasted more than four days (Wong et al. 2014). To see a relationship between school disruptions and educational outcomes, a dis- ruption must be of substantial length. For this reason, most research has examined disruptions due to disasters, school holidays or education transitions (e.g. moving between grades or years). Learning loss over school holidays has been commonly reported (Slade et al. 2017), and has been found to disproportionately affect children in low-income families (Quinn et al. 2016). For example, children who are out of school for the summer holidays in Latin America lose nearly three months of prior learning (Busso and Munoz 2020). In Malawi, Timothy Slade and colleagues (2017) reported a 0.38 standard deviation decrease in reading scores during the three-month transition from Grade 1 to Grade 2. During a similar transition in Ghana, founda- tional numeracy test differences represented a 66% loss in learning gains, with a complete elimination of learning gains for those without books or reading materials at home (Sabates and Carter 2020). Lower achievement is also more common among students who have experienced natural disasters. Comparing test scores of students in Thailand who were affected and not affected by flooding, Kawin Thamtanajit (2020) reported a 0.03 to 0.11 stand- ard deviation decline, depending on grade and subject. Research suggests that effects are greater for economically disadvantaged students (Lai et al. 2018) and can per- sist over time (Andrabi et al. 2020). For instance, four years after the 2005 Pakistan earthquake, family living standards had recovered, but those whose schools had been closed for an average of 80 days experienced learning loss that put them one and a half to two years behind their peers (Andrabi et al. 2020). Compared to student achievement, enrolment patterns remain understudied. Some researchers have suggested that those living in higher-risk areas for natural 13
Consequences of school closure on access to education: Lessons…

disasters are more prone to drop out of education (Bangkok ADPC 2008); however,
research relating specifically to health crises and student re-enrolment is relatively
rare (see Carvalho et al. 2020 for a review). A study on post-outbreak absenteeism
following a five-day school shutdown due to seasonal influenza in one US city found
no differences between those affected and those not affected (Rodriquez et al. 2009).
In Liberia, post-Ebola telephone surveys found that one month after the pandemic,
one in four households reported that their children had not yet returned to school
(Carvalho et al. 2020). Keith Meyers and Melissa Thomasson (2017) explored the
long-term effects of the 1916 polio epidemic in the United States and found that
those who were aged 14 to 17 during the epidemic had lower educational attainment
in 1940. Specifically, a one standard deviation increase in the number of community
cases per 10,000 people was associated with a 0.07 year decrease in educational
attainment. The results, however, represent an upper-bound estimate, as effects were
unable to differentiate between those who were directly afflicted with polio and
those who were indirectly affected through school closures. This is due, in part, to
the assumption that state-level polio morbidity (rate of disease in a population) is an
accurate measure of school disruption.
   Enrolment and learning can be negatively affected both by the destruction or
the disruption of educational facilities. During the 2013–2016 Ebola pandemic, for
example, schools in Sierra Leone were used as treatment centres, leading to hesita-
tion among families for their children to return to school (Berry and Davis 2020).
Earthquakes (Bangkok ADPC 2008) and hurricanes have also led to the destruction
of schools, increasing the difficulty of resuming post-crisis education. As a result of
Hurricane Mitch in 1998, 4,835 out of 20,942 public school classrooms in Honduras
were destroyed (Smith 2013). In 2017, following destruction by Hurricanes Maria
and Irma, Puerto Rico permanently closed approximately one quarter of its schools
(Finucane et al. 2020).

School closures and past large‑scale health crises

During health crises featuring a communicable disease, school closures are a com-
monly used non-pharmaceutical intervention. School closures can be an effective
mitigation tool to slow the transmission of an infectious disease (Jackson et al.
2013), but they are best used in combination with other strategies (Markel et al.
2007; Viner et al. 2020). Further, school closures are often initiated too late, in a
reactive manner after the peak of infections have passed (Cauchemez et al. 2009).
Key considerations in deciding whether to close schools include the case fatality
rate4 and the infection rate among youth (Cauchemez et al. 2014; UK DOH 2014).
The COVID-19 pandemic has seen an almost global shutdown of education systems.
By mid-April 2020, 95% of countries worldwide had at least partially closed their
schools (UNESCO 2020). Prior to resumption, schools in Pakistan, Indonesia, South

4
  The case fatality rate refers to the proportion of deaths from a particular disease compared to the total
number of people diagnosed with the disease.

                                                                                              13
W. C. Smith Africa, Zambia and Malawi were expected to be closed for over 100 days (Crawfurd et al. 2020a). For South Africa, this equates with losing 25% to 57% of the “nor- mal” school year (van der Berg and Spaull 2020). With schools closed for over 70% of the academic year, the Education Cabinet Secretary of Kenya recently declared the school year lost, with students required to repeat their classes upon reopening (Muraya 2020). In Europe, schools in France and Germany reopened after being closed for over 50 days, while in England schools were shut for just over 80 days before resuming at some capacity (Crawfurd et al. 2020a). The breadth and length of school closures are two of many features that set the COVID-19 pandemic apart from previous large-scale health crises. In their system- atic review of school closures due to seasonal or pandemic influenza, over half of the studies investigated by Charlotte Jackson and colleagues (2013) reported school closures of less than 14 days. Across eight countries during the 2009 H1N1 (“swine flu”) pandemic, school closures lasted an average of three to eight days (Cauchemez et al. 2014). In Mexico, the source country for the H1N1 pandemic, schools closed for 14 days from 27 April to 10 May (Herrera-Valdez et al. 2011). Targeted city- level closures occurred for three weeks in Bangkok, Thailand (Chieochansin et al. 2009), four days in Auckland, New Zealand (Stuart et al. 2013), and one month in Hong Kong (Wu et al. 2010). Information on school closures during the 1918–1919 influenza (“Spanish flu”) pandemic that killed at least 50 million people and infected one third of the global population (CDC n.d.-a) is difficult to find. Drawing from news articles, Alexandra Stern and colleagues (2009) found inconsistent closures across the US. While districts in Los Angeles and Denver shut down for 85 and 82 days respectively, many of the largest districts, including New York City and Chi- cago, decided against closing. The regional intensity and length of closures during the 2013–2016 Ebola pan- demic in West Africa make it the only education system shutdown that comes close to what the world is currently experiencing. This pandemic had more cases, deaths and recoveries than all other prior Ebola outbreaks combined (Shultz et al. 2016). Previously, Ebola had never crossed national boundaries; the 2013–2016 outbreak was the first to be recognised as a pandemic, with reported cases spread across 10 countries. Sierra Leone was the epicentre of the outbreak, with all districts in the country reporting at least one case of Ebola (Amara et al. 2017), and with 99.9% of all cases concentrated in Guinea, Liberia and Sierra Leone (Shultz et al. 2016). Schools in these three countries were closed for seven (Guinea) to nine (Sierra Leone) months, resulting in 486 to 780 lost learning hours (UNDP 2015). The educa- tion of an estimated 5 million children was influenced by the shutdowns (Rohwerder 2020). Beyond the education system, the Ebola pandemic also took a heavy toll on other sectors of affected countries in the region. For Sierra Leone and Guinea, progress in overcoming years of turmoil and political unrest was stymied when the Ebola outbreak hit. World Bank estimates for economic growth as a percentage of gross domestic product (GDP) in 2015 were adjusted from 4.3% to –0.2% in Guinea and from 8.9% to –2.0% in Sierra Leone (Bordner 2015). In Sierra Leone, average annual household income declined from USD 336 to USD 131 over the course of the pandemic (Berry and Davis 2020). In Guinea, 850 young people lost at least one 13
Consequences of school closure on access to education: Lessons…
parent to Ebola (The New Humanitarian 2015) and in Sierra Leone, 5,666 lost at
least one parent (Amara et al 2017). Further, 30% of children were unable to receive
routine vaccines during the pandemic (CDC 2015).
The 2013–2016 Ebola pandemic and educational enrolment in Sierra
Leone and Guinea
Study context
To explore the influence of the 2013–2016 Ebola pandemic on educational enrol-
ment, I drew on data from Sierra Leone, Guinea and Côte d’Ivoire in West Africa. I
included Côte d’Ivoire as a control country, as it borders the afflicted region but was
unaffected by the pandemic. Using publicly available household survey data from
directly before and after the pandemic, I applied descriptive and inferential statis-
tics5 to investigate two research questions:
(1) How has the 2013–2016 Ebola pandemic influenced the enrolment patterns of
school-age youth in Sierra Leone and Guinea?
(2) Has the pandemic disproportionately affected the most marginalised youth?
Liberia was not included in this study, as household surveys from at least two peri-
ods before and one time period following the Ebola pandemic were not available.
The household surveys I drew on included both the USAID Demographic Health
Surveys (DHS) Program6 and the UNICEF Multiple Indicator Cluster Survey
(MICS).7 The DHS and MICS both provide nationally representative data. Con-
ducted continuously, the two surveys have increasingly taken to aligning their ques-
tionnaires and collecting data in different years to provide a more coherent picture
of country activity and trends (Lisowska 2016). In contrast to national assessments,
the DHS and MICS, as household surveys, are able to capture those individuals who
are not currently attending school. Prior research has combined DHS and MICS data
to explore changes in educational enrolment (Putnick and Bornstein 2015; Smith-
Greenaway and Heckert 2013). Additionally, the two surveys act as the primary
sources of data for UNESCO’s World Inequality Database on Education (WIDE).8
5
Descriptive statistics describe the sample being studied, while inferential statistics are used to draw
inferences or conclusions for the larger population which the sample is supposed to represent (Urdan
2010).
6
Funded by the United States Agency for International Development (USAID), the Demographic Health
Surveys (DHS) Program has been collecting and disseminates nationally representative data on health
and population in developing countries since 1984. The online database is at https://dhsprogram.com/.
7
Developed by the United Nations Children’s Fund (UNICEF) and launched in 1995, the Multiple Indi-
cator Cluster Survey (MICS) provides internationally comparable data on key indicators on the well-
being of children and women. The online portal is at http://mics.unicef.org/.
8
An earlier version of this database was created by the United Nations Educational, Scientific and Cul-
tural Organization (UNESCO) in 2010. In 2018, it was relaunched as the World Inequality Database on
Education (WIDE). The online portal is at https://www.education-inequalities.org/.
13W. C. Smith
For this study, in each survey and year, I limited the sample to the school-age
population. In Sierra Leone and Côte d’Ivoire, the overall school-age population is
age 6–18, with ages 6 to 11 representing primary school and ages 12 to 18 represent-
ing secondary school. The comparative numbers in Guinea are age 7–19 for overall
school age, with ages 7 to 12 for primary school and ages 13 to 19 for secondary
school (UIS n.d.). The multiple survey years allow a cohort-level comparative analy-
sis. A breakdown of descriptive statistics in pandemic-affected countries is provided
later in this article.
I calculated education status by disaggregating (separating) the identified age
group into three categories:
(1) Currently enrolled – those who have attended school at some time during the
current school year. For example, if the current school year is 2016/2017, a cur-
rently enrolled student has attended school at least once during that year.
(2) Dropout – those who have previously attended school but have not attended
at any time during the current school year. For example, if the current school
year is 2016/2017, a student who has dropped out has not attended at least one
day during that year, but has attended during previous years (i.e. 2014/2015 or
2015/2016).
(3) Never enrolled – those who have never enrolled in school.
Primary- and secondary-age enrolment in this study therefore differs from primary
and secondary net enrolment, as my main concern was whether youth were attend-
ing school (I did not consider the level at which they attended).
Demographic categories for this study were drawn from past literature but limited
to those that provide comparative measures over survey type and year. As a result,
I chose four categories: sex, location, orphan status and wealth. Sex is a binary
variable coded 1 for female and 0 for male. Location is a binary variable coded 1
for rural and 0 for urban. Orphan status was calculated from survey questions that
asked whether the identified youth’s biological mother and biological father were
still alive. If both biological parents were dead, the youth was considered an orphan
(coded 1); if any biological parent was alive, the youth was a non-orphan (coded
0). Finally, wealth was measured through MICS- and DHS-provided wealth quin-
tiles. Quintile 1 included the poorest youth, while Quintile 5 included the wealthiest
youth.
Method
To address the two research questions, I used a combination of descriptive and infer-
ential statistics. Proportions were examined over time to provide an overview in
response to Research Question 1. For Research Question 2, I calculated change in
dropout rate between pre- and post-pandemic samples. Dropout rate here equals the
number who have dropped out divided by those who have ever attended (dropped
out + currently enrolled). To include multiple demographic variables simultaneously
13Consequences of school closure on access to education: Lessons…
Table 1 Basic differences-in-differences design
Time period 1 Time period 2 Differences-in-differences estimate
Treatment group y1 y2
(y2 – y1) – (y4 – y3)
Control group y3 y4
and disentangle the effect of the Ebola pandemic from any effect related to change
over time, I ran a series of inferential analyses.
First, I used logistic regression to predict the association between demographic
groups and the likelihood of being included in the dropout category. Logistic regres-
sion is used when the dependent variable is binary and multiple predictor or inde-
pendent variables are included (Sperandei 2014). The dependent variable is pre-
sented after a logit function9 transforms the outcome within the possible range of
odds or probabilities (Osborne 2012). To ease the interpretation of results, odds
ratios are provided later in this article.
Second, to better tease out the effect of the Ebola pandemic on the most margin-
alised, I applied a differences-in-differences analysis. Differences-in-differences is
increasingly popular in education policy research (Zhang 2010). It is often used in
“natural” experiments10 to correct the estimate of the treatment effect (Murnane and
Willett 2011). A basic differences-in-differences analysis includes two groups with
observations over two time periods. One group (the treatment group) is exposed to
the treatment during the second time period but not the first. The other group (the
control group) is not exposed to the treatment group during either time period. The
change between the two periods for the control group is then subtracted from the
change for the treatment group (see Table 1). This process increases confidence in
the estimate, because the differences-in-differences analysis provides a linear adjust-
ment to “subtract out” the effect related to change over time, which can threaten the
validity of the results (Murnane and Willett 2011). It ensures that “any variables that
remain constant over time (but are unobserved) that are correlated with the selec-
tion decision and the outcomes variable will not bias the estimated effect” (Buckley
and Shang 2002, p. 1). This includes unobserved, permanent differences between
the treatment and control groups.
In this study the Ebola pandemic was viewed as a natural experiment, with those
in outbreak-stricken countries (Guinea and Sierra Leone) identified as the exposed
or treatment group. Following the work of Liang Zhang (2010) and others (Lavrijsen
and Nicaise 2016; Salinas and Solé-Ollé 2018), I chose a comparable, proximate
region or country as the control group. I selected Côte d’Ivoire, as it borders two of
the most affected countries (Liberia and Guinea), yet did not report a single case of
Ebola (CDC n.d.-b). In addition, similar to Guinea and Sierra Leone, available DHS
or MICS surveys for Côte d’Ivoire were completed directly before and after the pan-
demic, thus covering the necessary time periods.
9
The logit function involves calculating the national logarithm of the odds ratio (Osborne 2012).
10
A “natural” experiment refers to a naturally occurring event that divides the population into exposed
and non-exposed groups (Craig et al. 2017).
13W. C. Smith
To capture the “within group” over time estimates, I employed a linear probability
model. A linear probability model uses ordinary least squares regression11 to predict
the probability of a binary outcome variable. This approach makes it easier to inter-
pret the calculated differences and has been regularly used in differences-in-differ-
ences analysis (for examples, see Avdeev 2020 and Görlitz and Gravert 2018). There
are two primary concerns with a linear probability model. First, it is possible for
predicted probabilities to fall outside of the binary (0 or 1) range of the outcome var-
iable. Second, there is inherent heteroscedasticity,12 which can lead to inconsistent
standard error estimates (Huang 2019). In this analysis, the first concern was not as
pressing, as the main estimate of interest was the differences-in-differences and not
the predicted probability; the second concern was partially mitigated through calcu-
lating robust standard errors during the analysis. Finally, once the last differences-
in-differences estimator is calculated, it is compared to its own standard error to cal-
culate a t-statistic13 and to check for statistical significance (Murnane and Willett
2011) (See Equation 1).
Equation 1: Calculating t-statistic for differences-in-differences analysis
t = differences - in - differences estimate
√[
( )2 ( )2 ( )2 ( )2 ]
÷ standard errortreatment;time 1 + standard errortreatment;time 2 + standard errorcontrol;time 1 + standard errorcontrol;time 2
(1)
There are two key assumptions underlying a differences-in-differences approach.
First, it is assumed that there are no other time-varying factors affecting the out-
come once change in time has been controlled by subtracting it out in the analysis.
Second, it is assumed that the effect of time is “group-invariant”, suggesting that
without the treatment, the same change over time is expected in both the control and
treatment groups (Zhang 2010).
Results
The 2013–2016 Ebola pandemic and school enrolment patterns
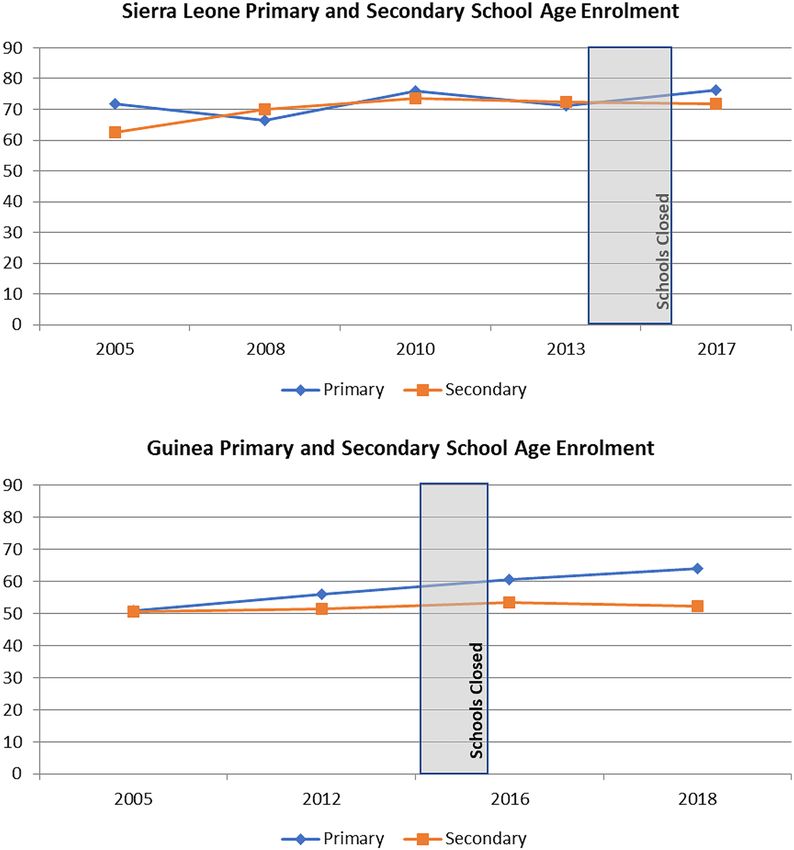
Figure 1 overlaps school closures during the Ebola pandemic with enrolment rates
of school-age youth in Sierra Leone and Guinea between 2005 and 2018. The World
Health Organization (WHO 2014a) reports that the first case of Ebola in Sierra
Leone occurred in May 2014. Schools throughout the country shut down immedi-
ately thereafter in June 2014 and remained closed until March 2015 (UNDP 2015).
11
Ordinary least squares regression is the most commonly used type of regression. It uses the small-
est sum of squared deviations from a regression line to provide a prediction of Y for a given value of X
(Urdan 2010).
12
Heteroscedasticity refers to a situation where the error variance across the identified sample differs
systematically instead of randomly.
13
A t-statistic is commonly used for identifying whether differences between sample means are statisti-
cally significant (Urdan 2010).
13Consequences of school closure on access to education: Lessons…
Fig. 1 School enrolment patterns in Sierra Leone and Guinea by age group and country, pre- and post-
Ebola pandemic
Guinea has been identified as “ground zero” for the outbreak. We now know that
a two-year-old boy from the village of Meliandou was the country’s first case, in
December 2013 (Shultz et al. 2016). However, it was not until March 2014 that
Guinea confirmed that the deadly fever sweeping across one of its regions had been
identified as Ebola (WHO 2014b). Schools were closed in June 2014 and reopened
in January 2015 (UNDP 2015). West Africa was declared Ebola-free in January
2016 (WHO 2016).
Throughout this time period (2005–2018), a larger percentage of primary and
secondary-age youth were enrolled in school in Sierra Leone than Guinea. Since
2005, both primary- and secondary-age enrolment in Sierra Leone and Guinea
increased, albeit slightly. This was likely driven by a reduction in school-age youth
13W. C. Smith
Table 2 Change in dropout rate by age group: Sierra Leone
Year 2013 2017 Change from 2013
(%) (%) (% change)
Primary age
Overall 2.08 2.22 +6.73
Girls 1.91 1.96 +2.62
Boys 2.26 2.49 +10.18
Rural 2.32 2.67 +15.09
Orphan 2.34 3.37 +44.02
Poorest 2.31 3.76 +62.77
Secondary age
Overall 11.76 12.77 +8.59
Girls 14.24 15.12 +6.18
Boys 9.10 10.22 +12.31
Rural 15.30 16.97 +10.92
Orphan 13.47 10.12 –24.87
Poorest 18.71 21.22 +13.42
who had never enrolled in school: from 28.2% to 20.0% in Sierra Leone and from
45.5% to 33.9% in Guinea.
In examining Fig. 1, there is no clear connection between the Ebola pandemic
and school enrolment in either country. When focusing on years directly before
and after the pandemic, however, we can see some small differences in the patterns
by school age group. For example, in both Sierra Leone and Guinea, primary-age
enrolment increased after the pandemic. In contrast, secondary-age enrolment saw
a slight dip in Sierra Leone, from 73.0% in 2013 to 71.8% in 2017, while in Guinea
the gap between enrolment of primary- and secondary-age youth widened during the
pandemic. While this macro-level aggregation of enrolment by country may hint at
a few post-pandemic differences, it tells us nothing about the change in composition
of school attendees.
Dropout rate changes among marginalised groups
To examine how the Ebola pandemic affected the most marginalised, Tables 2 and
3 explore the change in dropout rates by sex, location, orphan status and wealth.
Descriptive statistics included in these tables highlight trends; whether or not these
trends are statistically significant is examined during the inferential analysis (start-
ing with Table 4). Tables 2 and 3 provide information on dropout rates from the
household survey directly before (2013 in Sierra Leone and 2012 in Guinea) and
directly after the pandemic (2017 in Sierra Leone and 2016 in Guinea). Dropout
rates are calculated as a percentage of those who have ever been to school.
In Sierra Leone (Table 2), dropout rates for both primary- and secondary-age
youth increased following the pandemic. Although the dropout rate remained rel-
atively low among the primary age group, some subgroups saw disproportionate
13Consequences of school closure on access to education: Lessons…
Table 3 Change in dropout rate by age group: Guinea
Year 2012 2016 Change from 2012
(% change)
Primary age
Overall 4.02 4.43 +10.20
Girls 4.45 5.25 +17.98
Boys 3.65 3.68 +0.82
Rural 5.63 6.19 +9.95
Orphan 9.31 8.17 –12.24
Poorest 7.79 7.43 –4.62
Secondary age
Overall 20.54 19.04 –7.30
Girls 28.03 25.16 -10.24
Boys 14.15 13.82 –2.33
Rural 26.02 25.78 –0.92
Orphan 27.16 22.03 –18.89
Poorest 29.82 33.07 +10.90
Table 4 Predicting dropout by age group in Sierra Leone and Guinea
Sierra Leone Guinea
Year 2013 2017 Year 2012 2016
Primary age odds ratios Primary age odds ratios
Girls 0.85 0.80* Girls 1.28* 1.55***
Rural 1.37* 1.43** Rural 2.48*** 3.05***
Orphan 1.19 1.69 Orphan 2.83* 2.08
Poorest 1.03 1.81*** Poorest 1.68*** 1.37*
Secondary age odds ratios Secondary age odds ratios
Girls 1.43*** 1.38*** Girls 2.36*** 2.32***
Rural 1.98*** 1.89*** Rural 1.97*** 2.56***
Orphan 1.81*** 1.22 Orphan 1.88** 1.74*
Poorest 1.53*** 1.74*** Poorest 1.46*** 1.87***
Note: ***pW. C. Smith very sensitive to small shifts across surveys and suggests all results related to the orphan category should be interpreted with caution. In Guinea (Table 3), the greatest immediate change in dropout rate occurred in primary-age students and, relative to the overall change in dropout rate for that age group (10.20% increase), only girls saw an excessive increase in dropout rate (17.98% increase). The other increase of over 10% was found among the poorest secondary-age youth. Immediately following the Ebola pandemic, the dropout rate for individuals in this category increased by 10.90% (relative to a 7.30% decrease in overall secondary dropout rate). Taken together, the results from Tables 2 and 3 suggest that youth in the poorest households saw the largest increase in post-pandemic dropout rates. Those in rural areas were also susceptible to disruptions, while gender differences seemed to vary by country and age group. Finally, the Ebola pandemic appears to have done more harm to the dropout rate in Sierra Leone than in Guinea. Table 4 uses logistic regression to predict who was likely to drop out pre- and post-pandemic in Sierra Leone and Guinea. As girls, youth in rural areas, orphans and those in the poorest quintile represent traditionally marginalised groups in each country, it is not surprising that most odds ratios are above 1.00 and significant, sug- gesting that these students were more likely than the relative reference categories to drop out. Looking at differences in odds ratios before and after the Ebola pandemic can draw attention to additional vulnerability experienced by groups. The results reinforce those found in Tables 2 and 3, suggesting that the poorest were the hardest hit. For primary-age youth in the bottom wealth quintile in Sierra Leone, the odds that they would drop out increased from 1.03 times greater than all other youth (not significantly different) to 1.81 times greater (p
Consequences of school closure on access to education: Lessons…

Fig. 2  Probability of dropping out for secondary-age youth from the poorest families by country, pre-
and post-pandemic. Note: Probability estimates control for sex, orphan status and location

countries (Guinea and Sierra Leone) and the control country (Côte d’Ivoire). Pre-
outbreak, Côte d’Ivoire had the highest probability, with nearly 1 in 10 secondary-
age youth from poor families predicted to drop out. Over time, the predicted prob-
ability has decreased for this group. Both Guinea and Sierra Leone stand in sharp
contrast to Côte d’Ivoire. In the two countries affected by the pandemic, secondary-
age youth from the poorest households were less likely to drop out pre-outbreak.
However, directly following the pandemic, predicted probabilities increased, nearly
doubling from 6% to 11% in Guinea.
   The differences-in-differences approach removes the expected effect due to
change over time from the treatment effect. This is done through taking two differ-
ences, as detailed in Table 5. Given the patterns present in Fig. 2, it is not surpris-
ing that the differences-in-differences estimate of the effect of the Ebola pandemic
on the probability of poorer secondary-age youth dropping out is actually higher
than the observed first-order difference. The results suggest that the pandemic was
associated with an 8.6 percentage point increase in the probability of the poorest
secondary-age youth in Guinea dropping out, and a 5.6 percentage point increase in
Sierra Leone.
   To examine what these numbers mean in practice, I used the pre- and post-pan-
demic dropout rates for both countries to estimate the net decrease in enrolment
numbers among the poorest youth. In Sierra Leone, the increased dropout rates were
exacerbated by the shift in overall poverty towards youth after Ebola (see Table 6).
Changes in dropout rates among the poorest in Sierra Leone indicate that approxi-
mately 4,530 more primary-age youth and 5,770 more secondary-age youth in the

                                                                                         13
13
Table 5 Differences-in-differences estimate of the impact of the Ebola pandemic on whether secondary-age youth from the poorest households would drop out of school
Country Pre-/post-pandemic Affected by Probability of poorest secondary-age Between-group differ- Differences-in-differences Differences-in-dif-
the pandemic? youth dropout (standard error) ences in probabilities estimate (standard error) ferences p-value+
Guinea Pre-pandemic Yes 0.060 0.047 0.086 0.026**
(0.025) (0.044)
Guinea Post-pandemic Yes 0.108
(0.024)
Côte d’Ivoire Pre-pandemic No 0.095 –0.039
(0.022)
Côte d’Ivoire Post-pandemic No 0.056 0.056 0.038**
(0.016) (0.032)
Sierra Leone Pre-pandemic Yes 0.046 0.017
(0.012)
Sierra Leone Post-pandemic Yes 0.064
(0.012)
Note: Linear probability model controlling for sex, location and orphan status. Côte-d’Ivoire used as control country for separate differences-in-differences estimates for
Guinea and Sierra Leone. ** pConsequences of school closure on access to education: Lessons…
Table 6 Descriptive statistics for Sierra Leone and Guinea
Sierra Leone: School age 6 to 18
Year 2005 2008 2010 2013 2017
Survey MICS DHS MICS DHS MICS
School age 14,384 14,926 22,451 25,749 24,413
(total
sample)
Primary age 7,786 8,074 11,765 13,795 13,159
Secondary 6,598 6,852 10,686 11,954 11,254
age
Currently 67.49% 68.69% 74.87% 72.27% 74.22%
enrolled
Dropout 4.32% 3.85% 4.91% 5.33% 5.78%
Never 28.19% 27.46% 20.22% 22.40% 20.00%
enrolled
Girls 47.85% 48.97% 49.46% 49.84% 50.06%
Boys 52.15% 51.03% 50.54% 50.16% 49.94%
Rural 68.81% 57.52% 66.45% 62.36% 63.36%
Urban 31.19% 42.48% 33.55% 37.64% 36.64%
Orphan 2.73% 2.61% 2.64% 2.48% 2.51%
Non-orphan 97.27% 97.39% 97.36% 97.52% 97.49%
Wealth 19.24% 16.55% 18.45% 18.05% 23.09%
quintile 1
(poorest)
Wealth 18.29% 18.08% 18.99% 17.72% 22.83%
quintile 2
Wealth 19.13% 18.38% 19.27% 19.56% 23.22%
quintile 3
Wealth 20.95% 22.54% 21.28% 24.67% 16.21%
quintile 4
Wealth 22.40% 24.45% 22.01% 20.00% 14.65%
quintile 5
(wealthiest)
Guinea: School age 7 to 19
Year 2005 2012 2016 2018
Survey DHS DHS MICS DHS
School age 12,961 15,310 15,447 16,865
(total
sample)
Primary age 7,671 8,741 8,736 9,562
Secondary 5,290 6,569 6,711 7,303
age
Currently 50.98% 54.20% 57.27% 58.94%
enrolled
Dropout 3.49% 7.07% 7.05% 7.18%
Never 45.53% 38.74% 35.38% 33.88%
enrolled
Girls 50.03% 50.49% 49.37% 50.61%
Boys 49.97% 49.51% 50.63% 49.39%
Rural 68.58% 63.93% 63.97% 62.80%
Urban 31.42% 36.07% 36.03% 37.20%
Orphan 1.66% 1.63% 1.41% 1.41%
Non-orphan 98.34% 98.37% 98.59% 98.59%
Wealth 17.75% 20.40% 21.49% 19.31%
quintile 1
(poorest)
Wealth 19.82% 18.31% 19.39% 18.36%
quintile 2
Wealth 19.74% 19.95% 20.54% 19.65%
quintile 3
Wealth 23.15% 23.10% 20.02% 23.05%
quintile 4
Wealth 19.54% 18.24% 18.56% 19.62%
quintile 5
(wealthiest)
13W. C. Smith
bottom wealth quintile dropped out of school than would have been expected pre-
outbreak. In Guinea, the impact of the Ebola pandemic on the poorest secondary-age
youth was an additional 11,640 dropouts.
Discussion and potential lessons for the COVID‑19 pandemic
During the 2013–2016 Ebola pandemic in Guinea and Sierra Leone, changes in
school enrolment appear to be disproportionately concentrated among secondary
students in poorer families and in rural areas. Although there is no clear overall dis-
continuity in enrolment patterns at the national level, disaggregating and investigat-
ing proclivity to drop out indicates that marginalised groups were substantially influ-
enced by the pandemic and associated school disruptions. In practice, this leads to
expanding inequality in access for those in poor households.
The results from the study I have presented here suggest that secondary-age youth
may be particularly vulnerable to school disruptions. Comparing pre- and post-pan-
demic estimates, the probability that secondary-age youth from the poorest families
would drop out increased by 5.6 percentage points in Sierra Leone and 8.6 percent-
age points in Guinea. This may be due, in part, to older youth having taken on addi-
tional paid labour during the Ebola shutdowns. In Sierra Leone, many of the 3 mil-
lion children in affected communities engaged in economic activity for household
survival (Government of Sierra Leone 2015). Children reported increased pressure
to participate in ways of supporting their families (Hallgarten 2020), and these new
responsibilities may have been retained given the corresponding economic crisis
many experienced. In Guinea, the impact on the most marginalised further exac-
erbated challenges for this vulnerable group in accessing school. Relative to Sierra
Leone, the low enrolment numbers pre-outbreak in Guinea suggest that the most
marginalised population have yet to access education.
Limited findings specific to orphans and girls were surprising, given the past
literature suggesting that both groups were significantly negatively affected by the
Ebola pandemic. For orphans, this may be due to how the group was defined. While
a large number of children lost one parent to Ebola, limiting the definition of an
orphan to a youth without both biological parents severely reduced the sample size.
This led to more imprecise results that were prone to fluctuations. In addition, while
many young people were orphaned during the crisis, some research suggests that
dropout prevention programmes targeting orphans in Sierra Leone have been effec-
tive (Hallgarten 2020).
For girls, it is well documented that teen pregnancies rose in Sierra Leone dur-
ing the pandemic, with estimates of new teenage pregnancies ranging from 14,000
to 20,000 (Parnebjork 2016). Directly following the resumption of education in the
country, the Minister of Education forbade visibly pregnant girls from re-enrolling;
this ban on attendance for pregnant teenagers was not lifted until 2020 (BBC 2020).
So why have household surveys not captured this rise in school dropouts? It may be
due to the level of detail in which the questions are asked. Both the DHS and the
MICS ask about school attendance during the current year, but do not define what a
school is. After the Minister of Education in Sierra Leone banned re-enrolment for
13Consequences of school closure on access to education: Lessons…
pregnant girls, a parallel route to education through non-formal learning centres was
established; 14,500 girls were enrolled (Parnebjork 2016), limiting the number of
dropouts as defined in the current study. Finally, while the differences-in-differences
approach allows us to more confidently claim an observed effect, it is general to
the Ebola pandemic. Thus, differences in dropout rate cannot be directly attributed
solely to school closures and are likely to be influenced by multiple compounding
challenges brought by the pandemic. Future research should target cohorts that were
in the more vulnerable category (e.g. secondary-age youth from the poorest house-
holds) when the outbreak hit and use longitudinal data to follow their post-pandemic
path to more clearly illustrate long-term effects.
Before exploring what education planners preparing for school restarts during the
COVID-19 pandemic can learn from the Ebola pandemic, we need to compare the
two diseases. As the focus is on school-age populations, lessons are more likely to
be transferable if the diseases have similar youth infection rates, case fatality rates
and modes of transmission. During the Ebola pandemic, infections were concen-
trated in young adults. In Sierra Leone, the two most infected age groups were
25–29 year-olds and 15–19 year-olds (Amara et al. 2017). Across West Africa, 20%
of Ebola cases occurred in children below the age of 15 (CDC 2015). The disease
is transmitted through direct contact with infected skin, blood or other bodily fluids;
this includes the shedding of infected cells left on clothing or bedding (Shultz et al.
2016). Individuals have to be symptomatic to be infectious (Berry and Davis 2020),
and they remain infectious as long as the virus is present, for up to 61 days (Shultz
et al. 2016). The case fatality rate for Ebola is high, making it a greatly feared dis-
ease. Across the 2013–2016 Ebola pandemic, 39.5% of those infected died; in Sierra
Leone the rate was 28% and in Guinea, 66.7% (Shultz et al. 2016). Finally, survivors
are immune to that strand of Ebola for at least ten years (ibid.).
What we are learning about COVID-19 is rapidly changing. At the time of writ-
ing, there is evidence to suggest that the infection rate among youth may be lower.
Ten per cent of global cases have been in the 15 to 29 age group, and those below
age 15 have made up less than 2% of total cases (WHO 2020a). Exploring age-spe-
cific cases across six countries, Nicholas Davies and colleagues (2020) found that
those under the age of 20 were only half as susceptible to infection as those over
20. In Iceland and Japan, children with extended exposure to the virus were less
likely to test positive than similarly exposed adults (Crawfurd et al. 2020b). The
virus is transmitted through direct contact with infected persons and through drop-
lets expelled when coughing, sneezing or talking (Rothan and Byrareddy 2020),
allowing it to spread rapidly. Infected individuals are not always symptomatic. This
is especially true in youth, where nearly 80% of infected 10–19-year-olds across 32
geographic settings were either asymptomatic or displaying symptoms at a sub-clin-
ical level (Davies et al. 2020). Asymptomatic carriers can still transmit the virus,
but the efficiency of transmission relative to those displaying symptoms is currently
unclear. The global case fatality rate for COVID-19 is 5.33% as of 18 June 2020
(Worldometer 2020); however, mortality appears heavily concentrated in the older
population. While the global median age for cases is 55, the median age of death is
81, with less than 2% of total deaths occurring before the age of 40 (WHO 2020a).
Finally, it is unclear whether immunity, if any, is present in survivors (WHO 2020b).
13W. C. Smith Differences between Ebola and COVID-19 suggest that personal hygiene measures are essential for school reopening; however, “social” (physical) distancing has only been necessary during the COVID-19 pandemic (Berry and Davis 2020). Ebola is easier to identify and isolate. As youth with COVID-19 are disproportionately asymptomatic, there is increased uncertainty as to whether infected individuals are attending school. The fear over the significant Ebola case fatality rate may have deterred individuals from attending school, but could have also prompted action as people recognised the severity of the situation and adjusted their behaviour accord- ingly. In contrast, the relatively mild mortality rate in youth with COVID-19, com- bined with its more asymptomatic display, may lead to false confidence that indi- viduals are beyond harm. For education planners, this suggests that families may be more comfortable returning to school post-COVID-19 relative to the Ebola pandemic. Children are less likely to feel or look sick and, with mortality concentrated in the elderly, young peo- ple are less likely to be orphaned during the current pandemic. This could reduce the stigmatisation that kept some students in West Africa from re-enrolling post-Ebola (Hallgarten 2020). The safety and condition of facilities may also deter the return to school. If parents are not certain that school is a secure place for their children, they may decide to wait. Additionally, some schools may be in a state of disrepair follow- ing a long shutdown. This could be especially true in rural areas. Social distancing measures may also discourage students from returning, or push them out of school once they have arrived. Distance-related policies put in place after the Ebola pan- demic restricted class sizes and led to increased private school enrolment, further impacting the poorest students (Santos and Novelli 2017). Challenges for the poorest and most marginalised students have likely been compounded during the COVID-19 shutdowns. Negative indirect consequences of school closures (Berkman 2008), such as increased physical abuse and sexual exploitation (Hallgarten 2020; Roberton et al. 2020; van der Berg and Spaull 2020), and disproportionate engagement with remote learning (Giannini 2020; Herold 2020), may accelerate the exit of youth from the educational system. To mitigate the impact of the COVID-19 pandemic on those poorer students most likely to drop out, a comprehensive, long-term package of financial support is needed. Targeted approaches may include cash transfers for the most vulnerable, increased provision of school meals, and decreased or eliminated school fees (Carvalho et al. 2020). As the COVID-19 health crisis is compounded by and accelerates an economic crisis, the additional investment in education necessary to ensure those most at risk return to school may be difficult. Immediately following crises, recovery efforts tend to focus on areas such as health and sanitation over education (Hallgarten 2020). Gov- ernments will also be short on funds, forcing public sector cuts, including furlough- ing teachers and closing public institutions (Ibqal et al. 2020). Yet, if governments and education planners do not recognise the effects of the current pandemic on the most marginalised young people, and provide the necessary resources to ensure their return to school, the COVID-19 pandemic will certainly have long-term intergenera- tional impacts as inequality in access to education grows. 13
Consequences of school closure on access to education: Lessons…
Conclusion
School closures have been one of multiple societal disruptions during the COVID-19
pandemic. Reopening is likely to occur sporadically as school leaders tackle localised
outbreaks and work to keep students and staff safe. Upon resumption, schools face
a new reality with plans calling for reduced class sizes, staggered start times and
limited interaction to permit social distancing. Closures during a large-scale health
crisis are not simply a pause in learning, but an experience that is disproportionately
detrimental to those on the margins. Learning gaps will widen, as ad hoc emergency
attempts to set up remote learning during school closures have largely evaded the
most marginalised and, in scanning the faces in the room, we will need to ask our-
selves who is missing. The results from this study of the 2013–2016 Ebola pan-
demic suggest that the answer to that question is likely to be older (secondary-age)
students from the poorest households. Recovery for these students is unlikely to be
successful if all attention and resources are solely directed toward plans focusing
on the immediate needs of schools and students. Instead, persistent efforts must be
made that include comprehensive financial support packages to aid the return of the
most marginalised and mitigate the impending expansion in inequality.
Acknowledgements The author would like to thank USAID for granting access to DHS survey data and
UNICEF for granting access to MICS survey data, as well as Rosa Vidarte and Adaiah Lilenstein for their
expert advice on household survey design and analysis.
Open Access This article is licensed under a Creative Commons Attribution 4.0 International License,
which permits use, sharing, adaptation, distribution and reproduction in any medium or format, as long as
you give appropriate credit to the original author(s) and the source, provide a link to the Creative Com-
mons licence, and indicate if changes were made. The images or other third party material in this article
are included in the article’s Creative Commons licence, unless indicated otherwise in a credit line to the
material. If material is not included in the article’s Creative Commons licence and your intended use is
not permitted by statutory regulation or exceeds the permitted use, you will need to obtain permission
directly from the copyright holder. To view a copy of this licence, visit http://creativecommons.org/licen
ses/by/4.0/.
References
Amara, M. M., Tommy, F., & Kamara, A. H. (2017). Sierra Leone 2015 Population and housing census:
Thematic report on socio-economic impact of the Ebola virus disease. Freetown: Statistics Sierra
Leone. Retrieved 1 June 2020 from https://sierraleone.unfpa.org/sites/default/files/pub-pdf/EVD%
20report.pdf.
Andrabi, T., Daniels, B., & Das, J. (2020). Human capital accumulation and disasters: Evidence from the
Pakistan earthquake of 2005. RISE Working Paper Series, 20/039. https://doi.org/10.35489/BSG-
RISE-WP_2020/039.
Avdeev, S. (2020). Zero returns to higher education: Evidence from a natural experiment. Basic Research
Program Working Papers, WP BRP 236/EC/2020. Moscow: National Research University Higher
School of Economics. Retrieved 8 March 2021 from https://wp.hse.ru/data/2020/09/22/15845
05319/236EC2020.pdf.
Bangkok ADPC (Asian Disaster Preparedness Center). (2008). Impact of disasters on the education sec-
tor in Cambodia. Bangkok: Asian Disaster Preparedness Center (ADPC). Retrieved 1 June 2020
from https://www.preventionweb.net/files/15375_mdrdeducationcambodiafinalmar08.pdf.
13You can also read