Motor Vehicle Safety: Issues for Congress - Updated July 31, 2020 - Federation of ...
←
→
Page content transcription
If your browser does not render page correctly, please read the page content below
Motor Vehicle Safety: Issues for Congress

Updated July 31, 2020

                               Congressional Research Service
                                https://crsreports.congress.gov
                                                       R46398
SUMMARY
R46398
Motor Vehicle Safety: Issues for Congress
July 31, 2020
Vehicle safety is a significant issue as Congress considers a replacement for the current
authorization of surface transportation programs, the Fixing America’s Surface Transportation Bill Canis
Act (FAST Act; P.L. 114-94), which expires at the end of FY2020. On July 1, 2020, the House of Specialist in Industrial
Representatives passed an infrastructure and surface transportation bill, the Moving Forward Act Organization and Business
(H.R. 2), including provisions that seek to improve motor vehicle safety. A corresponding bill
has not advanced in the Senate.
Responsibility for motor vehicle safety lies with the National Highway Traffic Safety
Administration (NHTSA) within the U.S. Department of Transportation (DOT). The agency’s performance has been
controversial, in part because of its handling of the largest-ever recall, involving more than 63 million Takata airbags; since
the recall was ordered in 2015, nearly 16 million potentially defective airbags have not been replaced. NHTSA has been
without a Senate-confirmed administrator since 2017.
Under federal law, NHTSA has the power to promulgate standards for cars and light trucks. The combination of new vehicle
designs, greater vehicle automation, and federal standards—including those for seat belts, airbags, hood and door latches, and
children’s car seats—has contributed to a reduction in the fatality rate by 80% over the past six decades. NHTSA does not
approve vehicles before they are manufactured, but may order or encourage a vehicle or parts manufacturer to recall products
that violate its standards.
Among the vehicle safety issues Congress may address in the reauthorization process are:
Recall compliance rates. According to NHTSA researchers, the combined annual completion rate for all automakers subject
to a recall between 2010 and 2014 was 67%, meaning that many vehicles with safety defects remain on the road. Congress
may want to consider additions or modifications to 2015 reforms that brought rental car fleets under federal recall
requirements and introduced new methods to contact consumers about pending recalls.
Defect investigations. The DOT Inspector General identified problems at NHTSA’s Office of Defects Investigation in 2015
and 2018. Although recommendations to improve its management of defects investigations appear to have been
implemented, the Trump Administration has sought to reduce spending on vehicle safety and investigations. Congress may
want to examine whether the defect investigation process is adequate.
Pedestrian and bicyclist fatalities. Vehicle crashes causing fatalities and injuries to pedestrians and bicyclists have reached
a 30-year high. H.R. 2 includes a provision requiring that new vehicles include pedestrian crash mitigation systems, a
technology already required in other countries.
Rear seat warnings. Although Congress has previously called for NHTSA to require seat belt warnings in rear seats, such a
regulation has not been issued. In addition, Congress has twice previously called for NHTSA to develop a system to warn
drivers about children inadvertently left unattended in the back seats of parked cars. H.R. 2 would require such warning
systems and would also require new labeling on children’s booster seats.
Driver privacy. The FAST Act’s driver privacy provisions apply only to data recorded just before a crash; similar
protections do not apply to the large volumes of data collected and stored by vehicle computers during normal operations. In
2018, the Secretary of Transportation reported to Congress that requiring storage of data for a longer period prior to a crash
would be appropriate. Congress has not addressed broader questions concerning the ownership and use of data collected
aboard vehicles.
Tires. Congress has previously required a NHTSA database for tire recalls, electronic identification on all new tires, and an
update to tire pressure monitoring standards, but regulations have not been issued.
Unique vehicles. Stretch limousines, amphibious passenger vehicles—called duck boats—and low-volume replica vehicles
have unique configurations and safety issues that Congress may want to address. H.R. 2 addresses stretch limousine safety.
Congressional Research ServiceMotor Vehicle Safety: Issues for Congress
Contents
Introduction ................................................................................................................... 1
Origins of Federal Motor Vehicle Safety Regulation ............................................................. 1
Estimates of Effects of Federal Safety Standards ............................................................ 3
Increase in Pedestrian and Bicyclist Deaths Linked to More SUVs .................................... 5
Many Advanced Technologies Improve Vehicle Safety .................................................... 8
Vehicle Recalls and Defects ............................................................................................ 11
Takata Airbag Recall ................................................................................................ 12
Other Major 2019 Recalls ......................................................................................... 13
Inspector General Report on Recall Process ................................................................. 14
Recall Completion Rates........................................................................................... 14
The 2015 FAST Act and Unresolved Issues ....................................................................... 16
Major Safety Provisions ........................................................................................... 16
Unresolved Safety Issues .......................................................................................... 17
Unaddressed NTSB Recommendations............................................................................. 19
Stretch Limousines .................................................................................................. 20
Motorcycles............................................................................................................ 20
Amphibious Passenger Vehicles ................................................................................. 20
Tires ...................................................................................................................... 21
Pedestrian and Bicycle Safety Systems ....................................................................... 21
Autonomous and Connected Driving Systems ................................................................... 22
Congress Addresses Motor Vehicle Safety......................................................................... 23
The Moving Forward Act.......................................................................................... 23
NHTSA Appropriations ............................................................................................ 24
Figures
Figure 1. Motor Vehicle Traffic Fatalities and Fatality Rates .................................................. 6
Figure 2. Fatality Composition .......................................................................................... 7
Figure 3. Advanced Vehicle Technologies ......................................................................... 10
Figure 4. Motor Vehicle and Equipment Recalls................................................................. 12
Tables
Table 1. NHTSA Vehicle Safety Budget............................................................................ 25
Table A-1. Global Comparison of Road Traffic Fatalities..................................................... 28
Table B-1. Annual Recall Completion Rates by Major Vehicle Manufacturer.......................... 29
Appendixes
Appendix A. Road Traffic Fatalities Abroad ...................................................................... 28
Congressional Research ServiceMotor Vehicle Safety: Issues for Congress Appendix B. Recall Completion Rates.............................................................................. 29 Contacts Author Information ....................................................................................................... 29 Congressional Research Service
Motor Vehicle Safety: Issues for Congress

Introduction
Congress enacted the first vehicle safety legislation even before the U.S. Department of
Transportation (DOT) and its vehicle-safety arm, the National Highway Traffic Safety
Administration (NHTSA), were established more than 50 years ago. Since then, Congress has
delegated major regulatory responsibility to NHTSA while also directing it to give priority to
certain safety actions, such as mandating seat belt warning systems for the back seats of
passenger cars.1 In recent years, the periodic reauthorization of surface transportation programs
has included significant sections on motor vehicle safety. The Fixing America’s Surface
Transportation (FAST) Act, 2 passed in 2015, included new initiatives to improve vehicle safety;
some congressional mandates made in that law have not been completed.
Legislation to reauthorize surface transportation programs beyond the end of FY2020 is currently
under discussion in Congress. On July 1, 2020, the House of Representatives passed H.R. 2, the
Moving Forward Act, which includes provisions seeking to improve motor vehicle safety. 3
Responsibility for highway safety is divided between state and federal governments. While the
states manage driver and vehicle licensing, establish and enforce traffic laws, and build and
maintain highways, the federal government regulates the design of motor vehicles. NHTSA, an
agency within DOT, issues Federal Motor Vehicle Safety Standards (FMVSS) and requires
manufacturers to recall and repair defects in vehicles that fail to meet those standards.
NHTSA’s enforcement of some of its vehicle safety standards is controversial, with its oversight
of recalls of passenger cars with defective airbags now in its fourth year. The airbag recall, the
largest on record, has come in for sharp criticism in Congress. In addition, NHTSA has taken on
responsibility for overseeing the development and testing of autonomous vehicles, even as
Congress has not agreed on legislation that would provide it new regulatory tools. 4 The agency
has not had a permanent administrator confirmed by the Senate since January 2017. This report
examines NHTSA’s role overseeing vehicle design and regulation and highlights issues for
Congress in the context of reauthorization.

Origins of Federal Motor Vehicle Safety Regulation
In the early decades of the automobile, U.S. vehicles were lightly regulated by a combination of
state and private-sector standards. National regulation was generally not seen as appropriate; in
the early 1900s, according to two historians of auto safety, it was widely believed that “the only
useful and politically acceptable action Congress might take was to help the states and localities
construct more and better roads.”5 The Society of Automotive Engineers (SAE), a professional
association founded in 1905, became the primary source of vehicle safety standards for many

1Congress directed NHT SA to develop regulations that would require rear seat belt alerts in the Moving Ahead for
Progress in the 21 st Century Act of 2012 (MAP -21; P.L. 112-141).
2
    P.L. 114-94.
3
    T he Moving Forward Act, T itle II of Division G (Energy and Commerce Committee section).
4
 For a discussion of the issues associated with highly automated vehicles, see CRS Report R45985, Issues in
Autonomous Vehicle Testing and Deployment, by Bill Canis.
5Jerry Mashaw and David Harfst, The Struggle for Auto Safety (Cambridge, MA: Harvard University Press, 1990), pp.
30-31.

Congressional Research Service                                                                                      1
Motor Vehicle Safety: Issues for Congress
decades. State governments often used SAE recommendations to set their own standards for
vehicle brakes, headlamps, and windshield wipers.
A rising number of highway deaths prompted a new interest in vehicle safety: between 1962 and
1964, Congress passed three safety bills into law, including a seat belt regulation. 6 The new laws
were only a precursor to broader federal regulation. Two publications also spurred interest in a
greater federal role. Ralph Nader’s 1965 book, Unsafe at Any Speed: The Designed-in Dangers of
the American Automobile, argued that cars were unnecessarily unsafe and that the auto industry
should be regulated by a federal agency. 7 Also influential was Accidental Death and Disability:
The Neglected Disease of Modern Society, a National Academy of Sciences report that
documented the impact of accidental injuries, including those by motor vehicles. 8
Comprehensive vehicle safety legislation was passed in the form of the National Traffic and
Motor Vehicle Safety Act of 1966. 9 As approved unanimously by both houses of Congress and
signed by President Lyndon B. Johnson, the legislation had two parts:
1. The Highway Safety Act of 1966 mandated that each state put in place a highway
safety program in accordance with federal standards to improve driver
performance, accident records systems, and traffic control.
2. The National Traffic and Motor Vehicle Safety Act of 1966 directed the Secretary
of Commerce (later changed to the Secretary of Transportation when that agency
was established in 1967) to issue safety standards for all motor vehicles
beginning in January 1967. A National Traffic Safety Agency was established to
carry out the provisions of the new law; it was renamed the National Highway
Traffic Safety Administration (NHTSA) in 1970. 10
Since its establishment, NHTSA has issued dozens of safety standards,11 including regulations
affecting windshield wipers, hood latches, tires, brakes, seat belts, and airbags. 12 Proposing,
finalizing, or revising a NHTSA safety regulation can take many years, pursuant to the
Administrative Procedure Act of 1946 (APA).
NHTSA does not verify in advance that motor vehicles and parts comply with its standards.
Instead, the law requires self-certification: “[a] manufacturer or distributor of a motor vehicle or
motor vehicle equipment shall certify to the distributor or dealer at delivery that the vehicle or
equipment complies with applicable motor vehicle safety standards prescribed under this
chapter.... Certification of a vehicle must be shown by a label or tag permanently fixed to the
6
P.L. 87-637 required hydraulic brake fluid used in motor vehicles to meet certain standards established by the
Secretary of Commerce; P.L. 88-201 required the Secretary of Commerce to promulgate safety standards for seat belts;
and P.L. 88-514 required vehicle manufacturers to meet certain minimum safety standards for vehicles sold to the
General Services Administration (GSA) for the federal fleet.
7
Ralph Nader, Unsafe at Any Speed: The Designed-in Dangers of the American Automobile (New York: Grossman,
1965).
8
National Academy of Sciences and National Research Council, Accidental Death and Disability: The Neglected
Disease of Modern Society, 1966, at https://www.ems.gov/pdf/1997-Reproduction-AccidentalDeathDisability.pdf.
9
P.L. 89-563. When he signed the law, President Johnson cited the 50,000 people k illed on U.S. highways as the
biggest cause of death and injury among young Americans. T he White House, “Remarks of the President at Signing of
the Highway Safety Act and the T raffic Safety Act,” press release, September 9, 1966, cited in National Traffic and
Motor Vehicle Safety Act of 1966, Legislative History, vol. 1, p. 31, published by NHT SA in 1985.
10 Highway Safety Act of 1970, P.L. 91-605.
11
T he authority for issuing standards is found in 49 U.S.C. §30111.
12 See https://www.nhtsa.gov/staticfiles/rulemaking/pdf/FMVSS-QuickRefGuide-HS811439.pdf.
Congressional Research Service 2Motor Vehicle Safety: Issues for Congress
vehicle....”13 The self-certification label is affixed to the driver door jamb in all vehicles sold in
the United States.
Manufacturers are responsible for testing their vehicles and are liable for recalls and penalties if
they are later found not to meet FMVSS. After a new model goes on sale, NHTSA buys a
sampling from dealers and tests the vehicles at its own facilities to determine whether they
comply. It also receives consumer complaints about safety-related problems with vehicles. If
NHTSA determines there is noncompliance with its standards, it can encourage the manufacturer
to recall the model to correct the problem, or it can order a recall. 14 NHTSA maintains a
comprehensive database about motor vehicle crashes to inform proposed standards and to identify
vehicles potentially requiring recall. 15
Estimates of Effects of Federal Safety Standards
A NHTSA study estimated that passenger vehicle safety technologies associated with FMVSS
saved 613,501 lives between 1960 and 2012. 16 The study evaluated the effects of 31 motor
vehicle technologies mandated by NHTSA, including front disc brakes, electronic stability
control, seat belts, airbags, and side door beams. 17 It estimated that, taking account of rising
vehicle miles traveled (VMT), the risk of a fatality in 2012 was 56% lower than in 1960, based on
evaluation of the effectiveness of specific technologies in reducing occupant fatalities. 18
The NHTSA report found seat belts, introduced in the late 1960s, to have been responsible for
more than half of all the lives saved, 329,715, and that their effectiveness rose sharply after
NHTSA required installation of combined lap and shoulder belts in place of simple lap belts in
1974. 19 However, the study also highlighted the importance of other measures in addition to
federal vehicle safety regulation: it estimated that the number of lives saved annually by seat belts
rose from 800 to 6,000 after many states allowed police to issue tickets if a driver or passengers
were not wearing seat belts. Every state but New Hampshire has enacted laws requiring seat belt
use. 20
The full benefits of new federal safety standards may take many years to be felt. The passenger
vehicle fleet turns over slowly: the average age of light vehicles on the road in 2019 was 11.8
13P.L. 89-563, 49 U.S.C. §30115.
14NHT SA, Motor Vehicle Safety Defects and Recalls: What Every Vehicle Owner Should Know, at https://www-
odi.nhtsa.dot.gov/recalls/documents/MVDefectsandRecalls.pdf.
15
NHT SA’s data analysis and research are managed by its National Center for Statistics and Analysis (NCSA) and
Office of Vehicle Safety Research, https://www.nhtsa.gov/research-data; NHT SA maintains the Fatality Analysis
Reporting System (FARS), which records factors of fatal crashes such as location, time and circumstances of the crash,
type of vehicle, passengers involved, and vehicles’ movements leading to the crash.
16 T he study evaluated technologies in cars, sport utility vehicles (SUVs), pickup trucks, minivans, and full-size vans.
C. J. Kahane, Lives Saved by Vehicle Safety Technologies and Associated Federal Motor Vehicle Safety Standards,
1960 to 2012, NHT SA, DOT HS 812 069, January 2015.
17
Side door beams are anti-intrusion bars that protect passengers from side impacts.
18
C. J. Kahane, Lives Saved by Vehicle Safety Technologies and Associated Federal Motor Vehicle Safety Standards,
1960 to 2012, NHT SA, DOT HS 812 069, January 2015, p. xii.
19 Centers for Disease Control and Prevention (CDC), Injury Prevention & Control: Motor Vehicle Safety, viewed
March 9, 2017, at https://www.cdc.gov/motorvehiclesafety/calculator/factsheet/seatbelt.html.
20
Other major technologies and the cumulative lives saved as identified in the NHT SA study were steering wheel
assemblies (79,989), frontal airbags (42,856), door locks (42,135) , and side impact protection (32,288). C. J. Kahane,
Lives Saved by Vehicle Safety Technologies and Associated Federal Motor Vehicle Safety Standards, 1960 to 2012 ,
NHT SA, DOT HS 812 069, January 2015.
Congressional Research Service 3Motor Vehicle Safety: Issues for Congress
years, compared with 8.9 years in 2000. 21 Although electronic stability control was introduced as
standard equipment on one make of vehicle in 1998 and was subsequently adopted on some other
makes, only 22% of light vehicles on the road were equipped with the technology in calendar
year 2012. FMVSS required electronic stability control to be included in all new vehicles starting
in model year 2012. The NHTSA study estimated that more than 1,362 lives may be saved
annually when all vehicles on the road utilize the technology, but this will not occur for a couple
of decades.
Several elements of traditional motor vehicle safety are being called into question by recent data,
perspectives on earlier studies, and new technologies.
Safety goals have focused on making drivers and passengers safer inside vehicles, but recent
increases in traffic deaths outside the vehicle—of pedestrians and bicyclists—have raised
questions about the effectiveness of current highway safety policies and programs : in 2018, 34%
of highway fatalities were of those outside of vehicles, an increase from 20% in 2000. 22
An often-cited statistic that “the major factor in 94% of all fatal crashes is human error”23 is
sometimes interpreted incorrectly to mean that nearly all crashes are due to driver error. The
extensive NHTSA survey from which these data are drawn—the National Motor Vehicle Crash
Causation Survey (NMVCCS)—does not draw that conclusion. That study, authorized by
Congress 24 to better understand events leading up to motor vehicle crashes and assist in
developing and evaluating crash avoidance technologies, was conducted from 2005 to 2007,
collecting and analyzing data and events from nearly 7,000 light vehicle crashes. 25 The
researchers evaluated data elements related to drivers, vehicles, highways, and the surrounding
environment of the crash sites, determining that of the crashes evaluated,
36% involved vehicles that were turning or crossing intersections;
22% involved a vehicle that ran off the edge of the road;
11% involved a vehicle that did not stay in the proper lane;
12% involved a stopped vehicle; and
9% resulted when a driver lost control of a vehicle.
In an important finding that qualifies the causes of vehicle crashes, the NHTSA researchers
reported that the investigated accidents typically involve a causal chain of events that may be
attributed to the driver (distraction or speeding), the vehicle (tires, brakes or other malfunctions),
the roadway (poor design or wet road surfaces), or atmospheric conditions (rain, snow, sun
glare). 26 In a 2015 NHTSA report further analyzing the NMVCCS data, researchers noted that a
“critical reason” for the crashes in the survey “was assigned to the driver in an estimated 94% of
21
Bureau of T ransportation Statistics, Average Age of Automobiles and Trucks in Operation in the United States, at
https://www.bts.gov/content/average-age-automobiles-and-trucks-operation-united-states.
22 NHT SA, Traffic Safety Facts 2000, p. 18.
23
Department of T ransportation, Automated Driving Systems 2.0: A vision for Safety, Introductory Message by DOT
Secretary Elaine Chao, September 2017, p. i, at https://www.nhtsa.gov/sites/nhtsa.dot.gov/files/documents/13069a-
ads2.0_090617_v9a_tag.pdf.
24 Section 2003(c), Safe, Accountable, Flexible, Efficient. T ransportation Equity Act: A Legacy for Users (SAFET EA -
LU; P.L. 109-59).
25
Light vehicles include passenger cars, crossover vehicles, SUVs, and pickup trucks. NHT SA, National Motor
Vehicle Crash Causation Survey, DOT HS 811 059, July 2008, at https://crashstats.nhtsa.dot.gov/Api/Public/
ViewPublication/811059.
26 Ibid., p. 10.
Congressional Research Service 4Motor Vehicle Safety: Issues for Congress the crashes,”27 but that “the critical reason … is not intended to be interpreted as the cause of the crash....”28 The 2015 NHTSA report went further and stated that “in none of these cases was the assignment intended to blame the driver for causing the crash.”29 This reading of the NMVCCS findings may call into question forecasts that fully autonomous vehicles could nearly eliminate fatalities, as NMVCCS findings would indicate that adverse weather conditions, malfunctioning vehicle parts, and poor highway design will remain factors in motor vehicle fatalities even when fully autonomous vehicles are in use in the future. 30 Increase in Pedestrian and Bicyclist Deaths Linked to More SUVs Despite safety improvements over past decades, many drivers, passengers, and pedestrians are killed annually in motor vehicle accidents: in 2018, 36,560 fatalities occurred on U.S. roads. The number of annual fatalities from motor vehicle accidents has declined by 28% since the first federal vehicle safety law was enacted in 1966. However, the downward trend was interrupted with fatality increases from 2015 and 2016, then declined slightly in 2017 and 2018. It is thought that possible explanations for the increase in fatalities included more driving because of lower gasoline prices, speeding, alcohol and drug-impaired driving, and driver distractions. 31 When fatalities are viewed in the context of the expanded amount of driving that has taken place in the past 50 years, however, the fatality rate has dropped by nearly 80%, from 5.50 deaths per 100 million vehicle miles traveled (VMT) in 1966 to 1.13 deaths per 100 million VMT in 2018 (Figure 1). 32 27 NHT SA, Critical Reasons for Crashes Investigated in the National Motor Vehicle Crash Causation Survey , DOT HS 812 115, February 2015, https://crashstats.nhtsa.dot.gov/Api/Public/ViewPublication/812115. 28 Ibid. 29 Ibid. 30 NHT SA is planning to develop a new crash causation survey to further examine the issues behin d such accidents. U.S. Department of T ransportation, Fiscal Year 2021: National Highway Traffic Safety Administration , p. 69, at https://www.transportation.gov/mission/budget/nhtsa-cj-fy-2021-estimates. 31 Beckie Strum, “U.S. T raffic Fatalities Continued to Surge in First Half of 2016,” Wall Street Journal, August 23, 2016, at https://www.wsj.com/articles/u-s-traffic-fatalities-continued-to-surge-in-first-half-of-2016-1471967127. 32 Vehicles Miles T raveled is a transportation term that estimates the number of miles traveled by all vehicles nationally in a one-year period. In 1966, when the fatality rate was at 5.50 per 100 million VMT , the nation’s total vehicle miles traveled were 925 billion. In 2018, when the fatality rate had dropped to 1.13 per million VMT , total miles traveled had risen to 3.2 trillion. NHT SA, 2018 Traffic Safety Facts, DOT HS 812 826, October 2019, p. 2, at https://crashstats.nhtsa.dot.gov/Api/Public/ViewPublication/812826. Congressional Research Service 5
Motor Vehicle Safety: Issues for Congress

                   Figure 1. Motor Vehicle Traffic Fatalities and Fatality Rates

     Source: (NHTSA, Trends, Table 2, Persons Killed and Fatality Rates, 1966-2017, https://cdan.nhtsa.gov/tsftables/
     tsfar.htm#. Data for 2018 from NHTSA, Traffic Safety Facts, DOT HS 812 826, October 2019, p. 2.
     Note: VMT refers to Vehicle Miles Traveled.

Among other major countries, U.S. traffic fatalities are higher than most other developed
countries, but below the global average (see an excerpt from the 2018 World Health Organization
(WHO) report in Appendix A). The WHO asserts that the development and enforcement of
vehicle safety standards are important components of any country’s strategy for reducing motor
vehicle-related fatalities, yet only 40 countries—the United States is not among that group—have
implemented most of the United Nations priority vehicle safety standards. 33 WHO data suggest
that the developed countries with the lowest fatality rates are those that have adopted more of the
UN vehicle standards. 34 According to the WHO, “Vehicle safety is increasingly critical to the
prevention of crashes and has been shown to contribute to substantial reductions in the number of
deaths and serious injuries on the roads. Features such as electronic stability control and advanced
braking are examples of vehicle safety standards that can prevent a crash from occurring.…”35
Nearly two-thirds of U.S. vehicle fatalities in 2018 were occupants of passenger cars and light
trucks, with the remainder being occupants of large trucks, buses, or motorcycles; pedestrians; or
bicyclists (Figure 2). Pedestrian and bicyclist fatalities rose 3.4% and 6.3%, respectively, in 2018

33
   T he priority UN vehicle safety standards call for countries to establish rules on frontal and side impact protection;
electronic stability control; pedestrian front protection; seat belts and anchorages; child restraints; and motorcycle
antilock braking systems. T he priorities are developed by the United Nations World Forum for Harmonization of
Vehicle Regulations, part of the UN Economic Commission for Europe (UNECE); see https://www.unece.org/trans/
main/wp29/meeting_docs_wp29.html.
34
   Among the countries with lower fatality rates that were shown to have adopted at least four of the UN vehicle
standards were Australia, France, Germany, Japan, and the United Kingdom.
35World Health Organization, Global Status Report on Road Safety, 2018, p. 58, at https://www.who.int/publications-
detail/global-status-report-on-road-safety-2018.

Congressional Research Service                                                                                              6
Motor Vehicle Safety: Issues for Congress
(when compared to 2017), reaching the highest levels since 1990. 36 The composition of vehicles
on the road may be a factor in the increasing numbers of pedestrian and bicyclist deaths. U.S.
vehicle buyers are increasingly opting for light trucks, a category that includes crossovers, sport-
utility vehicles (SUVs), and pickup trucks; such vehicles accounted for 72% of light-vehicle sales
in 2019, up from 50% in 2010. 37 The Governors Highway Safety Association has noted that the
number of pedestrian fatalities involving SUVs increased 50% from 2013 to 2017, while the
number involving passenger cars increased 30%. 38
Figure 2. Fatality Composition
Source: NHTSA, 2018 Traffic Safety Facts, DOT HS 812 826, October 2019, p. 2.
Notes: Light trucks include most crossovers, SUVs, and all pickup trucks.
An April 2020 report by the Government Accountability Office (GAO) sheds additional light on
the role larger vehicles—in particular SUVs—may play in rising pedestrian fatalities. 39 GAO
analyzed a decade of data (from 2008 through 2018) in three NHTSA crash and accident
databases, finding that number of fatalities in accidents involving SUVs increased by 68% during
the decade studied, the number involving light trucks by 25%, and the number involving
passenger cars by 47%.40 GAO found that there were more pedestrian fatalities involving SUVs
because (1) more SUVs are on the road than in the past and (2) pedestrians struck by bigger
vehicles with greater mass are more likely to experience serious injuries or fatalities. 41
36 In 2018, 6,283 pedestrians and 857 bicyclists were killed in motor vehicle-related accidents. Ibid., p. 3.
37 Ward’s Intelligence Data Center, North America Vehicle Sales by Vehicle Type, 2000 -2019, viewed May 1, 2020.
38
Governors Highway Safety Association, Pedestrian Traffic Fatalities by State: 2018 Preliminary Data , February
2019, p. 4.
39 U.S. Government Accountability Office, Pedestrian Safety, GAO-20-419, April 23, 2020, https://www.gao.gov/
products/GAO-20-419.
40
Other factors contributing to the higher fatalities included older vehicles and higher vehicle speeds. Ibid., p. 13.
41 Ibid., p. 16.
Congressional Research Service 7Motor Vehicle Safety: Issues for Congress
Technologies exist that could mitigate pedestrian fatalities. In evaluating data provided from 13
automakers, GAO found that 62% of new model year 2019 vehicles had some type of pedestrian
crash mitigation system. GAO recommended that NHTSA (a) expand a current pilot program that
collects data on the type and severity of pedestrian injuries; (b) include pedestrian safety tests in
its five-star New Car Assessment Program (NCAP) safety rating program, 42 a step that could
increase automaker use of those technologies on more vehicles; and (c) clarify its process for
updating its safety ratings. 43
A 2018 study by the Insurance Institute for Highway Safety (IIHS) also associated the greater
number of SUVs on the road with increased pedestrian deaths and injuries. IIHS found that
improving vehicle headlights and equipping more vehicles with pedestrian detection systems
could reduce the number of pedestrian fatalities. It also recommended changing the front-end
design of SUVs so they are less likely to strike pedestrians in the head or chest. 44 In a separate
study, IIHS found that smaller vehicles have higher driver death rates, while drivers of some
SUVs have the lowest death rates. 45
Many Advanced Technologies Improve Vehicle Safety
In the past decade, the use of advanced driver assistance systems (ADAS) has improved vehicle
safety and passenger mobility by warning drivers of potentially dangerous situations, such as
another vehicle braking ahead of them, and in some instances, by taking control of the vehicle to
prevent an accident. A Consumer Reports survey among drivers—with data on 72,000 vehicles—
found that 57% reported that “at least one advanced driver assist feature in their vehicle had kept
them from getting into a crash.”46
IIHS and its affiliated Highway Loss Data Institute documented the effects of some crash
avoidance technologies by comparing actual crashes of vehicles with and without ADAS. In the
2019 IIHS/HDLI study, the authors found that vehicles with forward collision warning
experienced 27% fewer front-to-rear crashes, and when that technology was combined with
automatic braking, 50% fewer crashes were experienced. Lane departure warning, blind spot
detection, and rearview cameras each contributed to lower crash rates.47
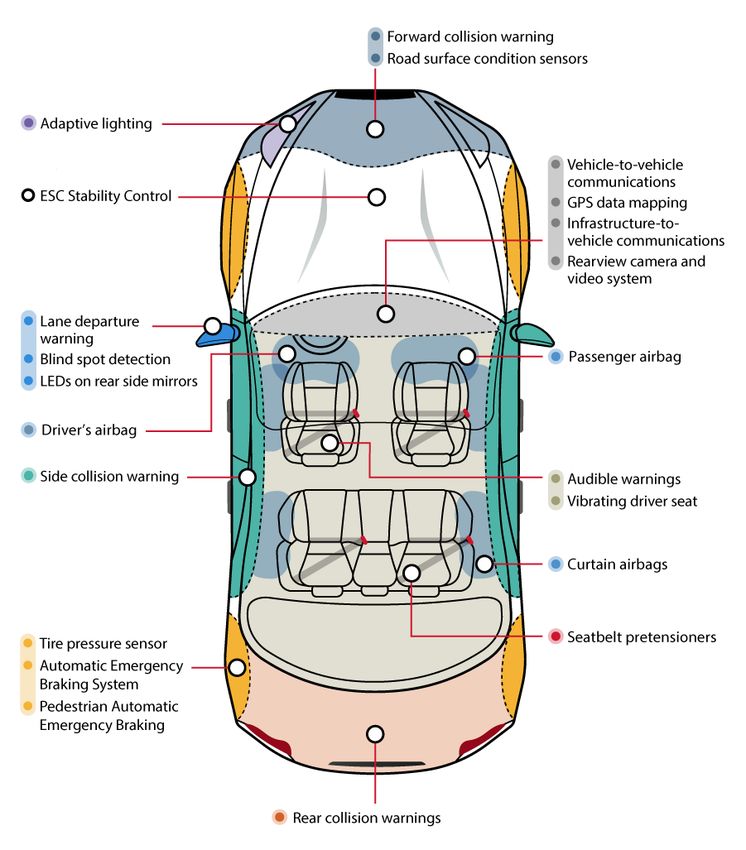
Figure 3 shows many of the technologies currently used on passenger motor vehic les; some are
based on NHTSA standards, such as airbags, tire pressure monitors, and rearview cameras, while
others are not at this time. The technologies include the following:
Electronic stability control limits wheel spinning during acceleration and keeps
the vehicle on the driver’s intended path.
42
T he 5-star safety rating program, formally known as the New Car Assessment Program (NCAP), has since 1978
provided consumers with information on each vehicle’s safety performance based on a series of crash scenario tests
conducted by NHT SA. NCAP was authorized by Congress in the Motor Vehicle Information and Cost Savings Act of
1973 (P.L. 92-513).
43
U.S. Government Accountability Office, Pedestrian Safety, GAO-20-419, April 23, 2020, pp. 39-40.
44
“On foot, at risk,” IIHS Status Report, Vol. 53, No. 3, May 8, 2018, at https://www.iihs.org/api/datastoredocument/
status-report/pdf/53/3.
45 IIHS, Driver death rates remain high among small cars, May 28, 2020, at https://www.iihs.org/news/detail/driver-
death-rates-remain-high-among-small-cars.
46
Mike Monticello, Car Safety Systems That Could Save Your Life, Consumer Reports, June 25, 2019, at
https://www.consumerreports.org/automotive-technology/car-safety-systems-that-could-save-your-life/.
47 Institute for Highway Safety and Highway Loss Data Institute, Real-world benefits of crash avoidance technologies,
June 2019, at https://www.iihs.org/media/259e5bbd-f859-42a7-bd54-3888f7a2d3ef/e9boUQ/T opics/
ADVANCED%20DRIVER%20ASSI ST ANCE/IIHS-real- world-CA- benefits.pdf.
Congressional Research Service 8Motor Vehicle Safety: Issues for Congress
Automatic emergency braking detects a sudden effort to stop the vehicle,
automatically applying the brakes to prevent an imminent crash.
Seat belt pretensioners employ a sensor to detect abrupt deceleration of an
impending accident, forcing a concealed piston to quickly remove any slack in
front-seat seat belts to hold drivers and passengers firmly in their seats, thereby
providing maximum airbag protection.
Forward collision warning uses cameras, radar, and lasers to search for cars
ahead of a vehicle and alerts drivers if a crash may be imminent, using audible
signals or a vibrating driver’s seat to alert the driver. A similar system is available
to detect pedestrians in a vehicle’s path.
Blind spot warning devices are built into external side vehicle mirrors; using
radar or cameras, they light up when a motorist seeks to change lanes and another
vehicle is in the driver’s blind spot.
Lane departure warning systems monitor roadway lane markings and send
audible or vibrating signals to the driver if the vehicle leaves the lane, unless a
turn signal is activated. Research has indicated that drivers who fall asleep, suffer
a medical emergency or black out from drug or alcohol use are most likely to
leave intended lanes. 48
Adaptive lighting is a safety system designed for the driver to see better at night
without affecting other drivers, using a camera under the rearview mirror to
detect oncoming traffic and curves in the road, automatically adjusting
headlights. FMVSS do not allow adaptive headlights.
Since there are no universal standards for some of these technologies, they may have different
names among manufacturers and different capabilities. Consumer Reports has suggested that
automakers, regulators, and safety groups develop an “accurate naming convention” so that
consumers will better understand what these relatively new systems do.49
Many of these newer ADAS technologies are not mandated by Congress or NHTSA; they often
appear first on luxury vehicles because of their high initial costs.50 NHTSA’s position has been
that to develop standards for rapidly changing technologies could impede innovation and result
ultimately in outmoded standards, which could then take years to revise. Delays in issuing or
updating standards can be caused by opposition to some of the proposals by industry or
consumers or by inaction by regulators. In addition, the lengthy period for standard setting is
affected by the requirements of the Administrative Procedures Act of 1946, which ensures that a
proposed rulemaking is publicized in the Federal Register, that public comments are evaluated by
the regulatory agency, and then that decisions that are made are clearly explained in another
Federal Register notice.
To speed the application of one new technology, NHTSA developed a voluntary agreement with
20 automakers in 2016 to install automatic emergency braking systems on nearly all new
passenger vehicles by 2022, a pace of application that NHTSA’s then-administrator said could
48IIHS, Drivers who drift from lane and crash often dozing or ill, September 1, 2016, at https://www.iihs.org/news/
detail/drivers-who-drift-from-lane-and-crash-often-dozing-or-ill.
49
David Friedman, Jake Fisher, and Kelly Funkhouser, et al., “ A Consumer Reports Initiative to End Confusion About
Advanced Driver Assistance Systems,” Consumer Reports, October 25, 2018, at https://advocacy.consumerreports.org/
research/advanced-driver-assistance-systems-standard-nomenclature/.
50 H.R. 2, as passed by the House, would require NHT SA to establish federal standards for many of these crash
avoidance technologies.
Congressional Research Service 9Motor Vehicle Safety: Issues for Congress
not have been met with a traditional standards-setting regulation. Under the agreement,
automakers report annually on their progress: the latest reporting period (for 2019) showed that
12 manufacturers had equipped more than 75% of their vehicles with the systems.
Figure 3. Advanced Vehicle Technologies
Source: CRS.
With more than 260 million vehicles on U.S. roads, the life-saving value of new technologies will
be limited until most cars in use, not just new ones, are equipped with them. The Highway Loss
Data Institute reported in 2019 that “carmakers are making vehicles more crashworthy about 3
Congressional Research Service 10Motor Vehicle Safety: Issues for Congress
times faster today than they did in the mid-1990s, but those improvements and new safety
features still take decades to filter into most vehicles on the road.”51
Vehicle Recalls and Defects
In addition to promulgating and enforcing vehicle safety standards, NHTSA investigates vehicle
defects that affect safety. NHTSA’s Office of Defects Investigation (ODI) initiates defect
investigations and reviews complaints of alleged defects from vehicle owners, automakers, and
other sources. There are several routes a potential recall complaint can take:
Denial. When NHTSA’s analysis of petitions calling for defect investigations
leads the agency to decide not to proceed, it publicizes the reasons for the denial
in the Federal Register.
Further review. If NHTSA opens an investigation of alleged safety-related
defects, the investigation concludes with either a recommendation that the
manufacturer recall the vehicle or a determination that there is no safety-related
defect.
If a safety defect is confirmed by NHTSA, the manufacturer may initiate a recall; if it fails to do
so, NHTSA can initiate a recall itself. In addition to the NHTSA investigative process,
manufacturers conduct their own internal investigations; if a manufacturer finds that a vehicle or
component does not comply with a federal safety standard, it may issue its own recall to correct a
safety defect before accidents are reported. Of the 966 recalls issued in 2019, 57 were issued by
manufacturers influenced by a NHTSA finding, and 909 were issued based on a manufacturer’s
finding alone. 52 The law establishing the motor vehicle safety program requires that a
manufacturer of a defective vehicle or component notify the vehicle owner and fix the defect
without charge. 53
How Consumers Can Report Defects and Check on Recalls
Increasing the reporting of defects and enabling consumers to know about current recalls is an important part of
NHTSA’s public education program to ensure that more vehicles that need repairs are actually fixed. Vehicle
owners and buyers often want to know how to check on recalls or how to report defects. NHTSA encourages
car owners to report vehicle defects, as knowledge of what consumers are experiencing is one way a recall may
be determined. Consumers can report defects by telephone toll-free (1-888-327-4236 or 1-800-424-9393; a
Spanish-speaking line is available at 1-800-424-9153); on the website http://www.safercar.gov, using the “select a
complaint” feature; or by U.S. mail:
U.S. Department of Transportation
NHTSA, Office of Defects Investigation (NVS-210)
1200 New Jersey Avenue, SE
Washington, DC 20590
Consumers can also check on whether their vehicles have been subject to a recall by visiting
http://www.nhtsa.gov/recalls and using the 17-character Vehicle Identification Number (VIN) that is unique to each
car. A VIN can be found in the lower left of the car’s windshield (on the driver’s side), and on the driver’s side
door jamb near the seat; it is also located on a state vehicle registration card.
51
“Automakers accelerate push to make vehicles safer,” Status Report, December 16, 2019, pp. 4-5, at
https://www.iihs.org/api/datastoredocument/status-report/pdf/54/7.
52 NHT SA, 2016 Annual Recall Report.
53
Remedies for Defects and Compliance, 49 U.S.C. §30120.
Congressional Research Service 11Motor Vehicle Safety: Issues for Congress
The annual number of recall actions rose 81% between 2009 and 2016, but has fluctuated in a
narrow range since 2016. The number of vehicles and items of equipment recalled rose steeply
between 2013 and 2015, but then fell through 2018 (see Figure 4). There are several reasons the
number of recalls is higher than in earlier years, including stricter laws, larger fines, delayed
detection by NHTSA of vehicle problems, and several recent high-visibility cases affecting
millions of vehicles.
Figure 4. Motor Vehicle and Equipment Recalls
Source: NHTSA, 2019 Annual Recall Report, covering years 2000 -2019.
Notes: Data include recalls of motor vehicles, motor vehicle parts, tires, and child safety seats. Nearly all of the
recalls in 2019 were of vehicles—39 million—and parts—14 million.
Takata Airbag Recall
The spike in the number of vehicles and equipment recalled from 2013 to 2017 is due in large
part to the recall of more than 63 million defective airbags manufactured by parts supplier Takata,
making it the largest-ever automotive recall. 54 To date there have been 16 confirmed deaths and
more than 220 injuries attributable to Takata airbag defects. 55 In 2014, NHTSA opened a formal
investigation into defective airbags that, when deployed in a crash, could shower metal fragments
into front-seat vehicle occupants, often with fatal consequences. In 2015, Takata and NHTSA
entered into a consent order requiring Takata to submit a plan to maximize recall completion
rates. 56 During its investigation, NHTSA found that Takata had not notified it of defects in a
timely or accurate way. Takata agreed to retain, at its expense, an independent monitor to assess
compliance with the consent order. In addition, the U.S. Department of Justice took legal action
54
NHT SA, T akata Recall Spotlight, https://www.nhtsa.gov/equipment/takata-recall-spotlight, viewed on May 7, 2020.
55
Independent Monitor of T akata and the Coordinated Remedy Program, Update on the State of the Takata Airbag
Recalls, January 23, 2020, p. 31, at http://www.takatamonitor.org/.
56NHT SA Consent Order In re: EA 15-001 Air Bag Inflator Rupture, November 2, 2015, https://www.nhtsa.gov/sites/
nhtsa.dot.gov/files/documents/nhtsa-consentorder-takata.pdf.
Congressional Research Service 12Motor Vehicle Safety: Issues for Congress
against Takata, leading to Takata pleading guilty in 2017 to criminal charges and agreeing to a $1
billion settlement. 57
Although millions of airbags have been replaced since the defect was detected, an estimated 15.9
million vehicles with the recalled airbags remain on the road. 58 A separate group of 10 million
Takata airbags was recalled in 2019, 59 of which NHTSA estimates about 1% may have a defect. 60
The airbags in this recall were used to replace those recalled earlier, NHTSA having deemed the
replacements safer than the originals. Now, many motorists will have to return to their dealers for
a second airbag replacement. 61 The independent monitor reported in January 2020 that
the Takata recalls, now in their fourth year, continue to pose new and unprecedented
challenges.... Many of the remaining vehicles in the field are older and inherently more
difficult to reach. Affected vehicle manufacturers have learned that, at this stage in the
Takata recalls when repairs have exceeded 60%, over half of remaining vehicle owner
contact information based on registration data, can be incorrect. 62
Other Major 2019 Recalls
Aside from the Takata recalls, the 10 largest in 2019, several of which involved defective
software or electronic components, were63
3.5 million Cadillac, Chevrolet, and GMC SUVs and pickup trucks, model years
2014-2018, recalled for a faulty vacuum pump that required reprograming of the
electronic brake control module;
1.3 million Subaru cars and SUVs, model years 2008-2017, requiring a new
brake light switch to replace one prone to malfunction;
1.2 million Nissan and Infiniti cars and trucks, model years 2018-2019, requiring
a software update to ensure that their backup cameras worked properly;
1.2 million Ford Explorers, model years 2011-2017, requiring replacement of
part of the rear suspension so that the rear wheels remain pointed in the right
direction;
928,000 Toyota, Scion, and Lexus vehicles, model years 2003-2017, requiring
airbag assembly replacements;
57U.S. Department of Justice, “T akata Corporation Pleads Guilty, Sentenced to Pay $1 Billion in Criminal Pen alties for
Air Bag Scheme,” press release, February 27, 2017, https://www.justice.gov/opa/pr/takata-corporation-pleads-guilty-
sentenced-pay-1-billion-criminal-penalties-airbag-scheme.
58
Independent Monitor of T akata and the Coordinated Remedy Program, Update on the State of the Takata Airbag
Recalls, January 23, 2020, p. 1.
59
NHT SA, “ More T akata Air Bags Recalled,” https://www.nhtsa.gov/recalls/takata-air-bags-nadi, viewed on June 5,
2020.
60
NHT SA, Defect Information Report for Driver and Passenger Side Airbag Inflators, January 2, 2020, at
https://static.nhtsa.gov/odi/rcl/2020/RMISC-20E001-4050.pdf.
61 Colin Beresford, “10 Million More T akata Airbags Recalled from 14 Automakers,” Car And Driver, January 8,
2020, https://www.caranddriver.com/news/a30446627/takata-airbags-recall-10-million/.
62
T he report of the Independent Monitor discusses novel ways in which manufact urers have attempted to increase the
rate of compliance. Independent Monitor of Takata and the Coordinated Remedy Program, Update on the State of the
Takata Airbag Recalls, January 23, 2020, p. 1.
63Patrick Masterson, “The 10 Biggest Recalls in 2019,” cars.com, January 14, 2020, at https://www.cars.com/articles/
the-10-biggest-recalls-in-2019-416480.
Congressional Research Service 13Motor Vehicle Safety: Issues for Congress
863,000 Chrysler, Dodge, and Jeep vehicles, model years 2011-2016, with faulty
catalytic converters, affecting their emission controls;
693,100 Ram pickup trucks, model years 2013-2014, requiring new tailgate
latches;
679,000 Volkswagen vehicles, model years 2011-2019, needing new ignition
switches and circuit boards;
662,100 Volkswagen Passat and Atlas vehicles, model years 2012-2020, missing
a headlight component; and
638,000 Chevrolet and GMC SUVs and pickup trucks, model years 2014-2018,
recalled because of a faulty electronic brake control module that affected the
driver’s ability to steer.
A recent private study concluded that a significant trend has been the increase in software defects,
noting that “with the emergence of advanced driver assistance systems, connected vehicles,
vehicle-to-vehicle, and vehicle-to-infrastructure communication, this will be an important area for
manufacturers and suppliers to focus on....”64
Inspector General Report on Recall Process
The Department of Transportation Office of the Inspector General (OIG) was required by the
FAST Act to audit NHTSA’s recall process based on its handling of the Takata airbag recall. Its
2018 report, which included six recommendations,65 found that NHTSA’s recall process had a
number of shortcomings. Specifically, the OIG found that NHTSA’s monitoring process for light
vehicle recalls did not ensure that remedies were fully reported and that it did not verify recall
completion rates or notify manufacturers of missing information, making it difficult to assess the
adequacy of a manufacturer’s recall campaign. The OIG later said NHTSA had addressed its
recommendations. 66
In a separate report, issued in 2015, the OIG criticized NHTSA’s methods of collecting vehicle
safety data and reviewing complaints, recommending 17 improvements. 67 In the FAST Act,
Congress conditioned the agency’s funding authorization on the resolution of the 17 OIG
recommendations. 68 The OIG notified Congress on September 30, 2016, that NHTSA had
addressed the 17 issues raised in its report.
Recall Completion Rates
Vehicle owners do not always bring their vehicles to a dealer when a recall is announced,
resulting in many unrepaired vehicles on the road with safety-related defects. Consumers may not
64
Stout Risius Ross LLC, 2019 Automotive Defect & Recall Report, October 14, 2019, pp. 18-19, at
https://www.stout.com/en/insights/report/2019-automotive-defect-and-recall-report.
65
DOT Office of Inspector General, NHTSA’s Management of Light Passenger Vehicle Recalls Lacks Adequate
Processes and Oversight, ST 2018062, July 18, 2018, pp. 27-28, at https://www.oig.dot.gov/sites/default/files/
NHT SA%20Auto%20Recalls%20Final%20Report%5E07 -18-18.pdf.
66 CRS conversation and email with Office of Inspector General at DOT .
67
DOT Office of Inspector General, Inadequate Data and Analysis Undermine NHTSA’s Efforts to Identify and
Investigate Vehicle Safety Concerns, ST -2015-063, June 18, 2015, at https://www.oig.dot.gov/sites/default/files/
NHT SA%20Safety-Related%20Vehicle%20Defects%20-%20Final%20Report%5E6-18-15.pdf.
68 P.L. 114-94, §§24101 and 24102.
Congressional Research Service 14Motor Vehicle Safety: Issues for Congress
open a recall notice in the mail, find it difficult to schedule a free repair, think the recall is not
important enough for a response, or may have sold the vehicle. Sometimes, as with the Takata
airbag recall, the manufacturer does not have enough repair parts available at the time recall
notices are sent out, and vehicle owners may lose interest during an extended delay. A goal of the
FAST Act was to increase the number of vehicles repaired through the recall process.
The FAST Act required NHTSA to conduct an analysis of vehicle recall completion rates and
submit a report to Congress. NHTSA completed that review, based on recalls issued between
2010 and 2014, and submitted its report in May 2017. 69 NHTSA evaluated annual completion
rates rather than average completion rates because the former reflects the number of vehicles
affected. 70 NHTSA researchers found that the combined annual completion rate for all
automakers subject to a recall in those years was 67%, “meaning that 67% of all vehicles recalled
were remedied.”71 Individual automakers’ results varied, with Tesla having the highest annual
completion rate, 100%, in 2010 and Mercedes-Benz having the lowest, 33%, in 2011. Results for
major automakers are shown in Table B-1.
The NHTSA report’s findings are relevant to congressional efforts to boost recall completion
rates:
The older the vehicle on the date of a recall, the less likely the defect will be
repaired. Cars one to three years old at the time of recall had a repair average of
80%, while cars more than six years old had a 56% rate. NHTSA speculated that
owners of newer cars still under warranty may be more inclined to return them to
the dealer for a recall. 72 This observation appears in other recent recall studies. 73
Vehicle parts recall completions differ by type of components. It appears that
vehicle owners are more likely to respond to recalls for certain types of parts,
such as tires, powertrain, and seat belts (all above 70% completion) than to
lighting and suspension recalls (under 60%).
Larger recalls underperform smaller recalls. NHTSA compared the average
completion rate—81% for the major automakers—with the annual completion
rate for the same group, which was 67%. The researchers concluded that “recalls
that cover more vehicles are underperforming compared to smaller recalls;
otherwise the unweighted average would more closely resemble the percentage
of vehicles actually remedied.”74
To the extent that recalls deal with software issues in a vehicle, novel remedies available for that
category may facilitate higher recall completion rates. Software remedies could include over-the-
air solutions that are pushed out to all vehicle owners over wireless networks; alternatively,
69 NHT SA, Report to Congress: Vehicle Safety Recall Completion Rates Report, May 2017, https://www.nhtsa.gov/
sites/nhtsa.dot.gov/files/documents/13376-recall_completion_rates_rtc-tag_final.pdf.
70 As an example, the report notes that BMW’s 2014 annual completion rate was 42% because it fixed 42% of the
vehicles it recalled that year. Its average completion rate was 87% because of several smaller recalls that year that had
higher completion rates. One large BMW recall had a relatively low completion rate, bringing down the annual rate.
Ibid., p. 6.
71
Ibid., p. 11.
72 Ibid., p. 13.
73
Stout, Risius Ross LLC, 2019 Automotive Defect & Recall Report, October 14, 2019, pp. 10-11.
74 NHT SA, Report to Congress: Vehicle Safety Recall Completion Rates Report, May 2017, p. 12.
Congressional Research Service 15You can also read