Review article: Observations for high-impact weather and their use in verification
←
→
Page content transcription
If your browser does not render page correctly, please read the page content below
Nat. Hazards Earth Syst. Sci., 21, 1297–1312, 2021
https://doi.org/10.5194/nhess-21-1297-2021
© Author(s) 2021. This work is distributed under
the Creative Commons Attribution 4.0 License.

Review article: Observations for high-impact weather
and their use in verification
Chiara Marsigli1,2 , Elizabeth Ebert3 , Raghavendra Ashrit4 , Barbara Casati5 , Jing Chen6 , Caio A. S. Coelho7 ,
Manfred Dorninger8 , Eric Gilleland9 , Thomas Haiden10 , Stephanie Landman11 , and Marion Mittermaier12
1 Deutscher  Wetterdienst, Offenbach am Main, 63067, Germany
2 Arpae Emilia-Romagna, Bologna, 40122, Italy
3 Bureau of Meteorology, Docklands, Victoria, 3008, Australia
4 National Centre for Medium Range Weather Forecasting (NCMRWF), Noida, 201307, India
5 MRD/ECCC, Dorval (QC), H9P 1J3, Canada
6 Center of Numerical Weather Prediction, CMA, Beijing, 100081, China
7 Centre for Weather Forecast and Climate Studies, National Institute for Space Research,

Cachoeira Paulista, 12630-000, Brazil
8 Department of Meteorology and Geophysics, University of Vienna, Vienna, 1090, Austria
9 Research Applications Laboratory, National Center for Atmospheric Research, Boulder, 80301, Colorado, USA
10 ECMWF, Reading, RG2 9AX, UK
11 South African Weather Service, Pretoria, 0001, South Africa
12 MetOffice, Exeter, EX1 3PB, UK

Correspondence: Chiara Marsigli (chiara.marsigli@dwd.de)

Received: 27 October 2020 – Discussion started: 16 November 2020
Revised: 19 February 2021 – Accepted: 6 March 2021 – Published: 26 April 2021

Abstract. Verification of forecasts and warnings of high-        adopted to address the issues posed by the usage of these
impact weather is needed by the meteorological centres, but      non-conventional observations and objectively quantify the
how to perform it still presents many open questions, starting   skill of a high-impact weather forecast.
from which data are suitable as reference. This paper reviews
new observations which can be considered for the verifica-
tion of high-impact weather and provides advice for their us-
age in objective verification. Two high-impact weather phe-
nomena are considered: thunderstorm and fog. First, a frame-     1   Introduction
work for the verification of high-impact weather is proposed,
including the definition of forecast and observations in this    Verification of forecasts and warnings issued for high-impact
context and creation of a verification set. Then, new observa-   weather is increasingly needed by operational centres. The
tions showing a potential for the detection and quantification   model and nowcast products used in operations to sup-
of high-impact weather are reviewed, including remote sens-      port the forecasting and warning of high-impact weather
ing datasets, products developed for nowcasting, datasets de-    such as thunderstorm cells also need to be verified. The
rived from telecommunication systems, data collected from        World Weather Research Programme (WWRP) of the World
citizens, reports of impacts and claim/damage reports from       Meteorological Organization (WMO) launched in 2015 the
insurance companies. The observation characteristics which       High-Impact Weather Project (HIWeather), a 10-year inter-
are relevant for their usage in forecast verification are also   national research project, which will advance the predic-
discussed. Examples of forecast evaluation and verification      tion of weather-related hazards (Zhang et al., 2019). Fore-
are then presented, highlighting the methods which can be        cast evaluation is one of the main topics of the project.
                                                                 The WWRP/WGNE Joint Working Group on Forecast Ver-

Published by Copernicus Publications on behalf of the European Geosciences Union.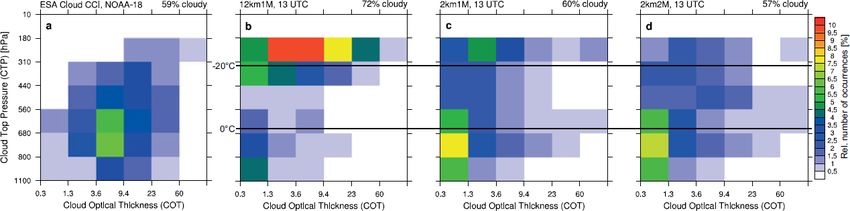
1298                                  C. Marsigli et al.: Observations for high-impact weather and their use in verification

ification Research (JWGFVR)1 of the WMO has among its               merical weather prediction (NWP) verification community
main tasks to facilitate the development and application of         with an organic starter package of information about new
improved diagnostic verification methods to assess and en-          observations which may be suitable for high-impact weather
able improvement of the quality of weather forecasts. The           verification, providing at the same time some hints for their
verification of high-impact weather requires a different ap-        usage in objective verification. In this respect, in this paper
proach than the traditional verification of the meteorolog-         the word “observations” will be used interchangeably with
ical variables (for example, precipitation, temperature and         “reference data”, considering also that in some cases what is
wind) constituting the ingredients of the high-impact weather       usually considered an observation may be only a component
phenomenon. The phenomenon should be verified with its              to build the reference data against which to verify the forecast
spatio-temporal extent and by evaluating the combined ef-           (for example, a measurement of lightning with respect to a
fect of the different meteorological variables that constitute      thunderstorm cell). The word “verification” is used through-
the phenomenon. Therefore, the development of verification          out the paper to stress the focus towards a quantitative usage
approaches which make use of new sources and types of ob-           of these observations. However, the word “evaluation” may
servations is encouraged.                                           better represent in many cases the kinds of analyses that can
   Verification of weather forecasts is often still restricted to   be undertaken using the datasets here considered, allowing
the use of conventional observations such as surface synoptic       a better understanding of the forecast performance, particu-
observation (SYNOP) reports. These conventional observa-            larly for phenomena that have direct human consequences.
tions are considered the gold standard with well-defined re-           The review is limited to the new observations, meaning
quirements for where they can be located and their quality          those observations which are not already commonly used in
and timeliness (WMO-No.8, 2018). However, for the pur-              the verification of weather forecasts. The choice of what is
poses of verifying forecasts of high-impact weather, these          a new observation is necessarily subjective. For example, we
observations often do not permit characterization of the phe-       have chosen to consider radar reflectivity as a standard ob-
nomenon of interest and therefore do not provide a good ref-        servation for the verification of precipitation, while the light-
erence for objective verification. In Europe, 10 years ago, a       ning measurements are considered among the new observa-
list of new weather elements to be subject to routine verifica-     tions. Nonetheless, some of the methodologies developed for
tion was proposed by Wilson and Mittermaier (2009) follow-          standard observations may also provide guidance about how
ing the member states and cooperating states’ user require-         to use the new observations. As an example, the significant
ments for ECMWF products. Among others, visibility/fog,             use of radar mosaics to evaluate convective and precipitation
atmospheric stability indices and freezing rain were men-           forecasts (see Gilleland et al., 2009; Roberts et al., 2012) is a
tioned, and the observations needed for the verification of         useful guidance for any verification of thunderstorms. Some
these additional forecast products were reviewed.                   of the new observations are familiar to meteorologists (e.g.
   Depending on the phenomenon, many reference datasets             for monitoring and nowcasting) but quite new for the NWP
exist. Some are direct measurements of quantities to ver-           community, particularly from the point of view of their usage
ify, e.g. lightning strikes compared to a lightning diagnostic      in forecast verification.
from a model, but many are not. In that case, we can derive            In order to provide practical and quantitative examples, the
or infer estimates from other measurements of interest. The         paper focuses on specific types of high-impact weather. First,
options are many and varied, from remote sensing datasets,          thunderstorms – a phenomenon occurring over several areas
datasets derived from telecommunication systems including           of the globe, characterized by high spatio-temporal variabil-
cell phones, data collected from citizens, reports of impacts       ity as well as spatial extension – are considered. Many dif-
and claim/damage reports from insurance companies. In this          ferent data provide information about this phenomenon, per-
instance, it enables the definition of observable quantities        mitting us to span quite a variety of new observations. Sec-
which are more representative of the severe weather phe-            ond, fog – a different phenomenon dominated by a very local
nomenon (or its impact) than, for example, purely consider-         character, where the structure is less important – is consid-
ing the accumulated precipitation for a thunderstorm. These         ered. Starting from these examples, it is possible to extend
less conventional observations, therefore, enable more direct       the subject to a wider spectrum of high-impact weather phe-
verification of the phenomena and not just the meteorological       nomena following the same approach. Depending on their
parameters involved in their occurrence.                            being localized or spatially extended or characterized by fine
   The purpose of this paper is to present a review of new          structure, phenomena like tornadoes, heat waves and urban
observations or, more generically, quantities which can be          floods can benefit from approaches similar to the ones pre-
considered as reference data or proxies, which can be used          sented here.
for the verification of high-impact weather phenomena. Far
from being exhaustive, this review seeks to provide the nu-

  1 The JWGFVR is a Working Group joint between WWRP and
WGNE (Working Group on Numerical Experimentation).

Nat. Hazards Earth Syst. Sci., 21, 1297–1312, 2021                                  https://doi.org/10.5194/nhess-21-1297-2021
C. Marsigli et al.: Observations for high-impact weather and their use in verification                                      1299

2   A proposed framework for high-impact weather                   cast. How to include uncertainties in verification will not be
    verification using non-conventional observations               discussed in the present paper. For a review of the current
                                                                   state of the research, it is suggested to read Ben Bouallegue
In order to transform the different sources of information         et al. (2020) and the references therein.
about high-impact weather phenomena into an objective ref-             After having identified the forecast and the reference, the
erence against which to compute the score of the forecast,         third step is the creation of the pair, called a verification
four steps are proposed.                                           set. The matching of the two entities in the pair should
   The first step is to define the quantity or object to be ver-   be checked before the computation of summary measures.
ified, selected for forecasting the phenomenon, which will         For example, is one lightning strike sufficient for verifying
be simply referred to as forecast, even if it may not be a         the forecast thunderstorm cell? Since forecast and observa-
direct model output or a meteorological variable. As noted         tion do not necessarily match in the context of high-impact
above, for thunderstorms, accumulated precipitation may not        weather verification using non-conventional observations, a
be the only quantity to be objectively verified, but it can be     preparatory step is needed for ensuring a good degree of
a component of the entity to be verified, along with light-        matching. In this step, the correlation between the two com-
ning, strong winds and hail. Suitable quantifiable compo-          ponents of the pair should be analysed. Some of the observa-
nents should be directly observable or have a proxy highly         tion types may be subject to biases. As correlation is insensi-
correlated to it. In the case of thunderstorms, the quantity to    tive to the bias for some types of forecast–observation pairs,
be verified can be the lightning activity, or areas representing   any thresholds used to identify the objects of the two quan-
the thunderstorm cells. An example of the latter case is given     tities must also be studied to ensure that the identification
by the cells predicted by the algorithms developed in the con-     and comparison is as unbiased (from the observation point
text of nowcasting, where the cells are first identified in the    of view) as possible. In particular, the forecast and the ob-
observations from radar or satellite data, possibly in combi-      servation should represent the same phenomenon, and this
nation with other sources of data. With Doppler-derived wind       can be achieved by stratifying the samples. A simple exam-
fields, the occurrence of damaging winds could also be ex-         ple is the case where the forecast is a rainfall area and the
plored. In the case of fog, the quantity to be verified can be     observation is a lightning strike: all the cases of precipita-
visibility or fog areas, either directly predicted by a model or   tion not due to convection in the forecast sample will make
obtained with a post-processing algorithm.                         the verification highly biased; therefore, they should be ex-
   The second step is to choose the observation, or reference,     cluded. Another element of the matching is to assess spatial
against which to verify the forecast. Observations which rep-      and temporal representativeness, which may lead to the need
resent some of the phenomena described above already exist,        to suitably average or re-grid the forecasts and/or observa-
but often they are used only qualitatively, for the monitoring     tions. Some examples of how the matching is performed are
of the events in real time or for nowcasting. Ideally, these new   presented in the next sections. If the forecasts and observa-
observation types should have adequate spatial and temporal        tions show a good statistical correlation (or simply a high
coverage, and their characteristics and quality should be well     degree of correspondence), it can be assumed that one can
understood and documented. Even when a forecast of a stan-         provide the reference for the other and objective verification
dard parameter (e.g. 2 m temperature) is verified against a        can be performed. This approach can be extended to proba-
standard, conventional, observation (e.g. from SYNOP), care        bilities: an area where the probability of occurrence of a phe-
should be taken in establishing the quality of the observations    nomenon exceeds a certain threshold can be considered as
used as reference and their representativeness of the verified     the predictor for the forecast of the phenomenon, provided
parameter. This need becomes stronger in the case of non-          that its quality as predictor has been established through pre-
standard parameters (e.g. a convective cell) verified against a    vious analysis. Therefore, the same verification approach can
non-standard observation (e.g. lightning occurrence or a con-      be applied in the context of ensemble forecasting (Marsigli
vective cell “seen” by some algorithm). In order to indirectly     et al., 2019). Verification of probability objects for thunder-
assess the quality of the observations, or to include the un-      storm forecast is performed in Flora et al. (2019).
certainty inherent in them, comparing observed data relative           A special case of pair creation occurs when an object iden-
to the same parameter but coming from different sources is         tified by an algorithm is used as the reference, as in the ex-
a useful strategy. This approach can contribute to increasing      ample of the thunderstorm cell identified by radar. In this
the different sources of observations available for the veri-      case, a choice in the matching approach is required: should
fication of a phenomenon, considering that they are all un-        the algorithm be applied only for the identification of the
certain. In the verification of phenomena, when new obser-         phenomenon as observation or should it also be applied to
vations are used for verifying new products, it becomes even       the model output for identifying the forecast phenomenon?
more crucial to include the uncertainties inherent in the ob-      This is similar to what is done in the standard verification,
servations in the verification process, as they will affect the    when observations are upscaled to the model grid, to be com-
objective assessment of forecast quality in a context in which     pared to a model forecast, or instead both observations and
there may not be a previously viable evaluation of that fore-      model output are upscaled to a coarser grid. In the first case,

https://doi.org/10.5194/nhess-21-1297-2021                                Nat. Hazards Earth Syst. Sci., 21, 1297–1312, 2021
1300 C. Marsigli et al.: Observations for high-impact weather and their use in verification
the model forecasts, expressed as a model output variable New observations which could be used, or have been used
(e.g. the precipitation falling over an area), are directly com- on a limited basis, for the verification of thunderstorms are
pared with the observation (e.g. a thunderstorm cell identi- reviewed here, categorized as lightning detection networks,
fied by an algorithm on the basis of some observations). In nowcasting products and data collected through human ac-
the second case, the same algorithm (an observation oper- tivities. Examples of usage of these data, sometimes in com-
ator) is applied to the same set of meteorological variables bination, in the objective verification of thunderstorms are
in both the observed data and the model output in order presented.
to compare homogeneous quantities. This approach elimi-
nates some approximations made in the process of observa- 3.1 Lighting detection networks
tion product derivation, but observation operators are also far
from perfect. Therefore, although this approach can ensure
Data from lightning detection networks are used for now-
greater homogeneity between the variables, it may still in-
casting purposes in several centres. Lightning density and
troduce other errors resulting from the transformation of the
its temporal evolution can serve as a useful predictor for the
model output.
classification of storm intensity and its further development
Finally, the fourth step is the computation of the verifica-
(Wapler et al., 2018). Therefore, these data show a good po-
tion metrics. This step is not principally different from what
tential in thunderstorm verification. Lightning data can be
is usually done in objective verification, taking into account
used as observations in different ways, from the most direct,
the specific characteristics of the forecast–observation pair.
verifying a forecast also expressed in terms of lightning to
In general, high-impact weather verification requires an ap-
more indirect, for example, by verifying a predicted thunder-
proach to the verification problem where the exact matching
storm cell. In both cases, some issues need to be addressed,
between forecast and observation is rarely possible; there-
starting from how many strokes are needed to detect the oc-
fore, verification naturally tends to follow fuzzy and/or spa-
currence of a thunderstorm (specification of thresholds). In
tial approaches (Ebert, 2008; Dorninger et al., 2020). An is-
the indirect cases, how large an area defines the region of
sue inherent in the verification of objects, such as convec-
the phenomenon (thunderstorm) needs to be specified. These
tive cells, is the definition of the non-event: while it is in-
choices are relevant also when lightning data are combined
tuitive how to perform the matching between a forecasted
with other observations (e.g. radar data), in order to im-
and an observed convective cell, how to define the mismatch
prove the detection of the phenomenon. Some of these issues
between a forecasted cell and the non-occurrence of con-
are further discussed when examples of forecast verification
vective cells in the domain (false alarms) is not trivial. This
against lighting data are presented.
question should be addressed when the verification method-
Data from lightning localization networks have the advan-
ology is designed, and the answer may depend on the specific
tage of continuous space and time coverage and of a high
methodology adopted for the spatial matching. Some of the
detection efficiency, compared to human thunderstorm obser-
spatial methods (e.g. distance metrics, Method for Object-
vations. Some lightning detection networks which have been
based Diagnostic Evaluation (MODE; Davis et al., 2006))
used for thunderstorm verification (often only subjectively)
do make it relatively easy to identify and/or evaluate false
are listed in Table 1.
alarms, and they should be preferred when the false alarms
Lightning observations are also provided from space (Ta-
are particularly relevant for the evaluation.
ble 2), which can complement ground-based weather radars
over sea and in mountainous regions.
3 High-impact weather: thunderstorms
3.2 Nowcasting products
In convective situations, meteorological centres use a large
amount of real-time data from different sources (e.g. ground-
National Meteorological Services develop tools for nowcast-
based, satellite and radar) in order to perform nowcast-
ing, where observational data from different sources (satel-
ing and monitoring of thunderstorms and thus issue official
lite, radar, lightning, etc.) are integrated in a coherent frame-
weather warnings. In recent years, with the development of
work (Wapler et al., 2018; Schmid et al., 2019), mainly with
convection-permitting models, thunderstorm forecasting has
the purpose of detection and very-short-range prediction of
become an aim of short-range forecasting, particularly with
high-impact weather phenomena. In this context, the use of
the advent of modelling frameworks such as the Rapid Up-
machine learning to detect the phenomenon from new ob-
date Cycle (RUC), which provides NWP-based forecasts at
servations, after training the algorithm with a sufficiently
the 0–6 h timescale updated every 15–60 min. These predic-
large sample of past observations, could play an important
tions of thunderstorms, from nowcasting to forecasting, need
role by mimicking a decision tree where different ingredients
to be verified in order to provide reliable products to the fore-
(predictors) are combined and computing how they should
casters and to the users.
be weighted. Usually different algorithms are developed for
the different products. For a description of nowcasting meth-
Nat. Hazards Earth Syst. Sci., 21, 1297–1312, 2021 https://doi.org/10.5194/nhess-21-1297-2021C. Marsigli et al.: Observations for high-impact weather and their use in verification 1301
Table 1. Lightning detection networks used for thunderstorm verification in the papers referenced in this section.
Name of the dataset Scope Short description References
EUCLID (European Coopera- Collaboration among national Lightning data with homoge- http://www.euclid.org (last ac-
tion for Lightning Detection) lightning detecting networks nous quality in terms of detec- cess: 20 April 2021)
over Europe tion efficiency and location ac-
curacy. About 164 sensors in 27
countries.
LINET Originally developed at the Lightning sensors set up in the http://www.nowcast.de (last ac-
(Lightning Detection Network) University of Munich area to be monitored (base- cess: 20 April 2021)
line 200 to 250 km). Informa- Betz et al. (2009)
tion about location, time and
stroke current.
ATDnet (Arrival Time Differ- Met Office Network of 11 sensors around https://navigator.eumetsat.
ence network) the world. int/product/EO:EUM:DAT:
OBS:ATDNET (last access:
20 April 2021)
Anderson and Klugmann
(2014)
NORDLIS Scandinavia Cooperative lightning location Mäkelä et al. (2010)
(Nordic Lightning Information network between Norway, Swe-
System) den, Finland and Estonia; about
30 sensors.
National Lightning Detection USA NOAA develops derived prod- Cummins and Murphy (2009)
Network (NLDN) ucts freely available for all https://www.ncdc.noaa.gov/
users, including summaries of data-access/severe-weather/
lightning flashes by county and lightning-products-and-services
state and gridded lightning fre- (last access: 20 April 2021)
quency products.
SA-LDN (South African Light- South African Weather Service Network of 26 Vaisala cloud-to- Gijben (2012)
ning Detection Network) ground lightning detection sen-
sors.
Table 2. Lightning sensors on board satellites and the International Space Station.
Sensor/dataset Operated by Short description References
Lightning Imaging Sensor International Space Station Provides total lightning mea- Blakeslee and Koshak (2016)
(LIS) (ISS) surements between +/−48◦ lat-
itude.
Geostationary Lightning Map- GOES-16 (NOAA) Measures a region including the https://ghrc.nsstc.nasa.
per (GLM) United States, providing light- gov/lightning (last access:
ning detection with a spatial 20 April 2021)
resolution of about 10 km.
Geostationary Lightning Im- FY-4 (CMA) Provides measurements of the https://fy4.nsmc.org.cn/nsmc/
ager (or Lightning Mapping total lightning activity with a en/theme/FY4A_instrument.
Imager) resolution of about 6 km at the html#LMI (last access:
subsatellite point. 20 April 2021)
Lightning Imager mission Meteosat Third Generation Provides lightning products http://www.eumetsat.int (last
with 4.5 km resolution. access: 20 April 2021)
https://doi.org/10.5194/nhess-21-1297-2021 Nat. Hazards Earth Syst. Sci., 21, 1297–1312, 20211302 C. Marsigli et al.: Observations for high-impact weather and their use in verification
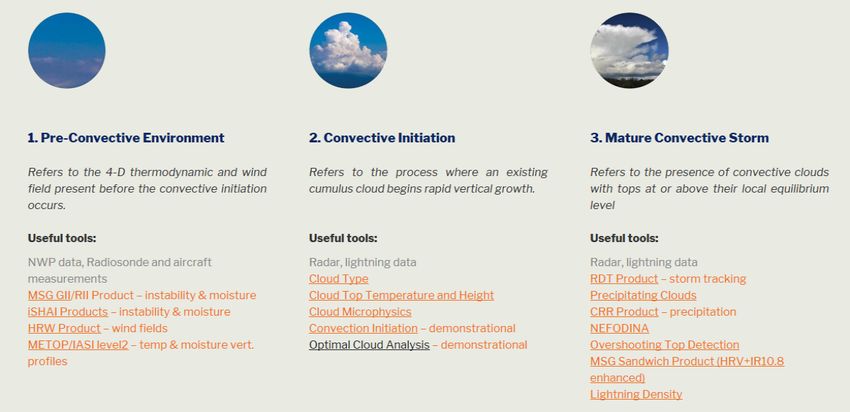
ods and systems, see WMO-No.1198 (2017) and Schmid et of the products for nowcasting and warning for objective
al. (2019). verification. For example, the stability products (lifted index,
For the purpose of this paper, the detected vari- K-index, Showalter index) and precipitable water (low,
ables/objects of nowcasting (thunderstorm cells, hail, etc.) mid- and upper troposphere) have been judged to be of
can become observations against which to verify the model some value. The RDT (Rapid Developing Thunderstorms)
forecast. The detection step of the nowcasting algorithm can product in its present form has been judged difficult to use,
be considered as a sort of analysis of the phenomenon ad- but elements of the RDT product have significant potential
dressed by that algorithm, e.g. an observation of a convective for the nowcasting of severe convective storms, namely the
cell, which could be used for verifying the forecasts of this cloud top temperatures and the overshooting-top detections.
phenomenon. Here, nowcasting products are proposed as ob- Furthermore, the RDT index has proven to be useful in
served data instead of prediction tools. regions where radar data do not have full coverage. De
Remote-sensing-based nowcasting products have the clear Coning et al. (2015) found good correlations between the
advantage of offering high spatial continuity over vast ar- storms identified by the RDT and the occurrence of lightning
eas. As a disadvantage, it should be noted that some data over South Africa. Gijben and de Coning (2017) showed
have only a qualitative value, but qualitative evaluation could that the inclusion of lightning data had a positive effect on
become quantitative by relaxing the comparison through the accuracy of the RDT product, when compared to radar
neighbourhood/thresholding (examples will be provided in data, over a sample of 25 summer cases. RDT is considered
Sect. 3.4). The quantification of the errors affecting the prod- as an observation against which to compare model forecasts
ucts is also an issue, since usually this is not provided by of convection, as well as high-impact weather warnings, at
the developers. Efforts towards such an error quantification the South African Weather Service (Stephanie Landman,
should be made to provide appropriate confidence in the ver- personal communication). A review of the products for
ification practice. detecting the convection is made by the Convection Working
Exploring the possible usage of the variables/objects iden- Group, an initiative of EUMETSAT and its member states
tified through nowcasting algorithms for the purpose of fore- and ESSL (https://cwg.eumetsat.int/satellite-guidance, last
cast verification requires strengthening the collaboration be- access: 20 April 2021, Fig. 1), indicating which products are
tween the verification and the nowcasting communities. On appropriate for the detection of convection.
the one hand, the nowcasting community has a deep knowl-
edge of the data sources used in the nowcasting process and 3.3 Data collected through human activities
of the quality of the products obtained by their combination.
On the other hand, the forecast verification community can Human activities permit generation and collection of a wide
select, from the huge amount of available data, those show- and diverse amount of data about the weather. Some of these
ing greater reliability and offering a more complete represen- data are collected with the purpose of monitoring the weather
tation of the phenomenon to be verified. (citizen networks, reports of severe weather); others are gen-
Many meteorological centres have developed their own erated for quite different purposes but may be related to the
nowcasting algorithms, (Wapler et al., 2019), usually differ- weather (impact data, insurance data). The data generated in
ent for different countries, but a complete description of them the social networks are a special category: a report of se-
is difficult to find in the literature. Therefore, it is recom- vere weather may be generated only for the purpose of com-
mended to contact the meteorological centre of the region of plaining about the weather. The quality of these data and
interest. The example of EUMETSAT collaboration shown their correlation with weather phenomena are very different
below indicates the kind of available products. in these three cases. A review of the so-called “volunteered
geographic information” related to weather hazards has been
The EUMETSAT NWC-SAF example performed by Harrison et al. (2020), including also crowd-
sourcing and social media.
EUMETSAT (http://www.eumetsat.int, last access: Data collected through human activities can be distin-
20 April 2021) proposes several algorithms for using guished by those solicited by the potential user and those that
their data. The Satellite Application Facility for supporting are not. An example of the first is report data collected in a
NoWCasting and very-short-range forecasting (NWC-SAF, dedicated website, prepared by the potential user, inviting the
nwc-saf.eumetsat.int) provides software packages for gener- citizen to submit their report. Table 3 describes three widely
ating several products from satellite: clouds, precipitation, used databases. This kind of data may be biased by the fact
convection and wind. The software is distributed freely to that people may feel pushed to report. Non-solicited data
registered users of the meteorological community. The Euro- include those associated with public assistance (e.g. emer-
pean Severe Storms Laboratory (ESSL, https://www.essl.org, gency services) and those spontaneously generated by people
last access: 20 April 2021) has performed a subjective eval- (e.g. in social networks). Solicited and unsolicited human re-
uation of the products of the NWC-SAF for convection ports need to be quality checked in order to take into account
(Holzer and Groenemeijer, 2017) indicating the usefulness and correct for biases which are introduced (e.g. multiple re-
Nat. Hazards Earth Syst. Sci., 21, 1297–1312, 2021 https://doi.org/10.5194/nhess-21-1297-2021C. Marsigli et al.: Observations for high-impact weather and their use in verification 1303 Figure 1. Satellite-derived products for the detection of convection. From https://cwg.eumetsat.int/satellite-guidance (last access: 20 April 2021). ports of the same event with little spatial or temporal dis- poses, in combination with reports from ESWD operated by tance, subjective and conflicting evaluations of the intensity, ESSL. and variation of the sample with time). Human reports and Crowdsourcing can also provide a new kind of data useful impact data have the advantage of being particularly suitable for verifying thunderstorm as a phenomenon, using the re- for high-impact weather verification and the disadvantage ports from the citizens as observations of the thunderstorm. that they are biased: the non-event is usually not reported. Wiwatwattana et al. (2015) describe the use of reports from In addition, they depend on the density of the population: a crowdsourcing weather app to verify probabilistic precip- where no or few people live, no reports are issued even if the itation forecasts in Bangkok, Thailand. Crowdsourced hail impact on the society (e.g. agriculture) or on the environment reports gathered with an app from MeteoSwiss make an ex- may be high. Therefore, this kind of data have a particularly tremely valuable observational dataset on the occurrence and inhomogeneous spatial distribution. approximate size of hail in Switzerland (Barras et al., 2019). Severe weather reports are an important source of infor- The crowdsourced reports are numerous and account for mation which can be made objective and used in forecast much larger areas than automatic hail sensors, with the ad- verification. Hitchens et al. (2013) define a practically per- vantage of unprecedented spatial and temporal coverage, but fect warning region based on point-based storm reports (e.g. provide subjective and less precise information on the true for wind, hail). The practically perfect region is consistent size of hail. Therefore, they need to be quality controlled. with a forecast which a forecaster would make given perfect Barras et al. (2019) noted that their reflectivity filter requires knowledge of the reported event. Statistical methods are used reports to be located close to a radar reflectivity area of at to convert point observations (here reports) into a spatial field least 35 dBZ. Overall, the plausibility filters remove approx- that can be compared directly to a warning or the output from imately half of the reports in the dataset. a model. The field gives the probability that an event occurs Among the impact data, insurance data are a useful source, in a given grid box. By considering each probability value but their availability is limited because of economic inter- as an individual threshold, the range of probabilities can be ests (Pardowitz, 2018). In some cases partnerships between converted into a set of dichotomous (yes or no) observation weather services and insurance providers may be arranged to of severe weather. exchange data. Reports can be also be combined with other data sources A special branch of non-solicited impact data is comprised to identify the phenomenon. Valachova and Sykorova (2017) of those generated in the social networks. Recent work at Ex- use a combination of satellite data, lightning data and radar eter University (UK) has shown that social sensing provides data (cells identified through a tracking algorithm) in order to robust detection/location of multiple types of weather haz- detect thunderstorms and their intensity for nowcasting pur- ards (Williams, 2019). In this work, Twitter data were used https://doi.org/10.5194/nhess-21-1297-2021 Nat. Hazards Earth Syst. Sci., 21, 1297–1312, 2021
1304                                   C. Marsigli et al.: Observations for high-impact weather and their use in verification

Table 3. Widely used severe weather report databases.

 Dataset name                      Operated by                      Characteristics                    References
 European Severe         Weather   ESSL (European Severe Storm      Quality-controlled information     https://www.eswd.eu (last ac-
 Database (ESWD)                   Laboratory)                      on severe convective storm         cess: 20 April 2021)
                                                                    events over Europe. Among          Dotzek et al. (2009)
                                                                    other parameters, hailstones
                                                                    with a diameter of at least
                                                                    2.0 cm are reported.
 Storm Prediction Center (SPC)     NOAA                             Archive of severe weather          https://www.spc.noaa.gov (last
                                                                    events, including tornadoes,       access: 20 April 2021)
                                                                    wind, hail and thunderstorms.
 Severe Storms Archive             BoM (Australian Bureau of        Data relating to recorded severe   http://www.bom.gov.au/
                                   Meteorology)                     thunderstorm and related events    australia/stormarchive   (last
                                                                    in Australia dating back to the    access: 20 April 2021)
                                                                    18th century. Information on re-
                                                                    lated severe weather (e.g. wind
                                                                    gusts) is also provided.

for sensing the occurrence of flooding. Methods to automate             Lightning – spatial coverage. For a thunderstorm probabil-
detection of social impacts are developed, focusing also on          ity forecasting contest, Corbosiero and Galarneau (2009) and
the data filtering to achieve a good quality. In the usage of all    Corbosiero and Lazear (2013) predicted the probability to the
these data as observations for an objective verification, a cru-     nearest 10 % that a thunderstorm was reported during a 24 h
cial step is the pre-processing of the data in order to isolate      period at 10 locations across the continental United States.
the features which are really representative of the forecasted       The forecasts were verified by standard METAR (METeoro-
phenomenon. As noted earlier, an assessment of the observa-          logical Aerodrome Report) reports as well as by the National
tion error should accompany the data, for example by vary-           Lightning Detection Network (NLDN) data. For this com-
ing the filtering criteria and producing a range of plausible        parison, strikes were counted within 20 km of each station
observations.                                                        (Bosart and Landin, 1994). Results show that, although there
                                                                     was significant variability, the 10 km NLDN radial ring best
                                                                     matches METAR thunderstorm occurrence.
3.4    Usage of the new observations in the evaluation or               Lightning – matching forecast and observation. Brunet et
       verification of thunderstorms                                 al. (2019) use lightning data in a 25 km radius of a forecast
                                                                     point to be a thunderstorm observation for the purpose of
                                                                     verifying NWP-based warnings and comparing to human-
In this section, some studies describing the verification of
                                                                     generated thunderstorm warnings. They propose a verifica-
thunderstorm and convection are presented. They represent
                                                                     tion methodology for the fair comparison between contin-
only a subset of those that have been undertaken worldwide
                                                                     uous and categorical probabilistic forecasts, as needed for
to address this topic.
                                                                     comparing human and automatically generated object-based
   They are used here to show which verification methods
                                                                     forecasts derived from probabilistic forecasts.
have been used and how the authors addressed the issues
                                                                        Lightning – spatial coverage, pointwise vs. spatial. Wapler
posed by the usage of non-standard observations and by the
                                                                     et al. (2012) computed the probability of detection (POD) by
need to create a meaningful verification set. The different ob-
                                                                     comparing the cells detected by two different nowcasting al-
servations listed in the previous subsection are used, some-
                                                                     gorithms to lightning data. The comparison was made both
times in combination. For each work, their most significant
                                                                     pointwise and using an areal approach (following Davis et
feature for the purpose of this paper is indicated in the title
                                                                     al., 2006). They showed how the score improves by increas-
as keyword(s).
                                                                     ing the radius of the cell and that the verification is also de-
   Lightning – matching forecast and observation. Caumont
                                                                     pendent on the reflectivity threshold used to detect the cells.
(2017) verified lightning forecasts by computing 10 differ-
                                                                     The pointwise approach gave a higher POD than the areal
ent proxies for lightning occurrence from the forecast of the
                                                                     approach, showing how the choice of the verification method
AROME model run at 2.5 km. In order for them to be good
                                                                     influences the results. The area covered by lightning gener-
proxies for lightning, calibration of their distribution was per-
                                                                     ally extends beyond the area covered by a cell (identified by
formed, offering a good example of the process of matching
                                                                     high reflectivity values), leading to a decrease in the areal
the predicted quantity with the observed one.

Nat. Hazards Earth Syst. Sci., 21, 1297–1312, 2021                                    https://doi.org/10.5194/nhess-21-1297-2021
C. Marsigli et al.: Observations for high-impact weather and their use in verification 1305
POD. The false alarm ratio was computed only for the areal radiosoundings, has the advantage of much larger geograph-
approach and considered the difficulty of counting the num- ical coverage.
ber of non-forecasted events in the pointwise approach. They Satellite data – observation operator. Rempel et al. (2017)
also compared the detection of hail from the ESWD report verified convective development in a convection-permitting
with the cells detected by two nowcasting algorithms, but no model against satellite data. An observation operator was
scores were computed. As the authors pointed out, since ob- used to derive synthetic satellite images from the model.
servations of “no event” are not provided, it is difficult to The computation of object-based metrics (SAL, Wernli et
compute scores resulting from the presence of “yes event” al., 2008) was performed after the identification of individ-
observations only. ual cloud objects within the considered domain both in the
Lightning – spatial coverage, false alarms. Lighting data observed and synthetic satellite images.
were used for verification of nowcasting of thunderstorms Satellite data – matching forecast and observation. Deep
from satellite data by Müller et al. (2017). They used a search convection in a convection-permitting model, compared to
radius of 50 km, within which at least two flashes in 10 min the one forecasted by a convection-parameterized model,
should be recorded in order to detect the event. A false alarm was evaluated by Keller et al. (2015). The observables were
was identified when the nowcasted thunderstorm was not as- satellite-derived cloud top pressure, cloud optical thickness,
sociated with a detected event. brightness temperature, outgoing longwave radiation and re-
Lightning – spatial method. In the work of de Rosa et flected solar radiation. They were used in combination to
al. (2017) extensive verification of thunderstorm nowcast- evaluate the characteristics of the convection. No objective
ing was performed against ATDnet lightning data over a verification was performed, but a categorization of the satel-
large domain covering central and southern Europe using the lite products (Fig. 3) permits the use of these indicators for
MODE method (Davis et al., 2006; Bullock et al., 2016) of verification of cloud type and timing of convection.
the MET (Model Evaluation Tools) verification package. The Evaluation from citizens used for verification. MeteoSwiss
cells detected from the nowcasting algorithm were compared carried out a subjective verification by beta testers of thunder-
against lightning objects obtained by clustering the strikes. storm warnings issued for municipalities on mobile phones
Combination of lightning and report data. Wapler et via app (Gaia et al., 2017). The forecast was issued in cate-
al. (2015) performed a verification of warnings issued by gories: “a developing/moderate/severe/very severe thunder-
the Deutscher Wetterdienst (DWD) for two convective events storm is expected in the next XX min in a given munici-
over Germany. They qualitatively compared warning areas pality”. Probability of detection and false alarm ratio of the
against data from ESWD reports and lightning data. They thunderstorm warnings were computed against beta-tester
also performed a quantitative comparison against lightning evaluation.
data via a contingency table for the two events. This approach Insurance data and emergency call data. Schuster et
could be extended to a larger dataset in order to perform a al. (2005) analysed characteristics of Australian hailstorms
statistically robust verification. using data of insurance claims costs, emergency calls and
Combination of lightning and report data. At ECMWF, emergency service intervention, in addition to data from
two parameters, convective available potential energy severe weather reports (Fig. 4). Rossi et al. (2013) used
(CAPE) and a composite CAPE–shear parameter, have re- weather-related emergency reports archived in a database by
cently been added to the extreme forecast index/shift of tails the Ministry of the Interior in Finland to determine hazard
products (EFI/SOT), targeting severe convection. Verifica- levels for convective storms detected by radar, demonstrating
tion is performed against datasets containing severe weather the potential of these data especially for long-lasting storms.
reports only and a combination of these reports with ATDnet Emergency services data – matching forecast and obser-
lightning data (Tsonevsky et al., 2018). Verification results vation. Pardowitz and Göber (2017) compared convective
based on the area under the relative operating characteris- cells detected by a nowcasting algorithm against data of fire
tic curve show high skill at discriminating between severe brigade operations. In addition to the location and time of the
and non-severe convection in the medium range over Europe alerts, the data included keywords associated with each op-
and the United States (Fig. 2). More generally, report data eration, which permitted the selection of the weather-related
and lightning data were used to evaluate the performance of operations relevant for this work (water damages and tree-
ECMWF systems in a collection of severe-weather-related related incidents). Pardowitz (2018) examined fire brigade
case studies, including convection, for the period 2014–2019 operation data in the city of Berlin with respect to their cor-
(Magnusson, 2019). relation to severe weather.
Satellite data – observation operator. Wilson and Mitter- Airport operation data used in verification – matching
maier (2009) employed a MSG-satellite-derived lifting index forecast and observation. A simple and effective verification
to evaluate the lifted index forecasted by the model, to ver- framework for impact forecasts (in this case, probabilistic
ify regions of convective activity. The index can be computed forecasts of thunderstorm risk) was demonstrated by Brown
only on cloud-free areas but, with respect to that derived from and Buchanan (2018) based on 2 years of data. The London
terminal manoeuvering area (TMA) thunderstorm risk fore-
https://doi.org/10.5194/nhess-21-1297-2021 Nat. Hazards Earth Syst. Sci., 21, 1297–1312, 20211306 C. Marsigli et al.: Observations for high-impact weather and their use in verification
Figure 2. Area under the ROC curve for EFI for CAPE (left) and CAPE–shear (right) for Europe, compared against datasets containing
severe weather reports only (red curves) and a combination of these reports with ATDnet lightning data (blue curves). From Tsonevsky et
al. (2018).
Figure 3. Histograms of cloud frequency as a function of cloud optical thickness and cloud top pressure for (a) satellite data and (b–d) three
simulations made with the COSMO model at 12 km (b) and 2 km (c, d, the latter with enhanced microphysics scheme) horizontal resolution.
From Keller et al. (2015).
cast is a specific customer-oriented forecast with the purpose 4 High-impact weather: fog
of providing early warning of convective activity in a par-
ticular area. The London TMA thunderstorm risk forecasts The second high-impact weather phenomenon considered
were verified for a range of thresholds against observations here is fog. According to the WMO definitions, fog is de-
provided by the UK air navigation service provider (ANSP) tected in observations when the visibility is below 1000 m,
of the delay in minutes (arrival, en route and alternative com- but in the context of high-impact weather different thresh-
bined) and arrival flow rate experienced at airports across the olds are often adopted, specific to the application of inter-
London TMA. Applying thresholds to the delay in minutes est. NWP models generally are not efficient in predicting
and flow rate data received directly from the UK ANSP al- fog and visibility conditions near the surface (Steeneveld et
lows for categorization of each forecast period into a high or al., 2015, since the stable boundary layer processes are typ-
medium impact event. This process enables a simple 2 × 2 ically not represented well in the NWP models. Therefore,
contingency approach to be taken when verifying the fore- for forecasting of fog/visibility, very-high-resolution (300 m
casts. Brown and Buchanan (2018) analysed the results using grid) models are employed in some of the NWP centres (Lon-
relative operating characteristic (ROC) curves, reliability di- don Model in Met Office UK and Delhi Model in NCMRWF,
agrams and economic value plots (e.g. Jolliffe and Stephen- India).
son, 2012).
4.1 Observations for fog
Fog and low stratus can be detected by surface or satellite
observations. Problems of visibility measures from manual
and automatic stations are described in Wilson and Mitter-
Nat. Hazards Earth Syst. Sci., 21, 1297–1312, 2021 https://doi.org/10.5194/nhess-21-1297-2021C. Marsigli et al.: Observations for high-impact weather and their use in verification 1307
Figure 4. Affected area and storm paths derived from radar data (closed contours) with (a) hailstone sizes categorized according to their
diameters in centimetres and (b) requests for assistance to the NSW State Emergency Service. From Schuster et al. (2005).
maier (2009). In principle, surface instruments can easily de- The EUMETSAT NWC-SAF example
tect fog (e.g. visibility and cloud base height measurements).
However, observation sites are sparsely distributed and do The Satellite Application Facility for supporting NoWCast-
not yield a full picture of the spatial extent of fog. Satellite ing and very-short-range forecasting (NWC-SAF) of EU-
data can compensate because of the continuous spatial cover- METSAT provides cloud mask (CMa) and cloud type (CT)
age they provide (Cermak and Bendix, 2008). The disadvan- products. In CMa, a multispectral thresholding technique is
tage of satellite data is the lack of observations when mid- used to classify each grid point. The thresholds are deter-
and high-level clouds are present (Gultepe, 2007). Also, the mined from satellite-dependent lookup tables using as in-
precise horizontal and vertical visibility at the ground is dif- put the viewing geometry (sun and satellite viewing angles),
ficult to assess based solely on satellite data. Satellite data NWP model forecast fields (surface temperature and total at-
alone cannot distinguish between fog and low stratus, be- mospheric water vapour content) and ancillary data (eleva-
cause it cannot be determined if the cloud base reaches the tion and climatological maps). With the CT mask a cloud
surface. Therefore, detection methods usually include both type category is attributed to the clouds detected by the CMa.
phenomena. Satellite data are used for the detection of fog To assess the cloud height, the brightness temperature of a
in several weather centres during the monitoring phase of cloud at 10.8 µm is compared to a NWP forecast of air tem-
operational practice. As an example, in India, fog is moni- perature at various pressure levels. The CMa followed by the
tored using satellite maps from fog detection algorithms de- CT application classifies each grid point as one of the listed
veloped for the INSAT-3D satellite of the Indian Space Re- categories (Derrien and Le Gléau, 2005). The points (or ar-
search Organization (ISRO). Published evaluations of model eas) that are labelled as fog can be used quantitatively, for
outputs for the prediction of fog employing satellite images example as a dichotomous (fog/no fog) value.
have mainly taken a case study approach (e.g. Müller et al., The 24 h Microphysics RGB (red–green–blue; descrip-
2010; Capitanio, 2013). Only few studies employed satellite tion available at http://www.eumetrain.org, last access:
data in an objective verification framework, using spatial ver- 20 April 2021) makes use of three window channels of MSG:
ification methods. 12.0, 10.8 and 8.7 µm. This product has been tuned for de-
tection of low-level water clouds and can be used day and
night throughout the year. In the 24 h Microphysics RGB
product fog and low clouds are represented by light green-
https://doi.org/10.5194/nhess-21-1297-2021 Nat. Hazards Earth Syst. Sci., 21, 1297–1312, 20211308 C. Marsigli et al.: Observations for high-impact weather and their use in verification
ish/yellowish colours. Transparent appearance (sometimes Terminal area forecasts (TAFs) give information about the
with grey tones) indicates a relatively thin, low feature that is expected conditions of wind, visibility, significant weather
likely fog. In order to use this product for fog and low-cloud and clouds at airports. Mahringer (2008) summarized a novel
detection as an observation in a verification process, a mask strategy to verify TAFs using different types of change
could be created, where pixels with light greenish/yellowish groups, where the forecaster gives a range of possible val-
colours are set to the value of 1 and all other colours set to 0. ues valid for a time interval. A TAF thus contains a range
Other centres developed different algorithms for similar of forecast conditions for a given interval. In this approach,
purposes: NOAA developed GEOCAT (Geostationary Cloud time and meteorological state constraints are relaxed in ver-
Algorithm Test-bed), which, among others, provides esti- ification. To evaluate the correctness of a forecast range, the
mates fog probability from satellite. Thresholds should be highest (or most favourable) and lowest (or most adverse)
applied to the probabilities in order to perform verification of conditions valid for each hour of the TAF are taken for veri-
model fog forecasts. fication. For this purpose, all observations within the respec-
tive hour are used (METAR and SPECI), which span a range
4.2 Usage of the new observations in the evaluation or of observed conditions. For each hour, two comparisons are
verification of fog made: the highest observed value is used to score the high-
est forecast value, and the lowest observed value is used to
score the lowest forecast value. Entries are made accordingly
Some studies demonstrating the verification of fog forecasts
into two contingency tables which are specific for weather
are briefly described below. Depending on the observation
element and lead time.
they use and on the purpose of the verification, pointwise or
From a model-oriented verification point of view of fog
spatial verification methods are adopted. In addition, there
and visibility, aiming at improving the modelling compo-
is a distinction, depending on the purpose of verification,
nents, generally the focus is on how accurately the model re-
between model-oriented and user-oriented methods. Spatial
produces ground and surface properties, surface layer meteo-
verification, e.g. using objects, or allowing for some sort of
rology, near-surface fluxes, atmospheric profiles, and aerosol
spatial shift, can be informative for modellers and as a gen-
and fog optical properties. Ghude et al. (2017) give details of
eral guidance for users. If a user needs information about per-
an observation field campaign for the study of fog over Delhi
formance at a particular location only (e.g. an airport), it does
in India. Such campaigns allow not only verification of var-
not matter whether the fog that was missed in the forecast
ious surface, near-surface and upper-air conditions, but also
was correctly predicted at a nearby location. For this user,
allow calibration of models or the application of statistical
classical pointwise verification measures are still the most
methods to improve raw model forecasts at stations of high
relevant. However, with the increased use of probabilistic
interest (e.g. airports). Micro-meteorological parameters like
forecasts (to be recommended especially in the case of fog)
soil temperature and moisture, near-surface fluxes of heat,
this distinction blurs somewhat, because the nearby correct
water vapour, and momentum in the very-high-resolution
forecast is likely to indirectly show up in the probabilistic
models (London Model and Delhi Model; 330 m grid reso-
scores of a given location. The work presented is organized
lution) could be verified using the field data.
as pointwise or spatial verification methods.
4.2.2 Spatial verification using satellite data
4.2.1 Pointwise verification
Morales et al. (2013) verified fog and low-cloud simula-
Zhou and Du (2010) verified probabilistic and deterministic tions performed with the AROME model at 2.5 km horizon-
fog forecasts from an ensemble at 13 selected locations in tal resolution using the object-oriented SAL measure (Wernli
China, where fog reports were regularly available. The fore- et al., 2008). The comparison was made against the Cloud
cast at the nearest model grid point was verified against ob- Type product of NWC-SAF. Roux (2017) subjectively veri-
servations over a long period. Boutle et al. (2016) performed fied ACCESS model forecasts of fog fraction in the vicinity
an evaluation of the fog forecasted by a very-high-resolution of Perth, Australia, against fog probability estimated from
run (333 m) of the Unified Model over the London area. Ver- Himawari-8 geostationary satellite data using the GEOCAT
ification was made at three locations where measurements package mentioned earlier.
were available: two visibility sensors at two nearby airports Westerhuis et al. (2018) and Ehrler (2018) used a differ-
and manual observations made at London city. Bazlova et ent satellite-based method for fog detection. The detection
al. (2019) presented the results of the verification of fog pre- method calculates a low-liquid-cloud confidence level (CCL
dicted with a nowcasting system at three airports in Russia, method) from the difference between two infrared channels
in the framework of the WMO Aviation Research Demon- (12.0 and 8.7 µm) from Meteosat Second Generation with a
stration Project (AvRDP). Indices from the contingency table spatial resolution of about 3 km. The grid points are also fil-
were computed against observations available from aviation tered for high- and mid-level clouds using the Cloud Type
weather observation stations. product information from the NWC-SAF data. The CCL
Nat. Hazards Earth Syst. Sci., 21, 1297–1312, 2021 https://doi.org/10.5194/nhess-21-1297-2021You can also read


