NEON: the first continentalscale ecological observatory with airborne remote sensing of vegetation canopy biochemistry and structure - SPIE ...
←
→
Page content transcription
If your browser does not render page correctly, please read the page content below
NEON: the first continental-
                                 scale ecological observatory
                                 with airborne remote sensing
                                 of vegetation canopy
                                 biochemistry and structure

                                 Thomas U. Kampe
                                 Brian R. Johnson
                                 Michele Kuester
                                 Michael Keller

Downloaded From: https://www.spiedigitallibrary.org/journals/Journal-of-Applied-Remote-Sensing on 20 Sep 2020
Terms of Use: https://www.spiedigitallibrary.org/terms-of-use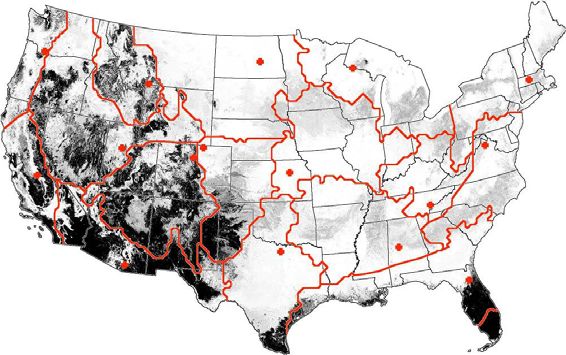
Journal of Applied Remote Sensing, Vol. 4, 043510 (17 March 2010)

                                      NEON: the first continental-scale ecological
                                 observatory with airborne remote sensing of vegetation
                                          canopy biochemistry and structure

                                            Thomas U. Kampe, Brian R. Johnson, Michele Kuester, and
                                                               Michael Keller
                                           National Ecological Observatory Network, Inc., 5340 Airport Blvd.,
                                                               Boulder, CO, USA 80301
                                 tkampe@neoninc.org, bjohnson@neoninc.org, mkuester@neoninc.org, mkeller@neoninc.org

                                 Abstract. The National Ecological Observatory Network (NEON) is an ecological
                                 observation platform for discovering, understanding and forecasting the impacts of climate
                                 change, land use change, and invasive species on continental-scale ecology. NEON will
                                 operate for 30 years and gather long-term data on ecological response changes and on
                                 feedbacks with the geosphere, hydrosphere, and atmosphere. Local ecological measurements
                                 at sites distributed within 20 ecoclimatic domains across the contiguous United States,
                                 Alaska, Hawaii, and Puerto Rico will be coordinated with high resolution, regional airborne
                                 remote sensing observations. The Airborne Observation Platform (AOP) is an aircraft
                                 platform carrying remote sensing instrumentation designed to achieve sub-meter to meter
                                 scale ground resolution, bridging scales from organisms and individual stands to satellite-
                                 based remote sensing. AOP instrumentation consists of a VIS/SWIR imaging spectrometer, a
                                 scanning small-footprint waveform LiDAR for 3-D canopy structure measurements and a
                                 high resolution airborne digital camera. AOP data will be openly available to scientists and
                                 will provide quantitative information on land use change and changes in ecological structure
                                 and chemistry including the presence and effects of invasive species. AOP science objectives,
                                 key mission requirements, and development status are presented including an overview of
                                 near-term risk-reduction and prototyping activities.
                                 Keywords: Remote sensing, ecology, vegetation structure, imaging spectroscopy, waveform
                                    LiDAR.

                                 1 INTRODUCTION
                                 A wide range of biotic and physical processes link the biosphere, geosphere, hydrosphere, and
                                 atmosphere. Despite this, our understanding of the biosphere does not match our increasingly
                                 sophisticated understanding of Earth’s physical and chemical systems at regional, continental,
                                 and global scales. Because many of these responses and feedbacks are large-scale, they
                                 cannot be investigated with disconnected studies on individual sites or over short periods of
                                 observation. The National Ecological Observatory Network (NEON), sponsored by the
                                 National Science Foundation, is a bold effort to build on recent progress in many fields to
                                 open new horizons in the science of large-scale ecology [1]. The NEON science focuses on
                                 questions that relate to the grand challenges in environmental science, are relevant to large
                                 regions, and cannot be addressed solely with traditional ecological approaches [2]. NEON is
                                 based on a multi-scaled sampling strategy, employing systematically deployed ground-based
                                 sensors, high-resolution airborne sensors and integration with national geospatial information.
                                     In this paper, we discuss the role of airborne remote sensing in the NEON design. The
                                 airborne instrumentation currently under development for NEON represents a significant
                                 advance in capability for providing detailed, regional information on ecosystem structure and

               © 2010 Society of Photo-Optical Instrumentation Engineers [DOI: 10.1117/1.3361375]
               Received 21 Oct 2009; accepted 18 Feb 2010; published 17 Mar 2010 [CCC: 19313195/2010/$25.00]
               Journal of Applied Remote Sensing, Vol. 4, 043510 (2010)                                                            Page 1
Downloaded From: https://www.spiedigitallibrary.org/journals/Journal-of-Applied-Remote-Sensing on 20 Sep 2020
Terms of Use: https://www.spiedigitallibrary.org/terms-of-use
function, and its response to changes in climate, land-use, and invasive species. The NEON
                                 Airborne Observation Platform (AOP) is an aircraft platform carrying remote sensing
                                 instrumentation designed to achieve sub-meter to meter scale ground resolution, bridging
                                 scales from organisms and individual stands of vegetation to satellite-based remote sensing.
                                 AOP instrumentation consists of a visible to shortwave infrared imaging spectrometer, a
                                 scanning small-footprint waveform LiDAR for three-dimensional canopy structure
                                 measurements and a high resolution airborne digital camera for fine-scale land use and cover
                                 identification. AOP data will be openly available to scientists and will provide quantitative
                                 information on land use change and changes in ecological structure and chemistry including
                                 the presence and effects of invasive species. Three AOP aircraft will be flown, providing
                                 regular mapping of NEON sites as well as supporting rapid response and Principal
                                 Investigator (PI) directed science campaigns. We present an overview of the AOP
                                 instrumentation; their critical design requirements, near-term risk-reduction and prototyping
                                 activities and how this instrumentation will be used to meet the NEON scientific objectives.

                                 1.1 The National Ecological Observatory Network
                                 The National Ecological Observatory Network (NEON) is a research platform for discovering
                                 and understanding the impacts of climate change, land‐use change, and invasive species on
                                 continental‐scale ecology [3]. Evidence of the importance of large-scale processes in the
                                 biosphere has been building over the last few decades. For example, the role of terrestrial
                                 vegetation as an important source or sink in the carbon cycle (with feedbacks to climate) is
                                 the focus of a wide range of research programs that include AmeriFlux [4], the First ISLSCP
                                 (International Satellite Land Surface Climatology Project) Field Experiment (FIFE) [5], the
                                 Boreal Ecosystem-Atmosphere Study (BOREAS) [6], the Large-Scale Biosphere-Atmosphere
                                 Experiment in Amazonia (LBA) [7], and the North American Carbon Program (NACP) [8].
                                 While several of these programs involve large-scale sampling, most ecological studies
                                 concentrate on organism interactions and their impacts on ecosystems at small scales. On the
                                 other hand, large-scale studies have largely ignored organism interactions and their outcomes,
                                 focusing instead on short-term feedbacks of the biosphere to the physical climate. NEON
                                 integrates these ecological processes and their large-scale feedbacks.
                                     NEON partitions the United States into 20 ecoclimate domains, based on a statistical
                                 analysis of ecoclimate state variables such as temperature, precipitation, and solar insolation.
                                 Each domain contains one fully instrumented NEON core site located in a wildland area.
                                 Taken together with observations from field observations, relocatable sites, airborne sensors,
                                 and mobile ground-based observing systems, as well as the integration of satellite and
                                 national data sets, the observatory aims to capture the ecological and climate variability at the
                                 continental scale over a 30-year period.
                                     The objective of the NEON observatory is two-fold: Infrastructure will be developed to:
                                 (1) provide systematic, long-term, large-scale data sets to scientists, students, educators and
                                 decision-makers; and (2) provide a research and educational platform for investigator-
                                 initiated sensors, observations, and experiments. NEON’s educational and outreach program
                                 will include numerous physical and virtual capabilities to enable educational and public use
                                 of the facility, including:
                                 •    A central web portal to provide on-line learning experiences, including access to
                                      scientific data, focused on the fundamental concepts associated with NEON;
                                 •    A web portal providing tools for decision makers to use NEON data to make
                                      scientifically-based decisions related to climate and land-use change;
                                 •    Professional development opportunities to prepare educators to use NEON data and
                                      educational tools, provide opportunities for educators to contribute to education product

               Journal of Applied Remote Sensing, Vol. 4, 043510 (2010)                                                              Page 2

Downloaded From: https://www.spiedigitallibrary.org/journals/Journal-of-Applied-Remote-Sensing on 20 Sep 2020
Terms of Use: https://www.spiedigitallibrary.org/terms-of-use
development and facilitate community collaboration, and investment in effective
ecological education;
• Research and internship opportunities for undergraduates to prepare future generations of
ecological scientists and science, technology, engineering, and mathematics (STEM)
professionals to use NEON data and broaden participation in STEM experiences by
traditionally under-represented groups;
• Workshops, seminars, and courses to provide training and learning experiences for
individuals to more effectively use and contribute to NEON data, tools, and learning
experiences.
For NEON to function as a continental-scale observatory, it must demonstrate that methods
exist to produce continental estimates using NEON’s observing strategy. Multivariate
Geographic Clustering (MGC) [9,10] was used for the NEON design and resulted in the
optimal selection of 20 domains. An alternative analysis using similar techniques based on the
Vegetation/Ecosystem Modeling and Analysis Project (VEMAP) data set [11] reached a
similar conclusion that approximately 20 domains are an appropriate solution [1]. In contrast
to approaches that use maps to divide the country geographically into ecological regions
[12,13], MGC techniques were applied using nine ecoclimate input variables mapped across
the United States on a 1 x 1 km grid. The optimized outcome of the geographical analysis
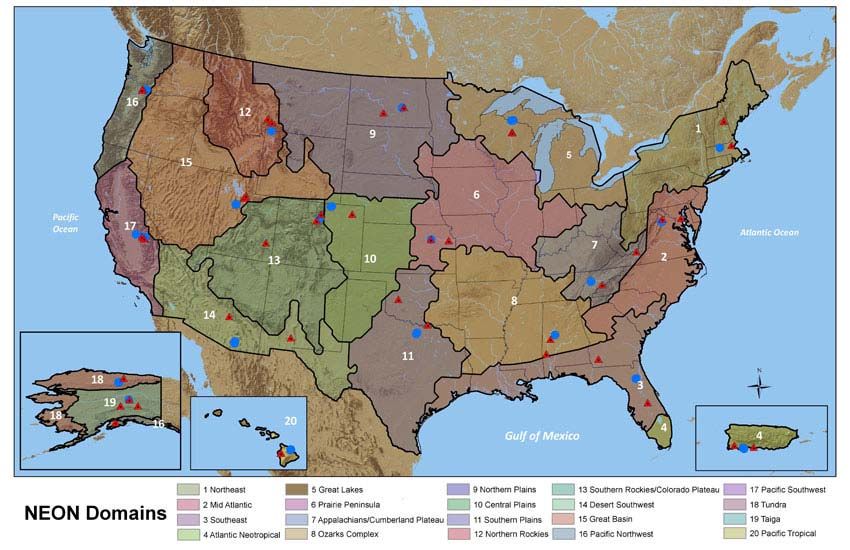
resulted in the 20 domains (Fig. 1). A core site, which remains fixed in location, and two
relocatable sites, which will be nominally be moved at five-year intervals, will be located in
each domain (Table 1). Specific information on individual NEON domains can be found on
the NEON Project website (www.neoninc.org).
To verify that this process resulted in sites that are representative of the ecoclimatic
variability across the nation, a map (Fig. 2) was computed that codes each grid cell according
to how similar it is to the NEON core site for that cell. The shading from white (well-
represented) to black in Fig. 2 represents the degree to which the eco-climatic characteristics
of the candidate core wildland sites represent environments in the conterminous United
States. Inspection of the figure shows that the Eastern portion of the country
Fig. 1. The NEON Domains distributed across the continental United States, Alaska,
Hawaii, and Puerto Rico.
Journal of Applied Remote Sensing, Vol. 4, 043510 (2010) Page 3
Downloaded From: https://www.spiedigitallibrary.org/journals/Journal-of-Applied-Remote-Sensing on 20 Sep 2020
Terms of Use: https://www.spiedigitallibrary.org/terms-of-useTable 1. Candidate NEON core sites and locations.
No. Domain Name Candidate Core Wildland Site Lat Long
(N) (W)
1 Northeast Harvard Forest 42.4 72.3
2 Mid-Atlantic Smithsonian Conservation Research Center 38.9 78.2
3 Southeast Ordway-Swisher Biological Station 29.7 82.0
4 Atlantic Neotropical Guánica Forest 18.0 66.8
5 Great Lakes University of Notre Dame Env Research 46.2 89.5
Center and Trout Lake Biological Station
6 Prairie Peninsula Konza Prairie Biological Station 39.1 96.6
7 Appalachians/ Oak Ridge National Research Park 35.6 84.2
Cumberland Plateau
8 Ozark Complex Talledega National Forest 32.9 87.4
9 Northern Plains Woodworth Field Station 47.1 99.3
10 Central Plains Central Plains Experimental Range 40.8 104.7
11 Southern Plains Caddo-LBJ National Grasslands 33.4 97.6
12 Northern Rockies Yellowstone Northern Range 45.1 110.7
13 Southern Rockies Niwot Ridge 40.0 105.6
14 Desert Southwest Santa Rita Experimental Range 31.8 110.9
15 Great Basin Onaqui-Benmore Experiment Station 40.2 112.5
16 Pacific Northwest Wind River Experimental Forest 45.8 121.9
17 Pacific Southwest San Joaquin Experimental Range 37.1 119.7
18 Tundra Toolik Lake Research Natural Area 68.6 149.6
19 Taiga Caribou-Poker Creek Research Watershed 65.2 147.5
20 Pacific Tropical Hawaii ETF Laupahoehoe Wet Forest Unit 19.9 155.3
is generally well-represented, although southern Florida and the Gulf Coast are somewhat less
well represented than the majority of the East. Representation in these areas would likely
increase if the NEON Atlantic Neotropical Domain Core site had been included in the
analysis. In the West, representation is more heterogeneous, particularly in the desert
southwest and in the Rocky Mountains. This is because of the high degree of linked climatic
and biological variation related to complex topography and terrain. Orographic variability is
improved by the selection of appropriate first-round relocatable site in the West [1].
The overarching scientific goal of NEON is to enable understanding and forecasting of the
impacts of climate change, land use change, and invasive species on continental-scale
ecology. To accomplish this, NEON must be able to extrapolate relationships between the
ecosystem drivers (climate change, land-use change and biological invasions) and the
ecological consequences to areas not sampled by the NEON facilities, but where partial,
extensively sampled or gridded information is available. Adequately capturing drivers and
responses, which occur over a considerable range of spatial and temporal scales, requires a
multiplicity of integrated measurement approaches. The NEON design accomplishes this
through the implementation of four science facilities: the Airborne Observation Platform
(AOP), Fundamental Sentinel Unit (FSU), Fundamental Instrument Unit (FIU), Mobile
Deployment Platform (MDP), and the Land Use Analysis Package (LUAP). The FSU and
FIU facilities include both aquatic and terrestrial measurements at core and relocatable sites.
FSU field measurements will record key response variables in selected taxa (plants,
insects, birds, small mammals, pathogens, phytoplankton, fish, and microbes) and substrates
(soil and water). Most of the field measurements are made by field personnel and analyzed in
contracted laboratories including a chemical analysis facility, an isotopic analysis facility, an
infectious disease analysis facility, and a genetic and genomic analysis facility. A strategically
selected portion of material collected will be curated in the NEON BioArchive facilities for
Journal of Applied Remote Sensing, Vol. 4, 043510 (2010) Page 4
Downloaded From: https://www.spiedigitallibrary.org/journals/Journal-of-Applied-Remote-Sensing on 20 Sep 2020
Terms of Use: https://www.spiedigitallibrary.org/terms-of-useFig. 2. NEON domain representativeness. Not shown are the domain boundaries in
Alaska, Hawaii and Puerto Rico (from Keller et al.(2008) [1]).
future retrospective analyses by investigators. Candidate investigations include the study of
Peromyscus (deer mice) demography and Hantavirus prevalence, forecasting future disease-
carrying mosquito communities in response to climate change, and examining the effect of
climate change on the nitrogen export in small streams.
The Fundamental Instrument Unit will make airshed and watershed-level observations
using automated approaches from terrestrial towers and aquatic instruments. It will provide
data on key local physical and chemical climate forcings including temperature, humidity,
wind velocity and direction, precipitation, radiation, carbon dioxide, ozone, and reactive
nitrogen. Terrestrial and aquatic flux measurements from the Fundamental Instrument Unit
provide estimates of ecosystem responses to the physical and chemical environment in the
form of carbon, water, and energy fluxes. The Fundamental Instrument Unit also measures
some biological responses (photosynthesis and transpiration, leaf area). In addition, detailed
soil measurements including temperature, moisture, carbon dioxide concentration and surface
carbon dioxide flux will be performed. Field measurements conducted by the Fundamental
Instrument Unit will represent areas of a few hectares to hundreds of hectares, depending
upon the specific ecosystem.
A Mobile Deployment Platform (10 units are planned) enables a subset of the FSU and
FIU measurements to be strategically deployed in response to external events or PI-driven
investigations. The AOP will also have the capability to be deployed in response to PI-driven
science investigations (e.g., regional surveys of invasive species or phenology) and in
response to extreme events to monitor the environmental forcings (e.g., hurricane damage)
and responses (e.g., re-growth after fire).
The AOP uses airborne remote sensing instruments deployed on aircraft to observe land
use drivers in the region surrounding NEON sites. The airborne platform measures the plant
canopy and habitat structure characteristics surrounding NEON sites.
The Land Use Analysis Package provides information on land use and land management
drivers at a continental scale, and also provides information on land use not easily accessible
through remote sensing (e.g. fertilizer inputs, cultivation intensity, forest rotation length).
This package is a gateway to a wide variety of geospatial data products and will provide
access to information that ecological modelers and forecasters can use to extend their
modeling to a continental scale. It will collate existing information, primarily through national
data bases, on past and current land use practices, soils and topography, as well as economic
Journal of Applied Remote Sensing, Vol. 4, 043510 (2010) Page 5
Downloaded From: https://www.spiedigitallibrary.org/journals/Journal-of-Applied-Remote-Sensing on 20 Sep 2020
Terms of Use: https://www.spiedigitallibrary.org/terms-of-useand social data useful for prediction of future land use processes as well as basic ecosystem
performance data derived from satellite remote sensing. The package will support a broad
range of ecological studies, including as an example the study of climate change, land use,
and fire regimes in Alaska.
The NEON infrastructure also supports experiments that accelerate ecological changes
towards anticipated future conditions. Multi-site experiments at a continental scale, involving
coordinated manipulations (e.g., warming, altered precipitation, or reduced biodiversity) will
be used to assess large-scale controls on ecosystem responses and provide unique tools for
establishing mechanisms and testing ecological theory. The first NEON experiment will be
the Stream Observation Network Experiment (STREON) [14]. Its primary scientific purposes
are (a) to study how stream ecosystems respond to an acceleration of one of the key drivers of
their structure and function (nutrient loading), and (b) to determine how the loss of top
consumers, singularly and interactively with increased nutrient loading, affects stream
structure and function. This experiment will address the question of how the resilience and
resistance of stream ecosystems are affected by chronic nitrogen and phosphorous enrichment
and the simplification of food webs under conditions of hydrologic variability and expected
increases in extreme events. The STREON experiment will be situated at core and relocatable
sites distributed across key climate gradients and representative of the dominant stream
hydrology regimes present in the Northern Hemisphere.
1.2 Airborne Remote Sensing
The NEON airborne remote sensing instrumentation is designed to bridge scales from
organism and stand scales, as captured by field and tower observations, to the scale of
satellite based remote sensing. The AOP will achieve sub-meter to meter scale spatial
resolution that will allow measurements at the level of individual plant canopies or small
groups of organisms. The AOP is designed to measure the effects of land use change, climate
change, and changes in vegetation state and performance, including the presence and effects
of invasive species. The optimum available instrumentation to implement these capabilities
are a high-fidelity visible to shortwave infrared spectrometer, and a waveform LiDAR
together with a high-resolution digital camera. A separate ancillary upward-looking solar
spectrometer provides information on incoming solar radiation at the flight altitude needed for
quantitative data processing. Data from this sensor support atmospheric correction of the
measured spectral radiance from the ground-viewing imaging spectrometer and can be
diagnostic of higher level clouds that may introduce artifacts in the data. In addition,
atmospheric characteristics will be collected via a sun-photometer and weather station
equipment at each core and relocatable site for input into a radiative transfer model for
atmospheric correction.
The AOP will also contribute to the understanding of ecosystem forcings and responses
represented by vegetation states and processes. Some invasive plants can be detected both
through their spectral properties and their structural properties [15,16]. Pest and pathogen
outbreaks, changes in competitive relations, responses to disturbances like wildfire, and many
features of land use are also readily observed and quantified using the combination of
biochemical and structural information provided by spectroscopy and waveform LiDAR.
The high cost of aircraft operations limits the frequency of airborne surveys of individual
NEON sites. To detect interannual trends, NEON will seek to overfly each core and
relocatable site annually. To minimize the phenological contribution to the signal, flights will
be designed to collect remote sensing data over each site during a period of peak greenness
which is currently defined as the range of dates where Moderate Resolution Imaging
Spectrometer (MODIS) [17] normalized vegetation difference index (NDVI) [18] for the site
is within 90% of the site maximum. A preliminary assessment of typical peak greenness
periods at each of the NEON sites helps to schedule flights (Fig. 3).
Journal of Applied Remote Sensing, Vol. 4, 043510 (2010) Page 6
Downloaded From: https://www.spiedigitallibrary.org/journals/Journal-of-Applied-Remote-Sensing on 20 Sep 2020
Terms of Use: https://www.spiedigitallibrary.org/terms-of-useAnnual observations of the NEON sites inevitably miss important site-level signals such
as phenology. Higher frequency data on vegetation function is for example, available from
field measurements, or from satellite measurements at a coarser resolution. Meter-scale AOP
measurements serve to bridge these scales and measurements conducted over the course of
the growing season and can capture changes in phenology. We expect future satellite remote
sensing to provide relatively frequent (days to weeks) moderate resolution multi-spectral data
at the 500 to 1000 m spatial scale. A sufficiently large area must be flown by AOP for reliable
comparison to satellite measurements. Currently we estimate that each AOP site mission will
cover up to 300 km2 at 1 to 3 meter ground resolution, a compromise between area coverage
and cost.
Fig. 3. MODIS NDVI data are used to determine the available estimated peak green
period for each domain. Grey and black bars represent days of the year (DOY) that
meet peak greenness criteria (see text) for AOP payloads 1 and 2 respectively. The
White bars indicate baseline planned flight days for operations in each domain.
2 AIRBORNE OBSERVATION PLATFORM
The major functional elements of the AOP are the aircraft platforms, three identical remote
sensing instrument payloads, the sensor maintenance and calibration facility, a data
processing, archiving and distribution facility, and flight operations. Each instrument payload
will consist of an imaging spectrometer, a small footprint waveform LiDAR, an airborne
digital camera and a dedicated Global Positioning System (GPS) and Inertial Measurement
Unit (IMU) subsystem. An integrated GPS-IMU is required to precisely measure instrument
payload position and attitude during remote sensing data collection. This information will be
combined with knowledge of the relative orientation of the optical sensors in the GPS-IMU
reference frame to compute the line-of-sight trajectory of each laser shot, and spectrometer
and camera detector element at a specific time. The common time reference for sensor
observations will come from the GPS unit. Data collected over each site will be stored on
removable hard drives and sent to the NEON Headquarters for input to the NEON data
processing facility and subsequently available to the public via the NEON web portal.
Journal of Applied Remote Sensing, Vol. 4, 043510 (2010) Page 7
Downloaded From: https://www.spiedigitallibrary.org/journals/Journal-of-Applied-Remote-Sensing on 20 Sep 2020
Terms of Use: https://www.spiedigitallibrary.org/terms-of-use2.1 Instrumentation
The AOP spectrometer measures the reflectance of the Earth in several hundred narrow
spectral bands between 380 and 2500 nm, providing the capability to reliably remotely
measure the subtle biochemical and biophysical properties of vegetation from an airborne
platform. The hyperspectral data provided by the imaging spectrometer provides the
capability to assess vegetative species diversity and classify vegetation to plant functional
types or species levels [19]. The inclusion of the shortwave infrared provides enhanced
capability for discriminating tropical and temperate tree species [20,21] and the
discrimination of senesced plant materials, wood, or bark from background soils. Spectral
bands within the visible to near-infrared portion of the spectrum provide the capability for
characterizing canopy chemistry, physiology, and type.
Imaging spectroscopy was originally developed in the 1970s and first demonstrated with
the Airborne Imaging Spectrometer (AIS) that acquired scientific data from an airborne
platform in 1982 [22]. Further development over the last decade driven largely by scientific
work with the Airborne Visible and Infrared Imaging Spectrometer (AVIRIS), a whiskbroom
scanning imaging spectrometer [23,24] that has been instrumental in the development of
terrestrial imaging spectroscopy [25-28]. More recently, pushbroom imaging spectrometers,
such as the Compact Airborne Spectrographic Imager (CASI) [29], the Environmental
Mapping and Analysis Program sensor (ENMAP) [30] and the Airborne Prism Experiment
(APEX) [31] have been developed and become the preferred form for airborne terrestrial
remote sensing. Pushbroom imaging spectrometers have the advantage of increased
integration time over a whiskbroom scanner for a given flight speed and altitude, but are
difficult to fabricate and challenging to test due to demanding spectral and spatial uniformity
requirements for terrestrial remote sensing applications [32].
A trade study conducted early in the NEON development resulted in the selection of the
pushbroom implementation for the imaging spectrometer. This trade was driven by the need
for a wide field of view, high spatial resolution, uniformity, and high signal-to-noise
requirements. Systems trades have resulted in an instrument with the full 380 to 2500 nm
spectral band being dispersed over a single focal plane array, sampled at 5 nm and operating
at a spectral resolution of 10 nm. With an instantaneous field of view of 1 milliradian, the
imaging spectrometer provides a ground resolution of between 1 to 3 meters and ground
swath of 700 to 2200 m depending on flight altitude, thereby providing a critical link in
scaling from individual plant or canopy attributes, to plot or stand level observations across
the 20 NEON eco-climate domains, and ultimately, when combined with satellite
observations, extrapolation to continental scales.
The imaging spectrometer design utilizes a single spectrometer module and focal plane
array to achieve the required uniformity. The entire imaging spectrometer, including
telescope, spectrometer and FPA will be housed in a vacuum chamber and cryogenically
cooled to 150 K to minimize background noise and dark noise to meet the high signal-to-
noise required, in addition to providing a controlled thermal environment for the spectrometer
during flight operations. An on-board calibration subsystem is integral to each imaging
spectrometer providing the capability for flat fielding for every imaging spectrometer data set,
traceability to laboratory calibration standards, and a means for conducting trend analysis to
monitor imaging spectrometer performance over time. The on-board calibrator, in conjunction
with the NEON laboratory calibration facility also provides a means for cross calibrating
between replacement sensors over the lifetime of the 30-year NEON observatory and between
sensors flying on separate airborne platforms.
Airborne LiDAR directly measure the three-dimensional distribution of plant canopies, as
well as sub-canopy topography, providing high-resolution mapping of vegetation height,
cover, and canopy structure. The basic measurement made by a LiDAR device is the distance
between the sensor and a target surface, which is obtained by determining the elapsed time
Journal of Applied Remote Sensing, Vol. 4, 043510 (2010) Page 8
Downloaded From: https://www.spiedigitallibrary.org/journals/Journal-of-Applied-Remote-Sensing on 20 Sep 2020
Terms of Use: https://www.spiedigitallibrary.org/terms-of-usebetween the emission of a short duration laser pulse and the arrival of the reflection of that
pulse (the return signal) at the sensor’s receiver. In the early 1970s laser altimeters were first
flown to measure the topography of the Moon [33]. This technology has since developed such
that it can be utilized to measure not only physical surface topographies, but also vegetation
canopy structure. These discrete return LiDAR data have been used in the forestry and
ecological sciences in the past decade for gaining a better understanding of ecological
parameters by measuring canopy heights in forested regions [34]. The number of recordable
pulse reflections is limited, however, with the discrete return LiDAR [35]. Airborne laser
altimeters that have pushed the boundaries of this measurement technology include the
Airborne Topographic Laser Altimeter System (ATLAS) and the Scanning Lidar Imager of
Canopies by Echo Recovery (SLICER) (36,37). While discrete-return LiDAR provide single
or a small number of vertical positions, the waveform LiDAR records the entire time-varying
intensity of the returned energy from each laser pulse. The waveform captures the entire
height distribution of the objects illuminated by the laser pulse [34,37,38]. Full-waveform
LiDAR are currently gaining more attention as they allow for the detection of understory
structure in forested environments and give a more complete measurement of topographic
vertical structure throughout the vegetation [39,40]. The Laser Vegetation Imaging Sensor
(LVIS) uses a full-waveform laser altimeter to measure surface topography, and vegetation
height and structure within a 10–30 m footprint [41]. More recently, small footprint
waveform LiDAR have been used to determine ecological parameters such as tree height and
species classification, leaf area index, and even to measure fuel loads of coarse woody debris
on the forest floor [34,35]. Recent studies are looking at small footprint LiDAR to investigate
the vegetation structure of rangelands [42].
Recording the continuous waveform also minimizes the 2-3 meter range ambiguity
associated with discrete return LiDAR allowing improved detection of low statue shrubs.
Both types of systems have been used extensively for estimating vegetation structure
[34,44,45], however the capability of waveform-LiDAR to provide highly accurate estimates
of vegetation height, cover, and canopy structure at fine spatial resolution was deemed
necessary to generate fused lidar-hyperspectral products for three-dimensional studies of
ecosystems [16,28]. The desire for high-resolution, 3-dimensional detail of vegetation
structure (e.g. canopy height, volume and crown shapes) and underlying topography, as well
as for the potential data products that can be produced by combining these data with that
collected by the AOP imaging spectrometer, drove the requirement for rapidly scanning
small-footprint waveform LiDAR.
The waveform LiDAR will achieve a high pulse repetition frequency; high scan
frequency; and measurements over a wide scan angle of 35 degrees to match the swath width
of the imaging spectrometer. A ground resolution of 1 to 3 meters is necessary to resolve
individual plant canopies and vegetation clusters. For the planned aircraft flight altitudes and
100-knot (185 km/hr) ground speed, this implies a beam divergence of 1 milliradian or less
and scan rates of 50 Hz or higher. The AOP waveform LiDAR will be "eye safe" at its
operational altitudes as defined in ANSI Standard Z136.1.
High-resolution digital imagery is useful for determining land use and allows for full
visualization of the morphology of site locations. Image resolution that is at least three times
finer than the spectrometer resolution (e.g. ≤ 30 cm on the ground for a flight altitude of 1000
m) will be provided. The digital camera will be a commercial off-the-shelf, moderate format
camera of appropriate focal length and field of view to match the swath width of the other
AOP sensors.
Measurements made by the remote sensing instruments must be accurately registered in a
common geographic coordinate system during ground data processing. This requires the
relative alignment of the optical sensors be accurately known and remain stable during flight.
Precise 3-dimensional measurements of the payload position are provided by a Global
Position System (GPS) sensor mounted with the optical sensors. An Inertial Measurement
Journal of Applied Remote Sensing, Vol. 4, 043510 (2010) Page 9
Downloaded From: https://www.spiedigitallibrary.org/journals/Journal-of-Applied-Remote-Sensing on 20 Sep 2020
Terms of Use: https://www.spiedigitallibrary.org/terms-of-useUnit (IMU) is integrated with the GPS to provide precise information on changes in the
relative orientation of the payload. Information on payload position and attitude are combined
with knowledge of the relative orientation of the sensors determined during ground
calibration and updated in-flight. The relative sensor alignment must be maintained during
flight to enable the optical boresights to be accurately related to the GPS-IMU measurements.
The integrated GPS-IMU must be capable of achieving very high accuracy and precision in
measuring the position, velocity and attitude of the aircraft payload. The GPS measurements
must be made at 10 Hz or greater. Inertial measurements must be made at 200 Hz or greater.
An output time stamp signal from the GPS-IMU will be input to the waveform LiDAR,
digital camera, and imaging spectrometer measurement data streams to ensure a common
time reference frame during ground processing.
The design approach for integrated sensor measurements is to mount the instrumentation
onto a common mechanical structure to maintain their relative alignment and provide a
mechanical interface to attach the structure to the inside the aircraft cabin in the proper
orientation along the flight track and to view through an open port in the cabin floor during
flight. The structure will provide a common mechanical interface for holding the imaging
spectrometer, waveform LiDAR, digital camera and GPS-IMU during flight. The structure is
rigid to maintain relative mechanical alignment between sensors and isolates the
instrumentation from aircraft mechanical vibrations.
2.2 Aircraft
The required capabilities of the aircraft are determined largely by the sensor performance
characteristics. In particular, the maximum flight altitude is set by the required signal-to-noise
ratio necessary for retrieving vertical structure from the waveform LiDAR. The low flight
altitude limit and range of ground speeds are set by a desire to achieve 1 to 3-meter ground
resolution, and a need to maximize signal integration time for the spectrometer, respectively.
Together, the waveform LiDAR and spectrometer requirements drive the desired platform
capability towards a low and slow performance range with survey speeds of 167 to 204 km/hr
and survey altitudes up to 3,000 m. The Twin Otter DeHavilland DHC-6-300 aircraft fits
these criteria and accommodates the instrument payload weight and volume with reserve for
the possibility of additional sensors as they are developed and added to the NEON
infrastructure or as required to support PI-driven science campaigns. This aircraft exhibits
low stall speed, and excellent low speed handling and stability. It has a good safety record and
is well known to scientific researchers in the field. The two-engine design eliminates
propeller wash and exhaust issues with the instrumentation, a potential problem with single
engine aircraft where engine exhaust travels along the underside of the aircraft.
2.3 Calibration
Effective calibration depends on thorough planning, careful execution, and effective
monitoring, verification and validation. Our approach to calibration follows commonly
accepted procedures and methodologies where they exist. Calibration and validation is
ongoing and all measurements are traceable to laboratory calibrations and national standards.
Radiometric measurements will be traceable to National Institute of Standards and
Technology (NIST) standards. The calibration and validation plan works to ensure a
consistent data product from instrument-to-instrument, domain-to-domain, and year-to-year
over the 30-year lifetime of the NEON project. A team of experts in the calibration of remote
sensing instrumentation will support NEON and take part in working group activities in the
months preceding operations to ensure a well thought out and technically sound calibration
and validation plan.
The AOP Sensor Technical Facility will be built to accommodate the maintenance and
calibration needs of the AOP. This facility will be equipped to both validate instrument
Journal of Applied Remote Sensing, Vol. 4, 043510 (2010) Page 10
Downloaded From: https://www.spiedigitallibrary.org/journals/Journal-of-Applied-Remote-Sensing on 20 Sep 2020
Terms of Use: https://www.spiedigitallibrary.org/terms-of-userequirements and calibrate instrument output to standard geophysical units. The 280 square
meter facility will be equipped to accommodate annual maintenance, calibration and test
fixtures development. AOP sensors will undergo yearly maintenance and calibration before
they go into the field at the beginning of each flight season. Calibration of the imaging
spectrometer includes pixel-to-pixel uniformity, radiance coefficients, radiometric spectral
response, spectral uniformity, spectral dispersion, linearity, stray light, and out of band
characterization. A subset of these tests will be performed on the digital camera.
Characterization of the waveform intensity and shape, timing and ranging calibration and
laser stability measurements will be made with the waveform LiDAR. Boresight
measurements will be performed in the lab as well. Several checks will be set in place while
the instruments are in the field to ensure that the calibrations remain valid. If it is found that a
calibration is drifting, a decision will be made to send the instrument back to the AOP facility
for recalibration.
To ensure stability in AOP calibrations over time and between sensors, detailed
procedures for each test are being developed and these will be followed in order to minimize
systematic errors. This is specifically important to geometric calibrations and the waveform
LiDAR characterization. Models of expected output from each of the three sensors are being
developed as diagnostic tools. A detector-based method will be implemented in laboratory
radiometric calibrations by the use of a well-characterized and extremely stable NIST
traceable transfer radiometer. Solar radiation based calibrations will be performed during
annual laboratory testing of NEON imaging spectrometer as an independent validation of the
calibration facility. The on-board calibrator will be used in the laboratory as a side-by-side
calibration during radiometric testing of the imaging spectrometer. By monitoring flat field
information from the on-board calibrator and monitoring changes over time, the radiometric
stability of the imaging spectrometers can be assessed. Pre-flight calibrations in the field with
solar radiation based calibrations and lamp-panel-sensor setups will allow for the monitoring
of imaging spectrometer and digital camera radiometric calibration drift.
The annual laboratory radiometric and spectral calibrations and spatial tests will be
independently tested by vicarious calibration campaigns early in the flight season. At this
time instrument boresight will be characterized as well. In order to facilitate stability of data
sets across all three payloads that are used for measurement collection, cross-calibration
between all AOP instrumentation will occur during these vicarious calibration campaigns (i.e.
all three payloads will fly together during the campaign). Similar techniques will be used to
ensure continuity of data between generations of instruments over the lifetime of the NEON
Observatory. In addition, calibration targets located throughout the domains that are easily
flown during operations will be sampled throughout the year (i.e., parking lots, playas, and
other uniform non-changing surfaces). Ground characterization of these sites will take place
every five years; for intermediate ground characterizations, imagery from a 20–30 meter
moderate resolution satellite borne spectral imager can be used to determine the stability of
the site. It is also planned that AOP flights will coincide with satellite overpasses whenever
possible, especially during vicarious calibration flights. This gives an additional independent
check on instrument calibration and validation for NEON data products.
2.4 Near-term Developmental Activities
Early development of the remote sensing payload provides an opportunity to reduce the
design and fabrication risk prior to actual spectrometer builds during NEON construction. By
building and testing a visible-to-shortwave infrared spectrometer design verification unit and
demonstrating that key performance and operational goals have been met, the majority of
technical risk can be retired prior to science operations. In September 2009, NEON Inc. was
awarded a 2-year grant by the National Science Foundation for the development of the NEON
Imaging Spectrometer Design Verification Unit. In addition to imaging spectrometer
Journal of Applied Remote Sensing, Vol. 4, 043510 (2010) Page 11
Downloaded From: https://www.spiedigitallibrary.org/journals/Journal-of-Applied-Remote-Sensing on 20 Sep 2020
Terms of Use: https://www.spiedigitallibrary.org/terms-of-usehardware development, this program includes scientific software design and prototype
science algorithm development associated with Level-1 science data processing to reduce risk
and fully exploit the powerful synergy between imaging spectrometer and waveform LiDAR
measurements. As part of this development effort, a series of test flights are planned. These
include vicarious calibration flights to verify procedures and validate radiometric laboratory
calibration and instrument boresight co-registration, and a flight campaign targeted at
advancing LiDAR-imaging spectrometer data fusion algorithms over a well-characterized
forest site.
3 PLAN FOR SCIENCE OPERATION
Each year, the AOP flight plan will be developed from a baseline mission plan that includes
the standard observations of the core and relocatable sites of all 20 NEON domains, as well as
directed flights to planned targets or unplanned flights in response to unanticipated events
(e.g. response to wildfire). The flight season will occur between April and September for the
sites located in the contiguous 48 states. Flights over the Alaskan sites will occur in a
relatively narrow window of time in July and August. Data collections over sites in Hawaii
and Puerto Rico have relatively wide time windows of opportunity. However, weather and
cloud cover may be more of an issue at these sites. Puerto Rico will be flown early in the year
to avoid the hurricane season. Hawaii will be the last domain flown as not to significantly
impact the campaign year since equipment must be shipped over the Pacific Ocean.
The aircraft will undergo routine maintenance during times other than the main flight
season to maximize aircraft availability. Routine sensor maintenance will be performed in
November to February, including yearly calibrations performed in the AOP Sensor Facility.
At the end of the flight season, the payloads will undergo functional testing and required
maintenance. After the sensors have undergone needed maintenance and the payload flight
configurations are fully restored, the instruments will undergo complete in-lab calibration
testing. Results of the in-lab testing and calibration, including establishing new calibration
coefficients for the upcoming season, will be complete before the flight season begins.
The notional baseline mission-plan for the year will be put together in February and
March for the upcoming season and initial flight plans will be released for all sites to be
flown in that year. The mission plan for each year will be posted on the NEON website.
Fieldwork requirements will be set in motion for the upcoming season. In April, the payloads
will be integrated into their aircraft and the mission season begins. Every year a vicarious
calibration campaign will be performed over a well-known calibration target in the western
United States to validate radiometric and spectral calibrations performed in the laboratory on
the imaging spectrometer [45]. Spatial calibration of the imaging spectrometer will be
verified using local man-made structures. Well-known ground targets will be used to verify
waveform LiDAR performance. The three payloads will be flown together with appropriate
ground instrumentation supporting the vicarious calibration campaign. A detailed optical
boresight calibration will also be performed in flight by surveying a specific ground site with
accurate GPS tie points (e.g. GPS survey of local Boulder, CO airport).
The baseline mission flight plan is optimized so that sites are over-flown during peak
productivity and at a time with the best chances for cloud-free weather or with minimal cloud
cover. These considerations are balanced with consideration for distances between domains in
order to efficiently cover all the sites with the least amount of transit time. Two of the
payloads are used to cover the eastern (Payload 1) and western (Payload 2) portion of the
NEON realm. Payload 3 is used for additional directed flights and as a "hot spare" for the first
two payloads (Fig. 4).
Journal of Applied Remote Sensing, Vol. 4, 043510 (2010) Page 12
Downloaded From: https://www.spiedigitallibrary.org/journals/Journal-of-Applied-Remote-Sensing on 20 Sep 2020
Terms of Use: https://www.spiedigitallibrary.org/terms-of-useFig. 4. An example mission flight plan. Payload 1 is indicated by the blue circles.
Payload 2 is indicated by the orange diamonds. Payload 3 is reserved for directed
flights and as a "hot spare."
3.1 Domain Peak Growing Season
To develop a baseline plan for flight operations including when each domain would be
surveyed, knowledge of plant phenology each region was necessary. A study was conducted
to look at the NEON domains to determine the growing season of the dominant plant species
in each of these areas. National Aeronautics and Space Administration’s (NASA) Moderate
Resolution Imaging Spectroradiometer (MODIS) Normalized Difference Vegetation Index
(NDVI) [46,47] data from the Oak Ridge National Laboratory Distributed Active Archive
Center are used to define, to first order, when the vegetation of each of the domains is in the
peak of its growing season. NDVI data was collected for a 21 x 21 km square around the
center of the core site of each domain. These monthly NDVI data for 2004, 2005, and 2006
were averaged to create a time series of monthly NDVI.
The peak of the growing season, or actual available "green" flyover time, was then
calculated by including all days that have an NDVI that is 90% of the maximum value in that
region. The results for core sites in the north-east and Alaska are shown in Fig. 5.
Climate data and inquiries with local domain researchers are used to refine the definitions
of the peak greenness windows in all regions. For example, every year is different depending
on temperatures and precipitation in Domain 9, in the northern plains. Some years may green
up as early as the end of April and other years, it will be much later in the season in May [48].
Fig. 6 shows data for Domain 9. To get at least a climatological understanding for how the
weather–in particular, cloud cover–will behave during a typical year, National Climate Data
Center mean sunshine data for each domain was collected and this has been factored into the
selection of flight days for each domain. Remote sensing data must be collected during days
with very little cloud cover, low aerosol loading and stable atmospheric conditions. It is
recognized that there is a natural variability from year to year in the start and length of the
growing season associated with the 20 domains and therefore it is assumed that these dates
will change.
Journal of Applied Remote Sensing, Vol. 4, 043510 (2010) Page 13
Downloaded From: https://www.spiedigitallibrary.org/journals/Journal-of-Applied-Remote-Sensing on 20 Sep 2020
Terms of Use: https://www.spiedigitallibrary.org/terms-of-useFig. 5. MODIS NDVI data for Domain 1 in the northeast United States shows a peak green
season of 128 days, while Domain 19, in Alaska, has a much shorter peak green season of 81
days. MODIS NDVI data for a 21 x 21 km2 area centered about the core site was computed for
2004 (blue), 2005 (red), 2006 (green) and averaged over 3 years (black). MODIS NDVI data
was obtained from the Oak Ridge National Laboratory DAAC [47].
(a)
(b)
(c)
(d)
Fig. 6. Domain 9 MODIS (a) NDVI data, (b) growing degree days, (c) average temperatures,
and (d) total precipitation climate data are evaluated to understand when the peak growing
season occurs. Flights for this domain will be planned during this "green" period. MODIS NDVI
data for 2004 (blue), 2005 (red), 2006 (green) are averaged (black). Average maximum (solid)
and average minimum temperature (dashed) are displayed in (c). Total precipitation (solid) and
snow (dashed) are shown in (d).
Journal of Applied Remote Sensing, Vol. 4, 043510 (2010) Page 14
Downloaded From: https://www.spiedigitallibrary.org/journals/Journal-of-Applied-Remote-Sensing on 20 Sep 2020
Terms of Use: https://www.spiedigitallibrary.org/terms-of-useThe greatest obstacle to meeting the baseline flight plan will likely be weather. For
example, humidity and air pollution on the east coast in late August could hinder
measurements. Severe weather in the central plains may delay operations in these regions.
The Santa Rita, Arizona site greening time coincides with the end of the monsoonal flow and
may vary significantly year-to-year. Waiting for the skies to clear in Alaska and Hawaii can
also cause significant delay in even the best of plans. To combat these expected delays,
contingency days and flight hours are added to the overall mission plan and directly for the
Alaska and Hawaii campaigns. Flexibility is also built into the operations plan; for example,
if stormy conditions are anticipated at the next site on the schedule, we may choose to move
on to another domain and return after the bad weather clears.
3.2 Domain coverage
Each site survey will cover up to 300 km2 at 1 to 3 meter ground resolution, as a sufficiently
large area must be flown for reliable comparison to satellite measurements. Solar angle
requirements for the imaging spectrometer limit successful survey flight time of day to about
4 hours around local solar noon. Smaller NEON sites (approximately less than 200 km2) can
easily be flown at 1 m resolution within this time limit, and larger areas around these sites
will be flown to accommodate comparison to satellite measurements. A few larger NEON
sites cannot be fully covered at 1 m resolution within this time limit. The Santa Rita core site
in Arizona is approximately 300 km2 and can be flown in a little over 5 hours and we should
be able to cover that entire site at 1 m, keeping in mind that the sun is higher in the sky at this
location than in many of the other sites. There are three outliers that are too large to be
covered in four hours at 1 m resolution; however, they can still be fully surveyed at 3 m
resolution. These sites are Toolik in Alaska, the Lyndon Baines Johnson Grasslands in Texas
and Yellowstone Northern Range in Montana and Wyoming. It is possible to cover all of
Toolik in 4 hours at a little less than 2-m resolution. The Lyndon Baines Johnson National
Grasslands and Yellowstone Northern Range require about a 3 m resolution for full coverage.
Consideration may also be given to extending allocated flight times to accommodate full
coverage of these sites at 1 m resolution depending on science needs. All NEON Core sites
can be surveyed at an aerial coverage of 300 km2 and at 1 to 3 m resolution.
3.3 Directed flights
The AOP is equipped to handle additional flights as needed and requested by the scientific
community. These directed flights could include , additional flights over NEON domain sites
for phenology, transects over scientifically important regions, areas impacted by wildfire or
other natural disasters, rapid deployment for significant natural or unnatural disasters, or as
part of joint campaigns with other agencies. The use of payload 3 for PI-driven campaigns
will be peer-reviewed through a proposal process led by NSF.
4 DATA PRODUCTS AND PROCESSING
4.1 Data processing
Processing the sensor data requires several steps before high quality geophysical data
products can be produced. The output of each processing step becomes the input to the next
higher level of data processing. After each step increasingly more sophisticated analyses and
diagnostics are performed to ensure that the output data meet the expected accuracies before
proceeding to the next processing step.
The convention for data levels is to assign Level-0 to the raw, unprocessed data recorded
at the output of the sensor (Table 2). After applying calibration factors, these data are
transformed into meaningful physical units in Level-1 data. Calibration factors are provided
Journal of Applied Remote Sensing, Vol. 4, 043510 (2010) Page 15
Downloaded From: https://www.spiedigitallibrary.org/journals/Journal-of-Applied-Remote-Sensing on 20 Sep 2020
Terms of Use: https://www.spiedigitallibrary.org/terms-of-useby the sensor manufactures and updated during routine sensor calibration. Calibration
coefficient tables and formulas for applying coefficients are developed and coded in the
processing scheme. The Level-1 data is captured with the native sampling characteristics with
little or no editing for data artifacts. In addition to physical units, the data is referenced to a
standard geographic coordinate system. In the NEON data products definition, Level-2 data
consists of temporally gap-filled data, typically from a single instrument or sensor (e.g.,
temperature sensors mounted on FIU towers) and is not applicable to AOP data stream.
Level-3 data consisting of sensor data derived from the Level-1 data will be mapped onto a
uniform 5-meter sampling grid (or fixed geographic locations) with missing spatial data filled
in. Level-4 data products are derived products using Level 1, 2 and/or 3 data. Products at this
level may combine observations from more than one NEON instrument, observer, and/or
sampling area.
Level-1 data volume for the AOP instrument suite for a single NEON site survey is
estimated at 480 gigabytes, resulting in a yearly data volume of approximately 38 terabytes.
This includes the standard observations of the 60 sites composing the full NEON observatory
and up to 8 Terabytes of data from directed flights. To handle this volume of data, the remote
sensing data processing segment will be integrated into the NEON Observatory
Cyberinfrastructure. Higher-level data products, in addition to calibrated, ortho-georectified
spectral reflectances, radiances and LiDAR waveforms (Level-1 data) for all sites will be
publically available via a web server. The NEON Observatory Cyberinfrastructure will
include all the computing power, storage capacity, networking capability from sensor to the
Web, and specialized software and hardware environments needed to conduct NEON
research. It also includes the people required to operate and maintain the equipment, develop
and support software, create standards and best practices, and deliver security, user help-desk
support, and other services.
Table 2. Representative Data Products Derived from AOP.
Level Product Description
L-0 Raw sensor output data Uncalibrated data from the spectrometer, LiDAR, and
camera
L-1 Geo-located, calibration Sensor spectral radiance: 380-2500 nm, 10 nm
sensor data (1-3 meter) resolution
Surface reflectance: 380 to 2500 nm, 10 nm resolution
LiDAR vertical waveform
Panchromatic imagery (15 to 30 cm resolution)
L-3 Mapped 5-meter sensor Surface reflectance: 380 to 2500 nm, 10 nm resolution
data "Nearest neighbor" LiDAR waveform
5-meter averaged LIDAR waveform
50-cm resolution imagery (zoom to Level-1 resolution)
4.2 AOP Science Data products
The airborne instrumentation is designed to support research on a range of important themes
in ecology in response to grand challenges in the study of biodiversity, biogeochemistry,
climate change, ecohydrology, infectious disease, invasive species, and land use change.
These science goals require observational data of a wide range of ecosystem attributes
ranging from plant functional types, vegetative biochemical and biophysical properties,
canopy structure to ecosystem functioning and response. In addition to AOP-specific science
data products, higher-level data products will combine information from other NEON science
facilities and satellite data. Some of these products will use primarily AOP data (Table 3)
while AOP data will contribute to other products such as ecosystem productivity and biomass
estimates.
Journal of Applied Remote Sensing, Vol. 4, 043510 (2010) Page 16
Downloaded From: https://www.spiedigitallibrary.org/journals/Journal-of-Applied-Remote-Sensing on 20 Sep 2020
Terms of Use: https://www.spiedigitallibrary.org/terms-of-useYou can also read


