From Lost to Found: Discover Missing UI Design Semantics through Recovering Missing Tags - arXiv
←
→
Page content transcription
If your browser does not render page correctly, please read the page content below
From Lost to Found: Discover Missing UI Design Semantics
 through Recovering Missing Tags

 CHUNYANG CHEN, Monash University, Australia
arXiv:2008.06895v2 [cs.HC] 3 Oct 2020

 SIDONG FENG, Australian National University, Australia
 ZHENGYANG LIU, Australian National University, Australia
 ZHENCHANG XING, Australian National University, Australia
 SHENGDONG ZHAO, National University of Singapore, Singapore
 Design sharing sites provide UI designers with a platform to share their works and also an opportunity to
 get inspiration from others’ designs. To facilitate management and search of millions of UI design images,
 many design sharing sites adopt collaborative tagging systems by distributing the work of categorization to 123
 the community. However, designers often do not know how to properly tag one design image with compact
 textual description, resulting in unclear, incomplete, and inconsistent tags for uploaded examples which
 impede retrieval, according to our empirical study and interview with four professional designers. Based on a
 deep neural network, we introduce a novel approach for encoding both the visual and textual information to
 recover the missing tags for existing UI examples so that they can be more easily found by text queries. We
 achieve 82.72% accuracy in the tag prediction. Through a simulation test of 5 queries, our system on average
 returns hundreds more results than the default Dribbble search, leading to better relatedness, diversity and
 satisfaction.
 CCS Concepts: • Human-centered computing → User interface design; User interface manage-
 ment systems; Graphical user interfaces.
 Additional Key Words and Phrases: Tags, Graphical User Interface, Designers, Semantics, Deep learning
 ACM Reference Format:
 Chunyang Chen, Sidong Feng, Zhengyang Liu, Zhenchang Xing, and Shengdong Zhao. 2020. From Lost to
 Found: Discover Missing UI Design Semantics through Recovering Missing Tags. Proc. ACM Hum.-Comput.
 Interact. 4, CSCW2, Article 123 (October 2020), 22 pages. https://doi.org/10.1145/3415194

 1 INTRODUCTION
 Graphical User Interface (GUI) is ubiquitous which provides a visual bridge between a software
 application and end users through which they can interact with each other. Good GUI designs are
 essential to the success of a software application and can gain loyalty from the software users [43].
 However, designing good GUI is challenging and time-consuming, even for professional designers.
 On one hand, GUI designers must follow many design principles and constraints, such as fluent
 Authors’ addresses: Chunyang Chen, Faculty of Information Technology, Monash University, Melbourne, Australia,
 chunyang.chen@monash.edu; Sidong Feng, Research School of Computer Science, Australian National University, Canberra,
 Australia, u6063820@anu.edu.au; Zhengyang Liu, Research School of Computer Science, Australian National University,
 Canberra, Australia, zhengyang.liu@anu.edu.au; Zhenchang Xing, Research School of Computer Science, Australian Na-
 tional University, Canberra, Australia, zhenchang.xing@anu.edu.au; Shengdong Zhao, National University of Singapore,
 Singapore, Singapore, zhaosd@comp.nus.edu.sg.

 Permission to make digital or hard copies of all or part of this work for personal or classroom use is granted without fee
 provided that copies are not made or distributed for profit or commercial advantage and that copies bear this notice and
 the full citation on the first page. Copyrights for components of this work owned by others than ACM must be honored.
 Abstracting with credit is permitted. To copy otherwise, or republish, to post on servers or to redistribute to lists, requires
 prior specific permission and/or a fee. Request permissions from permissions@acm.org.
 © 2020 Association for Computing Machinery.
 2573-0142/2020/10-ART123 $15.00
 https://doi.org/10.1145/3415194

 Proc. ACM Hum.-Comput. Interact., Vol. 4, No. CSCW2, Article 123. Publication date: October 2020.
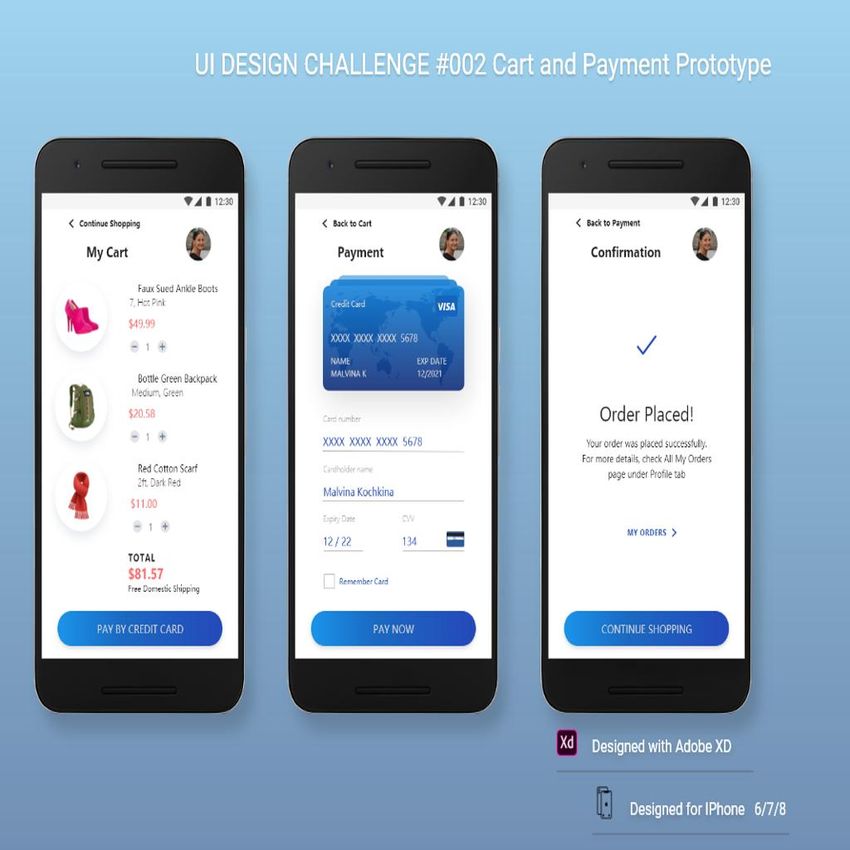
123:2 Chen and Feng, et al.

interactivity, universal usability, clear readability, aesthetic appearance, consistent styles [6, 29, 37].
On the other hand, they also strive to be creative and come up with unique, original ideas. One
way to design good UI is to learn from each other, and as a result, many design sharing websites
such as Dribbble [4], Behance [3], Coroflot [1], etc. have emerged and gained significant popularity
among designers’ community.
 Successful design sharing sites have become repositories of knowledge with millions of profes-
sional design artworks. For example, Dribbble has over 3.6 million designs [8]. As most GUI designs
are in image format which is difficult to organize or search, textual tags are one way that users
sift through this volume of information. When tags are integrated into platform tools, they can be
used to filter and retrieve relevant content. On Dribbble, tags can be used to set up the notification,
personalize the design feed appearing on the homepage, annotate the design trend, and search for
specific content. Tags are also used internally for the algorithms for recommending a list of related
or potentially interesting GUI designs.
 Collaborative tagging systems [28, 38, 57] allow sites to distribute the work of categorization
across the entire community. It has now been utilized by many sites to help organize large online
repositories. For example, on Dribbble, designers are asked to apply up to 20 tags to describe their
uploaded GUI designs. Collaborative tagging systems empower users to actively participate in the
organization of the community content and distribute the effort of categorizing content across
many users. As a result, more content can be labeled, making it easier to discover.
 While tagging one UI design may seem relatively easy, prior work suggests that tagging involves
a complex set of cognitive tasks [35]. Tagging with others in a collaborative tagging system involves
sharing and negotiating concepts or understanding from many different people. Collaborative
tagging can be regarded as a collective sensemaking [38] or a distributed cognitive system [35].
But some issues emerge during this collaborative tagging [38], especially in design sharing sites.
First, users may use different words to describe the same UI design based on their own background
knowledge. As there are no rules for how a tag applies to one UI design, the tags provided by
different designers for even similar meaning can be different, resulting in a very organic vocabulary,
especially for designers who are new to the website. The increase in the use of incoherent tags
may hinder content searching or navigation. For example, when designers want to search for UI
designs with “user interface”, the UI design tagged with “ui” or “uidesign” will be omitted.
 Second, users may extract different topics from the same design according to their own under-
standing, hence missing some closely related tags associated with the GUI design images. When
tagging the UI design, users tend to provide only a few keywords that describe the most obvious
visual or semantic contents, while content in other aspects may be simply omitted. Such an issue is
further aggravated due to the gap for transforming the visual GUI design information to textual
tags. For example, the design in Figure 1 shows the UI design of a food app. Although it contains
a food view and a checkout page, this design isn’t tagged with such related keywords, resulting
in the potential failure of the retrieval. Once designers search it with “user interface”, it may not
appear in the returning result, though “ui” is the abbreviation of it.
 Therefore, in addition to users’ tagging, we also need a more proactive mechanism of tag
assurance which could check the tag completeness of one UI design before it is uploaded, and
remind the UI designers to fix issues if any. The goal of our work is to develop such a proactive
policy assurance mechanism which can complement the existing collaborative tagging mechanism
to augment existing tags of the GUI design, hence benefiting the GUI search and management in
the design sharing sites. Our work is data driven and built on top of existing collaborative editing
patterns by users. Therefore, our research questions are two-fold: 1) what kinds of issues are there
with tagging in design sharing sites? 2) does a deep-learning model help designers recover missing
tags for UI designs?

Proc. ACM Hum.-Comput. Interact., Vol. 4, No. CSCW2, Article 123. Publication date: October 2020.
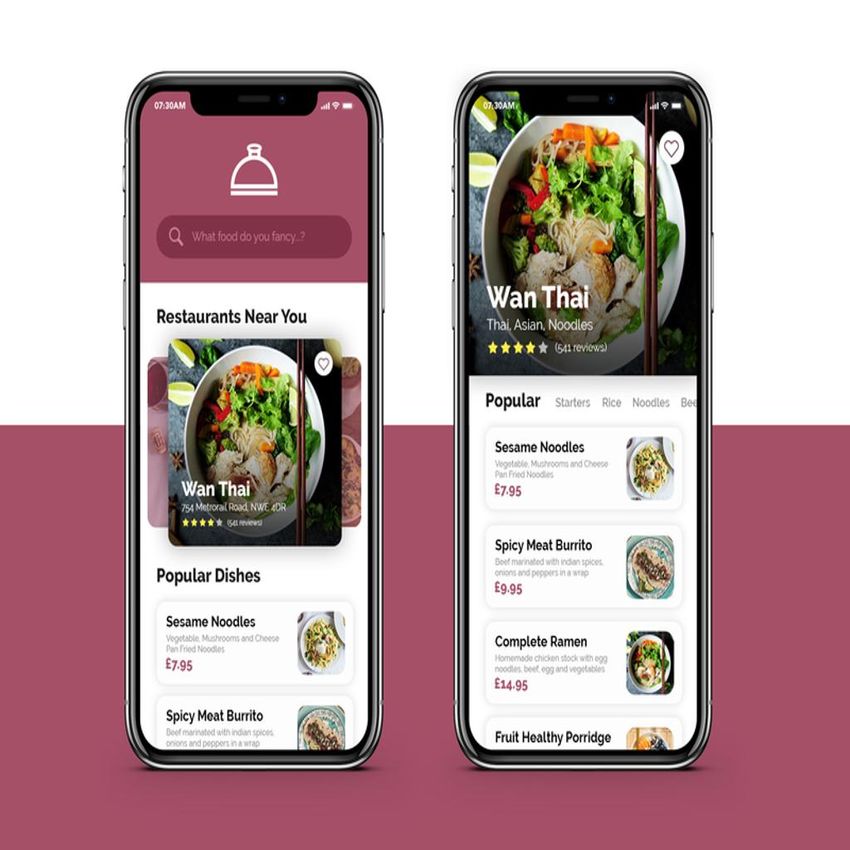
From Lost to Found: Discover Missing UI Design Semantics through Recovering Missing Tags 123:3

Fig. 1. An example design from the design sharing website www.dribbble.com of which tags illustrate the
two problems with the tagging-based search.

 To answer the first research question, we conduct an empirical study of tags attached to tens
of thousands of GUI designs on Dribbble. By analyzing the existing tags, we find that users adopt
incoherent tags with a large inconsistent vocabulary according to their own preferences. But some
frequently used tags which convey the main semantic of the GUI design images emerge including
tags related to the GUI platform, color, software functionality, screen functionality, screen layout,
etc. Interviews with professional designers (UI design creators and uses of design sharing sites)
from big companies also confirm the tag usage issues (i.e., inconsistency, tag missing). Considering
the wide range of missing tags, it would require significant manual effort to develop a complete set
of rules for guiding collaborative tagging.
 This challenge motivates us to develop a deep-learning based tag completeness assurance janitor
to recommend to design owners or other users the potential missing tags that may be needed to
augment existing tags. This janitor can also justify its prediction by pointing out the specific part of
GUI designs relevant to the predicted tags. To recommend missing tags for UIs, we employ a hybrid
approach that leverages both the visual and textual information. We train a binary classifier with UI
design images from Dribbble labeled with this tag as positive data, while UI design images labeled
with other tags in the same category as negative data. The trained model can help recommend tags
for not only the new UI designs before sharing, but also remind designers about adding more tags
for existing UI designs. The experiments demonstrate that our model with the average accuracy as
0.8272 significantly outperforms the other machine learning based models.
 To demonstrate the usefulness of our model, we also carry out a user study to show if our model
for recovering missing tags can help retrieve more related UI designs compared with the default
Dribbble search. After analyzing ten participants’ feedback, we find that our model can provide
more related and larger number of UI candidates given the queries than the baselines.
 The contributions of this work are threefold.
 • We systematically investigate the collaborative tagging problems of the design sharing site
 including incoherent tag usage and missing tags. The informal interviews with professional
 designers also confirm these issues qualitatively.
 • Based on the emerging tag categories, we develop a customized deep-learning based method
 for specifically recommending missing semantic tags to the existing design by leveraging both
 visual and textual information according to the UI design characteristics. We have released
 the source code, experiment results, and tag categorization to the public1 for replication and
 further extension.
 • We conduct large-scale experiments to evaluate the performance and limitations of our
 approach. Our approach achieves good accuracy compared with baselines on a large-scale
1 https://github.com/UITagPrediction/CSCW2020

 Proc. ACM Hum.-Comput. Interact., Vol. 4, No. CSCW2, Article 123. Publication date: October 2020.
123:4 Chen and Feng, et al.

 UI design dataset. The evaluation of our method for improving searching performance also
 demonstrates the usefulness of our model.

2 RELATED WORKS
Our work is problem driven, rather than approach driven. As our study is to recommend missing
tags for UI design images, we are introducing related works in three aspects, i.e., works for helping
UI design, collaborative tagging and tag prediction.

2.1 UI Design
GUI provides a visual bridge between apps and users through which they can interact with each
other. To assist the mobile UI design, many studies are working on large-scale design mining
including investigating the UI design patterns [13], color evolution [41, 42], UI design testing
including usability [55, 77] and accessibility chen2020unblind, UI decomposition [25] and design
implementation [21]. Liu et al [54] follow the design rules from Material Design to annotate the
mobile GUI design to represent its semantics. Swearngin et al [72] adopt the image processing
method to help designs with converting the mobile UI screenshots into editable files in Photoshop,
so that designers can take it as a starting point for further customization. To render inspirations
to the designer, Chen et al [27] propose a program-analysis method to efficiently generate the
storyboard with UI screenshots, given one app executable file. Fischer et al [34] transfer the style
from fine art to GUI. All of these works are helping simplify the design process for professional
design. In contrast, our study is to assist with searching the existing UI design to render designers
some inspirations.
 Retrieval-based methods [20, 24] are also used to develop user interfaces. Reiss [66] parses
developers’ sketch into structured queries to search related UIs of Java-based desktop software
in the database. GUIfetch [15] customizes Reiss’s method [66] into the Android app UI search
by considering the transitions between UIs. Deka et al [31] leverage auto-encoder to support UI
searching by inputting the rough sketch. Similar to Reiss’s work [66], Zheng et al [78] parse the
DOM tree of one user-created rough website to locate similar well-designed websites by measuring
tree distance. Note that all of these works either take the wireframe/sketch or partial source code
as the input for searching the UI design. Different from them, we are annotating UI design with
high-level natural-language semantic tags which can help textual queries for UI design retrieval.

2.2 Collaborative Tagging System
Tagging is to summarize the content with several compact keywords [38, 57] and collaborative
tagging allows individual users to create and apply tags to online items. Collaborative tagging
systems are widely adopted by different sharing sites including Q&A (e.g., Quora [11]), picture
sharing (e.g., Flickr [7]), web bookmarking sharing (e.g., Delicious [9]), etc. Instead of central author-
ity, collaborative tagging systems constitute an entirely new method of information organization,
which allows the entire community to generate tags and label content, typically to make the content
easier for themselves or others to find later.
 Creating and applying tags in order to organize content requires the cognitive process of cate-
gorization [35, 36]. Although tags provide a way for sites to organize and for users to search the
content, there are still some problems with it. So many research works have aimed to study on
human tagging behavior. For example, Suchanek et al [71] examine whether tags are applied accu-
rately by humans. Multiple empirical studies [38, 39, 75] conduct to evaluate human categorization
consistency. Fu et al [36] study on whether users are influenced by others’ tags. The conflict and
divisions in collaborative tagging have been further spotted [28]. The empirical study in our work
also confirms those tagging issues in design sharing sites. But different from existing works which

Proc. ACM Hum.-Comput. Interact., Vol. 4, No. CSCW2, Article 123. Publication date: October 2020.
From Lost to Found: Discover Missing UI Design Semantics through Recovering Missing Tags 123:5

mostly focus on the empirical study of such phenomenon, we further develop a method to help
recover the missing tags and keep the consistency of tags across the site. Categorization of tags
can analogously facilitate navigation and searching in the now-booming collaborative tagging
system. A number of papers deal with exploring plenty of tag type categories for online resources
of different kinds, such as book [38], movie [67], TV program [58], music [16], blog [51]. To the
best of our knowledge, our work is the first to build a UI tag categorization using data mining and
semi-automatic techniques.

2.3 Tagging Prediction
Automatic image annotation (also known as automatic image tagging or linguistic indexing) is the
process by which a computer system automatically assigns metadata in the form of captioning
or keywords to a digital image [2]. Most work has focused on personalized tag recommendation,
suggesting tags to the user, bookmarking a new resource using collaborative filtering, taking
into account similarities between users and tags [52, 60, 73, 76]. As pointed out in [32] that the
visual content of images are a valuable information source, some researchers propose conventional
machine learning methods for tag recommendation based on manually-crafted features [26, 45, 68].
 Apart from the image, the text attached to the image (e.g., existing tags) may be another resource
for tag recommendation. Murthy et al. [61] explored a k-nearest-neighbor-based canonical correla-
tion analysis (CCA) method for tag recommendation, which not only utilizes the convolutional
neural network visual features but also explicitly incorporates the word embedding semantic
information. Ma et al. [56] proposed a joint visual-semantic propagation model to the tag image
and introduced a visual-guided LSTM to capture the co-occurrence relation of the tags. Bylinskii
et al. [18] recommended tags for infographics by adopting patch learning to select representative
textual and visual elements from an infographic. Rawat et al. [65] proposed a context-aware model
to integrate context information with image content for multi-label hashtag prediction.
 But note that different from prior works about tag recommendations for natural images on social-
media platforms (e.g., Flickr), we are specifically targeting at uncovering semantic tags of UI design
images for assisting designers in effectively seeking others’ UI design. Inspired by the existing
works on tag recommendation, we customize the off-the-shelf model for modeling both visual and
textual information in three aspects. First, we adopt binary classifiers to boost the performance
of the classification model. Previous works formulating this tag-recommendation problem as a
multi-class multi-label classification task, but it always leads to data imbalance issues [53] as the
occurrence number of each tag differs significantly. Instead, according to our observation, most
related (frequent) tags attached to the UI design are exclusive with each other, such as “black vs
red”, “login page vs checkout page”, “music app vs sport app”. Therefore, we develop a novel binary
classifier for each tag and that method naturally solves the problem of data sparsity and imbalance.
 Second, to support the construction of binary classifiers, we carry out an empirical study of
existing tags of 61,700 UI designs for distilling exclusive tags. Based on a series of methods including
association rule mining and merging abbreviations and synonyms, we obtain a categorization
of most frequent UI-related tags. Tags within the same category are exclusive from each other,
enabling the consecutive construction of binary classifiers.
 Third, we also develop a data visualization method to help designers understand why we rec-
ommend certain tags for their UI designs. For each recommended tag, we draw a saliency map
highlighting the conclusive features captured by our model. Compared with just a simple prediction,
this explainability can help post owners or post editors judge the validity of the recommended
post edits and may encourage them to accept the tool’s recommendation. Making the prediction
criteria more explicit is crucial for the acceptance of our deep learning based approach for tag
recommendation.

 Proc. ACM Hum.-Comput. Interact., Vol. 4, No. CSCW2, Article 123. Publication date: October 2020.
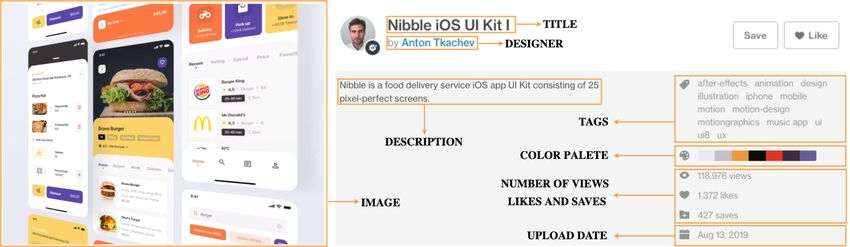
123:6 Chen and Feng, et al.

 recipe
 experience
 hotel trip home
 graph user flight booking smart
 interface userexperience food
 statistics sketchapp travel challenge
 chart stats spacedchallenge daily
 charts userinterface moon restaurant
 webapp clean black uxdesign
 space error
 dashboard
 data simple
 white landingpage graphicdesign
 spaced planet medical
 management webdesign success checkout
 motion minimal template health
 webpage payment
 transition site theme user experience share
 gif header homepage
 currency principle fullscreen
 website wordpress interaction design fitness
 ico social
 appdesign web development
 crypto wallet app animation interaction promo
 personal web design ux design football
 bank kit sketch prototype web ui pattern soccer
 bitcoin finance android portfolio graphic design interactive credit
 blockchain freebie prototyping framer model website design
 digital card css
 money free photoshop mark logo design landing page
 cryptocurrency logotype html location
 mockup psd illustrator home page

 ios11
 iphonex x
 illustration logo brand
 identity branding
 movie layout
 grid
 map

 cinema
 wallpaper
 ios noise character drawing effyzhang
 icon
 sign in
 sign up
 ticket marketing
 type store
 apple texture isometric
 art cute login
 ipad iphone onboarding
 google typography
 ecommerce landing
 team download shop signup register
 editorial shopping
 phone city page
 minimalism chat
 iphone x debut color e-commerce invitation message
 flat apps
 iconography dribbble
 icons playlist player
 invite
 symbols mobile
 illustrations vector music invites hello
 music player
 line icons spotify giveaway
 infographics play

 Fig. 2. The UI-related tag associative graph from December 27, 2018 to March 19, 2019.

3 EMPIRICAL STUDY OF DESIGN SHARING
In this work, we select Dribbble as our study subject, not only because of its popularity and large
user base, but also due to its support for collaborative tagging. Dribbble is an online design sharing
community which contains over 3.6 million uploaded artworks covering graphic design, user
interface design, illustration, photography, and other creative areas. Only professional designers
can be invited to upload their design works for sharing with the community, leading to high-
quality design within the site. Since its foundation in 2009, Dribbble has become one of the largest
networking platforms for designers to share their own designs and get inspirations from others’.
For each design work, the graphical design is attached with the corresponding metadata including
a title, a short description, tags specified by the designer, and comments from other users as seen
in Figure 1.
 To collect designs and associated metadata from Dribbble, we build a web crawler based on the
Breadth-First search strategy [62] i.e., collecting a queue of URLs from a seed list, and putting the
queue as the seed in the second stage while iterating. Apart from the graphical design (always in
png, jpeg format), our crawler also obtains the corresponding metadata including title, description,
tags, uploading date, number of likes, saves, views, etc. The crawling process continued from
December 27, 2018 to March 19, 2019 with a collection of 226,000 graphical designs. Note that
these graphical designs are diverse including UI design, logo, icon, clip art, branding, typography,
etc. In this work, as we are concerned with the UI related design, we only select the UI attached
with related tags such as “user interface”, “ui”, “ux”, “app design”, “website design”, etc. Finally, we
obtain a dataset of 61,700 UI design and their metadata. Based on this large dataset, we carry out an
empirical study of collaborative tagging in Dribbble to understand its characteristics for motivating
the required tool support.

3.1 What are designers sharing?
Within the Dribbble site, the design creators can add at most 20 tags for their design work. These
natural-language tags convey the semantics of the UI design such as internal structural information
(e.g., “dashboard”, “list”, “chart”) and belonging-software information (e.g., “ecommerce”, “food”,
“travel”). To provide readers with a better understanding of detailed semantic embedded in the UI

Proc. ACM Hum.-Comput. Interact., Vol. 4, No. CSCW2, Article 123. Publication date: October 2020.
From Lost to Found: Discover Missing UI Design Semantics through Recovering Missing Tags 123:7

design, we adopt the association rule mining [12] and community detection [17] for visualizing the
landscape of collected tags.

3.1.1 Overview of UI semantics. We first collect all the UI designs with tags , and tags of each
design figure are correlated. In the example of Fig. 1, iphone is one kind of mobile phones. Each
design is considered as a record and the design tags as the items in the record. We use association
rule mining [12] to discover tag correlations from tag co-occurrences in designs. As we want to
mine the pair-wise correlation of tags and construct the landscape graph, we find frequent pairs of
tags. A pair of tags is frequent if the percentage of how many designs are tagged with this pair of
tags compared with all the designs is above the minimum support threshold . Given a frequent
pair of tags { 1, 2 }, association rule mining generates an association rule 1 ⇒ 2 if the confidence
of the rule is above the minimum confidence threshold . The confidence of the rule 1 ⇒ 2 is
computed as the percentage of how many designs are tagged with the pair of tags compared with
the designs that are tagged with the antecedent tag 1 . Note that the original tags for filtering out
non-UI designs like “ui”, “user interface” are removed from the figure, as they are related to all tags
in our dataset.
 Given the mined tag association rules, we construct an undirected graph ( , ), where the
node set contains the tags (i.e., technologies) appearing in the association rules, and the edge set
 contains undirected edges < 1, 2 > (i.e., tag associations) if the two tags have the association
 1 ⇒ 2 or 2 ⇒ 1 2 i.e., the confidence of either { 1, 2 } or { 2, 1 } larger than the threshold. Each
edge has a confidence attribute indicating the strength of the technology association. Considering
the balance between the information coverage and overload, we set the as 0.001 and as
0.2, resulting in the 197 nodes and 246 edges.
 We then carry out community detection [17] to group highly related nodes in the graph. In graph
theory, a set of highly correlated nodes is referred to as a community (cluster) in the network. In this
work, we use the Louvain method [17] implemented in the Gephi [14] tool to detect communities.
We visualize different communities with different colors and the nodes with higher frequency as
large size as seen in Fig. 2.

3.1.2 Vocabulary of UI semantics. As seen in Figure 2, many related tags are linked together such as
(“travel”, “hotel”), (“minimal”, “simple”), (“ecommerce”, “shop”), etc. To identify the set of frequently
occurred UI tag categories, we adopted a consensus-driven, iterative approach to combine the
observed tag landscape generated by our method with existing expert knowledge documented in
books and websites such as Mobile Design Pattern Gallery [63] and Google’s Material Design [5].
 We also performed an iterative open coding of 1,000 most frequent co-occurring tags with tag
“ui” in Dribbble, or approximately 8.2% of the dataset (12,244 in total). Two researchers from our
team independently coded the categories of these tags, noting any part of the initial vocabulary.
Note that both researchers have UI design experience in both mobile apps and websites. After the
initial coding, the researchers met and discussed discrepancies and the set of new tag categories
until consensus was reached.
 This process yielded 5 main semantic UI categories: PLATFORM, COLOR, APP FUNCTION-
ALITY, SCREEN FUNCTIONALITY, SCREEN LAYOUT. Each main category also contains some
sub-categories as seen in Table 1. For example, the APP FUNCTIONALITY category contains
“MUSIC”, “FOOD & DRINK”, “GAME”, and the subcategory “FOOD & DRINK” contains UI design
tagged with “Food”, “Restaurant”, “Drink”, etc.

2 The edge is undirected because association rules indicate only the correlations between antecedent and consequent.

 Proc. ACM Hum.-Comput. Interact., Vol. 4, No. CSCW2, Article 123. Publication date: October 2020.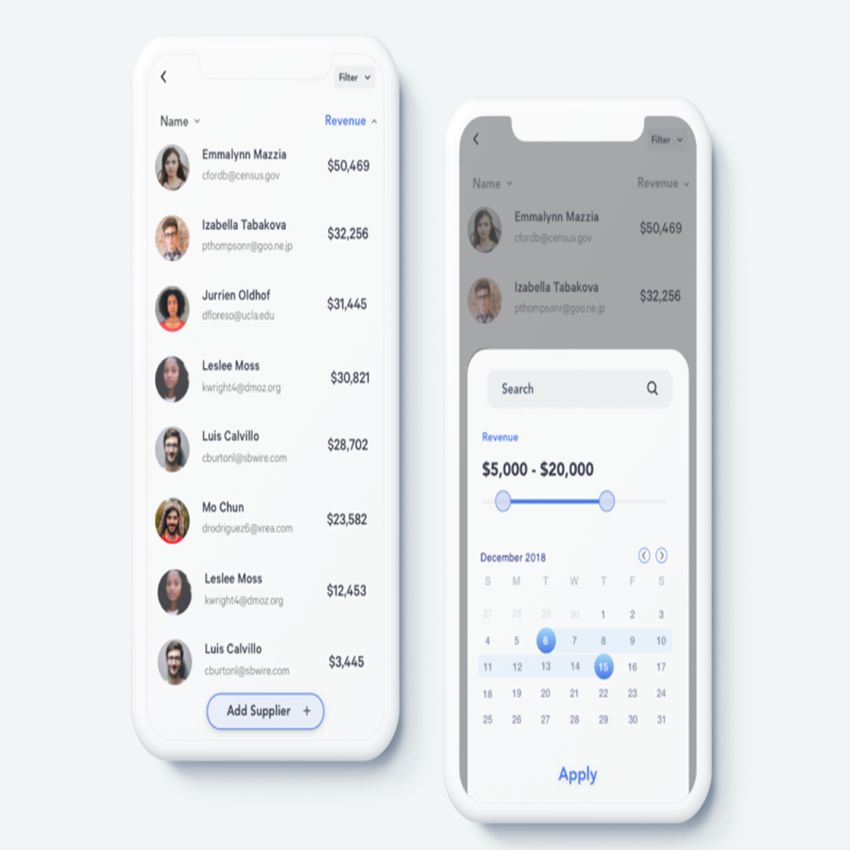
123:8 Chen and Feng, et al.

 Table 2. The 40 most frequent UI related tags with
Table 1. The categorization of some most frequent their abbreviations and synonyms and in brackets
UI-related tags. indicate the number of occurrences.

 CATEGORY ASSOCIATED TAG NAME STANDARD(#) ABBREVIATION & SYNONYMS
 PLATFORM ui (61309): user interface, user_interface, user-
 Website: Website, Web, Mac, Macbook interface design, uidesign
 Mobile: Mobile, Phone, IOS, Iphone, Android website (28009): web, websites, webpage, website de-
 Tablet: Tablet, Ipad, Ipadpro velopment, web design
 COLOR ux (24209): user experience, uxdesign, ux_design
 White: White mobile (8554): mobiledesign, mobile phone, mo-
 Yellow: Yellow, Golden, Orange bile_design, smartphone
 Red: Red illustration (7159): illustation, digital_illustration,
 Pink: Pink kids_illustration
 Purple: Purple app (5887): apps, application, app development,
 Blue: Blue, DarkBlue, SkyBlue app design
 Green: Green, DarkGreen, Aquamarine landing page (5536): landing-page, landingpage, landing
 Grey: Grey, Silver, DarkGray page design
 Brown: Brown minimal (4938): minimalism, minimalistic, minimalist
 Black: Black ios (4741): ios8, ios9, ios11, ios_design
 APP FUNCTIONALITY iphone (4736): iphone x, iphonex, iphone 7,
 Music: Music, Musicplayer, MusicApp iphone_8
 Food & Drink: Food, Restaurant, Drink icon (4230): icons, icon design, icon pack
 Game: Game, Videogame logo (3704): logo design, logos, logotype
 Health & Fitness: Fitness, Health food (2881): fastfood, food_blog, junk_food,
 News: News doughnut
 Sport: Sport, Gym, Workout clean (2723): clear, clean_design
 E-commerce: E-commerce, Store, OnlineShop flat (2481): flat design, flat-design, flat-art
 Social Networking: SocialNetwork, Blog, Messenger, Face- interaction (2402): interactive, microinteraction, interac-
 book, Instagram, Dating, Chat tion design, user interaction
 Travel: Travel, Trip, Tourism dashboard (2141): dashboard design, dashboards
 Weather: WeatherApp, Temperature branding (2071): branding design, rebranding, self-
 Lifestyle: Fashion, Furniture, Real Estate branding
 Education: Education, E-learning sketch (2060): sketching, sketches, adobe_sketch
 Reference: Dictionary, Atlas, Encyclopedia ecommerce (1974): e-commerce, online commerce, shop-
 Entertainment: Movie, TV, Netflix, Youtube ping
 Medical: Medical, Healthcare, Hospital vector (1940): vectors, vector art
 Books: DigitalReading, DigitalBookstroe product (1841): products, product page, product de-
 Kids: Kids, Children tail
 Finance: Finance, Wallet, Bank, Business, Insur- typography (1820): interface typography,
 ance, Marketing 3d_typography
 Utilities: Calculator, Clock, Measurement, Web- gradient (1671): gradients, gradient design, blue gradi-
 Browser ent
 Navigation: DrivingAssistance, Topographi- gif (1441): gifs, looping_gif
 calMaps, PublicTransitMaps layout (1400): layout design, layouts
 SCREEN FUNCTIONALITY concept (1378): conceptual, concepts, concept art
 Landing Page: LandingPage motion (1361): motion graphics, motion design
 Login: Login, Signin responsive (1347): responsive design, response
 Signup: Signup, Registration music (1251): music player, musician, musical, con-
 Checkout: Checkout, Payment cert
 Search: Search restaurant (1221): restaurants
 Profile: Profile profile (1204): profiles, user_profile, userprofile
 Contact Page: Contact, ContactPage travel (1197): travelling, travel agency, travel guide
 SCREEN LAYOUT animation (1194): animations, 3danimation, 2danima-
 Dashboard: Dashboard tion
 Form: Form simple (1108): simply, simplistic, simple_design
 Table: Table graphic (1047): graphics, graphic design, graphicde-
 List: List signer
 Grid: Grid color (1000): colors, colorful
 Gallery: Gallery white (988): whitelabel, white design, white
 Toolbar: Toolbar, Toolbox theme
 Chart: Chart login (919): log_in, sign_in, login screen
 Map: Map, MapView modern (915): modernistic, fashionable

Proc. ACM Hum.-Comput. Interact., Vol. 4, No. CSCW2, Article 123. Publication date: October 2020.
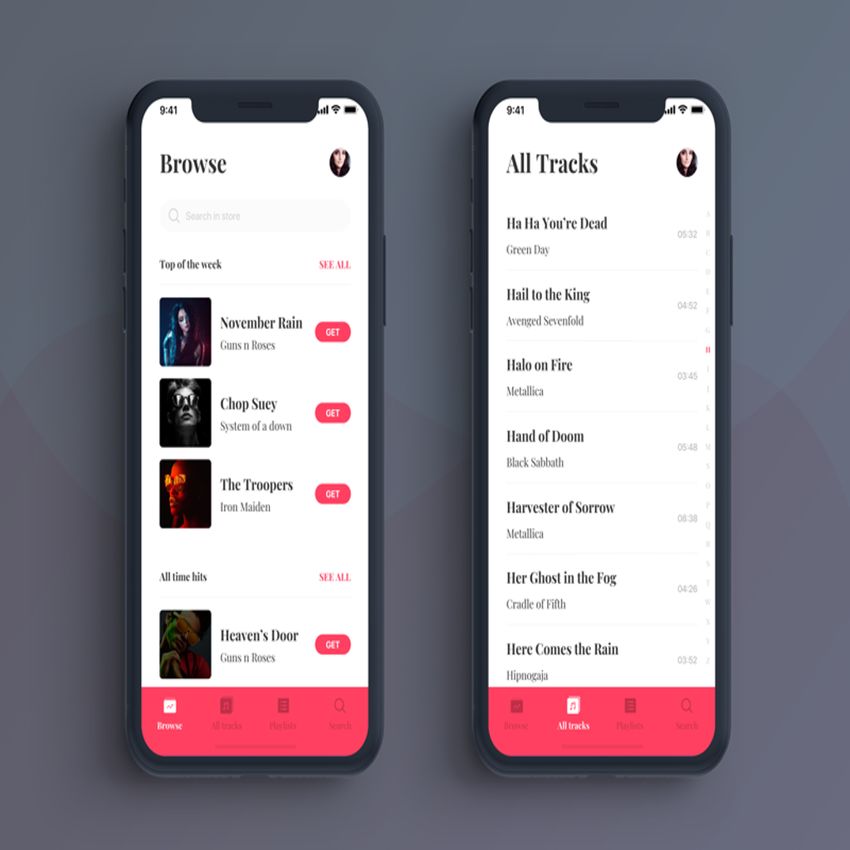
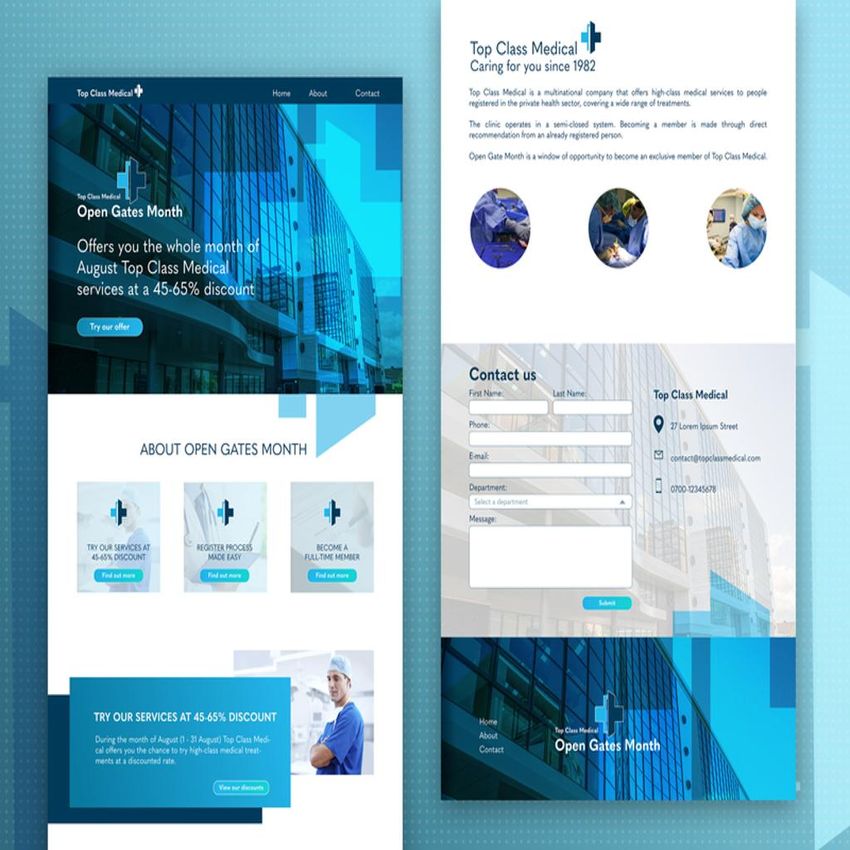
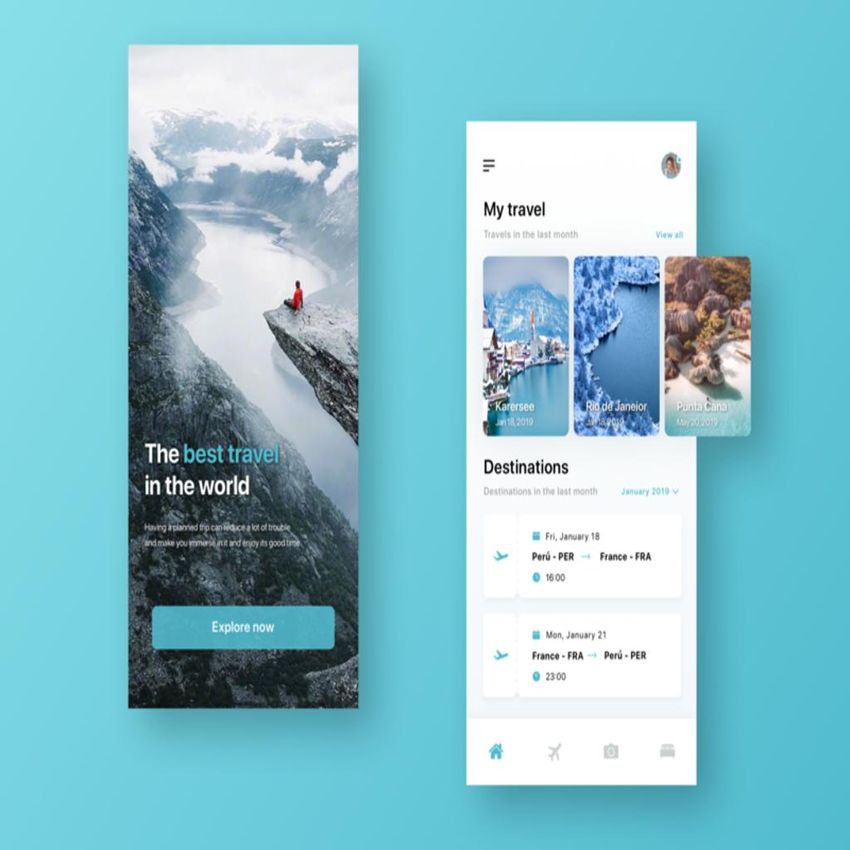
From Lost to Found: Discover Missing UI Design Semantics through Recovering Missing Tags 123:9

 (a) Complete (b) Complete (c) Incomplete (d) Incomplete
 Fig. 3. Examples of UI examples with complete & incomplete tags.

3.2 Do designers use consistent tagging vocabulary?
During the process of open coding the categories of UI semantic, we find that one tag can be written
in different styles. For example, the tag “visualization” not only has its standard format, but also
its derivations including its synonyms like “visualisation”, “visualizations”, and even misspelling
“vizualization”. As the UI design tagging process is informal and they are contributed by thousands
of designers with very diverse technical and linguistic backgrounds, the same concept may be
mentioned in many morphological forms including abbreviations, synonyms, and misspellings. The
wide presence of morphological forms poses a serious challenge to information retrieval and also
vocabulary construction. For example, the query “ecommerce app” may not find the UI design
tagged with “e-commerce”, “e commerce design”.
 To extract these morphological forms of the same words, we adopt a semi-automatic method [23]
which leverages both the semantic and lexical information within the word. We first train a
word embedding [59] model to convert each tag into a vector that encodes its semantic. The
tag with semantic similarity will be spotted such as “minimal” and “minimalistic”, “ui” and “user
interface”, “travel” and “hotel”. Then we define a lexical similarity threshold based on the string
edit distance [49] to further check if two semantically-related words are similar enough in the form.
So the synonyms are extracted like “minimal” and “minimalistic”. To discriminate the abbreviations
from semantically-related words, we define a set of rules e.g., the character of the abbreviation
must be in the same order as they appear in the full name (ui, user interface), and the length of the
abbreviation must be shorter than that of the full name, etc.
 Although the automatic approach can generate many possible pairs of morphological forms,
some of them may still be wrong. Therefore, two researchers from our team manually check all
of these pairs independently, and only take the morphological forms into consideration when the
consensus is reached. Examples of some most frequent morphological forms are listed in Table 2.

3.3 How do designers share and search UI designs in the design sharing site?
After quantitatively spotting the issues of collaborative tagging for the design sharing site, we
further qualitatively get some feedback from informal interviews with four professional UI designers,
including one interaction designer and one visual designer from Google, and the other two visual
designers from Huawei. These designers acknowledge that they regularly (at least once weekly) visit
design sharing websites like Dribbble. They appreciate the creativity and aesthetics of high-quality
UI design artworks on Dribbble, which inspire their own design work. However, they also pinpoint
several information needs in their work which demand us to think beyond existing content sharing
mechanisms.

 Proc. ACM Hum.-Comput. Interact., Vol. 4, No. CSCW2, Article 123. Publication date: October 2020.
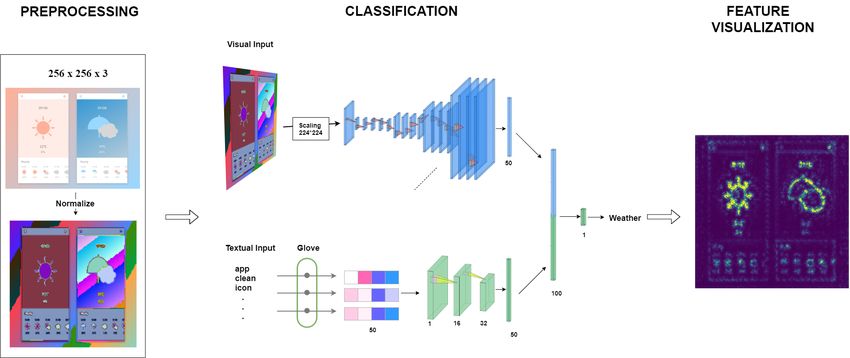
123:10 Chen and Feng, et al.

 First, as the contributors of the Dribbble site, some designers do not pay much attention to
their tagging, though it is crucial for the GUI index and searching. One designer from Huawei
mentioned to us that he did not intentionally use the semantic words (e.g., functionality, layout) to
annotate his design works, as he did not know much what tags are there and which tags to use.
Instead, he attached his UI design with some fancy tags like “2019trending” to make his design
more attractive to other designers. A structured vocabulary of available tags is needed to assist
designers in efficiently annotating their design works for other designers’ retrieval.
 Second, there is a gap between existing UI tags and the query due to two reasons. On the one
hand, some UIs are missing relevant semantic tags. For example, one Google designer was designing
a website about Yoga. When she searched “yoga“, there are many different kinds of returning results
from Dribbble including the icons, charts, illustration which are not related to her designed UI or
website. She had to manually filter out irrelevant ones, and that process took much time. But when
she zoomed in a more specific query like “yoga website“, only very few results were returned by
Dribbble. On the other hand, designers may adopt different words to tag the same GUI, resulting in
the difficulty of retrieval. Another designer in Google mentioned that he would use different words
in the same meaning for searching such as both “travel“ and “trip“ for related GUI, but that process
is inefficient as many results from two queries overlap, and he may miss some potential synonyms.
Some effective mechanisms have to be devised to help retrieve more results by not only adding
more semantic tags to the GUI design, but also organizing existing tags. Some example UIs with
complete or incomplete tags from these designers can be seen in Figure 3.
 Summary: Design sharing site with diverse UI designs is crucial for inspiring professional
designers. The collaborative tagging provides a way for designers to search for their UI design of
interest. However, there are several limitations with current UI design tagging including using
different same-meaning tags for the same UI design based on their own background knowledge,
missing highly related tags for describing the UI design. Such limitations may hinder their potential
utility as navigational cues for searchers. Therefore, an automated tag augmentation model is
needed to recommend missing tags and keep existing tags consistent across different UI designs.

4 AUGMENT TAGS FOR THE UI DESIGN
Although extracting morphological forms mentioned in the last section can boost the performance
of UI retrieval by normalizing the existing tags from designers, some UIs are still missing related
tags which makes them unsearchable. Therefore, a method to recover the missing tags of existing
UIs is necessary. However, based on the labeled data, we could not find a code-based heuristic that
distinguishes tags from UI design images with high accuracy: the existing UI designs are too diverse.
So, we propose a hybrid deep learning method modelling both the visual and textual information
to predict missing tags of the UI design.

4.1 Approach overview
The overview of our approach can be seen in Fig 4. To train the deep learning for tag augmentation,
we first collect all existing UI designs with specific tags identified in our empirical study (Section 4.2).
We then develop a tag augmentation model by combining a CNN model for capturing visual UI
information and a fully-connected neural network for capturing textual information of existing
tags (Section 4.3). Additionally, to understand how our ensemble model makes its decisions through
the visual and textual information, we apply a visualization technique (Saliency Maps [70] and
Softmax function [19]) for understanding which part of the figure and which words lead to the
final prediction (Section 4.4).

Proc. ACM Hum.-Comput. Interact., Vol. 4, No. CSCW2, Article 123. Publication date: October 2020.
From Lost to Found: Discover Missing UI Design Semantics through Recovering Missing Tags 123:11

 Fig. 4. The architecture of our tag prediction model.
4.2 Dataset preparing
We formulate this tag augmentation task as a classification problem. We leverage the tag categoriza-
tion during the creation of the UI semantic vocabulary as the label, and corresponding UI design
images and attached tags as the training data. Note that each UI design may own many semantic
tags such as “mobile”, “blue”, “social”, “login” and “form”, and these tags are not exclusive from
each other. Therefore, we cannot regard all tags as equal for training a multi-class classifier for tag
prediction. In this work, we train a binary classifier for each tag label. Such binary classifiers also
benefit the system extensibility for new tags, as we only need to train a new binary classifier for the
new tag without altering existing models for the existing tags. For training each binary classifier,
we take the UI design with that tag as the positive data. We randomly take the same amount of
UI designs attached with tags which are in the same category of the target tags in Table 1 as the
negative training data, as tags in the same categories are always exclusive from each other. To keep
the balance of data, we make the amount of positive data equal to that of negative data. Therefore,
the chance level for accuracy is 50%.
 We further preprocess the data in two aspects. For each tag, we merge similar tags based on the
morphological/synonym form identification and some minor manual check. For example, the tag
“traveling”, “travel guide”, “trip” are all merged to tag “travel”. Note that the manual check is only
carried out once for grouping similar tags in dataset preparation and no more human efforts are
needed in the model construction. For each image, we normalize the pixel value by dividing the
mean and standard deviation so that each pixel value is in the range between 0 to 1 for accelerating
the training process.

4.3 Model Architecture
In this section, we propose an end-to-end deep fusion model to jointly learn visual and textual
information. The architecture of the proposed network is shown in Fig 4, which contains two
main components. One CNN model takes the GUI design image as the input for extracting the
visual features. The other CNN model takes the existing tags as the input for extracting the textual
information. We then merge both information sources to the final fully-connected layers for
predicting the tag of the GUI design.
4.3.1 Capturing Visual Information. Convolutional Neural Network (CNN) [47, 48] is a class of deep,
feed-forward neural networks, most commonly applied to analyze visual imagery. The architecture
of a typical CNN is structured as a series of stages such as different layers called convolution layers,

 Proc. ACM Hum.-Comput. Interact., Vol. 4, No. CSCW2, Article 123. Publication date: October 2020.
123:12 Chen and Feng, et al.

pooling layers, and fully-connected layers. In the convolutional layers, the convolution of an image
is to use a kernel (e.g., 3 × 3 matrix) and then slide that window around the image. At each position
in the image that the kernel ( ) visits, we multiply its values element-wise with the original matrix,
then sum them up i.e., matrix dot multiply. After the convolutional layers, it is the pooling layer.
Max Pooling works very much like convoluting, where we take a kernel and move the kernel over
the image with no overlap. It reduces parameter numbers and computation in the network, and
hence controls the overfitting.
 Different from the original CNN model, we adopt a more advanced one, ResNet (Residual Neural
Network) [40] with skip connections among the convolutional layers so that the model can be
designed as very deep. But due to the limitation of our dataset and deep structure of the model,
we cannot train the ResNet directly with our small-scale dataset. Therefore, we adopt the existing
pretrained model which already distills the visual features from the ImageNet [44], the largest
image dataset including more than 14 million natural images. Based on the pre-trained ResNet, we
further use our dataset to fine-tune the ResNet to adjust the parameters in different layers.
4.3.2 Capturing Textual Information. Apart from the GUI design picture, designers also attach
some tags to index their picture. According to the observation in Figure 2, we find that some tags
co-occur frequently, indicating some implicit relations among them. To predict the missing tags of
a certain GUI design picture, we also take the existing tags into consideration in our model. Given
a set of existing tags, we first adopted the pre-trained word embedding model [10] to convert each
tag into a 50-dimension vector that encodes its semantic. As an image has number of tags, we
concatenate the vectors of tags together, and obtain a × 50 vector representation. Finally, we
pad and synthesize all tags’ vector representation of each image into a 50 × 50 map (similar format
to a figure) and input it to a 2-layer CNN for extracting the salient textual information. Note that
we do not adopt the widely-used Recurrent Neural Network (RNN) to model tag information, as
there is no explicit order among tags.
4.3.3 Combining Visual and Textual Information for Prediction. Based on the picture and tag input
to the ResNet and text CNN, we obtain the embedding vectors which encode the visual and textual
information. We then concatenate both vectors and feed them into another fully-connected layer
for the final prediction. Therefore, we link both the ResNet, text CNN and final fully-connected
layer as an end-to-end system for taking the UI design pictures and attached tags as the input, and
output the predicted missing tags for them.
 Note that we train a separate binary classifier for each tag. We regard the UI is of one tag if
the output is smaller than 0.5, while not if the output is equal to or larger than 0.5. For detailed
implementation, we adopt the max-pooling and use our dataset to fine-tune the last classification
layer of the pretrained ResNet when modeling the visual information. For modeling the textual data,
we adopt the Glove word embedding [10] with embedding size as 50. To make our training more
stable, We use a constant learning schedule with rate 0.0001 and adopt Adam as an optimizer [46],
BCELoss as the loss function.

4.4 Prediction Visualization
One of the main drawbacks of the deep learning system is its interpretability i.e., how the model
gives a certain prediction, especially considering the multi-channel data that we adopt as the input.
To gain insight into our classifier for the prediction results, we visualize the contribution from both
the visual and textual input to the final prediction.
 For visualizing the contribution from the visual input to the prediction, we adopt a visualization
technique [70] which calculates a saliency map of the specific class, highlighting the conclusive
features captured by ResNet. Given the prediction result, the activities of decisive features in

Proc. ACM Hum.-Comput. Interact., Vol. 4, No. CSCW2, Article 123. Publication date: October 2020.
From Lost to Found: Discover Missing UI Design Semantics through Recovering Missing Tags 123:13

 Table 3. Tag classification accuracy for four dataset splitting ratios in different methods.

 Dataset splitting ratio ACCURACY
 Histo Histo ResNet ResNet
 (train:validation:test) Tag only Tag+Image
 +SVM +DT -pretraind +pretraind
 50%:25%:25% 0.6009 0.5531 0.6841 0.7410 0.7306 0.7940
 60%:20%:20% 0.6061 0.5629 0.6827 0.7402 0.7316 0.7829
 70%:15%:15% 0.6123 0.5805 0.6866 0.7387 0.7391 0.7875
 80%:10%:10% 0.5965 0.6249 0.7342 0.7545 0.7522 0.8272

intermediate layers are mapped back to the input pixel space by class saliency extraction [70]. For
one input UI design image, the final encoding of ResNet is mostly based on the weight of each
pixel. Given the prediction result, the derivative weight map can be computed by back-propagation.
Then the elements of weight are rearranged to form the saliency map. As shown in the final part of
Figure 4, it can be seen that the ResNet model predicts the tag “Weather” for that input design due
to the existence of the sun, umbrella, and cloud in the UI design image.
 For visualizing the contribution from the textual input to the prediction, we first trace back
through the CNN model to locating the filtered phrases in the input layer. Then we predict the
contribution score of the phrases’ corresponding features in the fully connected layer to the
prediction class, through a series of feature mapping, unpooling and deconvolution operation. The
predicted class of our CNN model is calculated by applying Softmax function [19] on the sum of the
dot product of the weight matrix in the fully connected layer and the output feature vector of the
concatenate layer. For each UI design, we rank the score of each tag and select three top tags that
contribute most to the prediction of the missing tag. For example, it can be seen in Figure 6 that
for the predicted tag "travel", the model highlights the words related to the landscape like "forest",
"nature" and "mountain".

5 ACCURACY EVALUATION
5.1 Dataset
Given all the data assigned to each tag, we prepare the dataset as discussed in Section 4.2. The
foundation of the deep learning model is the big data, so we only select tags (including its derived
tags) with frequency larger than 300 in Table 1 for training the model. Therefore, there are 26 tags
(e.g., “music”, “signup”3 ) left with the number of UI designs ranging from 312 to 13,233. Note when
splitting the dataset, we only carry out a single split into training, validation, and testing set which
may cause some bias. We discuss this limitation in the end of the paper and propose the improvement
in the future work. Note that as the splitting ratio may influence the final results, we experiment
four splitting ratio (training : validation : testing), 50%:25%:25%, 60%:20%:20%, 70%:15%:15% and
80%:10%:10% for each model respectively.

5.2 Baselines
We first set up several basic machine-learning baselines including the feature extraction (e.g.,
color histogram [74]) with machine-learning classifiers (e.g., decision tree [64], SVM [30]). Color
histogram (Histo) is a simple image feature that represents the distribution of colors in each RGB (red,
green, blue) channel. Based on these hand-crafted features, we adopt the support vector machine
(SVM) and decision tree (DT) as the classifiers. Apart from these conventional machine learning
3 The full list of tags and their frequency can be seen at https://github.com/UITagPrediction/CSCW2020

 Proc. ACM Hum.-Comput. Interact., Vol. 4, No. CSCW2, Article 123. Publication date: October 2020.
123:14 Chen and Feng, et al.

 Table 4. Tag classification accuracy for five categories in different methods.

 ACCURACY
 CLASSES
 Histo+SVM Histo+DT ResNet-pretrain ResNet+pretrain Tag only Tag+Image
 App Function
 music 0.6636 0.5545 0.6727 0.7909 0.8545 0.8909
 food&drink 0.5765 0.6294 0.7529 0.7882 0.7706 0.8294
 ecommerce 0.5565 0.5726 0.6895 0.7460 0.8306 0.8710
 finance 0.5655 0.5833 0.6964 0.7500 0.8274 0.8512
 travel 0.5211 0.5842 0.7316 0.7053 0.8053 0.8474
 game 0.5814 0.5814 0.8062 0.7984 0.7597 0.8605
 weather 0.5745 0.7021 0.7447 0.7872 0.8085 0.8298
 sport 0.4220 0.6147 0.6147 0.6239 0.7064 0.7798
 Color
 yellow 0.5865 0.7596 0.7404 0.7404 0.6442 0.7500
 red 0.6667 0.7083 0.8194 0.8472 0.6111 0.8472
 pink 0.7609 0.6522 0.7826 0.7391 0.6522 0.8261
 blue 0.6600 0.6800 0.7700 0.7400 0.6800 0.8700
 green 0.7000 0.8714 0.8286 0.7714 0.6571 0.7857
 white 0.6111 0.6111 0.7778 0.7333 0.7333 0.7888
 black 0.6241 0.6015 0.8496 0.8271 0.6617 0.8571
 Screen Function
 landing page 0.5465 0.5346 0.7106 0.7017 0.7947 0.8115
 signup 0.4907 0.5556 0.7731 0.7130 0.7361 0.7778
 checkout 0.5545 0.4182 0.6000 0.7091 0.7545 0.8000
 profile 0.4667 0.5538 0.5487 0.6513 0.9026 0.7590
 Screen Layout
 dashboard 0.5867 0.6067 0.7600 0.7933 0.7867 0.8800
 chart 0.6061 0.6667 0.7121 0.7424 0.8485 0.8030
 form 0.5429 0.5000 0.6857 0.7429 0.5714 0.7714
 list 0.6136 0.5909 0.7045 0.9091 0.6364 0.8182
 grid 0.5000 0.5811 0.6351 0.6486 0.7162 0.7432
 Platform
 mobile 0.7785 0.7847 0.8356 0.7954 0.9250 0.9402
 website 0.7513 0.7481 0.8418 0.8224 0.8837 0.9171
 Average 0.5965 0.6249 0.7342 0.7545 0.7522 0.8272

based baselines, we also set up several derivations of our model as baselines to test the importance
of different inputs of our approach including with or without pretrained model (ResNet-pretained,
ResNet+pretained), only using UI design image, existing tags or both of them (ResNet+pretained,
Tag only, Tag+Image). The training and testing configurations for these baselines are the same as
that of our CNN model.

5.3 Evaluation Results
As we train a binary classifier for each tag, we adopt the accuracy as the evaluation metric for
the model. In different settings of data splitting, our model can still achieve the best performance
compared with all baselines with average accuracy as 0.7875, 0.7829, 0.7940 (Table 3). It also
demonstrates the robustness of our model in the scenario of the small training dataset. Due to

Proc. ACM Hum.-Comput. Interact., Vol. 4, No. CSCW2, Article 123. Publication date: October 2020.
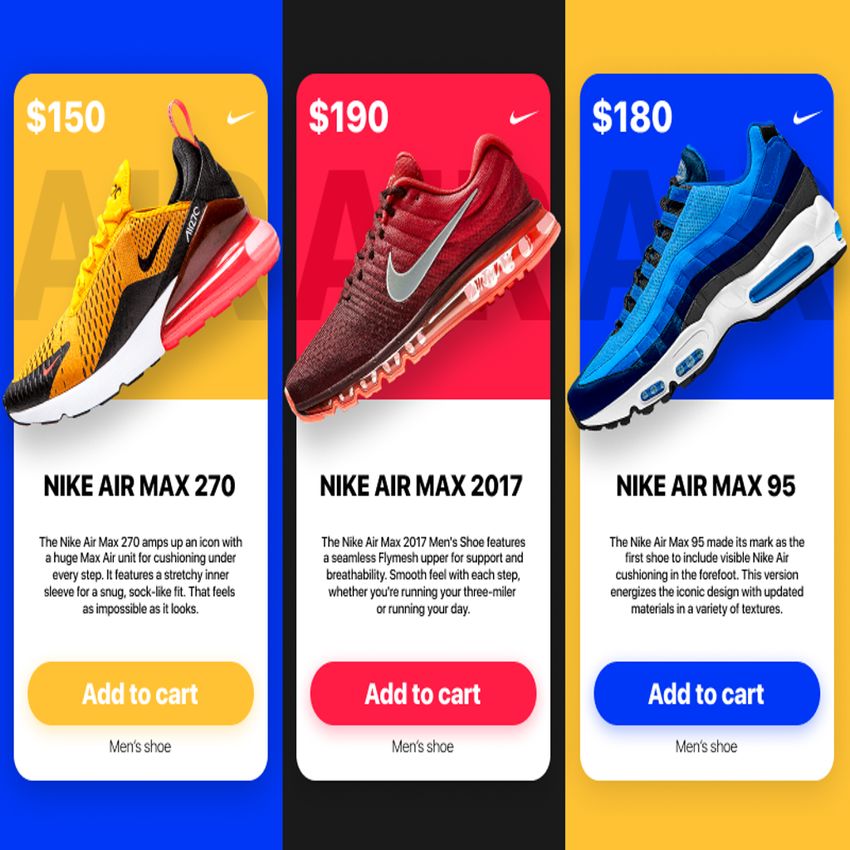
From Lost to Found: Discover Missing UI Design Semantics through Recovering Missing Tags 123:15 Original Tags: Original Tags: app, flat, minimal app, Original Tags: Original Tags: Original Tags: app, design, flat, illustration, minimalist, modern, trendy, ui creditcardcheckout, dailyui, minimal, type, typography, ui, front end, uiux design app, design, ui ux design, uxdesign, ux designer uichallange, uidesign ux, web, website Predicted Additional Tags: Predicted Additional Tags: Predicted Additional Tags: Predicted Additional Tags: Predicted Additional Tags: food&drink, red, mobile, website, blue, landing ecommerce, mobile, mobile, blue, landing music, blue, grid grid, list page, form checkout page, travel, grid Fig. 5. The predicted tags by our model for complementing the original tags. space limitations, we introduce more detailed performance only in one setting4 (80% training, 10% validation and 10% testing) which can be seen in Table 4. For comparison, the first 4 models (i.e., Histo+SVM, Histo+DT, ResNet-pretrain and ResNet+pretrain) only use images as input, while only textual information is used in “tag only” model. Our model (Tag+Image) combine both images and tags. The traditional machine learning method based on the human-crafted features can only achieve about 0.6 average accuracy, while our model can achieve the average accuracy as 0.8272 i.e., the 32.4% boost than the best baseline. The good performance of our model is due to two factors. First, the usage of the pretrained ResNet based on the ImageNet dataset increases the accuracy from 0.7342 to 0.7545. Second, combining both the visual information and textual information can lead to better prediction accuracy than using any single information. Figure 5 shows some predicted additional tags for example UI designs by our model. It shows that our models can help locate the platform (e.g., “website” for the second UI), screen color (e.g, “blue” for the fifth UI), app functionality (e.g., “food” for the first UI), screen functionality (e.g., “checkout” for the third UI), and screen layout (e.g., “grid” for the fourth example). All of these predicted tags are not appearing in the original tag set, and these additional tags can complement with the original ones for more effective UI retrieval. Besides, once our method can be incorporated into the real site like Dribbble, our model can recommend users with potential tags before their design upload which proactively ensures the quality of design tags. To show how our deep learning model works well for predicting the tag for the given UI design, we visualize the features learned in our model in Figure 6. For example, our model spots the play button which widely appears in the music player apps and highlights the "player" in the words in Figure 6.(c) when predicting tag “music”. The visualization results reveal that our model does capture the visual and textual semantics of different UI designs. Albeit the good performance of our model, we still make wrong predictions for some UI designs. To identify the common causes of prediction errors, we then further manually check the wrong predictions in the test dataset. According to our observation, there are two main reasons leading to the wrong prediction. First, some UI designs are too complicated for the model to recognize the right tag for it. For example, the design in Figure 7(a) is tagged with a “music” class. However, there is no notable feature for our classifier to understand it correctly. Second, some negative data is not really negative data due to the different preferences of designers. Our way to collect negative data assumes that one UI design image that does not contain the target tags but contains other same-category tags should not be attached to the target tag. Although it works for most cases, the collected negative data still contains some “noisy” UI designs i.e., UI 4 More detailed results in other settings can be seen at https://github.com/UITagPrediction/CSCW2020 Proc. ACM Hum.-Comput. Interact., Vol. 4, No. CSCW2, Article 123. Publication date: October 2020.
You can also read