Mapping undercover: integrated geoscientific interpretation and 3D modelling of a Proterozoic basin - Recent
←
→
Page content transcription
If your browser does not render page correctly, please read the page content below
Solid Earth, 11, 1053–1077, 2020
https://doi.org/10.5194/se-11-1053-2020
© Author(s) 2020. This work is distributed under
the Creative Commons Attribution 4.0 License.

Mapping undercover: integrated geoscientific interpretation
and 3D modelling of a Proterozoic basin
Mark D. Lindsay1 , Sandra Occhipinti1,2 , Crystal Laflamme1,3 , Alan Aitken1 , and Lara Ramos1
1 TheCentre for Exploration Targeting, School of Earth Sciences, The University of Western Australia, Crawley,
Western Australia, 6009, Australia
2 Mineral Resources, Commonwealth Science and Industry Research Organisation, Kensington,

Western Australia, 6151, Australia
3 Department of Geology and Geological Engineering, Laval University, Québec City, Québec G1V 0A6, Canada

Correspondence: Mark D. Lindsay (mark.lindsay@uwa.edu.au, markdlindsay@gmail.com)

Received: 4 December 2019 – Discussion started: 17 January 2020
Revised: 29 April 2020 – Accepted: 15 May 2020 – Published: 24 June 2020

Abstract. Gravity and 3D modelling combined with geo-            Bryah sub-basin and Padbury Basin. The conclusion is that
chemical analysis examine the subsurface within and below        the formation of the Yerrida Basin involves a geodynamic
the poorly exposed Palaeoproterozoic Yerrida Basin in cen-       history more complex than previously thought. This result
tral Western Australia. Understanding the structure of a re-     highlights the value in geophysics and geochemistry in re-
gion is important as key features indicating past geodynamic     vealing the complexity of the earlier geodynamic evolution
processes and tectonic activity can be revealed. However, in     of the basin that may be indiscernible from surface geology
stable, post-depositional tectonic settings only the younger     but may have high importance for the tectonic development
sedimentary units tend to be widely exposed, rendering di-       of the region and its mineral resources.
rect observation of basement and intrusive rocks impossible.
Geophysical imaging and modelling can reveal the structure
of a region undercover. High-magnitude density anomalies
around the basin cannot be reconciled with current geological    1   Introduction
knowledge in the case presented here. The gravity anomalies
infer an abundance of buried and high-density material not       The Yerrida Basin is a region comprised of Palaeoprotero-
indicated by the surface geology. A hypothetical causative       zoic rocks located in the Capricorn region, central Western
source for the high-magnitude gravity anomalies is mafic         Australia. A series of sedimentation events and unconformi-
rocks that were intruded and extruded during basin rifting.      ties combined with a history of mafic magmatism and the
The simplest and plausible stratigraphic attribution of these    presence of Archean greenstone belts and an inlier have pro-
interpreted mafic rocks is to the Killara Formation within the   duced complex geology that cannot be resolved from field
Mooloogool Group. However, geochemistry reveals that the         studies alone. Thus, there is an opportunity to examine the
Killara Formation is not the only host to mafic rocks within     covered geology of the Yerrida Basin with a range of geo-
the region. The mafic rocks present in the Juderina Forma-       physical techniques. This opportunity exists because multi-
tion are largely ignored in descriptions of Yerrida Basin mag-   ple geophysical data are required to delineate anomalies that
matism, and results indicate that they may be far more sub-      can be interpreted to be structure, rock bodies or both. That
stantial than once thought. Sulfur isotopic data indicate no     no individual physical field adequately reflects all the ele-
Archean signature to these mafic rocks, a somewhat surpris-      ments required to construct a meaningful model stems from
ing result given the basement to the basin is the Archean Yil-   the ambiguity of geophysical data (Nettleton, 1942; Fullagar
garn Craton. We propose the source of mafic rocks is vents       et al., 2004). Different lithologies often share very similar
located to the north along the Goodin Fault or under the         characteristics for a single petrophysical attribute (igneous,
                                                                 metamorphic and sedimentary examples with magnetic sus-

Published by Copernicus Publications on behalf of the European Geosciences Union.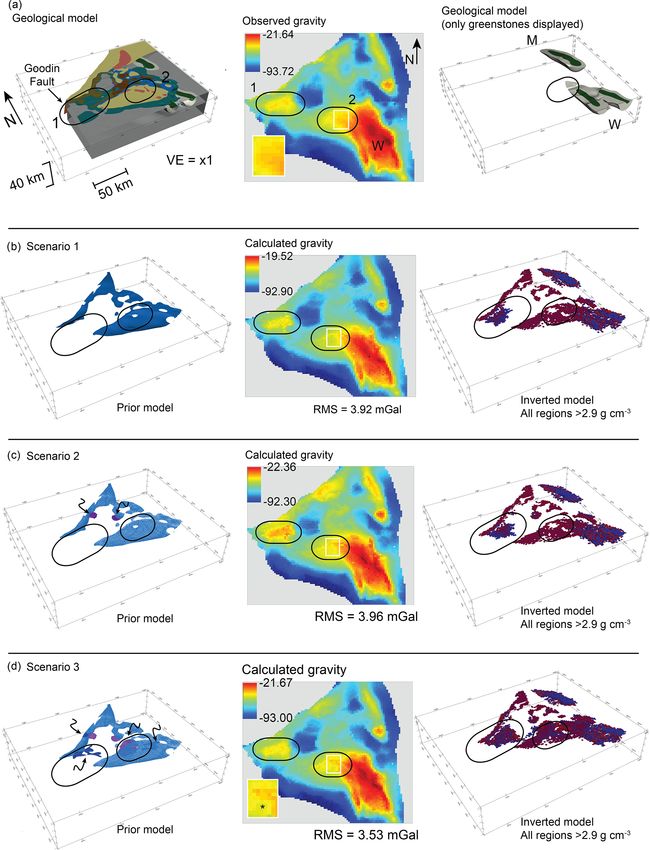
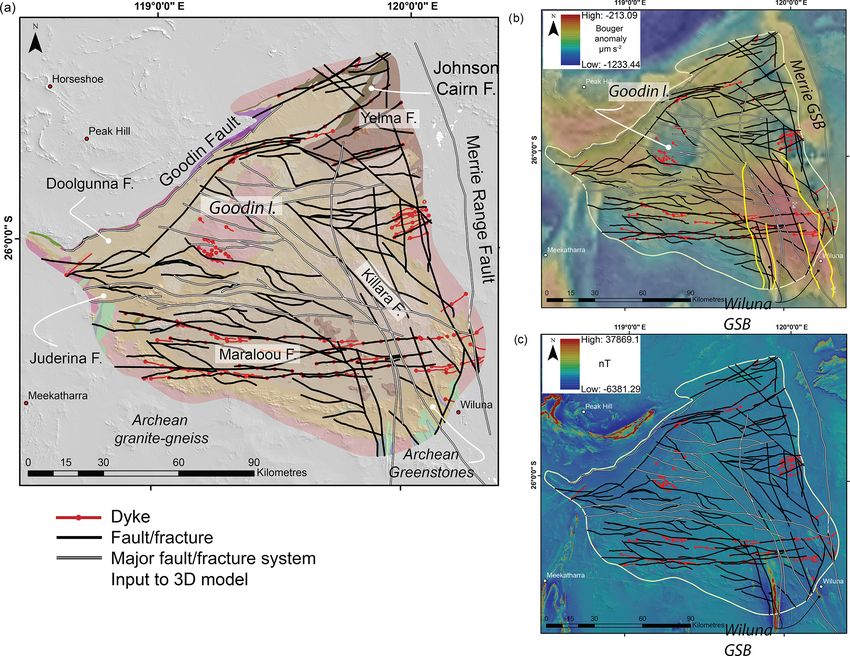
1054                                                              M. D. Lindsay et al.: Integrated geoscientific interpretation

ceptibility; see Grant, 1985, and Clark, 1997; for density          interpretation, geophysical forward modelling, 3D structural
examples see Manger, 1963). Differentiation between ge-             modelling, geophysical inversion and whole rock geochem-
ological units is typically made with less ambiguity using          istry. The initial hypotheses about basin structure were gen-
multiple petrophysical attributes. For example, Perrouty et         erated primarily from the integrated interpretation of geo-
al. (2012) and Lindsay et al. (2016) use magnetic suscep-           logical, gravity and magnetic datasets. Geophysical mod-
tibility and density measurements for both structural inter-        elling was used to expand the understanding of architec-
pretation and forward modelling to differentiate geological         ture into three dimensions. Geochemistry was used to de-
units. This scenario is not unique, and typically any geologi-      termine whether the interpreted mafic bodies were likely to
cal investigation using geophysics requires at least two phys-      be the Killara Formation basalts or different bodies that may
ical fields to reveal architectural elements with less ambigu-      be associated with the Juderina Formation. The results were
ity to the interpreter (Aitken and Betts, 2009; Blewett et al.,     used to determine whether and where in the Yerrida Basin
2010; Dufréchou et al., 2014; Lindsay et al., 2016; Perrouty        volcanic-hosted massive sulfide (VMS) mineralization might
et al., 2012). These examples show how increased interpreta-        be prospective.
tion confidence is provided by identifying co-located anoma-
lies present in multiple datasets. The reasoning is that if an
anomaly is present in multiple datasets, it is less likely that     2   Yerrida Basin geology
(i) the anomaly has not been introduced as an artefact during
data processing or collection and (ii) it is significant enough     The Palaeoproterozoic Yerrida Basin is located on the north-
that it influences each of the represented physical fields to       ern margin of the Archean Yilgarn Craton within the south-
produce a detectable anomaly.                                       ern part of the Capricorn Orogen (Fig. 1) and extends ap-
   An alternative and less sceptical viewpoint is to use multi-     proximately 150 km from north to south and 180 km from
ple datasets to detect anomalies because some geology only          east to west. Other Palaeoproterozoic basins are located at the
has a detectable response in specific physical fields or with       margins of the Yerrida Basin: the Bryah sub-basin and Pad-
a particular orientation. For example, gravity and magnetic         bury Basin (north and west) and the Earaheedy Basin (east).
data were used by Lindsay et al. (2017) and Kohanpour et            The Bryah sub-basin was recently found to be a sub-basin
al. (2018) to delineate structure from a region in east Kim-        of the Yerrida Basin by Occhipinti et al. (2017). Archean
berley, northern Western Australia, where magnetic data pro-        rocks also bound the basin with the northern extent of the
vided nearer-surface imaging of the crust, and gravity im-          Wiluna Greenstone Belt to the south-east and the Yilgarn
aged the deeper structure. Brethes et al. (2018) use mag-           Craton granite-gneiss to the east. The Archean Goodin Inlier
netic and electromagnetic data with field observations to per-      sits within the Yerrida Basin. The Archean Marymia Inlier is
form an interpretation of the Jameson Land Basin, Green-            located to the north and separated from the Yerrida Basin by
land, where at the smaller scale of their study, electromag-        part of the Bryah Basin.
netic data imaged the surface and near-surface geology ef-             The stratigraphy of the Yerrida Basin, summarized in
fectively, and magnetic data imaged the deeper structure.           Fig. 2 and by Occhipinti et al. (2017), is comprised of an
Blaikie et al. (2014) use detailed gravity and magnetic sur-        underlying Archean basement of granite–greenstone rocks
veys to compare the structure of maars and diatremes in the         typical of the Yilgarn Craton. The Wiluna Greenstone Belt
Newer Volcanics Province (NVP; Victoria, Australia) and in-         is located at the south-eastern edge of and is unconformably
fer their eruptive histories.                                       overlain by the Yerrida Basin. The Merrie Greenstone Belt is
   Geological constraints are required to support geophysical       located at the eastern edge of the basin and is unconformably
interpretation and modelling. The inclusion of field- or core-      overlain by Yerrida Basin and Earaheedy Basin rocks. The
collected data is arguably the best way to reduce geophysical       Goodin Inlier is an elliptical, roughly 30 km × 45 km frag-
and petrophysical ambiguity (Betts et al., 2003; Brethes et         ment of Archean granitic basement unconformably over-
al., 2018; Perrouty et al., 2012). Husson et al. (2018) use ge-     lain by the Windplain Group, the basal units of the Yer-
ological measurements and interpretations in the form of a          rida Basin. Goodin Inlier rocks are heavily weathered, pre-
petrophysically attributed 3D geological model to constrain         dominantly monzogranites and mostly undeformed except at
gravity inversion and locate karstified regions in the Langue-      the south-western margin. Easterly to south-easterly trend-
doc area, southern France. Such regions, covered by large ar-       ing mafic dykes intrude the Goodin Inlier and are marked
eas of regolith, transported cover or basin sedimentary rocks,      in places by sericitized feldspars produced by contact meta-
make opportunities to make relevant observations of the tar-        morphism (Adamides, 1998). The Marymia Inlier, also an
get rare. Thus, a necessary reliance on petrophysical con-          Archean fragment, is located to the north and north-east of
straint ensues when geophysical interpretation and modelling        the Yerrida Basin and was likely reworked during the Palaeo-
become the only convenient methods to examine geological            proterozoic (Bagas, 1999). Sedimentation patterns and the
structure.                                                          development of the Yerrida Basin were likely influenced by
   This paper describes how different datasets were used to         both the Goodin and Marymia inliers and uplift early in basin
identify various parts of basin architecture through structural     development (Pirajno et al., 1998).

Solid Earth, 11, 1053–1077, 2020                                                       https://doi.org/10.5194/se-11-1053-2020
M. D. Lindsay et al.: Integrated geoscientific interpretation                                                                            1055

Figure 1. (a) Location and geology of the Yerrida Basin, Capricorn Orogen. (b) Bouguer gravity image of the Yerrida Basin shown with
sampling locations for petrophysical and geochemical data. Points represent surface sample locations; diamonds represent the location
of diamond-drilled core collars with name. Significant regions are labelled with Archean rocks shown with italic font. GSB signifies the
greenstone belt. The legend lists group-level stratigraphic units, and those shown in bold are described in Fig. 2. The shaded region indicates
those outside the study area.

Figure 2. Stratigraphy and input for the Yerrida Basin 3D model modified from Occhipinti et al. (2017). The position of unconformities
is indicated with a wavy line, and approximate thicknesses are given. The position of the mafic intrusives is shown to indicate the possible
stratigraphic position being tested by geophysical modelling. Unit colours correspond to those used in the 3D model (see 3D Model in
Sect. 4.6 and Fig. 10).

  The development of the Yerrida Basin began with the de-                 basaltic volcanic and intrusive rocks of the Killara and Nar-
position of the Windplain Group at ca. 2200 Ma, followed                  racoota formations (Mooloogool and Bryah groups, respec-
by the Mooloogool and Bryah groups from 2180 to 1996 Ma                   tively), though other mafic intrusive and extrusive rocks are
(Occhipinti et al., 2017; Pirajno and Occhipinti, 2000). The              observed in other formations (Juderina and Karalundi forma-
rocks of the Windplain Group are representative of a shallow              tions; Occhipinti et al., 2017) and as dykes (2200–2014 Ma)
coastal and possible epicontinental setting (Occhipinti et al.,           (Mueller, 2011; Occhipinti et al., 2017). The geodynamic
2017), while the rocks of the Bryah and Mooloogool groups                 evolution of the Yerrida Basin is interpreted as a pull-apart
were deposited in relatively higher-energy and possible rift              basin opening consistent with a trailing-edge marginal sag
environments (Occhipinti et al., 2017; Pirajno and Adamides,              basin (Pirajno and Occhipinti, 2000), progressing to a rift in
2000). Periods of magmatism are recorded primarily by the                 the north (Bryah sub-basin) (Occhipinti et al., 2017; Olierook

https://doi.org/10.5194/se-11-1053-2020                                                                Solid Earth, 11, 1053–1077, 2020
1056                                                              M. D. Lindsay et al.: Integrated geoscientific interpretation

et al., 2018). Continued extension resulted in the intrusion        (dRTP) (Brett, 2017a). The resulting dRTP grid is a mosaic of
and extrusion of the Killara Formation tholeiitic basalts (Oc-      government-funded aeromagnetic surveys with line-spacing
chipinti et al., 1997). Basin development ceased with the           between 200 and 400 m. Flight heights were between 80 and
deposition of the Maraloou Formation (Mooloogool Group)             90 m depending on the individual survey. Various transforms
shales and siltstones in a lacustrine environment (Pirajno and      and filters were applied to the dRTP grid to subdue or en-
Adamides, 2000; Pirajno and Occhipinti, 2000; Occhipinti et         hance particular features and included tilt, vertical and hori-
al., 2017). The Mooloogool Group is unconformably over-             zontal derivatives, analytic signal, upward continuation, and
lain by the Yelma Formation (Tooloo Group) and is the basal         dynamic range compression (DRC; see Kovesi et al., 2012,
unit of the Earaheedy Basin (Occhipinti et al., 2017).              for details).
                                                                       Bouguer gravity data (Fig. 3b) were obtained from the
Mineralization potential                                            Australian National Gravity Database maintained by Geo-
                                                                    science Australia and have been corrected for terrain and
The Yerrida Basin is host to epigenetic lead-carbonate and          spherical-cap effects (Brett, 2017b). Older data from the east-
oxide mineralization at the unconformable contact between           ern part of the Capricorn Orogen preserve topographic ef-
the carbonate and sandstone rocks of the Juderina Formation         fects as only the most recently acquired surveys are terrain-
and the overlying Yelma Formation (Pirajno and Occhipinti,          corrected. Most gravity data have a station spacing of be-
2000). The position of this unconformity in the southern part       tween 2 and 4 km; however, in areas of more sparse coverage
of the basin is likely due to it being exposed while sedimen-       spacing can be up to 11 km. A grid was interpolated using
tation occurred further north. The potential for epithermal         a minimum curvature algorithm (Briggs, 1974) and used for
copper exists in the Thaduna Formation due to the presence          interpretation and modelling. The gravity grid and variations
of the Thaduna copper mine (Pirajno and Adamides, 2000).            were produced with a cell size of 1 km to provide the neces-
Volcanic-hosted massive sulfide (VMS) mineralization is ex-         sary detail and coverage.
hibited by the DeGrussa Cu–Au–Ag deposit (12 Mt of 4.7 %
Cu and 1.8 g t−1 Au) and is associated with mafic volcan-
ism at 2045 Ma (Hawke et al., 2015). While mineralization           3.3   Structural interpretation
is hosted in the Karalundi Formation of the Bryah Group, the
synchronous deposition of the Juderina and Johnson Cairn            Integrated geological interpretation was conducted using pri-
formations (Occhipinti et al., 2017) has generated interest in      marily geological, gravity, magnetic and digital elevation
the Yerrida Basin for VHMS mineralization, especially along         model data. It was expected that aeromagnetic data would
the north-western margin and Goodin Fault, given they likely        be effective in interpreting the upper crust to determine
influenced the formation of the basin.                              the smaller-scale structural architecture as demonstrated by
                                                                    Aitken and Betts (2008), Betts et al. (2007), Gunn (1997),
                                                                    and Lindsay et al. (2017). However, magnetic data were not
3     Datasets and methods
                                                                    as useful in comparison to these cited studies for the fol-
3.1    Rock properties                                              lowing three reasons: (1) the basin sedimentary rocks do not
                                                                    display enough magnetic susceptibility contrast to allow dis-
Rock properties measured from samples collected from the            crimination of structure; (2) the basin architecture is mostly
study area provide an important constraint for any structural       flat-lying, and thus most rock boundaries (and thus poten-
interpretation or modelling of geophysical data (Fig. 1). Sam-      tial locations of high petrophysical contrast) were parallel to
ples were collected from outcrop and carefully assessed to          the plane of view used during interpretation; and (3) mag-
be free of weathering and alteration; however, it is noted          netic regolith and stream sediments obscure the underlying
that there is a higher risk of sample contamination from sur-       structure. Typical signal processing filters proved the most
face outcrop than from drill core. Magnetic susceptibility and      useful for magnetic data in different areas on the basin: up-
density properties help to guide the reasonable discrimina-         ward continuation (to remove shorter wavelength and near-
tion of rock types from magnetic and gravity datasets dur-          surface responses), the first vertical derivative (1VD), auto-
ing interpretation. The rock property data collected from the       matic gain control (AGC), tilt derivative (TDR) and dynamic
study area guided the classification of geological units in the     range compression (DRC) processing of Kovesi (2012). The
structural interpretation and provided the basis of the suscep-     combination of magnetic data with gravity proved the most
tibility and density values used in forward modelling.              helpful, with blended grids facilitating better imaging of
                                                                    structure, where two grids are overlain and one is made semi-
3.2    Potential field data                                         transparent. In particular, the combination of Bouguer grav-
                                                                    ity data and the 1VD of the magnetic dRTP was used to pro-
Magnetic data (Fig. 3a) were obtained from the Geological           vide additional insight into regions where the magnetic sus-
Survey of Western Australia (GSWA) in grid form with an             ceptibility contrast was low (Almalki et al., 2015; Fairhead,
80 m cell size that had been differentially reduced to the pole     1976; Hildenbrand et al., 2000) (Fig. 3c).

Solid Earth, 11, 1053–1077, 2020                                                       https://doi.org/10.5194/se-11-1053-2020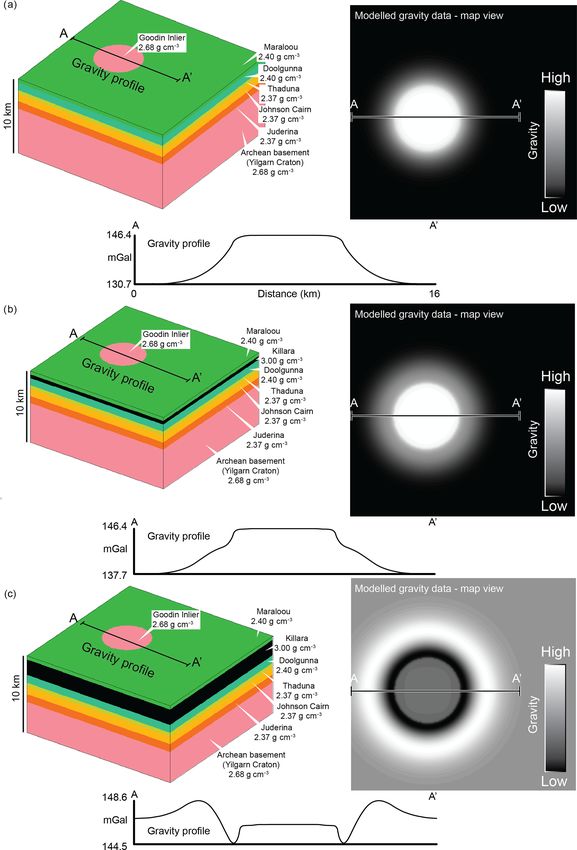
M. D. Lindsay et al.: Integrated geoscientific interpretation 1057
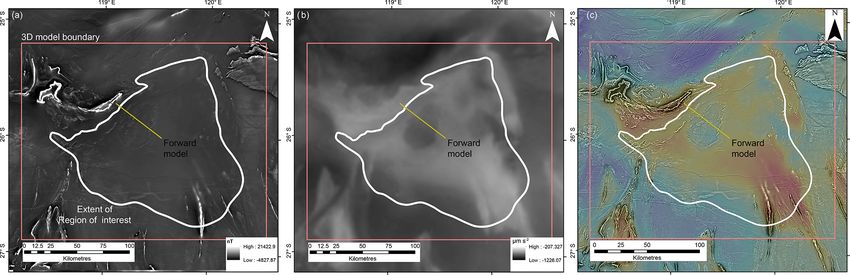
Figure 3. Geophysical grids and forward model location trace (as indicated). (a) Magnetic anomaly, (b) Bouguer gravity anomaly and
(c) blended image of Bouguer anomaly (colour) and 1VD of the dRTP magnetic data (greyscale).
Field-based geological information was obtained from niques were both 3D forward modelling (Talwani and Heirt-
WAROX, the Geological Survey of Western Australia’s rock zler, 1964; Talwani et al., 1959) and geophysical inver-
observation database (Geological Survey of Western Aus- sion (Guillen et al., 2008). GeoModeller software allows the
tralia et al., 2017), and used to locate some structures, but stratigraphy to be defined as a topological constraint with in-
it was principally employed to understand the geometry and terpreted deformation structure assigned to each stratigraphic
orientation of the interpreted structures. WAROX data were unit so that deformation timing can be established and only
invaluable for generating a 3D understanding. geological units of equivalent age or older are affected. As
with all 3D modelling packages, some upscaling of data
3.4 2D joint magnetic and gravity forward modelling needs to be performed (Lindsay et al., 2012) so only the
larger and more significant structures were included. This is
The map interpretation was supported by 2D geophysical for- because of limitations in the algorithms these packages use in
ward modelling along a cross section located in the north- reproducing complex geometries typically encountered in the
western part of the Yerrida Basin (Fig. 3a and b) to provide natural world (Jessell et al., 2014). Stratigraphy was treated
a platform for hypothesis testing and thus an understanding similarly, and the modelled units were limited to formations.
of the basin architecture at depth. The section transects the Likewise, the 3D modelling algorithm provided by GeoMod-
north-western edge of the Yerrida Basin, the Goodin Inlier eller does not allow for joint modelling of more complex ge-
and part of the central part of the basin. The structure and ological relationships, such as equivalent facies or interca-
geology of the surface and upper crust were constrained pre- lated formations (for example, the Doolgunna and Thaduna
dominantly by geological observations taken from WAROX formations) (de Kemp et al., 2017). Simplifications are thus
and GSWA 1 : 100 000 (Doolgunna, Mooloogool, Thaduna) required for all formations being represented as discrete units
and 1 : 250 000 (Glengarry, Peak Hill) scale maps (Appendix while still belonging to the same group. The stratigraphic in-
1) and our own fieldwork. The petrophysical model gen- put data are summarized in Fig. 2.
erated by forward modelling was constrained with density Geophysical inversion was performed using the total litho-
and magnetic susceptibility data that supported the subse- inversion method of Guillen et al. (2008), a stochastic pro-
quent geological interpretation. Forward calculation of the cess which obtains a 3D probabilistic description of geo-
geophysical response was undertaken using the GM-SYS ap- logical objects while constrained by the available data: ge-
plication in the Geosoft Oasis montaj® (https://www.geosoft. ological boundaries (our interpretation), petrophysics (den-
com/products/oasis-montaj, last access: 12 April 2020) soft- sity) and the observed geophysical field (the gravity grid).
ware following the methods of Talwani et al. (1959). A range of model geometries and rock property values is
tested and returns a model and a probability distribution over
3.5 3D modelling and geophysical inversion of gravity model space, which addresses issues surrounding determin-
istic inversion methods of non-uniqueness and attempts to
3D modelling was performed using Intrepid Geophysics Ge- identify the best or most probable model (Tarantola, 2006).
oModeller© (Calcagno et al., 2008). The purpose of pro- The input to inversion is the geological model with petro-
ducing a model was two-fold: (1) to better understand the physical properties assigned to each formation. Inversion can
3D architecture of the basin and (2) to test the modelled result in some violations of model topology, where implausi-
architecture against the observed regional geophysical re- ble stratigraphic relationships are recovered as they provide
sponse across the entire basin. Geophysical modelling tech- a less costly mathematical solution. This method allows the
https://doi.org/10.5194/se-11-1053-2020 Solid Earth, 11, 1053–1077, 2020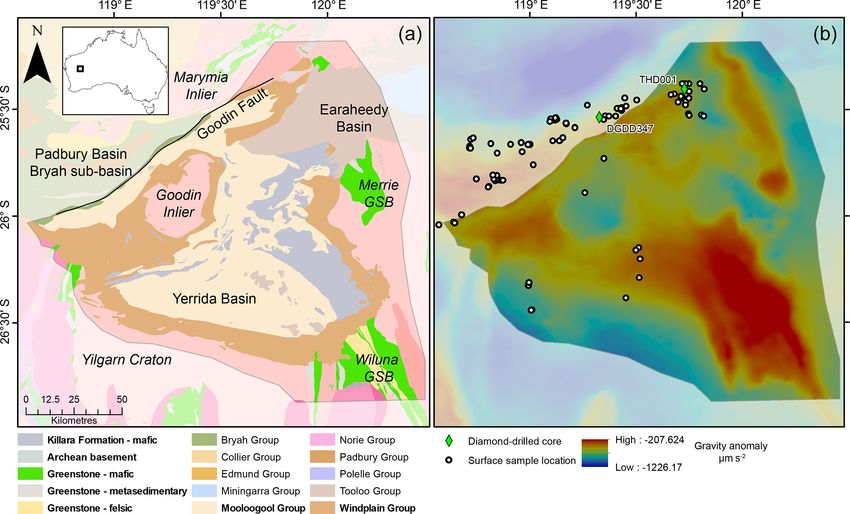
1058                                                              M. D. Lindsay et al.: Integrated geoscientific interpretation

application of constraints to ensure that model topology (i.e.      Goodin Inlier. The Wiluna Greenstone Belt is interpreted as
the stratigraphy; Fig. 2) was not violated and that recovered       extending under the southern edge of the Yerrida Basin (in-
lithologies remain in the correct stratigraphic order.              terpreted boundaries indicated by the yellow line in Fig. 6b)
                                                                    as its characteristic signature extends almost as far north
3.6    Geochemistry                                                 as latitude 26◦ S and dominates the gravity response of the
                                                                    south-eastern corner of the basin.
Ultramafic and mafic rock samples obtained from the Yer-               More detailed structural interpretation at 1 : 100 000 scale
rida Basin were analysed for major and trace element geo-           relied upon existing GSWA geological maps, WAROX
chemistry at the commercial Australian Laboratory Services          (GSWA field observation database), magnetic data, or-
(ALS) laboratory, Perth. Further details (data tables and           thophotos, digital elevation models, and Landsat 8 and
methods) are provided in the supplementary materials of             ASTER data provided as CSIRO Geoscience products (Cud-
Olierook et al. (2018).                                             ahy et al., 2008). Gravity data were used where the resolution
                                                                    allowed the structure to be interpreted.
                                                                       In both parts of the interpretation, magnetic data proved to
4     Results
                                                                    be less useful here than other data. The magnetic grids show
4.1    Petrophysics                                                 very little contrast in the Yerrida Basin rocks (Fig. 6c), and
                                                                    this is supported by the magnetic susceptibility results shown
Table 1 shows the measured values of both magnetic suscep-          in Fig. 4. Some of the interpreted faults are supported by field
tibility (in SI ×10−3 units) and density (g cm−3 ) from rocks       mapping, the geological maps, the DEM and our own field
representative of the Yerrida Basin stratigraphy and the input      validation (Fig. 1, note site locations).
for forward and inverse geophysical modelling. Sample lo-              The interpretation (Fig. 6a) shows an overall E–W or
cations are shown in Fig. 1. The magnetic susceptibility val-       WNW–ESE orientation of the structure in the west and centre
ues show very little variation between rock units. This, com-       of the basin. The structure in the eastern and southern part of
bined with the magnitude of error that envelops the range of        the basin shows an orientation of mainly NNW–SSE, similar
susceptibility values across the measured rock unit, means          to the orientation of the underlying Archean greenstone belt,
that accurately differentiating geological bodies with mag-         and suggests inherited structure from the basement into the
netic data in this location is unlikely. Density petrophysics       basin. The lithological interpretation differs little from exist-
do show greater variability between rock units with less error,     ing 1 : 100 000 and 1 : 250 000 GSWA maps and shows that
meaning that gravity data may be more useful than magnetic          the Juderina Formation forms the base to much, if not all, of
data in differentiating geological bodies during forward mod-       the basin.
elling even with data at a lower resolution. Figure 4 shows the        The most intriguing part of the interpretation relates to the
histogram representation of magnetic susceptibility for each        Mooloogool Group rocks, which are interpreted as being lo-
unit, and Fig. 5 shows the same for density.                        cated in the central, western, eastern and northern parts of
   Not all geological rock units used in the geophysical and        the basin, with the youngest rocks of the Maraloou Forma-
3D models have measurements obtained from field-collected           tion being the southernmost. The tholeiitic basalts of the Kil-
samples. Generic values taken the corresponding lithology of        lara Formation are most extensive in the east with some out-
Telford et al. (1990) were used when otherwise unavailable.         crop in the central, northern and western parts. This was un-
                                                                    expected, and thus interesting, as basaltic rocks are usually
4.2    Structural interpretation                                    the densest rocks in a field area and contribute to stronger
                                                                    gravity anomalies. The initial interpretation of the gravity
The structural interpretation (Fig. 6a) was started by using        data showed a moderate-magnitude anomaly to be extensive
gravity data to develop a basin-scale structural framework.         everywhere in the basin (Fig. 6b), which was initially as-
Some obvious features are the greenstone belts (Wiluna in           sumed as Killara Formation due to the presence of higher-
the south and Merrie in the east), characterized by a high-         density mafic rocks relative to the lower-density sedimentary
magnitude gravity anomaly (Fig. 6b), and strong and lin-            rocks. Thus, the initial interpretation of the Killara Formation
ear magnetic anomalies trending to the north-north-west, as         shown in Fig. 6a may not adequately represent its true extent.
shown in the dRTP–1VD blended magnetic image (Fig. 6c).             If the higher-magnitude gravity anomaly observed through-
The Goodin Inlier (Fig. 6a) is particularly obvious due to          out the Yerrida Basin is caused by the Killara Formation, then
its low gravity signature in contrast to the moderate signa-        the extent of this formation may be far more extensive. The
ture surrounding it (Fig. 6b). The higher-magnitude, moder-         next sections describe how forward modelling and inversion
ate gravity signature also appears to be quite extensive and is     attempt to falsify the hypothesis that the Killara Formation is
observed, in some places, to extend to the extents of the basin     far more extensive than initially thought.
(Fig. 3b, white line). This suggests the moderate-magnitude
anomaly is in response to Yerrida Basin rocks rather than the
lower-magnitude response basement, as exemplified by the

Solid Earth, 11, 1053–1077, 2020                                                        https://doi.org/10.5194/se-11-1053-2020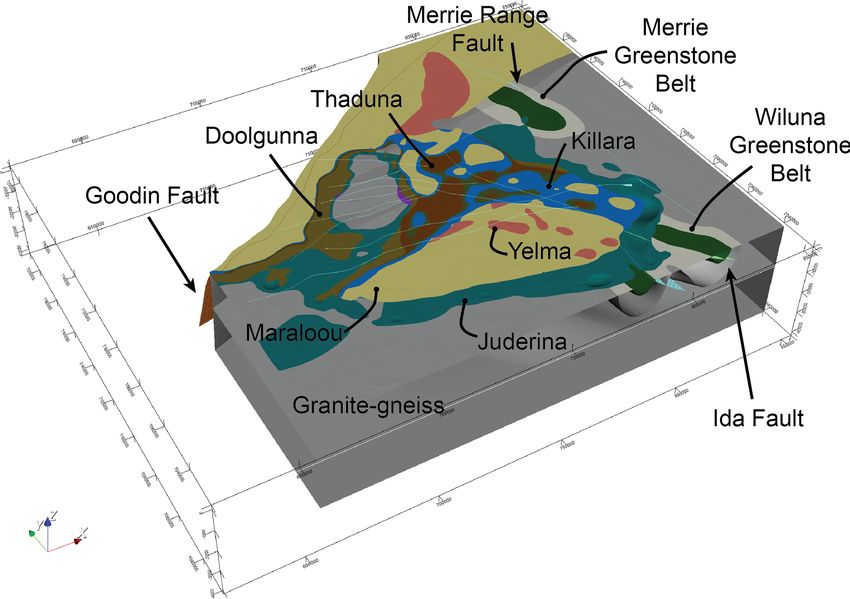
M. D. Lindsay et al.: Integrated geoscientific interpretation                                                                  1059

Table 1. Petrophysical statistics calculated from rock sample measurements.

                           Magnetic susceptibility
                           Formation/rock type        Sample size (n)    Mean (SI ×10−3 )      SD (SI ×10−3 )
                           Dyke                                    30                  6.20              4.26
                           Goodin Inlier                           33                 10.31              2.06
                           Juderina                               164                  5.04              4.16
                           Karalundi                               44                  5.14              2.62
                           Killara                                 56                  5.74              6.16
                           Maraloou                                85                  4.76              3.83
                           Narracoota                             127                  3.36              2.58
                           Yilgarn Craton granitoid                22                  5.54              3.63
                           Thaduna                                 32                  6.66              5.19
                           Density
                                                                              Mean (g cm−3 )     SD (g cm−3 )
                           Goodin Inlier                            1                   2.68              NA
                           Juderina                                13                   2.82            0.055
                           Killara                                  3                   2.89            0.111
                           Marymia Inlier                           4                   2.73            0.086
                           Yilgarn Craton granitoid                 2                   2.68            0.029
                           Thaduna                                  1                   2.40              NA

Figure 4. Histogram representations of measured magnetic susceptibility from Yerrida Basin rocks.

https://doi.org/10.5194/se-11-1053-2020                                                             Solid Earth, 11, 1053–1077, 2020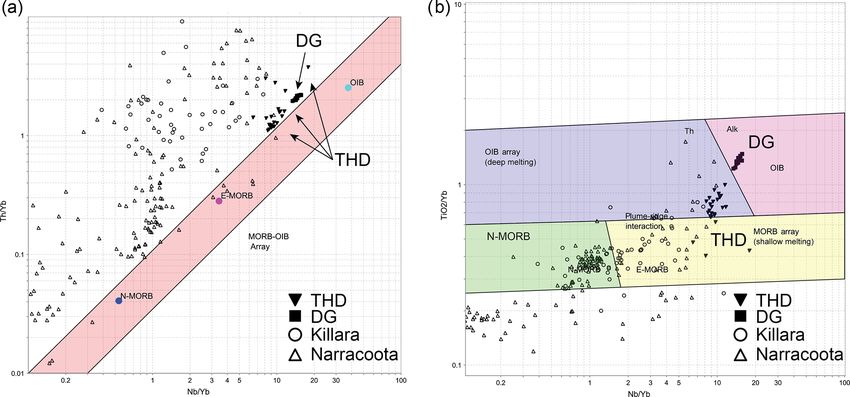
1060                                                                  M. D. Lindsay et al.: Integrated geoscientific interpretation

Figure 5. Histogram representations of measured Archimedes bulk density of Yerrida Basin rocks.

Figure 6. Simplified structural geophysical interpretation of the southern Yerrida Basin. (a) Integrated interpretation of structure and rock
units with the highlighted major fault systems as input to the 3D model (see 3D Model in Sect. 4.6). (b) Interpreted structure shown with
gravity data (blended image; Bouguer anomaly shown in colour with 1VD of the Bouguer anomaly in greyscale). (c) Interpreted structure
shown with blended magnetic data (blended image; dRTP shown in colour with 1VD of the dRTP shown in greyscale). GSB signifies
greenstone belt.

4.3    Forward modelling                                                 4.4   Conceptual modelling: Noddy

Petrophysically constrained forward modelling of geophys-                “Noddy” is a kinematic modelling package that allows the
ical data was conducted to test the hypothesis that the Kil-             input of geological events and stratigraphy to generate a 3D
lara Formation is more extensive undercover than was shown               model of the resulting architecture (Jessell, 1981; Jessell and
through interpretation. Three stages of forward modelling                Valenta, 1996). A useful feature of Noddy is being able to
were conducted: (1) a 3D conceptual study to validate our                generate the potential field forward response of the model.
primary assumptions, (2) 2D sectional modelling of geophys-              By assigning petrophysical values to each stratigraphic layer
ical data with geological constraints and (3) forward mod-               in the model, a representative grid of the model can be gener-
elling of a 3D geological model.                                         ated (the calculated response) and compared to that provided
                                                                         by the geophysical survey (the observed response; Fig. 7a
                                                                         and b). Figure 7c shows the basement configuration of the
                                                                         conceptual model with the assigned petrophysical attributes.
                                                                         The Yerrida Basin (not shown in Fig. 7c) is thus assumed to

Solid Earth, 11, 1053–1077, 2020                                                              https://doi.org/10.5194/se-11-1053-2020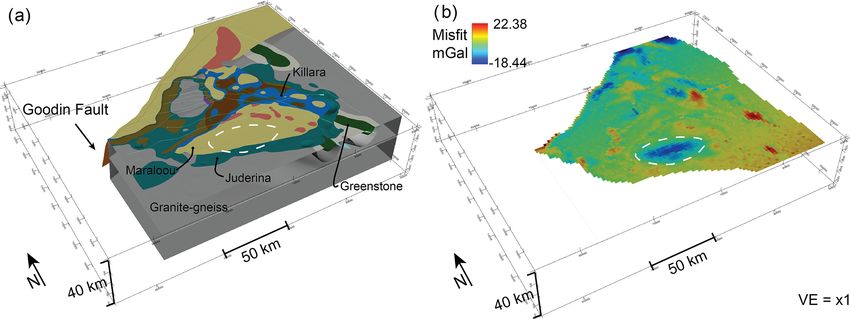
M. D. Lindsay et al.: Integrated geoscientific interpretation                                                                          1061

Figure 7. Initial conceptual model using “Noddy”: (a) the observed gravity response from a part of the Yerrida Basin, showing the location
of the profile in part (b); (b) curve representing the gravity response of the Goodin Inlier taken from the observed gravity; and (c) initial
conceptual 3D model of the Goodin Inlier. The Yerrida Basin sedimentary rocks are modelled but are not shown here for better visualization
of basement geometry.

have an Archean basement, with the exposed Goodin Inlier                 observed data. However, the reality is almost certainly more
forming a dome.                                                          complex than a single, horizontal and lithologically homoge-
   Three geological scenarios were explored (Fig. 8). The                nous layer. The dense material is likely to be a combination
first simulates that no Killara Formation is present in or-              of widespread Killara Formation and sills or possibly intru-
der to explore what the geophysical response would be if                 sions produced through related magmatism.
there were very little or no high-density material in the basin
(Fig. 8a). The second simulates a 500 m thick layer of high-             4.5   Testing intrusive scenarios with 2D geophysical
density material representing the Killara Formation in strati-                 forward modelling
graphic position (Fig. 2) between the Maraloou and Dool-
gunna formations (Fig. 8b). The third simulates 2000 m of                Geosoft® GM-SYS is a forward modelling platform that al-
high-density material (Killara Formation) in stratigraphic po-           lows the easy exploration of geologically complex scenar-
sition (Fig. 8c). The resulting gravity grids are shown in               ios (Talwani and Heirtzler, 1964; Talwani et al., 1959). A
greyscale with the corresponding model and profiles (A–A’)               profile was selected that extended from the northern edge of
sampled from the gravity grids.                                          the basin to the south-east, across the Goodin Fault and the
   Having no dense material in the basin (Fig. 8a) clearly               Goodin Inlier and into the centre of the basin (Fig. 3), which
does not recreate the observed gravity response as the Goodin            is in a similar location to the profiles produced in Noddy
Inlier produces a gravity high rather than the low shown in              (Fig. 7a). The same hypothesis is being tested: whether the
the observed response (Fig. 7b). Adding 500 m of dense ma-               dense material, possibly the Killara Formation and its intru-
terial (Fig. 8b) produces a marginally closer fit to the ob-             sive components, can account for the gravitational response
served response, but the Goodin Inlier still produces a grav-            in this region. However, this form of forward modelling al-
ity high though with a lower difference (8.7 mGal) than in               lows for more complex geometries to be tested manually.
the previous example (15.7 mGal). Adding 2000 m of dense                    A selection of plausible models were generated in accor-
material does produce a response that shows the Goodin In-               dance with the geological history of the region. Two main
lier producing a gravity low, which is somewhat similar to the           questions were asked. Firstly, how sensitive is the gravity re-
observed response. However, this calls for the Killara Forma-            sponse to the dip direction of the Goodin Fault? This was
tion to be consistently 2000 m thick, which is twice as much             tested by changing the dip direction from the north-west to
as the 1000 m formation thickness estimated from previous                the sub-vertical and to the south-east. The dip direction of
work (Pirajno and Adamides, 2000).                                       the Goodin Fault has implications for basin development,
   The results from conceptual modelling with Noddy sup-                 with the direction inferring which side of the fault forms the
port the hypothesis that a significant amount of dense mate-             half-graben shoulder during sedimentation. Secondly, what
rial in the basin can produce the gravity response seen in the           configuration of high-density bodies are required? Two sce-
                                                                         narios were examined. One was that the high-density bod-

https://doi.org/10.5194/se-11-1053-2020                                                               Solid Earth, 11, 1053–1077, 2020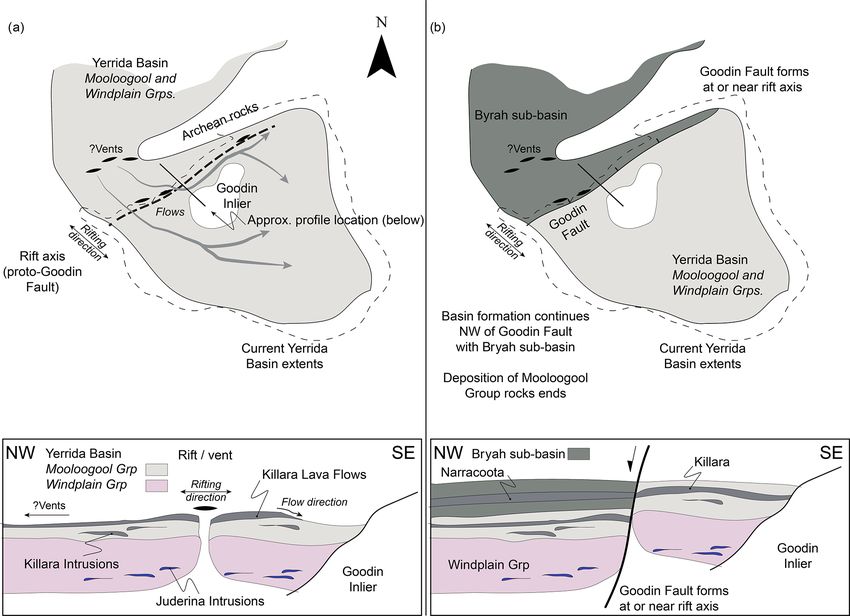
1062                                                              M. D. Lindsay et al.: Integrated geoscientific interpretation

Figure 8. Conceptual forward modelling results obtained from Noddy for (a) no Killara Formation, (b) 500 m of Killara Formation and
(c) 2000 m of Killara Formation.

ies were assumed to be extrusive mafic lavas associated with        ble A1) and the potential field geophysical data (Fig. 3). Fig-
the Killara Formation and thus with no intrusive component.         ure 9a and b show both the magnetic and gravity (respec-
The other was that multiple superposed bodies were possible,        tively) observed responses (dots) and calculated responses
thus assuming both intrusive and extrusive modes of magma-          (lines). The calculated response is produced from the petro-
tism.                                                               physical model (Fig. 9c), where petrophysical values are as-
   Five scenarios were generated from these assumptions.            signed according to values measured from the field. The ge-
Figure 9 shows the model that is most consistent with the           ological section was constructed using geological observa-
geological interpretation (Fig. 6), geological observation (Ta-     tions taken from GSWA maps and WAROX (Appendix 1)

Solid Earth, 11, 1053–1077, 2020                                                       https://doi.org/10.5194/se-11-1053-2020
M. D. Lindsay et al.: Integrated geoscientific interpretation                                                                            1063

Figure 9. Section-based forward modelling of the Yerrida Basin and Goodin Inlier (location of profile shown in Fig. 2). (a) and (b) show the
degree of fit between the observed (points) and calculated (lines) geophysical responses for magnetic (a) and gravity (b) data. The middle
panel (c) shows the petrophysical model that was used to model the calculated geophysical response. Indicative petrophysical values are
shown (bold – density, g cm−3 ; italics – susceptibility, SI×10−3 ) to help guide the visualization of the colour scale shown on the right. The
bottom panel (d) shows the geological interpretation made from the petrophysical model. Boundaries shown on the surface of the model are
sourced from field observations and interpretations (see Table A1).

and interpreted using the petrophysical model so that exist-              the section) and a possible downward throw as indicated by
ing structural relationships are maintained and general geo-              the footwall Yilgarn Craton modelled on the Yerrida Basin
logical reasoning is not violated.                                        side of the boundary. The Goodin Fault has been suggested
   The model fits well with both the magnetic and gravity                 to be at this location, and this model shows it to be a normal,
data. Geological interpretation (Fig. 9d) of the petrophysical            north-west dipping fault consistent with the interpretation of
model (Fig. 9c) shows that the Killara Formation can be mod-              Occhipinti et al. (2017). This is in contrast to the north-west
elled as a set of faulted sills and is broadly consistent with            dipping thrust structure reported by Pirajno and Adamides
the conceptual modelling results shown in the previous sec-               (2000). The analysis presented here is certainly not conclu-
tion. Importantly, the 2D section forward modelling shows                 sive, and the presence of the Goodin Fault is still under ques-
that these sills need only be 1000 m thick. The combination               tion as are its characteristics.
of modelling results supports the hypothesis that the Killara
Formation may be the source of the moderately high gravity                4.6   3D model
anomaly throughout the Yerrida Basin. This interpretation of
sills and intrusions is thus still consistent with that of Pirajno        The hypothesis that mafic rocks attributed to the Killara
and Adamides (2000) and their thickness estimates.                        Formation are the causative source of the gravity anomaly
   At the north-western end of the section (left-hand side                throughout the basin now appears plausible. Hypothesis test-
of Fig. 9d), the boundary between the Yerrida Basin rocks                 ing on simple models and on a section through part of the
(Doolgunna and Juderina formations) and the Bryah Basin                   Goodin Inlier provides some support, but whether this rela-
rocks (Karalundi Formation) has a distinctive signature, es-              tionship is consistent for the entire basin also needs to be
pecially in the magnetic data (Fig. 9a). The geological model             tested. Modelling was expanded to include the entire basin
shows a very steep dip to the north-west (or left-hand side of            in 3D to achieve these aims.

https://doi.org/10.5194/se-11-1053-2020                                                                Solid Earth, 11, 1053–1077, 2020
1064                                                              M. D. Lindsay et al.: Integrated geoscientific interpretation

   A 3D model was constructed using GeoModeller, an im-             tains mafic sills either as finer-grained basaltic or micro-
plicit modelling platform that allows models to be con-             gabbroic rocks at depth. This observation is particular to
strained by known stratigraphy, fault relationships and ge-         the Juderina Formation and not the overlying Johnson Cairn,
ological observations (Calcagno et al., 2008). GeoModeller          Thaduna, Doolgunna and Maraloou formations. Reasoning
also offers geophysical modelling tools, including forward          suggests that the mafic component of the Juderina Forma-
modelling and inversion (Guillen et al., 2008), which operate       tion was intruded during or soon after the deposition of the
directly on the 3D geological model.                                clastic and carbonate components of the formation and was
   Data input to the model was gathered from the stratigraphy       thus restricted to just this formation. Another option is that
(Fig. 2) and structural interpretation (Figs. 6a, 9d). However,     the mafic component of the Juderina Formation is related
only the larger faults were retained for 3D modelling as the        to the intrusive parts of the Killara, Karalundi and Narra-
smaller, more insignificant faults degrade the performance          coota formations; however, if this was true, formations un-
of the modelling engine without providing a commensurate            derlying the extrusive Killara Formation component (John-
increase in geological understanding to this study. Each ge-        son Cairn, Thaduna and Doolgunna formations) should also
ological unit constructed in the 3D model has petrophysical         contain some proportion of mafic intrusive rocks, which (to
values (Figs. 4, 5) assigned to allow a forward response to be      our knowledge) they do not. Thus, adding higher-density
calculated.                                                         bodies proximal to or within the Juderina Formation is a rea-
   The 3D model contains what were considered impor-                sonable means to reproduce the anomalous gravity signature.
tant components to produce a representative geophysical re-            Geophysical inversion provides a means to test the hy-
sponse: the Goodin Inlier; Archean basement; Yerrida Basin          pothesis that higher-density rocks can explain the anomalous
sedimentary and magmatic rocks; the Wiluna and Merrie               density signature. An incremental approach was taken, sim-
greenstone belts; and various faults, including the north-          ilar to that with the simplified conceptual models (Fig. 8),
north-westward extension of the Ida Fault (Fig. 10).                to ensure that multiple scenarios were considered while si-
   The Bryah–Padbury Basin, located in the north-western            multaneously performing sensitivity analyses. The following
corner of the model, is not included in the model. This re-         scenarios were tested.
gion is complex both geologically and geophysically in its
own right, deserving of a dedicated study, and thus not the           – Scenario 1. No additional high-density intrusions are
focus of this work. Likewise, the structure of the surrounding          modelled; only the modelled Killara Formation rocks
Archean greenstones is complex and is addressed by Giraud               are high density (> 3.0 g cm−3 ).
et al. (2019, 2020) in a comprehensive analysis using sophis-
                                                                      – Scenario 2. There is a moderate increase in the volume
ticated inversion techniques constrained by uncertainty esti-
                                                                        of high-density intrusions in locations suggested by the
mation.
                                                                        section-based forward model (Fig. 9).
4.7    3D forward modelling and inversion                             – Scenario 3. There is a large increase in the volume of
                                                                        high-density intrusions, as guided by Scenario 2 and the
3D forward modelling was performed to investigate the den-              location of high-density anomalies in the observed grav-
sity structure of the Yerrida Basin. Initial attempts at mod-           ity data (Fig. 3b).
elling the gravity response produced similar results to those
shown in the conceptual stage (Fig. 8b and b). Including the        Inversion was conducted by discretizing the geological
Killara Formation as a thin unit showed that this had almost        model into cells of 2000 m × 2000 m × 500 m (x, y and depth
no effect in producing the necessary gravitational anomaly          axes, respectively). The maximum number of iterations was
(Fig. 8b). Learning from this result guided the construction        set to 1 million, but convergence was reached before this
of the 3D geological model to include a more substantial            limit was exceeded. The success of the inversion was judged
component to the Killara Formation. The modelled intrusive          on global statistics (root mean square – RMS – misfit) and
bodies were thick (= > 1000 m) and extensive but were still         locally by investigating how inversion produced the neces-
not sufficient to replicate the observed signal. Evidentally an     sary density structure to reproduce the observed gravity field
additional source of high-density material needed to be con-        at specific locations.
sidered.                                                               Each inversion was executed to allow the contacts of the
                                                                    Juderina Formation, intrusive bodies and the Archean green-
4.8    Juderina Formation and a substantial mafic                   stone units to move if required by the inversion. All other
       component                                                    units remained fixed, and their contacts were unable to move.
                                                                    Regions hosting high-density rock bodies were added to the
Drill cores from a range of diamond-drilled boreholes               model in plausible locations according to where the grav-
(THD1, DGDD347, DGDD020, DGDD278, DGDD279,                          ity response is stronger (e.g. Fig. 11c and d). These con-
DGDD281, DGDD319, DGDD320, DGDD404, DGDD406                         straints reflect our knowledge of which rock units contain
and THDD 226) reveal that the Juderina Formation also con-          high-density rocks and whether changing the geometry or

Solid Earth, 11, 1053–1077, 2020                                                       https://doi.org/10.5194/se-11-1053-2020
M. D. Lindsay et al.: Integrated geoscientific interpretation 1065
Figure 10. 3D model constructed to constrain geophysical inversion (oblique view from SW). Check marks on the x axis are at 50 km
intervals, y axis at 20 km intervals and z axis at 10 km.
petrophysical properties of these particular rocks can explain Region 1. The observed gravity data show a high-
the density structure of the Yerrida Basin. magnitude anomaly in Region 1. The right-hand panes in
All scenarios were modelled via inversion successfully. Fig. 11b–d show that the inversion requires dense material
There was an RMS misfit of approximately 4 mGal from > 2.9 g cm−3 to be placed in the circled locations to account
an initial misfit of over 20 mGal, with the final misfit val- for the anomaly in the observed data (Fig. 11a, centre pane).
ues (Fig. 11) and convergence curves being almost identical. Scenarios 1 and 2 do not have mafic bodies modelled in this
While a successful inversion and the corresponding reduc- location (see left-hand panes) so the model requires rocks
tion of the RMS misfit by 80 % are satisfactory, the almost within the Juderina Formation with densities > 2.9 g cm−3 to
identical convergence curves and final RMS values alone are better reproduce the observed response. Subsequently, Sce-
inadequate indicators of geological plausibility. Deeper geo- nario 3 includes a mafic body in this location, possibly also
logical analysis of the resulting model is needed. Figure 11a hosted by the Juderina Formation (Fig. 11d, left pane), and
shows the geological model on the left, the observed gravity the inversion includes higher-density material in this location
data in the centre and the prior model extents of the Wiluna as well but more laterally extensive than in scenarios 1 and
and Merrie greenstone belts (W and M, respectively) on the 2.
right. The left-hand panes of Fig. 11b–d show the prior ge- Region 2. The observed gravity data show a higher-
ological model used for input (scenarios 1, 2 and 3, respec- magnitude gravity anomaly in this location (Fig. 11a, centre
tively). Only the included mafic intrusions are displayed for pane). To the east, the deeper presence of the northern ex-
easier visualization. The centre panes of Fig. 11b–d show tension of the mafic component of the Wiluna Greenstone
the gravity response calculated from the inverted model. The Belt (WGB) is interpreted as being the causative body of
right-hand panes of Fig. 11b–d show the 3D inverted model the higher-magnitude gravity response (W; Fig. 11a, cen-
filtered to only display cells with a minimum density thresh- tre pane). The western edge of this region also displays a
old of 2.9 g cm−3 . This density value was chosen so that only high-magnitude anomaly, though of lesser magnitude than
high-density – and thus most likely only mafic – rocks are the WGB (Fig. 11a–d, white box). Scenarios 1 and 2 show
visible over those that may be dolomitized (Telford et al., that this part of the model is not adequately resolved through
1990). Consideration of dolomitization as an additional high- inversion. Scenario 3 shows some improvement in the region
density material is presented in the discussion. outlined by the white box, though not enough to explain the
The centre panes of Fig. 11 have circles that indicate two southerly portion of the anomaly. A zoomed comparison is
locations that were investigated in more detail: Region 1 in shown in the inset of the centre pane of Fig. 11a (observed
the west and Region 2 in the centre of the Yerrida Basin. field) and Fig. 11d (inverted model calculated gravity re-
sponse). An asterisk in Fig. 11d (centre pane) indicates where
https://doi.org/10.5194/se-11-1053-2020 Solid Earth, 11, 1053–1077, 20201066 M. D. Lindsay et al.: Integrated geoscientific interpretation Figure 11. Geological models and mafic intrusive scenarios subjected to inversion modelling. (a) 3D geological model (left), observed gravity response (centre) and location of greenstone belts (right). (b–d) Results from scenarios 1 to 3, respectively: (left) position of mafic intrusions, calculated gravity response from inversion (centre) and distribution of locations determined by the inversion to be > 2.9 g cm−3 (right). Scenarios 2 and 3 incrementally introduce mafic bodies to the prior model (c and d, left-hand panes) as indicated by the arrows. Colours in the gravity response indicate low (blue), moderate (yellow) and high (red). Solid Earth, 11, 1053–1077, 2020 https://doi.org/10.5194/se-11-1053-2020
M. D. Lindsay et al.: Integrated geoscientific interpretation                                                               1067

additional higher-density material is needed for a better fit to   the gravity anomaly. In addition, the magnitude of densities
the observed field.                                                required to produce the required anomaly (> 2.9 g cm−3 ) is
   Scenario 3 was judged as the basin structure that best          higher than is realistic for dolostone, even if the rock was
reproduces the gravity signature of the Yerrida Basin. Of          made entirely of dolomite. Thus, an extensive mafic compo-
course, some issues remain with the model as shown in              nent in the subsurface is a more likely source of the gravity
Fig. 12 and presented in the discussion.                           anomaly in this location (Fig. 12a). Modelling in Region 2
                                                                   (Fig. 11b–d, centre panes; Fig. 12b) also supports this rea-
                                                                   soning with an additional large, high-density (> 2.9 g cm−3 )
5     Discussion                                                   body required to account for the observed gravity data. Here,
                                                                   the Juderina Formation is not as extensive as in Region 1,
The process of collating, interpreting and modelling geosci-       and the position of the recovered density anomaly implies a
entific data leads to a greater understanding of the capabili-     closer spatial association with the Killara Formation at depth
ties of the available data. The greatest amount of knowledge       (Fig. 11d).
is typically gained by the geoscientist performing these ex-
ercises; however, whether this knowledge can then be effec-        5.2   Density distribution and geological implications
tively communicated so that others can benefit is challenging
(Quigley et al., 2019). The discussion that follows attempts       The distribution of mafic units in the Yerrida Basin was de-
to do this by first presenting a range of outcomes that were       termined through geological modelling combined with petro-
considered useful. Some of these outcomes are not success-         physically constrained gravity inversion. The distribution of
ful in the traditional sense but nonetheless are worthwhile        these mafic units is shown in Fig. 13, along with the previ-
to report, in particular which datasets were useful for differ-    ously assumed extents of the mapped and interpreted Killara
ent purposes, where limitations exist and what aspects of the      Formation for comparison. The Juderina Formation likely
range of modelling procedures nonetheless provided useful          hosts the additional mafic units. We acknowledge that other
insight. The second part of the discussion is a synthesis of       formations may also host mafic rocks; however, the obser-
what was learned about the structure of the Yerrida Basin          vations to support this hypothesis have not been made. Fig-
and the potential for mineralization.                              ure 13 also displays regions 1 and 2 from Fig. 11 and two
                                                                   new regions: Region 3, defined by the misfit area (Fig. 12b),
5.1    Alternatives for higher-density material                    and Region 4, which will be discussed later in this section.
                                                                   The grey regions indicate our current knowledge of the ex-
The central aim was to determine if the characteristic den-        tent of the Killara Formation as shown in GSWA maps and
sity signature of the Yerrida Basin was due to extensive           geophysical interpretation and can be assumed to only repre-
mafic rocks at depth or some other geological reason, such         sent outcrop or near-surface (< 50 m depth below the surface)
as diagenetic or near-surface alteration. Such non-magmatic        rocks. The coloured cells are outputs from the final inversion
processes that are plausible in the Yerrida Basin region           voxet and represent the predicted extents of mafic material at
are shown by the presence of dolomite. The dolomitiza-             the surface and at depth. Cell colour indicates different high-
tion of carbonate rocks forms dolostone when calcite ions          density bodies added incrementally to the prior geological
are replaced by magnesium ions. Calcite (mean density =            model in scenarios 2 and 3 and have no other significance.
2.71 g cm−3 ) is less dense than dolomite (mean density =          The plan view shows a significant increase in the extent of
2.84 g cm−3 ); thus, dolomitization is expected to increase the    mafic material from our current understanding. Region 4 is
density of a rock. The magnitude of density increase depends       an extensive body of mafic material trending to the north-east
on the carbonate proportion of the original rock (with lower       modelled as the Killara Formation.
proportions resulting in less carbonate to dolomitize and thus        Figure 14a displays the inverted model of the Yerrida
a smaller density increase) combined with the degree that          Basin viewed from the south-west with only basin rocks
dolomitization has occurred.                                       and Archean greenstones displayed for ease of visualiza-
   3D geophysical inversion was employed to explore both           tion. Of note is the depth extent of both the Juderina For-
these scenarios, and the recovered density distribution leads      mation and mafic material in Region 4. The section view
us to what is more plausible. Region 1 required a significant      (Fig. 14b) shows the basin rocks and proposed mafic ma-
increase in density when compared to the prior geological          terial. The mafic units are colour coded to differentiate those
model to account for the density anomalies seen in the ob-         that were added incrementally during scenario testing. The
served gravity data (Fig. 11b–d, centre panes). The Juderina       different colours are not intended to indicate that any partic-
Formation forms a significant unit in this area, both in out-      ular unit is unique in stratigraphic position or composition.
crop and at depth, and is likely to contain dolomitic rocks.          Most of the higher-density mafic material is located close
The carbonate portion of the Juderina Formation includes           to the surface (Fig. 14b); however, some has been determined
the relatively minor Bubble Well member and is not con-            to extend deeper in the south-west part (Fig. 14b). This inter-
sidered large enough (Occhipinti et al., 2017) to account for      pretation is consistent with the gravity modelling and inter-

https://doi.org/10.5194/se-11-1053-2020                                                      Solid Earth, 11, 1053–1077, 2020
1068 M. D. Lindsay et al.: Integrated geoscientific interpretation
Figure 12. Assessing the plausibility of the Yerrida Basin model with geological knowledge and geophysical inversion. (a) The 3D model
representing Scenario 3 and (b) the remaining misfit between the inverted geological model and geophysical data. Misfit values after regional
trend effects were removed using a linear solver. Red represents density which exceeds that required by observed gravity, and blue represents
density lower than that required by observed gravity. Note the large region of the misfit outlined by the dashed white line that indicates the
position of where a portion of high-density material needs to be added to reduce the misfit. The cause of this misfit is considered to be in
response to the modelled sedimentary basin rocks being too thick and not hosting the required volume of mafic material.
ation of the calculated gravity response to the observed grav-
ity response. Nonetheless, it indicates that a thicker portion
of the Yerrida Basin probably exists here, and it is just that
the thickness is difficult to determine geophysically without
guidance in the form of detailed sedimentological analysis.
5.3 Distinguishing mafic rocks using chemical
composition
Geophysical inversion has been useful in revising the ex-
tent of mafic rocks in the Yerrida Basin. What geophysics
cannot do with our current dataset is determine whether the
interpreted mafic rocks all belong to the Killara Formation
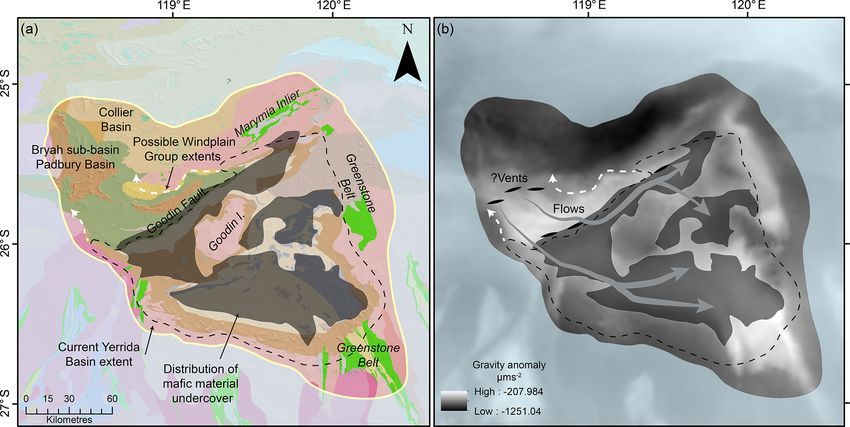
Figure 13. Comparison of mafic units at depth with mapped Killara or whether the mafic rocks have different compositions and
Formation. Mafic units are colour coded to help differentiate bodies thus reveal a more complex stratigraphy. The major and trace
added during scenarios 2 and 3. Check marks on the x axis are at chemical composition of whole rock samples has been ob-
50 km intervals, y axis at 20 km intervals, and z axis at 10 km. tained from drill core (THD001, DGDD347 and the GSWA
WACHEM geochemistry database), surface samples (Uni-
versity of Western Australia field work and WACHEM) with
pretation of Hackney (2004), who suggests the Yerrida Basin analysis and compilation by Olierook et al. (2018) to help us
deepens and extends under the Bryah–Padbury Basin to the achieve this aim.
north. Here the higher-density material could be part of the DGDD347 is close to the northern boundary of the Yerrida
Killara Formation or a substantial part of the mafic compo- Basin (Fig. 1) and samples rocks from both the Bryah and
nent of the Juderina Formation. Figure 14b also shows the Yerrida basins. Thus, we were able to use these samples to
Juderina Formation to be thick (> 10 km and up to 20 km off- establish whether any of the mafic rocks sampled in the Jud-
section) with deeper parts to the north-east. A thickness of erina Formation are sills or dykes related to the Narracoota
20 km is implausible given the thickness estimates of Pirajno Formation. Figure 15a shows the geochemical distribution of
and Adamides (2000). The incorrect estimate is likely due to mafic rocks sampled from the Yerrida and Bryah–Padbury
a combination of artefacts resulting from inversion and the basins on a basaltic Th/Yb versus Nb/Yb diagram (Pearce,
presence of thick (∼ 7 km) and dense Narracoota Formation 2014). This type of diagram is used to recognize sources of
rocks (Pirajno et al., 1998) hosted in the hanging wall of the magma to provide insight into the tectonic setting that gener-
Goodin Fault to the north-west interfering with the reconcili- ated them, with higher Th/Yb representing lavas modified by
Solid Earth, 11, 1053–1077, 2020 https://doi.org/10.5194/se-11-1053-2020You can also read