Characteristics, primary sources and secondary formation of water-soluble organic aerosols in downtown Beijing - Recent
←
→
Page content transcription
If your browser does not render page correctly, please read the page content below
Atmos. Chem. Phys., 21, 1775–1796, 2021
https://doi.org/10.5194/acp-21-1775-2021
© Author(s) 2021. This work is distributed under
the Creative Commons Attribution 4.0 License.

Characteristics, primary sources and secondary formation of
water-soluble organic aerosols in downtown Beijing
Qing Yu1,2 , Jing Chen1,2 , Weihua Qin1,2 , Siming Cheng1,2 , Yuepeng Zhang1,2 , Yuewei Sun1,2 , Ke Xin1,2 , and
Mushtaq Ahmad1,2
1 StateKey Joint Laboratory of Environment Simulation and Pollution Control, School of Environment,
Beijing Normal University, Beijing 100875, China
2 Center of Atmospheric Environmental Studies, Beijing Normal University, Beijing 100875, China

Correspondence: Jing Chen (jingchen@bnu.edu.cn)

Received: 17 July 2020 – Discussion started: 10 August 2020
Revised: 19 December 2020 – Accepted: 29 December 2020 – Published: 9 February 2021

Abstract. Water-soluble organic carbon (WSOC) accounts           SOC were also investigated. The acid-catalyzed heteroge-
for a large proportion of aerosols and plays a critical role     neous or aqueous-phase oxidation appeared to dominate in
in various atmospheric chemical processes. In order to in-       the SOC formation during the sampling period in winter,
vestigate the primary sources and secondary production of        while the photochemical oxidation played a more critical role
WSOC in downtown Beijing, day and night fine particulate         during the sampling period in summer. Moreover, photooxi-
matter (PM2.5 ) samples in January (winter), April (spring),     dation played a more critical role in the formation of moder-
July (summer) and October (autumn) 2017 were collected           ately hydrophilic SOC, while the heterogeneous or aqueous-
and analyzed for WSOC and organic tracers in this study.         phase reactions had more vital effects on the formation of
WSOC was dominated by its moderately hydrophilic fraction        strongly hydrophilic SOC.
and showed the highest concentration in January and compa-
rable levels in April, July and October 2017. Some typical
organic tracers were chosen to evaluate the emission strength
and secondary formation of WSOC. Seasonal variation of the       1   Introduction
organic tracers suggested significantly enhanced formation
of anthropogenic secondary organic aerosols (SOAs) during        Organic compounds account for a considerable fraction
the sampling period in winter and obviously elevated bio-        (20 %–60 %) of atmospheric aerosols (Huang et al., 2014;
genic SOA formation during the sampling period in sum-           Zhang et al., 2020), and water-soluble organic carbon
mer. These organic tracers were applied into a positive matrix   (WSOC) generally composes 30 %–70 % of organic carbon
factorization (PMF) model to calculate the source contribu-      (OC) (Zhang et al., 2018; Yang et al., 2019; Chen et al.,
tions of WSOC as well as its moderately and strongly hy-         2020). WSOC in aerosols is active in light adsorption (Yan et
drophilic portions. The secondary sources contributed more       al., 2015; Geng et al., 2020) and thus may make a significant
than 50 % to WSOC, with higher contributions during the          impact on radiative forcing and global climate change (An-
sampling periods in summer (75.1 %) and winter (67.4 %),         dreae and Gelencser, 2006). Meanwhile, the photoexcitation
and the largest contributor was aromatic SOC. In addition,       of water-soluble brown carbon (BrC) can generate oxidants
source apportionment results under different pollution lev-      in aerosols and cloud/fog droplets (Manfrin et al., 2019; Kaur
els suggested that controlling biomass burning and aromatic      et al., 2019), which can promote atmospheric chemical re-
precursors would be effective to reduce WSOC during the          actions and aging processes of organic aerosols. Overall,
haze episodes in cold seasons. The impact factors for the for-   WSOC is widely involved in cloud processes and heteroge-
mation of different SOA tracers and total secondary organic      neous reactions due to its surface activity and water solubility
carbon (SOC) as well as moderately and strongly hydrophilic      (Ervens et al., 2011; George et al., 2015), thus playing a sig-
                                                                 nificant role in severe haze episodes (Cheng et al., 2015; Wu

Published by Copernicus Publications on behalf of the European Geosciences Union.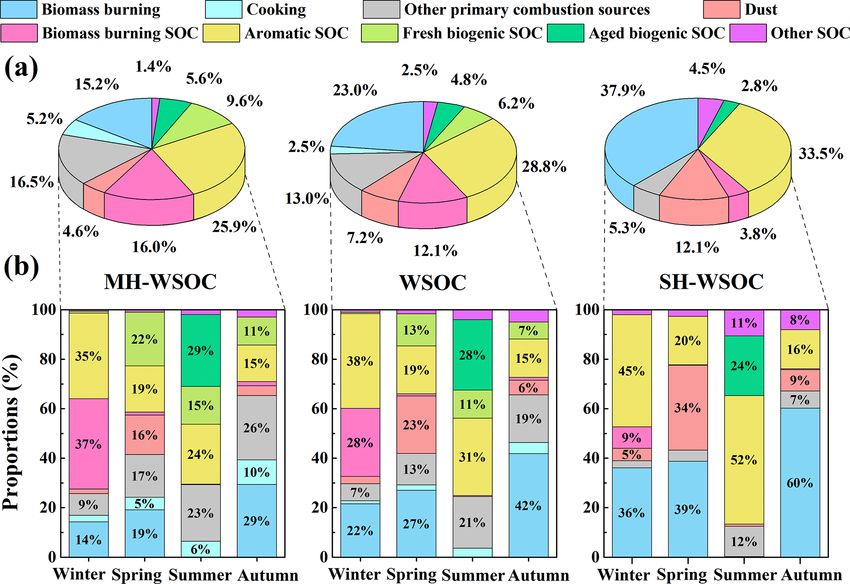
1776                          Q. Yu et al.: Primary sources and secondary formation of WSOC in PM2.5 in Beijing, China

et al., 2019; Ma et al., 2020). Additionally, WSOC is closely        specific SOA precursors, some recent studies introduced the
linked to the oxidative potential of aerosols, posing adverse        SOA tracers into the PMF model to investigate the secondary
health outcomes (Verma et al., 2012; Chen et al., 2019; Wang         sources of organic aerosols (Kang et al., 2018a, b; Geng et
et al., 2020). Therefore, it is of great significance to study the   al., 2020).
characteristics, primary sources and secondary production of            Previous studies have suggested that coal combustion
WSOC in atmospheric particulate matter.                              (Zhang et al., 2018; Li et al., 2019a, b), traffic emissions
   Based on solid-phase extraction (SPE) by the Oasis HLB            (Kawamura and Kaplan, 1987; Li et al., 2019b), residual
column, WSOC can be divided into the moderately hy-                  oil combustion (Kuang et al., 2015), cooking (Qiu et al.,
drophilic fraction and strongly hydrophilic fraction (Varga          2020), soil dust and sea salts (Huang et al., 2006) can all
et al., 2001; Kiss et al., 2002). The moderately hydrophilic         contribute to WSOC. However, it is most commonly recog-
fraction of WSOC mainly consists of humic-like substances            nized that WSOC mainly derives from biomass burning and
(HULIS), which are an unresolved mixture of polycyclic               SOA (Ding et al., 2008; Feng et al., 2013; Du et al., 2014;
ring structures with substituted hydroxyl, carboxyl, carbonyl,       Zhang et al., 2018). For example, Du et al. (2014) suggested
methoxy and ester groups (Kiss et al., 2002; Lin et al., 2010;       that SOA, biomass burning and other primary combustion
Fan et al., 2012). In addition, some smaller molecules with          sources contributed about 54 %, 40 % and 6 % respectively
well-defined structures, such as phthalic acid and suberic           to WSOC in Beijing during 2010–2011. Zhang et al. (2018)
acid, may also constitute a minor portion of the moder-              also indicated that the sum of biomass burning and SOA
ately hydrophilic fraction of WSOC (Lin et al., 2010).               contributed more than 80 % to WSOC in Beijing, Shanghai,
The strongly hydrophilic fraction mainly consists of low-            Guangzhou and Xi’an in the wintertime of 2013. In recent
molecular-weight organic acids (such as oxalic acid, succinic        years, the adjustment of energy and industrial structures as
acid and malic acid) and anhydrosugars (such as levoglu-             well as the effective control of open burning activities in the
cosan, xylose and sucrose) (Lin et al., 2010). Previous studies      surrounding areas of Beijing have had a significant impact
have revealed that the moderately and strongly hydrophilic           on the source emissions. The average fine particulate matter
fractions of WSOC show significantly different intrinsic ox-         (PM2.5 ) concentration in Beijing has been greatly reduced
idative potentials, thus posing different effects on human           from 89.5 µg m−3 in 2013 to 58.0 µg m−3 in 2017 since the
health (Verma et al., 2012, 2015; Yu et al., 2018). How-             implementation of the Action Plan of Air Pollution Preven-
ever, source contributions of the moderately and strongly hy-        tion and Control in 2013 (Cheng et al., 2019). Meanwhile,
drophilic WSOC were scarcely investigated and compared in            it has been reported that the oxidant concentrations were en-
previous research.                                                   hanced accompanying the decrease of the PM2.5 level, which
   So far, the most widely used source apportionment ap-             might promote the SOA formation (Feng et al., 2019). Con-
proaches of organic aerosols have included the chemical              sequently, the sources and composition of WSOC in Beijing
mass balance (CMB) model coupled with a tracer-yield                 may show significant changes due to the control policies and
method (Guo et al., 2012; Islam et al., 2020) and a method           enhanced atmospheric oxidizing capacity in the surrounding
combining aerosol mass spectrometry with positive matrix             areas in recent years. Therefore, it is necessary to compare
factorization (AMS-PMF) (Hu et al., 2017; Sun et al., 2018;          the source contributions of WSOC with those in the previous
Shen et al., 2019). The CMB model is used to quantify the            studies.
primary sources of organic aerosols, while the tracer-yield             A large fraction of WSOC is formed in the atmosphere,
method is applied to calculate the contributions of secondary        and WSOC greatly overlaps with SOA (Zhang et al., 2018).
sources. However, the CMB model requires local source pro-           Because most of the organic aerosols remain unidentified
files, and the tracer-yield experiments conducted under sim-         at a molecular level, it is difficult to thoroughly understand
ple chamber conditions usually ignore cloud and aqueous-             the formation mechanisms of secondary WSOC or SOA. An
phase processes, leading to large uncertainties when apply-          effective approach to explore the formation mechanisms of
ing these results to the real atmosphere (Kleindienst et al.,        SOA is to classify SOA into several categories based on
2007; Feng et al., 2013). The AMS-PMF method is based on             their specific properties. For example, the formation mech-
the PMF analysis for the mass spectral of organic aerosols,          anisms of secondary organic carbon (SOC) in the moder-
which is usually a big dataset since online AMS has a high           ately and strongly hydrophilic fractions of WSOC may dif-
time resolution. However, online AMS can not differentiate           fer from each other due to their different water solubility in
WSOC from water-insoluble OC, not to mention the moder-              the cloud droplets or the aqueous phase of aerosols. Further-
ately hydrophilic and strongly hydrophilic WSOC. Further,            more, the formation mechanisms may also be different for
the AMS-PMF method typically classifies secondary organic            SOA from different precursors, which originate from various
aerosols (SOAs) into two categories, the less oxidized oxy-          sources and show disparate chemical structures and proper-
genated organic aerosols (LO-OOAs) and the more oxidized             ties (Sun et al., 2016; Cheng et al., 2018). While gas-phase
oxygenated organic aerosols (MO-OOAs), and it is unable              photooxidation of volatile organic compounds (VOCs) is an
to distinguish SOA from different precursors or sources in           important formation pathway of SOA, direct observations
most cases. To raise effective control measures targeting the        have proved that the aqueous-phase reactions of VOCs from

Atmos. Chem. Phys., 21, 1775–1796, 2021                                               https://doi.org/10.5194/acp-21-1775-2021
Q. Yu et al.: Primary sources and secondary formation of WSOC in PM2.5 in Beijing, China                                 1777

biomass burning contribute remarkably to SOA formation           pre-baked at above 500 ◦ C for at least 4 h before sampling.
(Gilardoni et al., 2016). In this regard, SOA tracers can pro-   Before and after sample collections, the quartz filters were
vide implications for, though may not fully represent, the       weighed by an analytical balance three times after stabilizing
formation mechanism of SOA from corresponding precur-            under conditions of fixed temperature (20±1 ◦ C) and humid-
sors. In addition, in recent years, haze episodes have still     ity (40 ± 2 %) for 24 h. After that, the sampled filters were
occurred frequently in Beijing in cold seasons. The humid        stored under dark conditions below −20◦ until they were an-
meteorological conditions as well as the high concentrations     alyzed.
of VOC precursors and HONO during haze episodes may
have a unique effect on the formation of some secondary          2.2   Chemical analysis
components in WSOC (Xing et al., 2019; Yang et al., 2019;
Zhang et al., 2019). Previous research found that haze events    To measure the values of OC and elemental carbon (EC),
were usually accompanied with an elevated WSOC / OC ra-          a part (0.296 cm2 ) of each filter was detected using a
tio (Cheng et al., 2015; Yang et al., 2019) and enhanced SOA     DRI 2001A carbon analyzer with thermal/optical reflectance
production (Huang et al., 2014; Xing et al., 2019). Compar-      (TOR) protocol. The analysis of WSOC and water-soluble
ing source contributions of WSOC under different pollution       ions followed the same procedure as in our previous research
levels would help to better understand the complex properties    (Chen et al., 2014), and the details can be found in the Sup-
of WSOC and put forth effective control measures to reduce       plement (Sect. S2-1).
WSOC during haze events.                                            WSOC was further divided into its moderately and
   In this work, the 12 h day and night PM2.5 samples in         strongly hydrophilic fractions by solid-phase extraction
Beijing in January, April, July and October 2017 were col-       (SPE). The moderately hydrophilic fraction of WSOC (MH-
lected and analyzed for WSOC and organic tracers. The            WSOC) was directly measured by the following procedure.
characteristics of WSOC and the selected organic tracers         Briefly, a punch of the sampled filter was shredded into tiny
were investigated, and the contributions of primary and sec-     pieces and extracted using 20 mL ultrapure water for a du-
ondary sources to WSOC and its moderately and strongly           ration of 30 min and then filtrated via a 0.45 µm PTFE filter.
hydrophilic fractions were quantified. The key influencing       The extract was acidified to pH = 2.0 with HCl (1 mol L−1 ),
factors for the formation of different SOA tracers, the mod-     then passed through a SPE cartridge (Oasis HLB, 30 µm, Wa-
erately hydrophilic SOC and strongly hydrophilic SOC were        ters). After that, the SPE column was rinsed with 3 mL water,
explored and compared, so as to gain insights into the possi-    then eluted with 1.5 mL MeOH (containing 3 % NH3 ) three
ble formation mechanism of different types of SOA.               times. The eluent was blown to dryness and redissolved in
                                                                 20 mL ultrapure water and measured by a total organic car-
                                                                 bon (TOC) analyzer (Shimadzu TOC-L CPN). The strongly
2     Experimental                                               hydrophilic fraction of WSOC (SH-WSOC) was calculated
                                                                 as the total WSOC minus the moderately hydrophilic WSOC.
2.1    Sampling                                                     Seven organic tracers, including levoglucosan, choles-
                                                                 terol, 4-methyl-5-nitrocatechol, phthalic acid (Ph), 2-
Field sampling was performed on the roof of a 20 m high          methylerythritol, 3-hydroxyglutaric acid and cis-pinonic acid
building on the campus of Beijing Normal University in           (details shown in Sect. 3.2), were analyzed for each sample
downtown Beijing, which is considered to be a represen-          in this study. A punch of each filter was ultrasonically ex-
tative urban site. Fine particulate matter (PM2.5 ) was sam-     tracted twice in 10 mL MeOH for 20 min (below 20◦ ). The
pled in four seasons of 2017 using a high-volume sam-            combined extracts were filtrated, concentrated and stored
pler (TH-1000C, Wuhan Tianhong Instruments Co. Ltd,              in a dark place at −20 ◦ C until further derivation. After-
China) equipped with an PM2.5 impactor at a flow rate of         wards, the concentrates were blown to complete dryness with
1.05 m3 min−1 . The potential sampling error is discussed and    gentle ultrapure nitrogen (N2 ), then redissolved in 100 µL
estimated in the Supplement (Sect. S1). The sampling peri-       pyridine and reacted with 200 µL silylating reagent (BSTFA
ods included 2–16 January, 7–23 April, 3–18 July and 12–         with 1 % TMCS) at 75 ◦ C for 70 min. After being cooled
28 October in winter, spring, summer and autumn of 2017,         down to room temperature, the derivative products were di-
respectively. Sampling was conducted during 08:00–19:30          luted with n-hexane and immediately analyzed using gas
in the daytime and during 20:00–07:30 at night. A total of       chromatography–tandem mass spectrometry (GC/MS/MS;
124 effective PM2.5 samples were obtained in this study. The     Shimadzu TQ 8040) equipped with a JA-5MS column. The
field blank samples were collected before and after each sam-    detailed parameter settings of GC/MS/MS can be found in
pling period, and a total of eight field blank samples were      the Supplement (Sect. S2-2). The authentic standards (Ta-
obtained. The blank filters were put on the filter holder of     ble S2 in the Supplement) were dissolved in anhydrous pyri-
PM2.5 sampler without pumping for 1 min, then stored and         dine and diluted to five to seven different concentrations.
analyzed together with the ambient samples. All the samples      Then 100 µL of the standard solutions was reacted with
were gathered on the quartz filters (PALLFLEX) which were        200 µL silylating reagent (BSTFA: TMCS = 99 : 1) at 75 ◦ C

https://doi.org/10.5194/acp-21-1775-2021                                         Atmos. Chem. Phys., 21, 1775–1796, 2021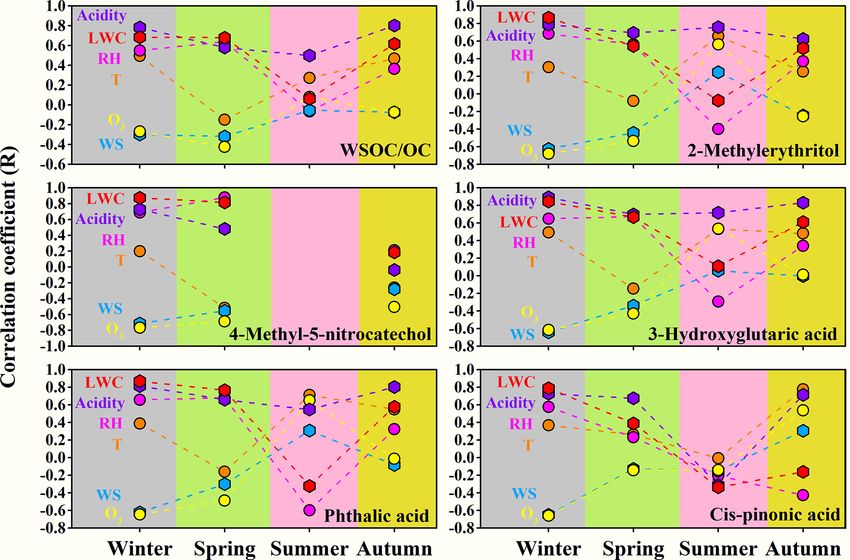
1778                         Q. Yu et al.: Primary sources and secondary formation of WSOC in PM2.5 in Beijing, China

for a duration of 70 min. After being cooled down to ambi-         O3 and CO were obtained from a nearby urban air monitor-
ent temperature, these solutions containing derivative prod-       ing station (3.4 km from the sampling site) via the website at
ucts were diluted to 1 mL with n-hexane and measured by            http://www.bjmemc.com.cn (last access: 4 February 2021).
GC/MS/MS right before the analysis of ambient samples.             These data were transformed to 12 h averages corresponding
The R 2 values of the derivative products were all above 0.99,     to the sampling time.
indicating good linearities of these standard curves.                 The liquid water content (LWC) in inorganic aerosols was
   To ensure quality of the measurement, the recovery rates        calculated by the ISORROPIA-II model (Fountoukis and
were determined together with ambient samples, by mea-             Nenes, 2007), and the reverse mode was chosen in this study
suring the authentic standards (Table S2) spiked onto the          since the concentrations of gaseous pollutants such as HCl,
pre-combusted quartz filters. The recovery rates were all in       HNO3 and NH3 were not available here. The total aerosol
the range of 70 %–110 %, and the relative standard devia-          LWC was the summation of the water in both water-soluble
tions (RSDs) were all below 15 %. Additionally, since two          ions and organic species, and the latter was calculated by the
field blank samples were obtained during each sampling pe-         approach described by Cheng et al. (2016). To estimate the
riod, the average concentrations of the targeted compounds         aerosol acidity, the approximate value of aerosol pH (pHF )
on these two field blanks were used for the correction in          was also estimated by the ISORROPIA-II model (Pye et al.,
the corresponding season. The concentrations of the targeted       2020). The molality of H+ (mH+ ), which was calculated by
compounds on the field blanks were all close to zero. The          mH+ = 10−pHF , was used for the correlation analysis.
reported concentrations of the targeted compounds were the            The OC emission amounts from open biomass burning
measured concentrations on each ambient sample minus the           over the sampling periods in the four seasons of 2017 were
average concentration on the two field blank samples.              obtained from the Fire Inventory (FINNv1.5), which pro-
                                                                   vides daily estimates of the OC emissions from wildfire
2.3    PMF source apportionment                                    and agricultural fires with a resolution of 1 km (Wiedin-
                                                                   myer et al., 2011). These emission data were processed
The positive matrix factorization (PMF) model is an effec-         by the fire_emis utility provided at https://www.acom.ucar.
tive multivariate factor analysis tool which can decompose         edu/Data/fire/ (last access: 4 February 2021). The values of
a matrix of speciated sample data (X) into two matrices:           OC emissions in the Beijing–Tianjin–Hebei region were ex-
source contributions (G) and source profiles (F ) (Norris et       tracted using a geographic information system (GIS).
al., 2014). In this study, PMF 5.0 was applied for the source
apportionment of WSOC in PM2.5 during the sampling pe-
riods in four seasons of 2017 with a total of 124 samples. A       3     Results and discussion
total of 17 species were input into the PMF model, includ-
                                                                   3.1    Temporal trends of carbonaceous species
ing WSOC, MH-WSOC, SH-WSOC, elemental carbon, sul-
fate, nitrate, oxalate, ammonium, magnesium, calcium and           The temporal variations of WSOC, OC, EC and PM2.5 during
seven organic tracers. The PMF model was run repeatedly            the sampling periods in the four seasons of 2017 are shown
by changing the number of factors, and the derived solu-           in Fig. 1, and their average concentrations are summarized in
tions were compared. The base solution was selected based          Table 1. In general, the carbonaceous species showed similar
on (1) the interpretability of the factor profiles and tempo-      variation trends with the trend of PM2.5 throughout the whole
ral variations of source contributions; (2) the reconstruction     sampling period, which approximately varied in the periodic
of the total variable and the R 2 of the input organic tracers     cycles of 2 to 7 d (Guo et al., 2014). The average values of
(R 2 > 0.90); and (3) the scaled residuals of the input species.   WSOC, OC, EC and PM2.5 in January were all much higher
Afterwards, the selected base solution was subjected to the        than those during the sampling periods in other seasons. The
displacement (DISP) and bootstrap (BS) tests for error esti-       mean levels of OC, EC and PM2.5 were in the descending
mation. To reduce the variability of the base solution, some       order of October > April > July, while WSOC showed com-
constraints were defined based on the a priori information on      parable levels over the sampling periods in these three sea-
the sources (Norris et al., 2014; Paatero et al., 2014; Bozzetti   sons. The fact that WSOC exhibited mild temporal variation
et al., 2017). The detailed information about the uncertainty      with no sudden increase in October implied that short-term
calculation for the input data, the selection criteria for the     outdoor biomass burning after the harvest season in the sur-
optimal solution, the diagnostics and the error estimates are      rounding areas of Beijing was well controlled over the sam-
provided in the Supplement (Sect. S3).                             pling period in autumn. As shown in Table S5, the OC con-
                                                                   centration in PM2.5 in Beijing exhibited an overall declining
2.4    Other data collection and calculations                      trend in the past 10 years, but the WSOC level showed no ob-
                                                                   vious change. Therefore, the control of WSOC seemed to be
During the sampling periods, the meteorological parameters         more challenging compared to the control of water-insoluble
were simultaneously monitored using a HOBO meteorologi-            organic aerosols.
cal station at our sampling site. The hourly concentrations of

Atmos. Chem. Phys., 21, 1775–1796, 2021                                              https://doi.org/10.5194/acp-21-1775-2021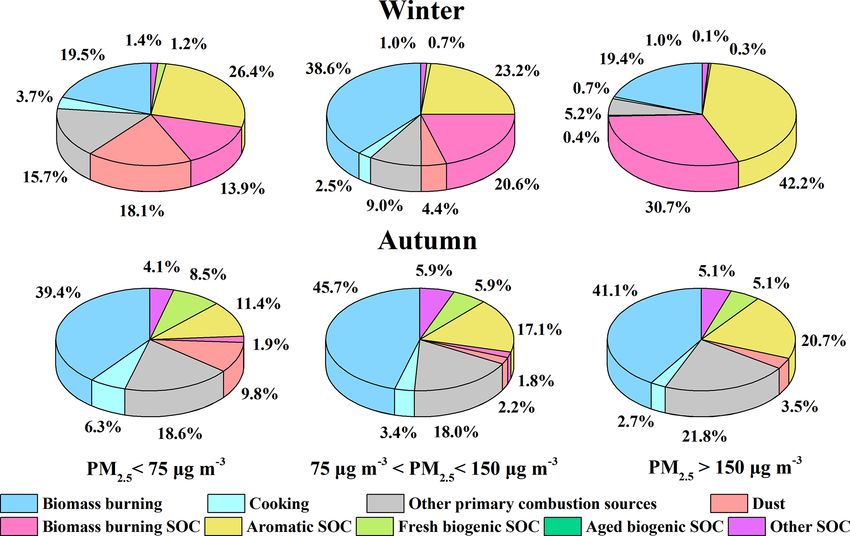
Q. Yu et al.: Primary sources and secondary formation of WSOC in PM2.5 in Beijing, China 1779
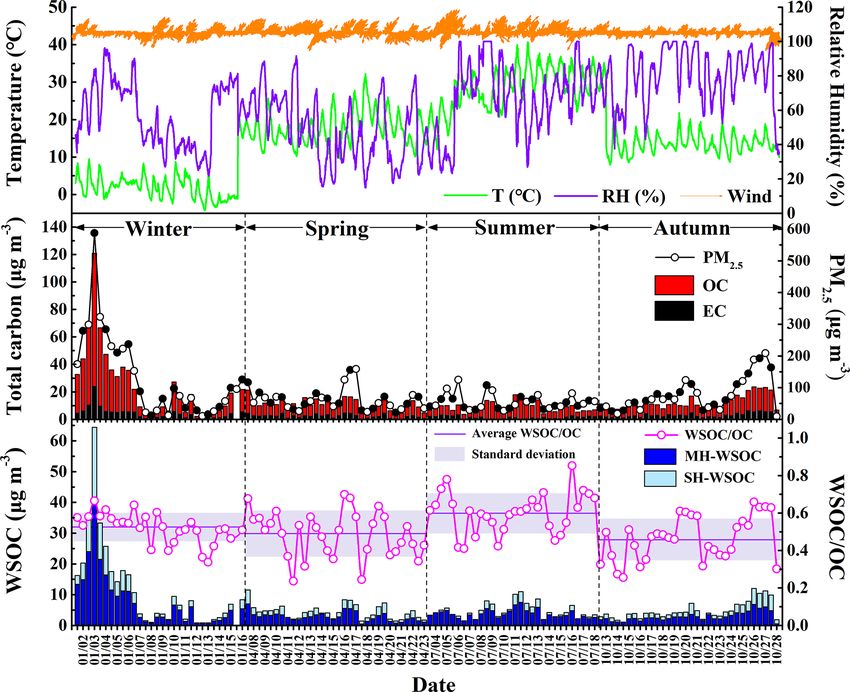
Figure 1. Temporal variations of meteorological parameters, the mass concentrations of PM2.5 , OC, EC, WSOC and WSOC / OC ratio in
Beijing during the sampling periods in the four seasons of 2017.
The temporal variation of the WSOC / OC ratio is also il- 3.2 Characteristics of organic tracers
lustrated in Fig. 1. WSOC / OC exhibited the highest aver-
age value during the sampling period in summer, followed 3.2.1 Seasonal variations and diurnal patterns
by that in winter. The range of WSOC / OC in this study was
similar to that previously reported in urban Beijing (Zhao et The average concentrations of the organic tracers identified
al., 2018; Yang et al., 2019). Previous studies showed that in this study are summarized in Table 1. Levoglucosan is a
the aggravation of PM2.5 pollution was usually accompanied tracer for biomass burning, while cholesterol is a good indi-
by the elevated WSOC / OC ratio (Cheng et al., 2015; Yang cator of cooking, and both of them are known as primary
et al., 2019), which was also confirmed by the significant organic tracers. Previous studies have shown that phthalic
positive correlations between PM2.5 and the WSOC / OC ra- acid can be used as an aromatic SOA tracer (Al-Naiema
tio during the sampling periods in the four seasons (winter: and Stone, 2017; Huang et al., 2019), while 4-methyl-5-
r = 0.68, p < 0.01; spring: r = 0.61, p < 0.01; summer: r = nitrocatechol can be used as a tracer for biomass burning
0.36, p < 0.05; autumn: r = 0.91, p < 0.01) in this study, SOA (Iinuma et al., 2010; Bertrand et al., 2018; Srivastava
again underlining the important role of WSOC during the et al., 2018), and both of them serve as anthropogenic SOA
haze evolution process. In this work, WSOC was further di- tracers. The biogenic SOA tracers in this study included
vided into its moderately and strongly hydrophilic fractions. the isoprene SOA tracer 2-methylerythritol, as well as cis-
As listed in Table 1, the moderately hydrophilic WSOC dom- pinonic acid and 3-hydroxyglutaric acid, which are lower
inated in the total WSOC throughout the sampling period and and higher generation oxidative products of monoterpenes
showed the highest proportion in July (0.84), followed by respectively (Kourtchev et al., 2009). To correct for the dif-
January (0.73), higher than the results previously reported in ferent atmospheric diffusion conditions and better discuss
Beijing (Li et al., 2019a; Huang et al., 2020). In addition, the the differences in emission strengths or secondary production
ratio of the strongly hydrophilic WSOC to the total WSOC rates in the four seasons, the concentrations of the identified
showed significant positive correlations with PM2.5 in Jan- organic tracers were divided by the level of carbon monox-
uary (r = 0.58, p < 0.01), July (r = 0.48, p < 0.05) and Oc- ide (CO), which has a relatively constant emission rate and is
tober (r = 0.44, p < 0.05). inert to chemical reactions. The CO-scaled concentration of
these organic tracers during the sampling periods in the four
seasons is presented in Fig. 2a, and the day-to-night ratios
https://doi.org/10.5194/acp-21-1775-2021 Atmos. Chem. Phys., 21, 1775–1796, 2021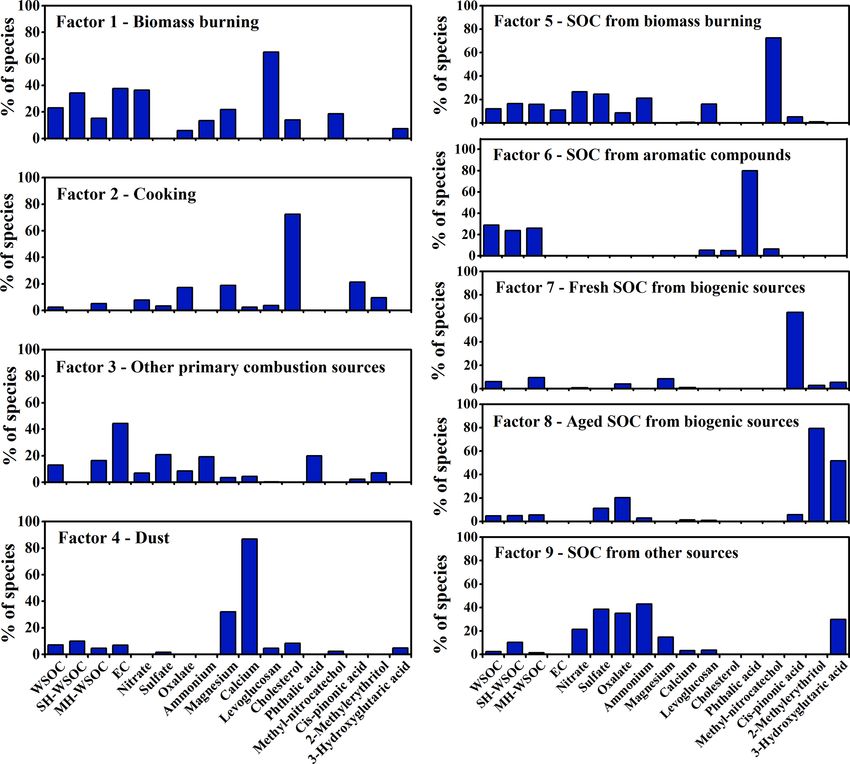
1780 Q. Yu et al.: Primary sources and secondary formation of WSOC in PM2.5 in Beijing, China
of the measured concentrations of these organic tracers (not
∗ According to the paired t test, the values with ∗ showed statistically significant differences (p < 0.05) between the day and night.
Table 1. The average concentrations and standard deviations of the identified carbonaceous species in PM2.5 during the sampling periods in the four seasons.
cis-Pinonic acid
3-Hydroxyglutaric acid
2-Methylerythritol
4-Methyl-5-nitrocatechol
Phthalic acid
Cholesterol
Levoglucosan
Organic tracers (ng m−3 )
SH-WSOC
MH-WSOC
WSOC / OC
WSOC
OC/EC
EC
OC
PM2.5
CO
Compounds (µg m−3 )
normalized by CO) are shown in Fig. 2b.
Primary organic tracers
The average CO-scaled concentration of levoglucosan in July
was much lower than that during the study periods in the
other three seasons (only 15.4 % of that in January), suggest-
24.7 ± 26.4
88.7 ± 84.8
0.53 ± 0.08
11.4 ± 11.3
20.1 ± 19.2
307 ± 300
120 ± 107
3.3 ± 2.4
4.4 ± 3.9
2.1 ± 2.3
5.0 ± 3.0
3.2 ± 3.8
7.9 ± 7.6
4.6 ± 1.1
3.9 ± 3.1
1.7 ± 1.7
ing that biomass burning might not be active during the study
Daytime
period in summer, similar to the findings in previous studies
(Sun et al., 2018; Duan et al., 2020). The result of the analy-
sis of variance (ANOVA) indicated that levoglucosan exhib-
35.2 ± 41.0
0.51 ± 0.08
12.0 ± 16.4
21.0 ± 24.8
90.8 ± 121
8.0 ± 10.3
388 ± 394
147 ± 154
Nighttime
3.0 ± 2.1
4.2 ± 5.0
2.2 ± 3.5
4.9 ± 3.3
4.0 ± 6.1
4.3 ± 1.3
4.7 ± 5.8
2.2 ± 2.8
Winter
ited similar CO-scaled concentrations in January, April and
October (p > 0.05). As shown in Fig. 2c, the OC emissions
from open biomass burning in the Beijing–Tianjin–Hebei re-
30.1 ± 34.5
0.52 ± 0.08
11.7 ± 13.9
20.6 ± 21.9
89.8 ± 103
gion (provided by the FINN inventory) were 302 Mg (Jan-
349 ± 348
133 ± 131
3.2 ± 2.2
4.3 ± 4.5
2.2 ± 2.9
4.9 ± 3.1
3.6 ± 5.0
8.0 ± 8.9
4.5 ± 1.2
4.3 ± 4.6
1.9 ± 2.3
uary), 1557 Mg (April), 1818 Mg (July) and 501 Mg (Oc-
Mean
tober), respectively, completely different from the seasonal
trend of levoglucosan, suggesting that open biomass burn-
100 ± 87.8∗
27.3 ± 20.8
0.50 ± 0.10
60.6 ± 36.2
ing was not the major type of biomass burning in Beijing.
9.0 ± 6.0∗
1.9 ± 1.1∗
0.6 ± 0.4∗
4.2 ± 2.8
1.2 ± 0.6
1.8 ± 1.9
3.9 ± 1.9
1.3 ± 0.9
2.8 ± 1.3
4.1 ± 2.0
5.2 ± 2.1
7.9 ± 2.6
Daytime
Previous research indicated that residential biofuel combus-
tion might be the main source of levoglucosan in Beijing,
and the residential coal burning might also contribute a mi-
21.9 ± 14.0
0.47 ± 0.14
64.5 ± 34.8
194 ± 175∗
6.9 ± 3.6∗
0.8 ± 0.4∗
2.7 ± 1.4∗
Nighttime
nor fraction of levoglucosan in winter (Yan et al., 2018). The
4.9 ± 5.1
1.5 ± 0.8
3.3 ± 2.7
4.8 ± 2.5
1.8 ± 1.1
2.9 ± 1.6
4.7 ± 2.6
4.4 ± 2.5
9.5 ± 3.4
Spring
CO-scaled concentration of cholesterol during the study peri-
ods in spring and autumn was significantly higher (ANOVA,
p < 0.05) than that in winter and summer. Some previous re-
24.6 ± 17.7
0.49 ± 0.12
62.5 ± 34.9
147 ± 144
7.9 ± 5.0
4.6 ± 4.0
1.4 ± 0.7
2.6 ± 2.4
4.3 ± 2.3
1.6 ± 1.0
2.9 ± 1.5
4.4 ± 2.3
4.8 ± 2.3
2.3 ± 1.3
8.7 ± 3.1
0.7 ± 0.4
search found that both regular cooking emissions and open
Mean
barbecues might influence the organic aerosols in Beijing
(W. Q. Xu et al., 2015). The enhanced CO-scaled concentra-
37.1 ± 22.7∗
55.9 ± 22.0∗
tions of cholesterol in spring and autumn were perhaps due
55.4 ± 48.5
23.6 ± 11.0
0.62 ± 0.11
59.8 ± 28.6
1.2 ± 1.0∗
5.3 ± 2.1∗
8.7 ± 3.4∗
7.3 ± 4.2
0.1 ± 0.3
4.1 ± 2.4
4.1 ± 1.2
6.7 ± 3.9
1.4 ± 1.0
1.1 ± 0.4
to the increased open barbecues in spring and autumn when
Daytime
the weather was mild.
Anthropogenic SOA tracers
27.3 ± 18.5∗
41.6 ± 34.6
34.2 ± 24.2
0.59 ± 0.10
51.9 ± 20.6
17.6 ± 9.1∗
Summer
10.1 ± 6.0
0.7 ± 1.1∗
4.0 ± 2.7∗
6.8 ± 4.3∗
Nighttime
0.0 ± 0.0
3.0 ± 1.1
3.4 ± 1.6
5.3 ± 4.2
1.3 ± 1.0
0.9 ± 0.2
Phthalic acid showed the highest CO-scaled concentration
in January, followed by July. The highest phthalic acid over
the study period in winter might be due to stronger aromatic
32.2 ± 20.9
48.5 ± 42.0
36.8 ± 25.5
28.9 ± 19.3
0.60 ± 0.11
55.8 ± 24.8
8.7 ± 5.3
0.1 ± 0.2
3.6 ± 1.9
1.0 ± 1.1
3.8 ± 1.5
4.7 ± 2.5
6.1 ± 4.1
1.3 ± 1.0
7.8 ± 3.9
1.0 ± 0.3
SOA formation. In the previous study, a significant increase
Mean
of toluene-derived SOA in winter was universally observed
in the northern cities of China (Ding et al., 2017). In winter,
27.6 ± 21.8
0.47 ± 0.12
75.2 ± 58.1
136 ± 102∗
the enhanced emissions due to residential heating and the ad-
7.3 ± 3.0∗
1.6 ± 1.2∗
4.4 ± 1.6∗
2.4 ± 1.4∗
1.1 ± 0.4∗
7.5 ± 4.6
2.3 ± 1.1
6.1 ± 4.4
1.8 ± 1.4
2.9 ± 1.6
4.7 ± 3.0
9.4 ± 3.8
Daytime
verse atmospheric diffusion condition led to higher concen-
trations of polycyclic aromatic hydrocarbons (PAHs; Feng
et al., 2018; Sun et al., 2018), thus possibly facilitating the
19.9 ± 13.3
0.46 ± 0.12
81.1 ± 50.8
234 ± 125∗
10.1 ± 3.7
3.6 ± 0.8∗
4.4 ± 3.6∗
3.3 ± 0.9∗
3.4 ± 1.7∗
1.4 ± 0.4∗
PAH-derived SOA formation. Although the concentrations
Autumn
Nighttime
7.0 ± 4.4
2.6 ± 1.2
6.3 ± 3.1
2.0 ± 1.5
2.9 ± 1.3
4.9 ± 2.8
of oxidants were usually lower in winter due to the weak
solar radiation, a previous observation found that the qOH
concentration in Beijing was significantly higher than that
23.8 ± 18.2
0.46 ± 0.12
78.2 ± 53.7
185 ± 123
5.5 ± 2.9
7.2 ± 4.5
2.5 ± 1.1
3.0 ± 3.0
6.2 ± 3.8
1.9 ± 1.4
2.9 ± 1.5
4.8 ± 2.8
3.8 ± 1.4
2.9 ± 1.6
9.7 ± 3.7
1.2 ± 0.4
in New York, Birmingham and Tokyo and was nearly 1 or-
Mean
der of magnitude larger than that predicted by global mod-
els in northern China in winter (Tan et al., 2018). Zhang
et al. (2019) indicated that HONO, which was mainly from
the heterogeneous reactions of NO2 and traffic emissions,
Atmos. Chem. Phys., 21, 1775–1796, 2021 https://doi.org/10.5194/acp-21-1775-2021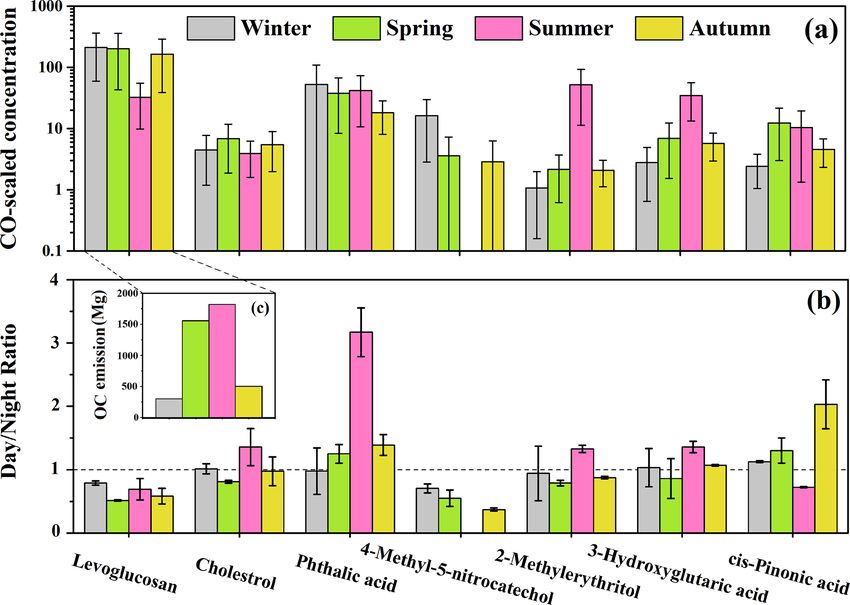
Q. Yu et al.: Primary sources and secondary formation of WSOC in PM2.5 in Beijing, China                                            1781

Figure 2. (a) The CO-scaled concentration of the identified organic tracers. (b) The day-to-night ratios of the measured concentrations of
the organic tracers. (c) The OC emission amounts from open biomass burning provided by the Fire Inventory (FINN) in Beijing during the
sampling periods in the four seasons of 2017.

was the major precursor of OH radicals in winter. Accord-              tions of phthalic acid in the daytime could be attributed to
ing to the WRF-Chem (Weather Research and Forecasting                  stronger secondary formation (Kawamura and Yasui, 2005).
model coupled with Chemistry) simulation, HONO resulted                The day / night ratio of phthalic acid in July was much higher
in a significant enhancement (5–25 µg m−3 ) of SOA forma-              than the ratios in other study periods, which was possibly due
tion (most of which was from the aromatic precursors) dur-             to more prominent effect of photochemical processes on the
ing a haze episode in winter in the Beijing–Tianjin–Hebei              generation of aromatic SOA in summer (Kawamura and Ya-
region (Zhang et al., 2019). In addition, some recent studies          sui, 2005).
suggested that brown-carbon-derived singlet molecular oxy-                4-Methyl-5-nitrocatechol was usually below the detection
gen (1 O∗2 ) in aerosol liquid water could react rapidly with          limit for the summer samples, again indicating that biomass
electron-rich organics such as PAHs, thus facilitating the for-        burning was not active in July. It is notable that the CO-scaled
mation of aromatic SOA (Kaur et al., 2019; Manfrin et al.,             concentrations of 4-methyl-5-nitrocatechol in January were
2019). This process might be more significant during the               much higher than those in April and October, similar to the
sampling period in winter, when the HULIS concentration                result of Kahnt et al. (2013), while the primary emission in-
was much higher than that in other seasons. Furthermore,               tensity of biomass burning was relatively constant during the
the high aerosol LWC during the sampling period in winter              sampling periods in these seasons, as revealed by the sea-
can also promote the heterogeneous or aqueous-phase forma-             sonal distribution pattern of levoglucosan. This phenomenon
tion of aromatic SOA. Except for stronger aromatic SOA for-            can be explained by the following reasons. First of all, the
mation, the enhanced gas-to-particle partitioning of phthalic          adverse atmospheric diffusion condition in winter favored
acid due to low temperature, high relative humidity and high           the accumulation of its precursors such as phenols and NOx
organic aerosol (OA) loadings in winter might also be one of           (Iinuma et al., 2010), thus possibly increasing the formation
the reasons for the highest phthalic acid in January (Huang et         rate of biomass burning SOA. Secondly, the low tempera-
al., 2019). The second highest value of phthalic acid occur-           ture and high aerosol LWC in winter were beneficial for the
ring in July was probably due to high temperature and rela-            partitioning of the gaseous phenols to the aerosol phase (Gi-
tive humidity, strong solar radiation and abundant oxidants in         lardoni et al., 2016). Additionally, the high concentration of
summer, which was favorable for the secondary photochem-               HONO in winter might also contribute to the formation of
ical reactions (Zhao et al., 2018). As presented in Fig. 2b, the       nitrocatechols in the condensed phase (Vidovic et al., 2018;
day-to-night ratio of phthalic acid was obviously higher than          Qu et al., 2019). Hence, the aqueous-phase or heterogeneous
1 in April, July and October. Since the atmospheric diffusion          reactions were enhanced in winter.
condition was worse at night (Table S6), higher concentra-

https://doi.org/10.5194/acp-21-1775-2021                                                 Atmos. Chem. Phys., 21, 1775–1796, 2021
1782                         Q. Yu et al.: Primary sources and secondary formation of WSOC in PM2.5 in Beijing, China

Biogenic SOA tracers                                               increased aerosol LWC could facilitate the partitioning of
                                                                   the gas-phase WSOC to the aerosol phase (Hennigan et al.,
As presented in Fig. 2, 2-methylerythritol and 3-                  2009), resulting in a higher WSOC / OC ratio. No correla-
hydroxyglutaric acid showed extremely high CO-scaled               tions between WSOC / OC and RH or LWC were found in
concentrations in July, followed by April and October, and         July, likely due to enhanced gas-phase photochemical oxida-
showed the minimum concentrations in January. The mean             tion in the formation of SOC in WSOC during the study pe-
concentration of 2-methylerythritol during the study period        riod in summer. In January and October with lower tempera-
in summer was almost 50 times of that in winter. Such              ture, WSOC / OC exhibited significant positive correlations
variations of biogenic SOA tracers indicated much stronger         with temperature (January: r = 0.50, p < 0.01; October: r =
biogenic SOA formation during the sampling period in               0.47, p < 0.01), while in April and July when the weather
summer, which was attributable to the higher emissions of          became warmer, no significant correlations were found be-
biogenic precursors and accelerated photochemical reactions        tween them. Higher temperature in warm seasons might in-
(Shen et al., 2015; Qiu et al., 2020). The day / night ratios of   hibit the gas-to-particle partitioning of semi-volatile or inter-
2-methylerythritol and 3-hydroxyglutaric acid were higher          mediate WSOC and related heterogeneous or aqueous-phase
than 1 in July and significantly higher than those in other        reactions (Qian et al., 2019; Lu et al., 2019), thus counteract-
seasons, indicating that photochemical oxidation played a          ing its promoting effect on the formation of SOC in WSOC.
more significant role in their formation processes during the         The biomass burning SOA tracer, 4-methyl-5-
sampling period in summer. Nevertheless, cis-pinonic acid,         nitrocatechol, showed strong positive relationships with
another monoterpene SOA tracer, showed slightly higher             RH, LWC and aerosol acidity and strong negative rela-
CO-scaled concentration in April than in July (ANOVA,              tionships with the O3 concentration and solar radiation in
p < 0.05). This might be due to the active atmospheric             January and April. The correlations with the above parame-
oxidation processes in summer facilitating the transforma-         ters became weaker in October, and no data were available
tion of cis-pinonic acid to its higher generation oxidation        in July because 4-methyl-5-nitrocatechol was below the
products. Moreover, cis-pinonic acid tends to evaporate            detection limit. The ratio of 4-methyl-5-nitrocatechol to
into the gas phase in summer under high temperature (Li et         OC also showed strong correlations with RH (January:
al., 2013; Ding et al., 2016). Different from the other SOA        r = 0.73, p < 0.01; April: r = 0.86, p < 0.01) and LWC
tracers which showed the highest day / night ratios in July,       (January: r = 0.82, p < 0.01; April: r = 0.75, p < 0.01)
cis-pinonic acid exhibited the lowest day / night ratio during     during the study periods in winter and spring. Laboratory
the study period in summer. This might be also because cis-        studies have revealed that phenolic compounds, which are
pinonic acid was rapidly transformed to its higher generation      massively emitted from biomass burning, could undergo
oxidation products when the photochemical oxidation was            rapid aqueous-phase oxidation and produce substantial
the strongest in the daytime in summer.                            amounts of SOA under either the simulated sunlight (Sun
                                                                   et al., 2010; Li et al., 2014; Yu et al., 2014) or the dark
3.2.2   Influencing factors for the formation of different         conditions (Hartikainen et al., 2018; Vidovic et al., 2018).
        SOA tracers                                                Direct observations have also proved that aqueous-phase
                                                                   reactions of the precursors from biomass burning emissions
Spearman’s correlation analysis was conducted between the          contribute significantly to SOA formation (Gilardoni et al.,
SOA tracers and meteorological parameters, O3 , aerosol            2016). Therefore, the correlation results above, together
acidity and aerosol LWC, and the results are shown in Ta-          with the literature findings, suggested that the acid-catalyzed
ble S7 and Fig. 3. In fact, sometimes all the PM2.5 compo-         heterogeneous or aqueous-phase reactions might play a
nents, even the primary components, can correlate well with        dominant role in the formation of 4-methyl-5-nitrocatechol
RH and LWC (Sun et al., 2013). To solve this problem, the          over the sampling periods in winter and spring. A similar
concentration of SOA was normalized by hydrocarbon-like            suggestion was also made in previous observations (Wang et
aerosol (HOA; Sun et al., 2013), CO (Kleinman et al., 2008;        al., 2019). O3 can be used as a tracer to reflect the strength
Aiken et al., 2009), EC (Zheng et al., 2015) or OA (Xu et al.,     of photochemical oxidation (Herndon et al., 2008; Xu et
2017) in previous studies, to better evaluate their secondary      al., 2017), and the significant negative correlations between
generation. The correlation coefficients between the ratio of      4-methyl-5-nitrocatechol and O3 in all seasons implied
SOA tracers to OC and RH as well as LWC are also listed in         that the photochemical reactions might not be the major
the Supplement (Table S8).                                         formation pathway of 4-methyl-5-nitrocatechol. Instead,
   The ratio of WSOC / OC showed significant positive cor-         stronger solar radiation might result in the photolysis of
relations with RH, LWC and the aerosol acidity in January,         4-methyl-5-nitrocatechol (Wang et al., 2019). Additionally,
April and October, possibly because the acid-catalyzed het-        the reverse relationship with temperature during the whole
erogeneous or aqueous-phase reactions facilitated the forma-       sampling period and in April and October was probably
tion of SOC in WSOC during the sampling periods in these           because the increasing temperature was conducive to
seasons (Du et al., 2014; Yang et al., 2019). In addition, the     the evaporation of phenolic species, thus inhibiting the

Atmos. Chem. Phys., 21, 1775–1796, 2021                                              https://doi.org/10.5194/acp-21-1775-2021
Q. Yu et al.: Primary sources and secondary formation of WSOC in PM2.5 in Beijing, China 1783 Figure 3. Correlation coefficients between SOA tracers and WSOC / OC and the meteorological parameters, O3 concentration, aerosol acidity and LWC during the sampling periods in the four seasons of 2017. secondary production of 4-methyl-5-nitrocatechol through The isoprene SOA tracer, 2-methylerythritol, could be heterogeneous or aqueous-phase reactions. The study of formed through the gas-phase reaction with qOH radical Gilardoni et al. (2016) also indicated that lower temperature (Claeys et al., 2004a) and acid-catalyzed heterogeneous ox- and higher RH were conducive to the formation of biomass idation with H2 O2 (Claeys et al., 2004b). In addition, it can burning SOA. also be formed by reactive uptake of the isoprene-derived The aromatic SOA tracer, phthalic acid, showed differ- epoxydiols (IEPOX) generated in the gaseous phase and sub- ent correlation patterns over the sampling periods in dif- sequent aqueous-phase processing (Surratt et al., 2010; L. Xu ferent seasons. Chamber studies have revealed that the en- et al., 2015). As shown in Table S7, during the whole study hanced aerosol LWC could significantly increase the yields period, 2-methylerythritol exhibited significant positive re- of aromatic SOA (Jia and Xu, 2018; Lu et al., 2019; Zhou lationships with temperature (r = 0.60, p < 0.01), RH (r = et al., 2019). In this study, both phthalic acid and the ratio 0.55, p < 0.01), O3 (r = 0.33, p < 0.01), the aerosol acid- of phthalic acid / OC showed significant positive relation- ity (r = 0.79, p < 0.01) and LWC (r = 0.56, p < 0.01), sug- ships with RH and LWC in January and April, suggesting gesting that both the gas-phase photooxidation and aqueous- that the acid-catalyzed heterogeneous or aqueous-phase re- phase reactions played significant roles in the formation of actions significantly contributed to the formation of phthalic 2-methylerythritol. From Fig. 3 and Tables S7 and 8, it seems acid during the study periods in winter and spring. In con- that the heterogeneous or aqueous phase were more closely trast, phthalic acid showed a significant positive relation- associated with the formation of 2-methylerythritol during ship with O3 (r = 0.65, p < 0.01) and a negative correlation the study periods in autumn and winter, while the photo- (r = 0.60, p < 0.01) with RH in July, which might be due chemical oxidation played an enhancing role over the study to the enhanced photochemical processes in the formation of period in summer. 2-Methylerythritol did not correlate sig- phthalic acid during the study period in summer (Kawamura nificantly (p > 0.05) with temperature in January, April and and Yasui, 2005). Different from 4-methyl-5-nitrocatechol, October; however, when the temperature was above 25◦ , it phthalic acid showed significantly positive correlations with grew rapidly as temperature increased, similar to the result temperature except in April, likely due to the higher tempera- found in the previous research (Liang et al., 2012). ture accelerating the production rates of phthalic acid (Kawa- The monoterpene SOA tracer, 3-hydroxyglutaric acid, also mura and Yasui, 2005). Though the lower temperature might showed significant positive relationships with temperature facilitate the gas-to-particle partitioning of phthalic acid, this (r = 0.63, p < 0.01), RH (r = 0.53, p < 0.01), O3 (r = process did not seem to play a dominant role during the study 0.37, p < 0.01), aerosol acidity (r = 0.82, p < 0.01) and periods in four seasons. LWC (r = 0.58, p < 0.01) during the whole study period https://doi.org/10.5194/acp-21-1775-2021 Atmos. Chem. Phys., 21, 1775–1796, 2021
1784 Q. Yu et al.: Primary sources and secondary formation of WSOC in PM2.5 in Beijing, China
(Table S7). In addition, 3-hydroxyglutaric acid correlated tively, which were identified as SOC from biomass burning
strongly with 2-methylerythritol (r = 0.94, p < 0.01), im- (biomass burning SOC) and aromatic precursors (aromatic
plying similar influencing factors for the formation of these SOC), respectively. Factor 7 exhibited a high level of cis-
two biogenic SOA tracers. The correlation pattern of an- pinonic acid, thus was explained as the freshly generated
other monoterpene SOA tracer, cis-pinonic acid, was dif- biogenic SOC. Factor 8 was featured by high fractions of
ferent from that of 3-hydroxyglutaric acid. Chamber stud- 2-methylerythritol and 3-hydroxyglutaric acid, which are the
ies showed that cis-pinonic acid could be produced through end oxidation products from isoprene and monoterpenes re-
gas-phase reactions of monoterpenes (Yu et al., 1999; Larsen spectively, hence was recognized to be aged biogenic SOC.
et al., 2001), which significantly contributed to the newly Note that 3-hydroxyglutaric acid and cis-pinonic acid were
nucleated particles (Zhang et al., 2012). Previous field ob- not grouped in one factor though they are both tracers of
servations also found that cis-pinonic acid was closely as- monoterpenes, due to their different oxidation degree as dis-
sociated with the nucleation processes in the first step of cussed above. Factor 9 covered the secondary components
the SOA formation from organic vapors (Alier et al. 2013; (such as SO2− − + 2−
4 , NO3 , NH4 and C2 O4 ) that can not be well
van Drooge et al., 2018). On the whole year scale, both explained by the sources identified above, thus was consid-
cis-pinonic acid (r = 0.35, p < 0.01) and the ratio of cis- ered to be SOA from other sources. More detailed discussion
pinonic acid / OC (r = 0.64, p < 0.01) indeed exhibited sig- can be found in the Supplement (Sect. S3).
nificant correlations with O3 . However, no significant corre- Source contributions to the total WSOC as well as its
lation was found between cis-pinonic acid and O3 in July, moderately and strongly hydrophilic fractions are illustrated
possibly because it is an unstable intermediate and might in Fig. 5. During the whole sampling period, the primary
more easily further generate higher generation products such emissions of biomass burning contributed 23.0 % to the total
as 3-hydroxyglutaric acid (Kourtchev et al., 2009). And this WSOC, with a higher contribution to its strongly hydrophilic
speculation was supported by the significant positive cor- fraction (37.9 %) than to the moderately hydrophilic portion
relation between the ratio of 3-hydroxyglutaric acid to cis- (15.2 %), which was probably due to the large amounts of
pinonic acid and O3 in July (r = 0.52, p < 0.01). In ad- saccharides with high water solubility from biomass burning
dition, cis-pinonic acid showed significant positive correla- (Yan et al., 2019; Xu et al., 2020). The total contribution of
tions with temperature in January (r = 0.37, p < 0.05) and primary and secondary biomass burning to WSOC (35.1 %)
October (r = 0.78, p < 0.01), while the correlation became was slightly lower than that previously reported in Beijing
weaker in April and even negative in July. At lower temper- (Cheng et al., 2013; Li et al., 2018; Duan et al., 2020),
ature, increasing temperature might facilitate the emission likely due to the effective control of open biomass burn-
of monoterpenes and the formation rate of cis-pinonic acid. ing activities in the surrounding areas of Beijing in recent
However, when the weather became warmer, the enhanced years. Other primary combustion sources (Factor 3) also con-
temperature might have facilitated the transformation of cis- tributed significantly to WSOC (13.0 %), most of which con-
pinonic acid to higher generation products or its evaporation tributed to its moderately hydrophilic fraction (16.5 %). A re-
into the gas phase (Li et al., 2013; Ding et al., 2016). cent source apportionment based on the CMAQ (Community
Multiscale Air Quality) model in North China reported that
3.3 Primary sources and secondary generation of coal combustion contributed 15.1 % to water-soluble HULIS
WSOC (HULISWS ) annually, which is the major component of mod-
erately hydrophilic WSOC (Li et al., 2019a). High concentra-
3.3.1 Source apportionment of WSOC tions of HULISWS were also observed in the coal combus-
tion smoke, again suggesting that coal combustion might be
Source apportionment of PMF was conducted to investigate a significant source of HULISWS (Fan et al., 2016). The pri-
the source contributions of WSOC as well as its moderately mary emission strength of coal combustion was the strongest
and strongly hydrophilic fractions. Nine types of sources in winter among four seasons, since the domestic heating
were identified in this study as shown in Fig. 4. Factor 1 required extra amounts of coal combustion in this season.
showed high levels of levoglucosan and EC, thus was inter- However, the contribution of Factor 3 to WSOC during the
preted as the direct emissions from biomass burning. Fac- study period in winter was not the highest among four sea-
tor 2 had a high level of cholesterol, hence was identified as sons, implying that there could be other sources beyond coal
cooking. Factor 3 exhibited a large fraction of EC, which can combustion included in Factor 3. Previous studies using the
not be explained by the direct emissions of biomass burn- PMF model also found that traffic and waste burning both
ing, suggesting that it was the direct emissions from other contributed more than 15 % to HULISWS in Beijing (Ma et
combustion sources, such as coal combustion, traffic and al., 2018; Li et al., 2019b). Therefore, the mixed primary
waste burning. Factor 4 was characterized by high loadings sources in Factor 3 possibly consisted of coal combustion,
of Mg2+ and Ca2+ , thus was regarded as dust. No significant traffic emission, waste incineration, etc. Previous AMS stud-
EC but high proportions of 4-methyl-5-nitrocatechol and ph- ies in Beijing indicated that cooking contributed more than
thalic acid were observed in Factor 5 and Factor 6, respec- 10 % to total organic aerosols (Hu et al., 2016; Sun et al.,
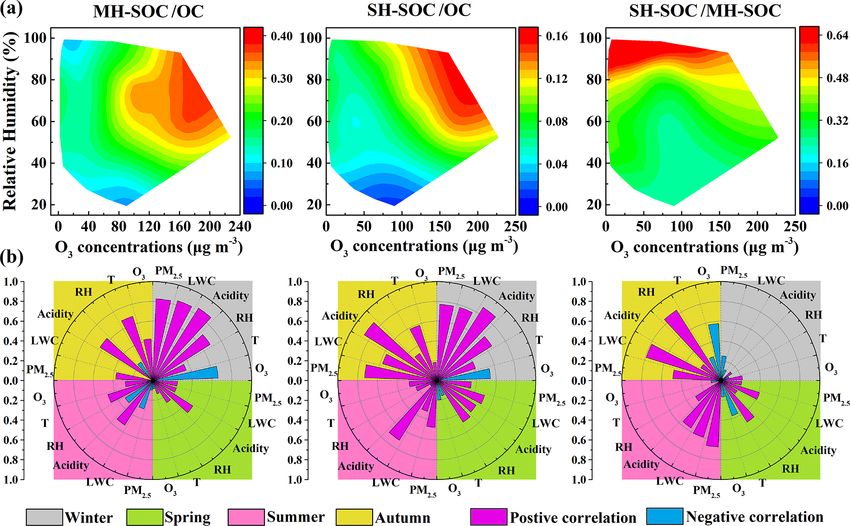
Atmos. Chem. Phys., 21, 1775–1796, 2021 https://doi.org/10.5194/acp-21-1775-2021Q. Yu et al.: Primary sources and secondary formation of WSOC in PM2.5 in Beijing, China 1785
Figure 4. The constrained nine-factor solution resolved by the PMF model.
2018; Duan et al., 2020). However, the contribution of cook- WSOC, and both contributed more to the moderately hy-
ing to WSOC was quite low (2.5 %) in this study, proba- drophilic WSOC. Biomass burning SOC, which is mainly
bly because it contributed more significantly to the water- generated from phenolic compounds, has been widely rec-
insoluble fraction of organic aerosols (Zhao et al., 2007). ognized to contribute notably to water-soluble brown carbon
Our results also showed that cooking only contributed to (HULISWS ) (Smith et al., 2016; Pang et al., 2020). Biogenic
the moderately hydrophilic WSOC. Dust contributed 7.2 % SOC in the strongly hydrophilic WSOC was more aged than
to WSOC, 4.6 % to its moderately hydrophilic fraction and that in moderately hydrophilic WSOC, possibly because at-
12.1 % to strongly hydrophilic fraction. The different con- mospheric aging processes generally increase the polarity of
tributions of dust between the moderately and strongly hy- organic aerosols (Baduel et al., 2011; Wu et al., 2016; Kuang
drophilic fractions might be explained by the strongly hy- et al., 2020).
drophilic fulvic acids from soil resuspension and the strongly
hydrophilic saccharides carried by dust (Li et al., 2018). 3.3.2 Temporal variation of the source contributions
As shown in Fig. 5a, the secondary sources contributed
54.4 % to total WSOC, slightly higher than the results of
The seasonal variation of the source contributions to total
Cheng et al. (2013) and Tao et al. (2016) and similar to
WSOC and its moderately and strongly hydrophilic fractions
those of Du et al. (2014). Secondary sources showed a higher
are shown in Fig. 5b. WSOC was mainly from secondary
contribution to the moderately hydrophilic WSOC (58.5 %)
sources during the study periods in summer (75.1 %) and
than the strongly hydrophilic WSOC (44.6 %). The aromatic
winter (67.4 %) but was dominated by primary emissions
SOC was the most abundant secondary source of WSOC
over the sampling periods in spring (65.2 %) and autumn
(28.8 %) as well as its moderately (25.9 %) and strongly hy-
(71.5 %), similar to the results of Qiu et al. (2020). Dur-
drophilic fractions (33.5 %) in urban Beijing (Tang et al.,
ing the sampling period in winter, WSOC mainly originated
2018). The biogenic SOC (11.0 %) and biomass burning
from anthropogenic sources (Li et al., 2018; Zhang et al.,
SOC (12.1 %) contributed comparable proportions to total
2018), including aromatic SOC (38.3 %), biomass burning
https://doi.org/10.5194/acp-21-1775-2021 Atmos. Chem. Phys., 21, 1775–1796, 20211786 Q. Yu et al.: Primary sources and secondary formation of WSOC in PM2.5 in Beijing, China Figure 5. Source contributions of WSOC as well as its moderately hydrophilic and strongly hydrophilic fractions in Beijing: (a) comparison of the source contributions to total WSOC, moderately hydrophilic WSOC and strongly hydrophilic WSOC on a whole year scale and (b) seasonal variation of the source contributions to total, moderately and strongly hydrophilic WSOC during the sampling periods in the four seasons. SOC (27.6 %) and primary biomass burning (21.6 %). The contributed higher portions to WSOC during the study pe- significant contributions of anthropogenic SOC during the riods in spring (27.0 %) and autumn (41.8 %), with much study period in winter probably resulted from the stronger greater contributions to the strongly hydrophilic WSOC than emissions of aromatic precursors and phenolic compounds the moderately hydrophilic WSOC in both seasons. In addi- from domestic heating activities such as the household com- tion, during the sampling period in spring when the weather bustion of solid fuels (Liu et al., 2016; Ding et al., 2017). was windy and dusty, dust showed the highest contribution The meteorological conditions over the study period in win- (23.3 %) to WSOC among four seasons. The contribution of ter (slow wind speed, low temperature and high relative hu- fresh biogenic SOC (13.0 %) was significantly enhanced dur- midity) also favored the accumulation and heterogeneous up- ing the sampling period in spring compared to that in winter take of the SOC precursors, leading to stronger SOC pro- as the temperature gradually increased, while the contribu- duction. It is therefore crucial to control biomass burning tion of aromatic SOC (19.3 %) decreased dramatically com- and the aromatic precursors to reduce WSOC in winter. Dur- pared to that in winter due to the cessation of heating activi- ing the sampling period in summer, the largest contributor ties (Yu et al., 2019). to WSOC was biogenic SOC (39.8 %). A significant frac- As shown in Fig. 1 as well as in previous studies, winter tion of the biogenic SOC was highly oxidized during the and autumn in the North China Plain are the two seasons that study period in summer, consistent with the higher O/C ra- endure more severe air pollution and show higher concentra- tio found in summer in previous research (Hu et al., 2016; tions of PM2.5 . Therefore, the source contributions to WSOC Xu et al., 2017; Qiu et al., 2020). Aromatic SOC (31.3 %) during the sampling periods in winter and autumn under dif- also contributed significantly to WSOC during the sampling ferent pollution levels were also investigated, as shown in period in summer, as reported previously in the summer of Fig. 6. During the study period in winter, both primary and Beijing (Guo et al., 2012). Unlike the case in winter with secondary contributions from biomass burning increased sig- stronger anthropogenic emissions and stagnant and humid nificantly from the clean days to moderate hazy days, while meteorological conditions, the high fraction of aromatic SOC aromatic SOC and biomass burning SOC dominated during in summer was largely associated with the stronger photoox- the severe hazy days (Zhang et al., 2018), highlighting the idation capacity. Both primary and secondary contributions important roles of biomass burning and aromatic SOC over from biomass burning were negligible during the study pe- the hazy periods in winter (Elser et al., 2016; Li et al., 2017; riod in summer. The direct emissions of biomass burning Huang et al., 2019; Yu et al., 2019). During the study pe- Atmos. Chem. Phys., 21, 1775–1796, 2021 https://doi.org/10.5194/acp-21-1775-2021
You can also read