Smartphone: the center of life - A study on Nordic mobile consumer behaviour Deloitte Global Mobile Consumer Survey 2019: The Nordic cut

Page created by Stanley Bush
 
CONTINUE READING
Smartphone: the center of life - A study on Nordic mobile consumer behaviour Deloitte Global Mobile Consumer Survey 2019: The Nordic cut
Smartphone:
the center of life
A study on Nordic mobile
consumer behaviour
Deloitte Global Mobile Consumer
Survey 2019: The Nordic cut
Smartphone: the center of life - A study on Nordic mobile consumer behaviour Deloitte Global Mobile Consumer Survey 2019: The Nordic cut
Contents
     Introduction                              03

     Section 1                                 04

      The Smartphone universe                  06

      The smartphone – a retail top shelf      10

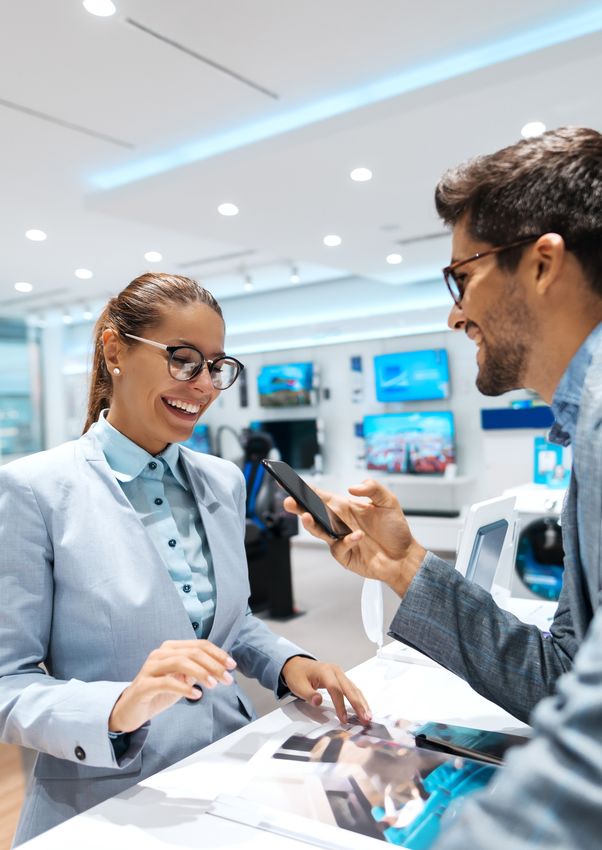
      Industry Spotlight: Retail               14

     Section 2                                 16

      4G, 5G – as long as we are connected,    18
      do we even care?

      Industry Spotlight: Telco                22

      Social Media – Mind the gap              24

      The game is on!                          30

      My smartphone gives me a headache        38

     Section 3                                 42

      Industry Spotlight: Public               44

      “I accept’’ … but what does this mean?   45

      Say ‘welcome’ to your virtual wallet     48

      Industry Spotlight: Financial Services   54

     Endnotes                                  56

     About the research & contacts             57

02
Smartphone: the center of life - A study on Nordic mobile consumer behaviour Deloitte Global Mobile Consumer Survey 2019: The Nordic cut
Introduction
                    Welcome to our third annual edition of Global Mobile Consumer Survey – The Nordic Cut: the
                    report where Deloitte’s Nordic TMT experts zoom in on the digital trends of mobile consumers
                    in Sweden, Norway, Denmark and Finland. This year’s report is based on responses from
                    5001 respondents across the Nordics. As a start we would like to provide a sneak peek of the
                    interesting findings that await the reader…

                    As in previous years, the smartphone is an indispensable part of people’s lives, with 92 per
                    cent of Nordic consumers having access to a smartphone in 2019. They prefer to use their
                    smartphone to check bank balances, to make video calls and to watch short videos on the
                    go. And as the video cameras in smartphones become extremely high quality – some of
                    the best on the market – it is no surprise that the Nordic consumers also prefer to use their
                    smartphones to take pictures and record videos.

                    This year’s report also dives into the booming trend of gaming - a market which generated
                    somewhere close to €126.3 billion in revenue last year. This number is predicted to increase
                    by about 10 per cent in 2019, and every year until at least 2022. More and more people in the
                    Nordics are mobile gaming daily, and games like ‘Subway Surfers’, ‘Pokémon Go’ and ‘Candy
                    Crush’ have become household names. But is it a social thing? Or merely a time-waster that has
                    caught our attention? You may find the answer in section two.

                    Speaking of social, the smartphone is of course still making it possible for Nordic consumers
                    to stay in touch with friends and family 24/7. When predicting the SoMe trends of the future,
                    one must look to the younger smartphone users. This year’s report shows that the young
                    generation is gradually abandoning Facebook. Trending now are personal blogs on Snapchat
                    and YouTube, and Instagram is still a highly preferred media for keeping the social network up
                    to date with instant moments from daily life.

                    In other words: the smartphone makes it possible for Nordic consumers to stay connected
                    and stay updated, and few people question a smartphone’s usefulness. However, this 24/7
                    accessibility comes with a price. More than half of the respondents in our survey report
                    experiencing negative side effects from using their smartphone. This debate about digital
                    well-being puts the tech industry in a special situation; they are being asked to help customers
                    detach from their phones, though their business model relies on the customers doing the
                    opposite…

                    We hope that you find the insights interesting. Please do not hesitate to reach out to us for
                    further conversations based on the content.

                    Jonas Malmlund                               Joachim Gullaksen
                    Head of Technology, Media &                  Head of Technology, Media &
                    Telecommunications Consulting                Telecommunications in Norway
                    in Sweden and in the Nordics

                    Frederik Behnk                               Jukka-Petteri Suortti
                    Head of Technology, Media &                  Head of Technology, Media &
                    Telecommunications in Denmark                Telecommunications in Finland

Global Mobile Consumer Survey | Introduction                                                                          03
Smartphone: the center of life - A study on Nordic mobile consumer behaviour Deloitte Global Mobile Consumer Survey 2019: The Nordic cut
04
Smartphone: the center of life - A study on Nordic mobile consumer behaviour Deloitte Global Mobile Consumer Survey 2019: The Nordic cut
Section 1

How much do Nordic
consumers use their
smartphones?
And what do they
use them for?

Global Mobile Consumer Survey | Section 1   05
Smartphone: the center of life - A study on Nordic mobile consumer behaviour Deloitte Global Mobile Consumer Survey 2019: The Nordic cut
The Smartphone
universe
The smartphone penetration is nearly complete, which means
fertile ground for the growth of complementary markets such
as Internet of Things devices and smartphone accessories.

With smartphone penetration of 92 per cent in        Figure 1. Smartphone penetration
2019, it is fair to say that there is a smartphone   Which, if any, of the following devices do you own or have ready access to?
in every Nordic consumer’s pocket (Figure 1).        - Smartphone
However, previous years’ annual growth of                                                         94% 94%
                                                                                                                    93%
smartphone sales seem to have peaked and                   92% 92%                   92%    92%                           92%
are likely to slow down in the years to come,                                  91%                                                                 91%
                                                                                                                                             90%
limited by phone replacement rates.                                                                           89%                      86%
                                                     88%

Please welcome the Internet of Things                                    86%

Let us begin by underlining that Nordic
consumers are still some of the first in line
to buy a new smartphone from the shelves.
                                                           Total            Finland            Norway             Sweden                  Denmark
More than half of Nordic consumers have a
smartphone that is less than two years old,          the smartphone is also essential in this space,            2017        2018        2019
and the market is still expected to be quite         acting as a key to controlling and monitoring           Base for 2019: All adults 18-75 in Sweden
substantial in the future.                           many of these devices. Let us have a look at            (1864), Norway (976), Denmark (1095),
                                                                                                             Finland (1066). Base for 2018: Sweden
                                                     what IoT has to offer:                                  (1868), Norway (977), Denmark (1097),
This high penetration of smartphones enables                                                                 Finland (1068). Base for 2017: Sweden
                                                                                                             (1769), Norway (947), Denmark (1028) and
a wide range of new complementary markets.           Entertain me                                            Finland (1038). Source: Nordic edition,
We are seeing this in the Internet of Things         Firstly, IoT includes entertainment devices,            Deloitte Global Mobile Consumer Survey,
                                                                                                             2019, 2018 & 2017.
(IoT) segment as well as in the accessories          where the smartphone acts the same way a
market where gadgets and add-on utilities are        remote control does, and as a mobile display
becoming a bigger part of our everyday life.         pad. This is most commonly found for smart
Three out of four consumers have at least one        speakers but is increasingly used for controlling
connected IoT device. In general, Norwegians         a TV, cable box or PVR.
own more connected devices than the other
countries at 84 per cent1. Not surprisingly,         Over half of Nordic consumers have a smart
men tend to own more connected devices               TV (Figure 2 & 3) and ownership of video
than women (81 % vs. 74 %). In fact, men             streaming devices, such as Chromecast, is
report higher ownership than women for all           growing. There is still a low ownership rate of
connected devices listed in the survey.              voice-assisted speakers (5 %), but this is still five
                                                     times higher than in 2017. This is likely due to
‘IoT’ includes connected devices that can be         the hard marketing launch of such devices by
controlled or accessed through smartphones.          electronic retailers in the Nordics as well as new
Although highly dependent on connectivity            partnerships forming, with Ikea and Sonos as
(more on this in section 2 on 5G connectivity),      examples.

06
Smartphone: the center of life - A study on Nordic mobile consumer behaviour Deloitte Global Mobile Consumer Survey 2019: The Nordic cut
Figure 2. Ownership of IoT devices                                                                                       Figure 3. Ownership of IoT devices
Which, if any, of the following connected devices do you own or have ready access to?                                    Which, if any, of the following connected devices
                                                                                                                         do you own or have ready access to?
      49% 50%
45%
                                                                                                                         Connected car system
                     29% 30% 30%               29% 30%        27%
                                                                    30%
                                                                          27%                                                                     7%
                                         25%
                                                                                    16%
                                                                                        19% 17%                                                        8%
                                                                                                                                                               10%
                                                                                                                  5%     Smart home security camera, or doorbell
                                                                                                        1% 2%
                                                                                                                         connected to the internet
   Smart TV          Games console        Video streaming    Wireless speakers /   Set-top box or PVR   Voice-assisted
                                          device that you    wireless soundbar      that is Internet-     speakers       0%
                                         connect to the TV   that do not have a        connected
                                                               voice assistant                                           0%
   2017         2018       2019                                                                                                                       7%
Base for 2019: All adults 18-75 who have a smartphone in Sweden (1719), Norway (917), Denmark (994), Finland (978).      Smart lighting system
Base for 2018: Sweden (1736), Norway (916), Denmark (988), Finland (967). Base for 2017: Sweden (1769), Norway (947),
Denmark (1028), Finland (1038). Source: Nordic edition, Deloitte Global Mobile Consumer Survey, 2019, 2018 & 2017                      4%
                                                                                                                                            5%
Growth in voice-assisted devices may partly challenge the dominance of                                                                           6%
smartphones as the preferred control pad. However, we believe the phone is
                                                                                                                         Smart plug
likely to persist since it is also a mobile display device - something smart speakers                                                  4%
cannot match.                                                                                                                                    6%
                                                                                                                                                 6%
Make my home smarter                                                                                                     Smart home appliance that can connect to the
                                                                                                                         Internet/be controlled using an app
Another IoT use area is smart home functionality. This means connecting your                                             0%
daily utilities to Wi-Fi so that they can be controlled and monitored online. Along                                                         5%
with Wi-Fi connection, smartphones enable off-site monitoring and an easy-                                                                  5%
access control pad.
                                                                                                                         Smart smoke detector
                                                                                                                          0%
Most smart-home devices are showing annual growth. Other than connected car
                                                                                                                                            5%
systems, the devices with highest ownership levels are smart-home-monitoring-                                                               5%
systems, smart plugs and smart lighting (7 %, 6 % and 6 % ownership respectively)
                                                                                                                         Hub which links connected devices within the home
(Figure 3). In practice, ownership levels for pet monitoring systems are around this
                                                                                                                                      3%
level as well, given that around only 30-50 per cent of Nordic households actually
                                                                                                                                       4%
have pets.
                                                                                                                                       4%

Why are there still so few Nordic consumers who own smart-home devices?                                                  Smart lock
                                                                                                                         0%
Although the technology is well known and well invested in, the devices have
                                                                                                                                      3%
not yet become mass-market products in the Nordics. This may be because
                                                                                                                                      3%
the products are not simple enough for the average consumer. Large retailers
may influence this through innovating on standard, well-adopted products. An                                             Smart thermostat

example is IKEA creating smart blinds. The product almost sold out in the Nordics                                                2%

immediately after its launch.                                                                                                         3%
                                                                                                                                      3%

It seems likely that the growing focus on sustainability and the environment in the                                      Open and close door sensors

Nordic countries will lead to increased ownership levels of smart-home devices.                                                  2%
They reduce energy consumption and provide more effective monitoring of foods                                                         3%
and beverages to minimize food waste.                                                                                                 3%

                                                                                                                         Pet camera or monitoring system
A part of daily life                                                                                                             2%
Use level statistics reveal that smart TVs and set-top boxes are the most                                                        2%
frequently used connected entertainment devices at 89 per cent and 85 per                                                             3%
cent weekly usage respectively (Figure 4). A similar trend is seen on a daily basis,                                     Smart personal or smart pet tracker
where smart TV usage is as high as 69 per cent. Even though wireless speakers                                            0%
and voice-assisted speakers have almost the same weekly usage, voice-assisted                                                    2%
speakers rate higher when looking at the daily use. This is likely because there                                                 2%
are relatively few smart speaker owners, but they are the early adopters and the
biggest fans of the product - so they use it often. Gaming consoles are the least

Global Mobile Consumer Survey | Section 1                                                                                                                                    07
Smartphone: the center of life - A study on Nordic mobile consumer behaviour Deloitte Global Mobile Consumer Survey 2019: The Nordic cut
connected to the internet                                                           72%
   Connected car system                                                                    82%
   Connected car system                                                                    82%
          Games console                                            42%
          Games console                                            42%
  Voice-assisted speakers                                                         66%
  Voice-assisted speakers                                                         66%
not have a voice assistant                                                         69%
hat you connect to the TV                                                            73%
hat you connect to the TV                                                                   85%
                Smart TV                                                                      89%
                Smart TV                                                                      89%

                     Figure 4. Weekly usage of IoT devices                                          Relative to last year’s weekly rates of use,          Figure 5. Accessories
                     When was the last time you used each device.                                   wireless speakers fell five points from 74 per        ownership
                     Was it within the...?                                                          cent weekly use to 69 per cent weekly use             Which of these accessories/
                                                                                                    from 2018 to 2019. Although not drastic, from         services for your phone do you
                                         Smart thermostat                                           a commercial point of view it is concerning that      own?
                                         Smart thermostat            49%                            use rates have not increased when these devices
                                                                     49%                                                                                  Cable charger
                                         Smart plug that can be switched on/off with an app          are becoming more powerful. Do we have too
                                         Smart plug that can be switched on/off                                                                                                                         95%
                                                                         56% with an app            many devices? Is the value add accessed through
                                                                         56%                                                                                                                            99%
                                         Smart lighting system                                      the speakers not attractive enough? Or were
                  Smart Home Devices

                                         Smart lighting system                                                                                            Phone case
                                                                                  68%               smart speakers a bit of a fad, and usage is falling
                                         Home appliance that can connect to the68%                                                                             10%
                                         Internet
                                         Home     / be controlled
                                               appliance  that canusing an app
                                                                   connect  to the                  as some of the novelty wears off?                                                        78%
                                         Internet / be controlled using an app 68%
                                                                                  68%                                                                     Wired earphones
                                         Hub which links devices within the home                    Dressing up your smartphone                                                 48%
                                         Hub which links devices within the home
                                                                                70%                 With the widespread adoption of the                                                66%
                                         Smart home security camera, or doorbell70%
                                         connected
                                         Smart hometosecurity
                                                      the internet
                                                              camera, or doorbell                   smartphone comes widespread adoption of               Power bank
                                         connected to the internet               71%                smartphone accessories. What may seem to be              4%
                                                                                   71%
                                         Connected car system                                       “just accessories’’ is actually an expected $75                               54%
                                         Connected car system
                                                                                          80%       billion market in 20202. The phone is obviously       Wired headphones
                                                                                          80%
                                         Games console                                              the centre of attention, but the phone and its                   24%
                                         Games console                                                                                                                           50%
                                                                   42%                              value is boosted further when consumers use
                                                                   42%
                                         Voice-assisted speakers                                    accessories.                                          Memory cards
                                         Voice-assisted speakers                                                                                                   18%
                                                                              65%
                 Entertainment Devices

                                         Wireless speakers / wireless soundbar65%                                                                                                50%
                                         that do not
                                         Wireless    have a /voice
                                                  speakers         assistant
                                                              wireless soundbar                     Accessories allow consumers to enhance and
                                         that do not have a voice assistant        69%                                                                    Screen protector
                                                                                   69%
                                                                                                    personalize their user experience as well as
                                         Video streaming device that you connect to the TV
                                                                                                                                                               9%
                                                                                                    improve their smartphone’s resilience. This is                              48%
                                         Video streaming device that you connect to the TV
                                                                                  73%
                                         Set-top box or PVR Video streaming device73%
                                                                                                    a market with high potential where consumers
                                                                                                                                                          Wireless headphones
                                         that youbox
                                                  connect toVideo
                                                             the TV
                                         Set-top     or PVR       streaming device                  still have not maxed out their ownership levels.         5%
                                         that you connect to the TV                         85%
                                                                                            85%     The most popular accessories are currently                            32%
                                         Smart TV
                                         Smart TV
                                                                                                    cable chargers, phone cases and wired                 Wireless earphones
                                                                                             89%
                                                                                             89%    earphones. Most people receive cable chargers            5%
                                                                                                    and wired earphones with their phones, yet                       23%
                                                                                                    many also buy them separately. This illustrates       Wireless charger
                       Base for 2019: All adults 18-75 in Sweden, Norway, Denmark &                 that the products are perceived as “necessities’’        4%
                       Finland who own or have ready access to each device - and has                                                                              15%
                       access to smartphone. Source: Nordic edition, Deloitte Global                and upgrades to the bundled product at time
                       Mobile Consumer Survey, 2019.                                                of initial phone purchase. For the wireless
                                                                                                    headphones, wireless earphones and wireless
                                                                                                                                                             Came with the phone
                     frequently used devices, which indicates that                                  chargers, consumers have 15-32 per cent
                                                                                                                                                             Total ownership
                     they are less of a necessity for consumers’ daily                              ownership (Figure 5). Few phones are bundled
                                                                                                                                                          Base for 2019: All adults 18-75 who have a
                     life, and more of an occasional fun thing to do                                with these products and the relatively high
                                                                                                                                                          phone or smartphone in Sweden (1775),
                     once a month or so.                                                            price points for these accessories explain why        Norway (942), Denmark (1042), Finland
                                                                                                                                                          (1035). Source: Nordic edition, Deloitte
                                                                                                    they are less common.
                                                                                                                                                          Global Mobile Consumer Survey, 2019.
                     Although smart-home devices are a little less
                     likely than connected entertainment devices                                    Still market potential for cable chargers?
                     to be used on a weekly basis (around 70 %) it is                               Most smartphone users have experienced
                     worth noting that well over half of all people in                              that panicky feeling when their smartphone
                     the Nordics who own smart-home devices use                                     suddenly is out of battery. For many, this
                     them weekly: although ownership rates are low,                                 experience might even feel like a loss of
                     those who own them seem to be integrating                                      personal health (as section 3 indicates) which
                     them into their regular lives. Use of thermostats                              needs to be addressed immediately. Thus,
                     is a little lower than the other smart-home                                    chargers, and especially cable chargers, are a
                     device categories. It makes sense that people                                  necessity in most people’s homes or everyday
                     change their house temperature less frequently                                 bags. Because the smartphone is so dependent
                     than they turn their appliances or lights on or off.                           on this accessory, it should come as no surprise
                                                                                                    that ownership is close to 100 per cent. Most

                     08
Smartphone: the center of life - A study on Nordic mobile consumer behaviour Deloitte Global Mobile Consumer Survey 2019: The Nordic cut
people report their cable charger came with             Figure 6. Accessories ownership across generations
               their phone (95 %). Still, 13 per cent report           Which of these accessories/services for your phone do you own? - Total ownership
               having purchased theirs separately, indicating
                                                                        81%
               that they own several or are replacing a lost                  72%
                                                                                    69%                     71%
                                                                                          66%                                                     68%                                                                   66%
               one. With the recent introduction of wireless                                    61%               61%
                                                                                                                                                        57%
                                                                                                                                                                                      60%                                     59%
                                                                                                                        55% 54%
                                                                                                                                                              52%                                                                   52%
               chargers, consumers are not solely dependent                                           51%                           49%                             47%
                                                                                                                                                                          43%
                                                                                                                                                                                            48% 49% 50%
                                                                                                                                                                                                            51%
                                                                                                                                                                                                                  45%
                                                                                                                                          39%                                   40%
               on cable chargers anymore, although
               ownership is relatively rare, with fewer than
               one in ten smartphone owners purchasing a
               wireless charger separately, which is nearly as
                                                                              Wired earphones                       Power bank                      Wired headphones                         Memory cards                     Screen
               many as for cable chargers. This might indicate
71%            a change in68%
                            the market for cable chargers               66%
    61%                                           60%
        55% 54%entering the new
                              57% wireless world.                             59%
                                 52%                         51%                    52%
            49%                  47%               48% 49% 50%                            47%               48%
                                       43%                       45%
                  39%                        40%                                                39%               41%
                                                                                                                        36%
             Phone cases and power banks are very popular                                             31%                     32%                 30% 28%
                                                                                                                                                              26%
                                                                                                                                    23%                             22%               23%
             and are usually purchased separately. These are                                                                              18%                             19%
                                                                                                                                                                                13%
                                                                                                                                                                                            18% 16%
                                                                                                                                                                                                      14%
                                                                                                                                                                                                            11%
                                                                                                                                                                                                                  7%
             accessories necessary to prevent damage and
             to increase battery
     Power bank                     time. Basically, people
                           Wired headphones                   love
                                                      Memory cards            Screen protector                Wireless headphones                   Wireless earphones                      Wireless charger

             their smartphones and are using them more
             and valuing them more highly: accessories that               18-24             25-34           35-44             45-54             55-64          65-75
             make the phones sturdier and able to be used              Base for 2019: All adults 18-75 who have a phone or smartphone in Sweden (1775), Norway (942), Denmark (1042),
                                                                       Finland (1035). Source: Nordic edition, Deloitte Global Mobile Consumer Survey, 2019.
             for longer are seen as useful things.

           Are we cutting the wire?                                    Men tend to be quicker to buy and use new
           Ownership of wireless earphones and                         smartphone accessories than women. They
           headphones is still low compared to wired                   also own more smartphone “gadgets’’ such
           alternatives, even though wireless devices have             as wireless accessories, power banks and
           been available for years. Wireless Bluetooth                memory cards, while women own more safety
           headphones hit the market in 2004 and                       accessories such as phone cases and screen
           became viable alternatives for traditional wired            protectors.
           headphones in 20103. When Apple Airpods
           launched in 2016 at the same time as the                    Smartphone: the centre of attention
           headphone jack were removed from iPhones,                   The market for IoT devices and for smartphone
           many were “forced” to switch to wireless                    accessories can be considered as an
           alternatives 4. Given the rate at which new                 ecosystem, with the smartphone at the centre.
           technology is normally picked up by consumers,              In many ways the smartphone is the key to the
           why are ownership levels of wireless devices                consumers’ connected IoT devices, as it acts
           not higher in 2019? It might be that consumers              as a remote or a mobile display pad. Similarly,
           do not think that going wireless really adds                the phone is the centre of attention for all
           enough value to support the price difference.               the accessories and gadgets that enhance
                                                                       the customer experience. This all turns into
           Are accessories for everyone?                               a positive upward spiral for the future of the
           Accessory ownership is clearly correlated to                smartphone: the complementary markets are
           age. Younger smartphone owners have more                    reinforcing the importance of the smartphone
           accessories, and ownership decreases as age                 and boosting its future value and growing
           goes up (Figure 6). This is not surprising as we            the overall ecosystem. This goes for online
           see the same trend for use frequency. Younger               shopping as well – which we will investigate in
           segments are heavier users of their phones. For             the next section.
           instance, we see that for all apps listed in the
           survey, respondents aged 18-24 report higher
           hourly use than older respondents. Heavier use
           is likely to induce consumers to protect their
           phones, extend battery life and generally have
           a better experience.

           Global Mobile Consumer Survey | Section 1                                                                                                                                                  09
Smartphone: the center of life - A study on Nordic mobile consumer behaviour Deloitte Global Mobile Consumer Survey 2019: The Nordic cut
The smartphone
– a retail top shelf
What started as online versions of physical stores are now a
complex ecosystem where it is sometimes hard to differentiate
between communication apps and classic online shopping services.

The modern smartphone has evolved over                Figure 7. The evolution of the smartphone preference
the last decade from new technology to an             Which, if any, is your preferred device for each of the following activities?
essential modern-day-multi-tool, both in the
professional and private life of the consumer.                                                                                                                 40%

Over the course of the last three years, the                                                                                                          34%
technology has evolved, as has the market. The                              30%

transition from traditional means of acquiring                   25%                                                      25%                 24%
and delivering products and services to digital                                                           20%
                                                      16%
means accessible through mobile phones has
begun to be the new normal.                                                                       10%

The mobile phone inching ever closer to
the retail top spot                                    Browse shopping                          Make online purchases                             Online search
                                                          websites
The smartphone continues to grab market
share as the preferred device for online retail          2017               2018               2019
activities. The increase from 2018-2019 was not                                                                                   40%
                                                      Base for 2019: All adults 18-75 who own or have ready access to smartphone in Sweden (1720), Norway (900),
as large as the change in 2017-2018, yet was                                                                               34%
                                                      Denmark (1011), Finland (983). Base for 2018: Sweden (1719), Norway (900), Denmark (1010), Finland (983). Base for
still very noticeable in all the areas as displayed                  30% Norway (864), Denmark (970), Finland (943). Source: Nordic edition, Deloitte Global Mobile
                                                      2017: Sweden (1650),
                                                      Consumer   Survey, 2019, 2018 & 2017
in Figure 7. Most impressive is the change in                 25%                                    25%            24%
making online purchases, which has increased                                                              20%
                                                      16%
by 150 per cent over the course of two years.         Figure 8. All ages are using the mobile phone more for retail
This can partly be attributed by the increase in                              10%
                                                      Activities use mobile phone for - Purchase a product online
supply of service and shopping apps5. That said,
                                                                                           74%                       76%
the smartphone is still more likely to be used                                64%
                                                                                    69%                        71%
                                                                                                                                      61%
                                                                                                                                            69%
                                                                                                        61%
                                                                      57%
for searching or browsing rather than the actual       Browse
                                                            52% shopping                        Make online purchases 56%                         Online search
                                                                                                                                                              53%
                                                        46%                                                                                                 45%
                                                            websites                                                                                  41%                           41%
purchase.                                                                                                                                                               28%
                                                                                                                                                                              37%
                                                                                                                                                                                                28%
                                                                                                                                                                                                      32%
                                                                                                                                                                                          24%

Purchasing products and services in a                                                                                                                          40%
                                                              Total               Age 18-24              Age 25-34               Age 35-44              Age 45-54        Age 55-64         Age 65-75
mobile world                                                                                                                                          34%
Over the course of the last three years more              2017               2018
                                                                            30%                2019

people across all the age segments have                       25%                                   25%             24%
                                                      Base for 2019: All adults 18-75 who own or have ready access to smartphone in Sweden (1720), Norway (900),
purchased a product online using their mobile         Denmark (1011), Finland (983). Base for20%
                                                                                             2018: Sweden (1719), Norway (900), Denmark (1010), Finland (983). Base for
                                                      2017:
                                                       16% Sweden (1650), Norway (864), Denmark (970), Finland (943). Source: Nordic edition, Deloitte Global Mobile
phone (Figure 8). It is hardly any surprise           Consumer Survey, 2019, 2018 & 2017
that mobile online shopping is getting more                                        74% 10%
                                                                                     69%      71%
                                                                                                  76%
                                                                                                                                            69%
                                                                              64%

common6. However, it is worth noting that
                                                                                                        61%                           61%
                                                                      57%                                                       56%
                                                              52%                                                                                                 53%
                                                        46%                                                                                                 45%
                                                                                                                                                      41%                           41%
                                                                                                                                                                              37%
                                                                                                                                                                                                      32%
                                                                                                                                                                        28%                     28%
10                                                     Browse shopping                          Make online purchases                             Online search                           24%

                                                          websites

                                                              Total                Age 18-24                  Age 25-34           Age 35-44              Age 45-54        Age 55-64         Age 65-75
Global Mobile Consumer Survey | Section 1   11
Figure 9. Services are moving into the phone for consumers
               Activities use mobile phone for - Purchase a service online

                                                   54%                56%
                                                                51%                       52%
                                             46%
                                       43%               42%                        43%
                              40%
                      35%                                                    35%                                 37%
                29%                                                                                        30%
                                                                                                    24%                         22% 24%
                                                                                                                         17%                               19%
                                                                                                                                              15% 17%

                      Total                Age 18-24       Age 25-34            Age 35-44              Age 45-54             Age 55-64          Age 65-75

                    2017            2018      2019

               Base for 2019: All adults 18-75 who own or have ready access to smartphone in Sweden (1720), Norway (900), Denmark (1011), Finland (983).
                                                                       56%
               Base for 2018: Sweden (1719), Norway
                                                 54%    (900), Denmark
                                                                  51%
                                                                         (1010), Finland (983).
                                                                                             52%Base for 2017: Sweden (1650), Norway (864), Denmark (970),
               Finland (943). Source: Nordic
                                       43%
                                              edition,
                                            46%        Deloitte Global Mobile  Consumer 43%
                                                                                           Survey, 2019, 2018 & 2017
                              40%                         42%
                                                                                                                 37%
                      35%                                                     35%
                29%                                                                                        30%
                                                                                                     24%                              24%
                                                                                                                                22%
                                                                                                                                                           19%
                                                                                                                          17%                        17%
               the increase is apparent in all age segments,             Figure 10. Preferred purchase sites when
                                                                                                                                               15%

               highlighting that a smartphone is becoming an             purchasing products/services online using
               increasingly
                     Total
                               usefulAgedevice
                                         18-24
                                               for us all.
                                                       Age 25-34
                                                                         a smartphone
                                                                 Age 35-44           Age 45-54       Age 55-64    Age 65-75

               The online purchasing of services has increased           You mentioned that you purchased a product/
               as well (Figure 9), though not as much as                 service online, using your smartphone. Which
               for products of course, as the supply and                 of the following do you normally use when
               accessibility of services are not as high as for          purchasing products/services online using your
               products. It might also appear more complex               smartphone?
               or diffuse to buy a service online compared to a
               physical product.                                         A retailer's website
               In recent years the supply of services has                                                       67%
     17%       become more diverse as healthcare services,
0%                  9%      7%
               logistic solutions   and household services have                                                64%
               found their way into our homes and made our
essenger app   everyday    life easier.
                       Other                                             A marketplace app

                                                                                                                        37%
               The modern marketplace is changing
               Retailer websites are still the preferred                                                                     43%
               purchase sites in the eyes of the consumer.
               It might be too early to tell, but according to                            A retailer's app
               Figure 10, a shift in marketplaces could be                                                         28%
               under way. Retailer websites had a decline of
               three percentage points compared to 2018,                                                               31%
               while the three app categories all had an
                                                                                          A messenger app
               increase: six and seven points for marketplace
               and messenger apps. The preference for                                              10%
               retailer websites could be connected to the
                                                                                                           17%
               increased preference for using mobile phones
               for online shopping. The consumers still prefer                            Other
               the computer to the phone for making online
                                                                                                   9%
               purchases and with this might come the high
               base value of the retailer’s website, because
                                                                                                 7%
               consumers are used to accessing the site this
               way, even when they use their phones7.
               In a broad sense, large retailer websites are                                 2018          2019
               most often optimised for computers, and
                                                                                          Base for 2019: All adults 18-75 who own or have ready access to
               merely adequate for phone usage. The apps                                  smartphone in Sweden (458), Norway (239), Denmark (274), Finland
                                                                                          (269). Base for 2018: Sweden (1031), Norway (530), Denmark
               on the other hand are specifically tailored for
                                                                                          (525), Finland (477). Source: Nordic edition, Deloitte Global Mobile
               the use of mobile phones. In a world were                                  Consumer Survey, 2019 & 2018

               12
digital design is critical for branding and general                     There are some differences between the
impressions, better and more apps could be                              countries regarding preferred purchase sites
a driver towards apps being preferred more                              (Figure 11). Danish respondents prefer retailer
frequently as the place of purchase.                                    apps more than other Nordics (44 %),
                                                                        while Finnish respondents prefer a marketplace
It is remarkable that messenger apps have                               app (52 %). In general, it could be noted that
had a 70 per cent increase in preference.                               the main national difference is between
Messenger apps are known in retail as an                                marketplace apps and retailer apps, while
avenue for marketing. The increased spotlight                           the retailer’s website remains consistently
would not be surprising to boost sales, but as a                        preferred by half to two-thirds of those
preferred purchase site it is a bit of a wildcard.                      surveyed. It may be that market shares
Consumers are shown a product or service that                           and focus on retail apps of different major
is targeted towards them and does not have                              retail players in each country cause these
to be a product that they browsed for, even                             differences.
though this is likely with consumer data derived
from web history. It narrows the consumer’s
focus to a product from what could have been a
                                                                        Over the last few years
much larger genre.                                                      the supply of services
Marketplace apps have experienced a greater                             has increased in the
increase than retailer’s apps, with six and                             household as healthcare
three percentage points respectively. As
previous reasoning states, it might be that                             services, logistic solutions
these apps are more targeted towards mobile
use, but another thought would be that these
                                                                        and household services
Marketplace apps come with another unique                               have found their way into
selling point in order to gain market share. Such
a selling point could be discounts targeting a                          our homes and made our
certain segment or product category. Thus,                              everyday lives easier.
these would not compete in the same sense
that the retailer’s apps and websites compete
against each other.

Figure 11. Preferred purchase sites when purchasing products/services online using a
smartphone
You mentioned that you purchased a product / service online, using your smartphone. Which of the
following do you normally use when purchasing products / services online using your smartphone?

                                                                                                                                                                       A re
 66% 65% 65%
                  57%
                                                   52%
                                 48%
                                                                              44%
                                       41%
                                                                        37%
                                             30%
                                                                  26%
                                                                                    23%
                                                                                                        19% 17% 19%                                                    Am
                                                                                                  15%                                             14%
                                                                                                                                   5% 5% 6%
                                                                                                                                                        2% 2% 2% 2%

 A retailer's website              A marketplace app                 A retailer's app               A messenger app                       Other           Don’t know

   Sweden           Norway          Denmark           Finland
                                                                                                                                                                       A re
Base for 2019: All adults 18-75 who own or have ready access to smartphone in Sweden (458), Norway (239), Denmark (274), Finland (269).
Source: Nordic edition, Deloitte Global Mobile Consumer Survey, 2019

                                                                                                                                                                       Am

Global Mobile Consumer Survey | Section 1                                                                                                                      13
Industry Spotlight: Retail

Time to rethink retail
The retail industry is in transition due to tension in the global
economy and a wave of emerging technologies.

In a market of constant disruption, a focus on ecommerce and        Deloitte expert take
mobile solutions is essential in order for retail businesses to
                                                                    The mobile phone is becoming a vital part of many
thrive. The Nordic ecommerce market has reached a value of 46
                                                                    shopping experiences. Customers browse products
billion euro in 20198. Concurrently, the use of mobile phones for
                                                                    and services, read reviews and compare prices easily on
shopping is growing, now representing a little more than a third
                                                                    their mobile phones. Additionally, consumers can receive
of Nordic ecommerce spending.
                                                                    notifications about discounts and store pick-ups, initiate
                                                                    orders and even complete purchases on their mobile
The Global Mobile Consumer Survey 2019 data confirm the rise
                                                                    phones. The broad use areas of the mobile phone in the
of the mobile phone as an important part of shopping, both as a
                                                                    retail world will make the phone central to both physical and
means of purchasing and as a tool for navigating and researching
                                                                    digital purchases, especially for younger shoppers.
the retail universe.
                                                                    “The smartphone will become
                                                                    consumers’ loyal shopping
Five highlights from the retail industry:
                                                                    companion, both for physical
1. Although the computer is still the preferred                     sales and ecommerce’’
   device for searching and browsing, the                           – Joakim Torbjörn, Nordic Retail Industry Lead
   preference for mobile devices for 18-44-year-olds
   is growing so fast that smartphones will likely be               How to approach this market according to our analysis
   the number one device for searching in 2020, and                 It is essential for retailers to investigate how mobile
   the top choice for browsing by 2023 or so.                       solutions can improve the customer journey of shopping
                                                                    – from browsing, to purchasing, to delivery, creating
2. Across all age groups, one out of four prefers the               convenient and personalised shopping experiences.
   mobile phone for making online purchases, up
   from one out of 10 in 2017.                                      Offering user-friendly payment solutions is key to making
                                                                    checkouts and purchases hassle-free. Moving forward,
3. 57 per cent have used their mobile phone to                      this will be enabled by cross-country collaboration and
   purchase a product online, while 45 per cent                     commercialisation of technologies such as QR and NFC9.
   have purchased a service.
                                                                    Retailers should seek new opportunities in combining
4. 58 per cent of the respondents have used their                   physical stores and digital platforms. Currently, we
   phone for making an in-store purchase, up from                   see examples of Phygital offerings popping up, such as
   45 per cent in 2018.                                             consumers buying products online for store pick-up,
                                                                    receiving offers and assistance on their mobile phone
5. 74 per cent have used their mobile phone to read                 in physical stores or trying on items ordered online in a
   reviews about a product or service.                              physical fitting room location for quick return.

                                                                    Retailers should also be aware of large global tech giants
                                                                    like Amazon and WeChat entering the Nordic retail market
                                                                    with sophisticated mobile solutions. This poses a threat to
                                                                    traditional retailers who will need to respond by making the
                                                                    mobile phone increasingly central to their business strategy.

14
Global Mobile Consumer Survey | Section 1   15
16
Section 2

Today, fast internet
connectivity makes
it possible for Nordic
consumers to be
online all the time,
both on social media
and when gaming.
However, this 24/7
accessibility comes
with a price …

Global Mobile Consumer Survey | Section 2   17
4G, 5G - as long as
we are connected,
do we even care?
The Nordic countries are above the OECD average in terms
of the percentage of the population with mobile broadband
subscriptions and high mobile data usage, but do we understand
the benefits that 5G will bring to the table?

Although we can see an increase in the mobile     Figure 12. Monthly data allowance in the Nordics
use of data intensive video streaming services    What is your monthly data allowance on your smartphone?
such as Netflix and HBO Nordic, the quality
                                                                             67%
                                                                                               63%
and coverage of network when accessing the        54%                              54%
                                                                                         60%

Internet or services that use data is perceived
as less important than previously. Furthermore,                                                           33%
                                                                                                                21%                               23%                23%
anticipation for 5G has decreased even as                                                                             13%                               12%
                                                                                                                                                              17%
                                                              7%      8%                             7%
we get closer to the Nordic rollouts. Have we            2%                                                                 3%   2%   2%     1%

reached a tipping point in perceived network         It's unlimited                3GB or more        Less than 3GB          I pay per use              Don't know

quality?                                                Finland            Norway         Sweden          Denmark

                                                  Base for 2019: All adults 18-75 who own or have ready access to
We are the connected people                       smartphone in Sweden (458), Norway (239), Denmark (274), Finland
Today, there are over 100 mobile broadband        (269). Source: Nordic edition, Deloitte Global Mobile Consumer
                                                  Survey, 2019
subscriptions for the same number of
inhabitants in the Nordic countries10. In fact,   data usage of Norway. This is likely due to more
compared to other OECD countries, only Japan      than half (54 %) of Finns having unlimited data
is ahead of Finland in the number of mobile       (see Figure 12). Generally, this unlimited data
broadband connections per 100 inhabitants         comes with a speed cap, instead of a data cap
and, with the exception of Norway, the Nordic     (the norm in the rest of the region). Things are
countries rank well above OECD averages in this   not bad in the other Nordic countries either
category.                                         as nearly two-thirds of Nordic adults have a
                                                  monthly data allowance on their smartphone
Generally, we are also heavy mobile data          of 3GB or more. Since Finland operates with
consumers, as all Nordic countries rank above     unlimited data, many households use their
the OECD average in terms of mobile data          mobile connection as a hotspot; therefore,
usage11. While we all seem to want mobile         the country has the lowest percentage of fixed
data, Finland stands out when it comes to         broadband connections among the Nordic
actually getting it, as Finland tops the OECD     countries (although still more than the OECD
statistics for mobile data usage at over 19 GB    average)12.
per month in 2018, with four times the mobile

18
5G for consumers – is it just a faster 4G or                                has dropped to 13 per cent. Furthermore,                          Figure 15. The anticipation
   something much more?                                                        from 2018 to 2019, there was an increase                          of 5G among people
   There has been a lot of discussion around                                   of four percentage points in the number of                        interested in the latest
   5G and what kind of new opportunities it                                    respondents stating they would only switch to                     technology in 2019
   offers for businesses. However, we suspect                                  5G when it becomes a standard offering and                        Which of the following best
   that the benefits which 5G brings to the end                                there is no alternative. Interestingly, it seems                  describes your attitude towards
   consumers are not as clear. For one, the trend                              that Norwegian consumers are more interested                      5G networks?
   for consumers’ anticipations of 5G has actually                             in 5G than consumers in other Nordic countries
   decreased slightly between 2018 and 2019 (see                               (see Figure 14). Furthermore, there is a higher                   I would switch to a 5G network
                                                                                                                                                 as soon as it is available
   Figure 13). In 2018, 15 per cent of Nordic adults                           interest in switching to 5G as soon as possible
                                                                                                                                                                13%
   owning a25%phone or a smartphone would have                                 for Nordic consumers who own the latest
   switched to a 5G network as soon as possible,                               smartphones, compared to switching in general                                                   27%
                         19%                                                   (see Figure 15).
17%whereas the comparable percentage in 2019                                                                                                                                    27%
    Figure 13. Consumer anticipation
                                 13%        of 5G
       9%
    Which of the following best describes your attitude towards 5G networks?                                                                     I would switch to a 5G network if I
                                                                                                                                                 start hearing good things about it
                                                  0%                                                                                                                16%
                                                              36%
                                                                         34%
I would switch to a                   Don’t know
                                                                                                                                                                          22%
5G network if it was
   the standard
 offering and there                                                                                                                                                  16%
 was no alternative                                                                                                  20%        19%
                                     16%     16%                                                     17%                                                            I would switch to a 5G network a
       15%
                  13%                                                                     13%
                                                                                                                                                 I would probably switch to a 5G
                                                                                                                                                 network eventually                                    67%
                                                                                                                                                                                        34%
                                                                                                                                                                                                     64%
                                                                                                                                                                              29%
    I would switch to a          I would switch to a         I would probably          I would switch to a              Don’t know                                  I would switch to a 5G network if
    5G network as soon          5G network if I start          switch to a 5G          5G network if it was                                                         things about it33%
      as it is available        hearing good things         network eventually            the standard
                                      about it                                          offering and there                                                                                                  37%
                                                                                        was no alternative
                                                                                                                                                 I would switch to a 5G network if
          2018       2019                                                                                                                        it was the standard offering and                           43%
                                                                                                                                                 there was no alternative
     Base for 2019: All adults 18-75 who have a phone or smartphone in Sweden (1775), Norway (942), Denmark (1042), Finland (1035). Base for
     2018: Sweden (1798), Norway (947), Denmark (1051), Finland (1050). Source: Nordic edition, Deloitte Global Mobile Consumer Survey, 2019 &                       17%
     2018.                                                                                                                                                          I would probably switch to a 5G n
                                                                                                                                                            9%

                                                                                                                                                                             25%

    Figure 14. The anticipation of 5G in the Nordic countries in 2019
                                                                                                                                                                    I would switch to a 5G network if
    Which of the following best describes your attitude towards 5G networks?                                                                                        offering and there was no altern
                                                                                                                                                 Don’t know
                                                                                                                                                                                                     10%
                                                                                                                                                                       19%
                                                                         38%
                                                                                                                                                                              A retailer's website
                                                                   34%
                                                             32%                                                                                                 13%                                   66%17%
                                                                               30%
                                                                                                                                                                                                       65%
                                                                                                                                      24%          0%                                                  65%
                                                                                                                      22%                                           Don't know
          20%                   18%                                                      20%
                                                17%                                                  17% 17%                                                                                         57%
                                                                                                                            16% 17%
                13% 13%               14% 15%                                                  15%

     8%                                                                                                                                                                       A marketplace app
                                                                                                                                                     Nordic Total

                                                                                                                                                     Apple iPhone 8, 8 Plus, X, Xs,
     I would switch to a        I would switch to a 5G         I would probably          I would switch to a 5G             Don't know               Xs Max or XR
     5G network as soon            network if I start            switch to a 5G           network if it was the
       as it is available         hearing good things         network eventually         standard offering and                                        Samsung Galaxy Note range
                                        about it                                        there was no alternative
                                                                                                                                                                              A retailer's app
                                                                                                                                                 Base for 2019: All adults 18-75 who have a
          Finland           Norway         Sweden        Denmark
                                                                                                                                                 phone or smartphone in Sweden (1775),
     Base for 2019: All adults 18-75 who have a phone or smartphone in Sweden (1775), Norway (942), Denmark (1042), Finland (1035)               Norway (942), Denmark (1042), Finland
     Source: Nordic edition, Deloitte Global Mobile Consumer Survey, 2019                                                                        (1035). Source: Nordic edition, Deloitte
                                                                                                                                                 Global Mobile Consumer Survey, 2019.

                                                                                                                                                                              A messenger app

    Global Mobile Consumer Survey | Section 2                                                                                                                                    19
                                                                                                                                                                              Other
When 4G was introduced, it changed the way                        analyse whether there have been any changes
     consumers could use their smartphones: 4G                         in the ways in which consumers use their
     networks were simply much faster than 3G,                         smartphones for activities requiring a high
     enabling consumers to listen to music and                         quality network, such as using data intensive
     watch series and movies on their smartphones                      streaming services like Netflix and HBO. Figure
     online almost anywhere with high quality, which                   16 shows that as of 2019 over half of Nordic
     was not possible with 3G. Furthermore, when                       consumers subscribe to services that require
     thinking about what changing from 3G to 4G                        a high quality network, such as music and
     meant for consumers, it is only logical that a                    video streaming services, with video growing
     common belief about what 5G will provide                          nearly seven percentage points in the last
     consumers is that it will be just like 4G, only                   year. Furthermore, there has been a five-point
     faster – in fact, for consumers (as opposed to                    increase in the number of Nordic consumers
     enterprises) that is the single biggest difference                watching videos on their smartphones in the
     between 5G and 4G. Hence, it is interesting to                    last year (see Figure 17).

     Figure 16. Subscriptions to streaming                             Figure 17. The use of smartphones for
     services requiring high quality data                              streaming services
     connection                                                        Which, if any, of the following do you access on
     Which, if any, of the following subscription                      your smartphone?
     services do you have access to?

        Video on demand                           Music                   Video on demand                           Music

      49%                 56%             50%               51%            40%              45%            59%                  57%

        2018        2019
     Base for 2019: All adults 18-75 in Sweden (1864), Norway (976),   Base for 2019: All adults 18-75 who have a smartphone and have
     Denmark (1095), Finland (1066). Base for 2018: Sweden (1868),     access to a subscription service in Sweden (1421), Norway (803),
     Norway (977), Denmark (1097), Finland (1068). Source: Nordic      Denmark (806), Finland (771). Base for 2018: Sweden (1357), Norway
     edition, Deloitte Global Mobile Consumer Survey, 2019, Deloitte   (745), Denmark (801), Finland (720). Source: Nordic edition, Deloitte
     Global Mobile Consumer Survey, 2018.                              Global Mobile Consumer Survey, 2019 & 2018.

20
light as 5G allows us to download HD movies
                                                     in five to 10 seconds, compared to 10 minutes
                                                     for 4G4 - although it is worth noting that most
                                                     services for video rely on streaming, rather than
                                                     downloading, and 5G’s speed advantages are
                                                     less meaningful there. However, higher speed is
                                                     not the only advantage of 5G for consumers.

                                                     If you have ever attended a festival, a big
                                                     concert or any other event with many people,
                                                     you might be familiar with the following
                                                     scenario: you look at your phone and notice
                                                     that you have suddenly lost signal and all
                                                     connectivity to the outside world, meaning
                                                     that you are not able to share your experience
                                                     with your friends on social media and have no
                                                     chance of ordering a taxi or using a ridesharing
                                                     app. The reason behind this is that 4G
                                                     networks do not have the ability to connect
                                                     tens of thousands of devices in a small area at
                                                     the same time. 5G can handle 10 times higher
Overall, consumers have increased their              device density than 4G4. In other words, 5G
smartphone use for activities which require a        will allow more devices to be connected in the
high-quality network and there is no question        same network at the same time. This is a good
that 5G will allow even better connectivity and      thing, but one might question how frequently
faster speeds. However, as noted before, this        this advantage might be relevant to the average
does not seem to correlate with the consumer’s       phone subscriber in a given year.
interest in 5G at launch and the perceived
importance of the quality of the network.            Furthermore, 5G has a latency of about one
This raises the question: have we reached a          millisecond, which will improve the quality
point where we feel that the network quality is      of online gaming - although there are few
already good enough? If so, it will be interesting   examples outside of gaming where ultra-low
to see how the Nordic operators will be able         latency will matter. In the future, low latency
to convince all of their customers that the          enabled by 5G may be used for self-guided cars
investments into 5G networks are worth paying        to be able to work more reliably14 15. In addition,
more for, including acquiring (usually more          5G will work remarkably better in rapidly
expensive) 5G capable mobile devices.                moving vehicles, so we might finally get the
                                                     opportunity to say goodbye to lagging mobile
Consumers, this is your 5G                           network connections on trains and aircraft.
The fact is that 5G is much more than just a
faster 4G. 5G is a completely new network            Network slicing allows one common network
system with lots of benefits and opportunities       to contain multiple virtual networks. For
for some consumers. The usual benefits               consumers, this means that different devices
associated with 5G are the following:                connected to the internet can have their
                                                     own tailored “lanes’’ depending on what kind
1   Higher speed                                     of features these devices require to work
2   Significantly higher density                     optimally. For example, IoT applications do
3   Lower latency                                    not necessarily need a high data throughput
4   Network slicing.13                               but they might need very low latency, whereas
                                                     online video gaming requires a low latency
But what do these actually mean for                  and a high data throughput16. With 5G, it will
consumers? As expected, one of 5G’s key              be possible for consumers to experience high
advantages is that it will be a lot faster than      quality connections with all their connected
4G. With 5G, HD movies can be introduced to          devices as the “lanes’’ can be tailored to meet
mobile data subscribers in a completely new          the special requirements of each device.

Global Mobile Consumer Survey | Section 2                                                                  21
Industry Spotlight: Telco

Mobile contracts
– a real bargain?
Consumers demand quality service at a low price, and they’re getting it
- with one operator or another.

Telecom operators in the Nordics face challenges from     Deloitte expert take
regulation, high customer expectations and heavy          Continued investment in 4G and 5G networks, as
competition. The need to invest in both next-generation   well as the fibre optic backhauls, is critical in satisfying
radio access networks (5G) and the fibre optic backbone   the ever-increasing demand for data on-the-go. The issue is
to support the radio access networks is paramount to      not so much in peak speed, but rather overall network capacity.
remaining relevant to customers. Operators’ attempt to    While most consumers care little about how or what technology
diversify the revenue base and differentiate themselves   is used to deliver, they demand a smooth user experience for
towards customers have included bundling devices and      their data-based services and apps.
other services with the mobile contracts. What is the
impact of these efforts on customer perception and
behaviour?
                                                          “Consumer acceptance of poor
                                                          quality and unsatisfactory user
                                                          experience is continuously
Five highlights from the telco industry:                  declining which strains
1. Over 70 per cent of Nordic consumers have a
                                                          operators.’’
   post-paid mobile contract; 30 per cent have            – Jonas Malmlund, Nordic TMT Industry Lead
   a phone on the contract as well.
                                                          Consumers want ease-of-use and low prices
2. Predictable, low-cost network quality is very          The majority of Nordic consumers have a post-paid contract for
   important to more than half of all mobile              their mobile phone. Norwegians and Swedes are more likely to
   users.                                                 have their phone included on the contract than their Finnish
                                                          and Danish peers, although the share of Finns who have the
3. One quarter of the respondents switched                phone on the same contract has been gradually increasing.
   mobile operators within the last year and a
   half; a fifth have never done so.                      All characteristics or services offered by mobile operators
                                                          that are important or very important to more than four-fifths
4. Bundling services from mobile operators                of consumers are related to the price of the contract, the
   is decreasing in popularity, although home             quality and availability of the network and customer service.
   broadband tops the list.                               The availability of additional services, such as streaming music
                                                          or video, is important or very important to less than half of
5. Finns want unlimited data plans, while                 consumers, depending on the service in question. Interest
   Swedes bundle contracts and phones and                 in bundling other services from the mobile operators has -
   have lower churn.                                      after previous growth - declined since last year. Customers,
                                                          particularly Finns and Norwegians, will readily switch operators
                                                          for better networks, service or just a lower price.

22
Global Mobile Consumer Survey | Section 2   23
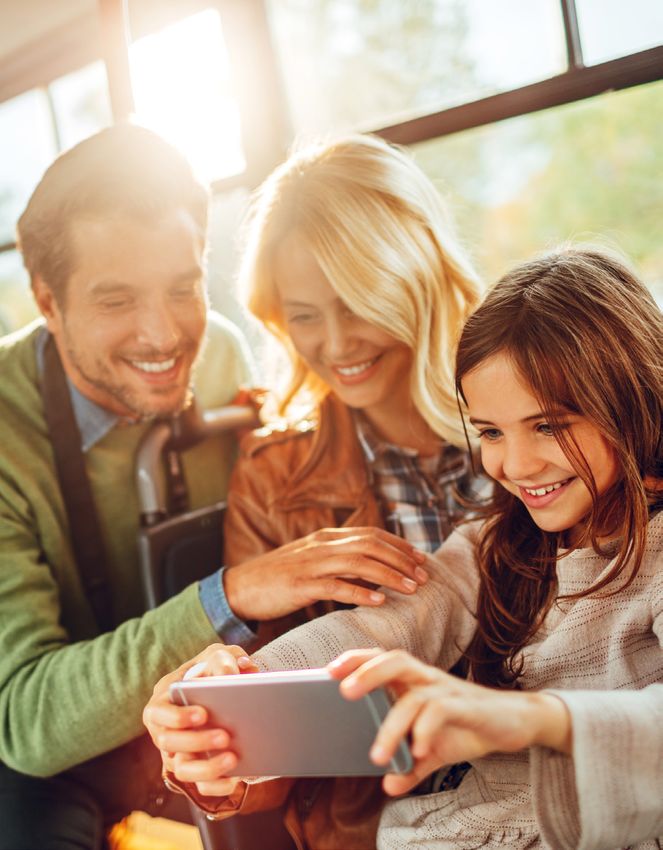
Social Media
– Mind the gap
Daily use rates and social media preferences reveal a gap across
generations. But will these differences persist, or will social media
behaviour converge in the future?

The use and frequency of social media apps         Figure 18. Usage of social networks on
continues to increase, particularly on a day-to-   mobile phone
day basis (Figure 18). Usage and mobile phone      How often if at all, do you use each of these on
access to social media continues to grow with      your mobile phone? - Social Networks
the ever-present nature of smartphones and
other devices that make user engagement                               60%
                                                             57%
with social media apps immediate and more           52%
frequent. Data compiled from this year’s survey
shows that the use of social media apps by all
adults, particularly when accessed through a
smartphone, has increased by eight percentage
points over the past two years.

                                                                                          12% 13% 13%                            10%
Keeping up with the Gen Zs                                                                                                                9%       9%
More than ever, social media underpins the
heavy use of smartphones. The advent of the
smartphone has made social media immediate            At least once a day                  At least once a week                        Less often
and instantly accessible. As expected, pre-teens
                                                      2017        2018        2019
(although not included in our survey) and young
                                                   Base for 2019: All adults 18-75 who have a phone or smartphone in Sweden (1775), Norway (942), Denmark (1042),
adults are at the forefront of social media
                                                   Finland (1035). Base for 2018: Sweden (1798), Norway (947), Denmark (1051), Finland (1050). Base for 2017: Sweden
trends, forming certain preferences, behaviours    (1769), Norway (947), Denmark (1028), Finland (1038). Source: Nordic edition, Deloitte Global Mobile Consumer
                                                   Survey, 2019, 2018 & 2017
and connections to social media. Although
older age groups often pick up these trends
after a while, generation gaps will persist.       livestream heinous crimes. Therefore, it would
                                                   be no surprise if most youngsters have a love/
Millennials lead the way                           hate relationship with their digital devices.
For years, millennials (1981-1996) and Gen         However, according to the 2019 Deloitte
Zs (1997 and after) have led the way in the        Millennials Survey, 71 per cent of millennials
adoption of social media. This adage holds true    feel positive about their personal use of digital
- but does not tell the full story.                devices and social media. Nevertheless, nearly
                                                   two-thirds (64 %) said they would be physically
Social media allow people to stay in touch and     healthier if they reduced the time spent on
access information, but they can also be used      social media, and six in 10 said it would make
with malice, to spread propaganda and even         them happier17.

24
Figure 19. Daily usage of social networks based on age groups
Which, if any, is your preferred device for each of the following activities? - Check social networks
       73%            74%
70% 69%
             66%                             65%
                              59%                                60%                                                                 61%
                                                                                        49%                   47%
                          39%       41%            40%                                                                                      38%
                                                         32%            31%                                                                       29%
                                                                                                                                       25%
                                               22%                            21%               20%
                                                                   17%                             14%                   16%
               10%                                                                           11%                               10%
                                        3%                 3%                                                       5%
                                                                                0%                       0%                                          2%

   Age 18-24                Age 25-34          Age 35-44           Age 45-54                 Age 55-64          Age 65-75                   Total

    Facebook              Snapchat           Instagam           YouTube             TikTok
Base for 2019: All adults 18-75 who have a phone or smartphone in Sweden (1775), Norway (942), Denmark (1042), Finland (1035).
Source: Nordic edition, Deloitte Global Mobile Consumer Survey, 2019.

Across all age groups, there are no trends which                              more common among older age groups while
indicate differences in the general use of social                             this was true for younger age groups a few
media. The proportion of respondents that                                     years back (Figure 20). With this in mind, we
use at least one social media app was similar                                 may consider it a general trend that older
across all age groups. Different patterns begin                               generations pick up the younger generations’
to emerge when the frequency of app usage is                                  behaviour, and that their usage tends to
considered. The 18-24-year-olds use the major                                 follow in the footsteps of the youngsters over
social media apps such as Facebook, Instagram,                                subsequent years. On the other hand, this
Snapchat or YouTube on a daily basis more                                     is not always true: some technologies, such
consistently than other age groups (Figure 19).                               as eReaders and smart watches, were more
Facebook is the most used on a daily basis                                    popular with older demographics first, and only
while other apps that are built on the premise                                over time migrated to younger generations.
of messaging and connectivity also score high
on daily use.                                                                 It is worth noting that the reasons for
                                                                              engagement on specific social media platforms
One thing is frequency of use, but our data also                              differ greatly across generations. Older
suggests that other perceived differences in                                  generations may form distinct social media
the way different generations use and interact                                preferences and habits once they start using
with social media are true. It appears that some                              more social media apps.
behavioural patterns present in younger age
groups are being passed on to older ones,                                     Will the Facebook wave die out?
but often after some time has passed. This is                                 While the total daily use of Facebook on
apparent in social media adoption, where the                                  smartphones has increased from 2017 to 2019
data shows that the proportion of millennials                                 for the 25-75 years old age group by between
who use social media has been consistent over                                 three and 11 percentage points, young adults
the past years while the share among older                                    (18-24) are bucking that trend: daily Facebook
groups has increased year after year. Similarly,                              users have declined from 75 per cent to 70 per
we see that daily use of Facebook is becoming                                 cent (Figure 20).

Figure 20. Facebook Daily Usage
Apps used on mobile phone - Facebook

75%                          72% 74%
       71% 70%
                      65%                    62% 62% 65%                                                                                            61%
                                                                              60%
                                                                        56%                                                          56% 59%
                                                                  52%                          49% 49%
                                                                                         42%                         44% 47%
                                                                                                              36%

   Age 18-24              Age 25-34            Age 35-44           Age 45-54                 Age 55-64          Age 65-75                   Total

    2017           2018        2019

Base for 2019: All adults 18-75 who have a smartphone in Sweden (1719), Norway (917), Denmark (994), Finland (978). Base for 2018: Sweden
(1736), Norway (916), Denmark (988), Finland (967). Base for 2017: Sweden (1769), Norway (947), Denmark (1028), Finland (1038).
Source: Nordic edition, Deloitte Global Mobile Consumer Survey, 2019, 2018 & 2017

Global Mobile Consumer Survey | Section 2
 75%
                                                                                                                                                          25
       71% 70%                72% 74%
                       65%                    62% 62% 65%                     60%                                                           59%     61%
                                                                        56%                                                           56%
                                                                  52%
                                                                                                49% 49%                        47%
Figure 21. Snapchat Daily Usage
Apps used on mobile phone - Snapchat

            69%
64% 67%

                           41% 39%
                     34%
                                                    22%                                                                             25% 25%
                                                                                                                             21%
                                          16% 19%                        17%
                                                               11% 14%                     11%
                                                                                     7% 9%
                                                                                                           3% 3% 5%

  Age 18-24              Age 25-34          Age 35-44            Age 45-54            Age 55-64                Age 65-75            Total

     2017         2018      2019
                                                                   Additionally, the differences in daily use among
Base for 2019: All adults 18-75 who have a smartphone in Sweden
(1719), Norway (917), Denmark (994), Finland (978). Base for 2018:
                                                                   age groups is greater than for other apps
Sweden (1736), Norway (916), Denmark (988), Finland (967). Base    compared in this report. The latest survey
for 2017: Sweden (1769), Norway (947), Denmark (1028), Finland
(1038). Source: Nordic edition, Deloitte Global Mobile Consumer
                                                                   showed that 69 per cent of 18-24-year-olds
Survey, 2019,
           69%2018 & 2017                                          used Snapchat daily, compared to 17 per cent
 64% 67%
                                                                   for the 45-54-year-olds and just five per cent
Although the proportion
                      41% 39% of Facebook                          for consumers aged 65-75. The disparity is
                 34%
users remains relatively lower among22%         older              likely due to the inherently ephemeral nature          of
                                                                                                                    25% 25%
                                        19%                                                                     21%
generations, they are the age groups
                                   16%
                                                with the11% 14% snaps:
                                                                    17%
                                                                           perhaps      young
                                                                                       11%    people      are more worried
                                                                            7% 9%                         5%
fastest annual growth rates18. This may be                                                    3% 3%
                                                                   about photos that stay up forever than 60-year-
a consequence of the adaptive, easy to use,
    Age 18-24       Age 25-34         Age 35-44            Age 45-54          Age 55-64         Age 65-75           Total
                                                                   olds are?
connective nature of the app and its function
as a tool for services beyond entertainment or                     Although the survey shows clear differences
self-promotion which other apps rely on. Across                    in the use frequency, the ways of interacting
the four Nordic countries, average Facebook                        on Snapchat creates another gap between
use across devices has been stable over the                        age groups. While older age groups mostly
past years, which indicates that the growth                        use basic features, younger age groups have
is mainly due to a preference for the mobile                       their own trends and obsessions. Trending
platform.                                                          now are personal blogs on Snapchat, as well as
                                                                   externally produced entertainment and news.
Nevertheless, the declining use amongst                            A 2018 Deloitte Norway Media Survey showed
younger age groups raises questions about                          that three in four Gen Z respondents used
the future of Facebook. Is the app simply                          social media to consume and read the news19.
well-suited to the needs of older generations,                     Interestingly, Norwegians of all ages have much
and will the networking effect make these                          higher daily use rates for Snapchat than the
consumers stick to Facebook? Or will the older                     other Nordic countries (Figure 22). About 40
generations also start exploring a broader                         per cent indicated daily use - more than twice
range of social media platforms? Indications                       the level of Denmark, which had the second
of slower growth in Facebook use amongst                           highest use rate. Additionally, Norwegian
consumers between 25-34, 55-64 and 65-75
years old from 2018-2019 means that it might                        Figure 22. Nordic Social Media Daily Usage
be hitting its peak in terms of numbers of users                    Apps used on mobile phone - Snapchat
in that age group.
                                                                               55%
                                                                                     45%
                                                                         42%
Daily Facebook usage is decreasing for                                                     41%           41%
                                                                                                                                 35% 35%
18-24-year-olds but increasing for all other age                                                                           28%
                                                                                                                                             24%   26%         27%
                                                                                                                                                         20%         21%
groups.                                                                                                        13%
                                                                                                                     18%
                                                                                                   10%
                                                                                                                                                                            2% 1% 1% 2%
Oh Snap! A yawning generation gap!                                             Facebook                  Snapchat                Instagram               YouTube                 TikTok
The popularity of Snapchat is not as even
                                                                               Finland           Norway          Sweden          Denmark
across all age groups as Facebook is. The daily
                                                                         Base for 2019: All adults 18-75 who have a smartphone in Sweden (1719), Norway (917), Denmark (994), Finland (978).
engagement has increased in all age groups
                                                                         Base for 2018: Sweden (1736), Norway (916), Denmark (988), Finland (967). Base for 2017: Sweden (1769), Norway (947),
except for the 25-34-year-olds, down slightly                            Denmark (1028), Finland (1038). Source: Nordic edition, Deloitte Global Mobile Consumer Survey, 2019, 2018 & 2017
from 2018 (Figure 21).

26                                                                                                                                             Section 2 | Global Mobile Consumer Survey
You can also read