HOW DO CONSUMERS VALUE NET NEUTRALITY IN AN EVOLVING INTERNET MARKETPLACE? - A REPORT INTO ECOSYSTEM DYNAMICS AND DEMAND-SIDE FORCES - BOR (15) 65
←
→
Page content transcription
If your browser does not render page correctly, please read the page content below
BoR (15) 65

  HOW DO CONSUMERS VALUE NET
NEUTRALITY IN AN EVOLVING INTERNET
         MARKETPLACE?

 A report into ecosystem dynamics and
           demand-side forces

               June, 2015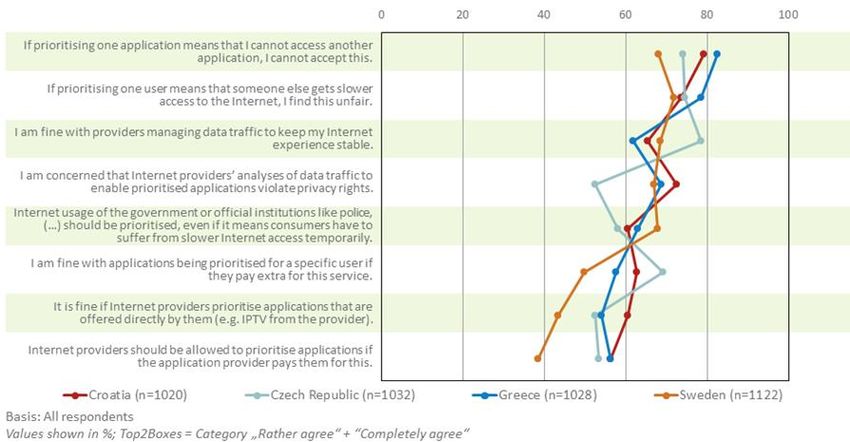
BoR (15) 65

Contents

I. Executive Summary ......................................................................................................... 3
II. Introduction ..................................................................................................................... 9
   1. Aims of the project ...................................................................................................... 9
   2. Approach of the project .............................................................................................. 9
    2.1. Desk research ........................................................................................................... 9
    2.2. Consumer research ................................................................................................. 10
   3. Structure of this report.............................................................................................. 12
III. How are consumers using the Internet? .................................................................... 13
   1. General trends ........................................................................................................... 13
   2. Fixed access .............................................................................................................. 13
   3. Mobile access ............................................................................................................ 14
IV. How do consumers value net neutrality? .................................................................. 16
   1. How different attributes are prioritised by consumers ........................................... 16
    1.1. Valuing different attributes ....................................................................................... 16
    1.2. Valuing levels of attributes ....................................................................................... 17
    1.3. Relationship between price and access to applications ........................................... 18
    1.4 Conclusions .............................................................................................................. 20
   2. Valuation of data caps and zero-rating practices.................................................... 20
    2.1. Definition and limits of zero-rating ............................................................................ 20
    2.2. Insights from the research ....................................................................................... 21
   3 Consumer attitudes towards traffic management and network neutrality ............. 22
    3.1. Attitudes towards traffic management across test areas .......................................... 22
    3.2. Attitudes towards net neutrality in general across test areas.................................... 22
    3.3 Conclusions .............................................................................................................. 24
   4. Consumer information .............................................................................................. 25
    4.1. Effectiveness of the information package in educating participants.......................... 25
    4.2. Impact of different types of information on purchasing decisions ............................. 25
    4.3. Conclusions ............................................................................................................. 26
   5. Switching ................................................................................................................... 27
    5.1. Inclination of consumers to switch provider in response to the traffic management
    features of the Internet access service ........................................................................... 27
    5.2. General willingness and ability to switch ISP ........................................................... 28
    5.3. Conclusions ............................................................................................................. 30
V. How does the ecosystem respond to the characteristics of consumer demand? ... 32
   1. Situation in the markets ............................................................................................ 33

                                                                   1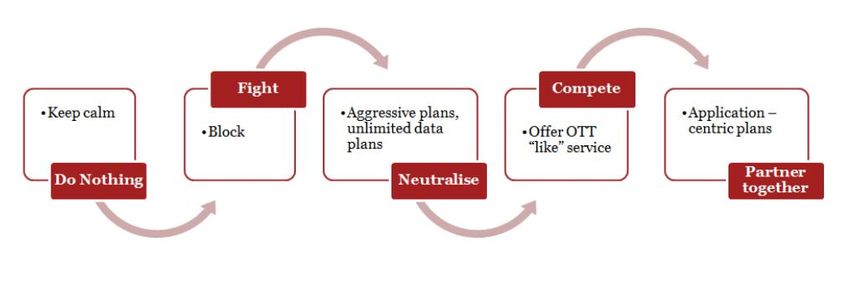
BoR (15) 65
a. Legal, political and public environment.................................................................. 33
b. Disputes and complaints ....................................................................................... 34
c. National situations regarding traffic management ................................................. 35
2. Incentives to behave neutrally.................................................................................. 37
a. Market efficiency – optimal responses to consumers’ valuations........................... 37
b. Influence of other stakeholders ............................................................................. 39
3. Ecosystem developments, including factors which may lead to “non-neutral
behaviour” ..................................................................................................................... 40
a. The ability of ISPs to test the market in a fast-moving environment ...................... 41
b. Technical factors ................................................................................................... 42
c. The positions of ISPs in the value chain................................................................ 42
4. Long-term implications ............................................................................................. 45
VI. What do these insights mean for the net neutrality debate? .................................... 47
Annexes
1. Desk Research on the Demand-Side of Internet use - PwC
2. Summary Report on the Value of Network Neutrality to European Consumers - WIK-
Consult, YouGov and Deloitte
3. Full Results Report on the Value of Network Neutrality to European Consumers - WIK-
Consult, YouGov and Deloitte
Figures
Figure 1: Relative importance of attributes by country ......................................................... 17
Figure 2: Utility scores comparing different price levels and levels of Internet access (Czech
Republic)............................................................................................................................. 19
Figure 3: Attitudes towards traffic management across test areas....................................... 22
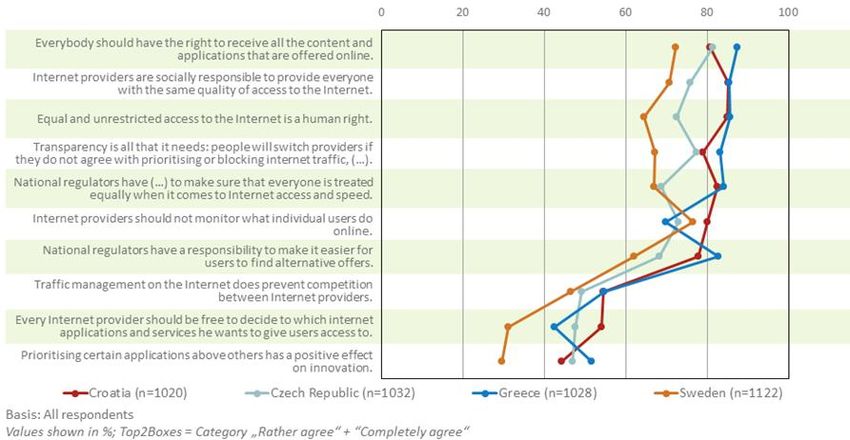
Figure 4: Attitudes towards net neutrality across test areas ................................................ 23
Figure 5: Inclination to switch ISP by country ...................................................................... 29
Figure 6: Reasons for not switching ISP.............................................................................. 30
Figure 7: Trends over the IP interconnection value chain .................................................... 43
Figure 8: Evolution of the ecosystem relationship between ISP and CAP ........................... 43
2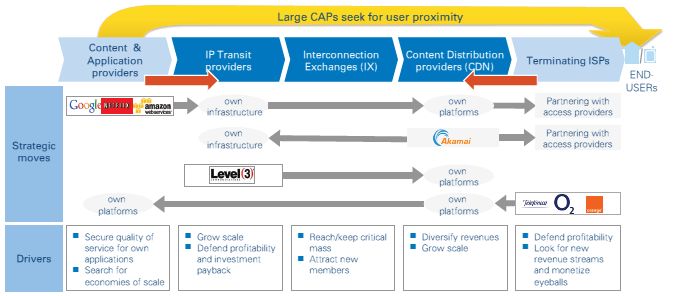
BoR (15) 65

I. Executive Summary

This report is intended to provide BEREC and National Regulatory Authorities (NRAs) with an
understanding of market dynamics relating to net neutrality, in particular from the end-user
perspective. It is designed to both inform BEREC’s general approach to net neutrality and to
support NRAs’ future analysis of their national markets, as well as to contribute to the
continuing public debate on the complex issue of net neutrality.

To explore these issues, BEREC commissioned two pieces of research in order to gather
material required to explore these issues - desk research1 to gather information already in the
public domain, such as how consumers are using the Internet and how the market is
developing; and a consumer research study2 to gain an understanding of how consumers
value net neutrality.

The consumer research was carried out in four countries - Croatia, the Czech Republic,
Greece and Sweden - which were selected to represent different typical European country
profiles. It was focused on a conjoint analysis in which respondents were asked to choose
between pairs of hypothetical Internet access service offers to reveal the relative importance
of different attributes. These attributes includes price and speed as well as traffic management
attributes, such as whether a package was subject to any restrictions or prioritisations.

Due to time and budget constraints, it was not possible to conduct the conjoint analysis
sections of the research for all elements of fixed and mobile technologies, and the chosen
focus was on usage at home. As a result, the consumer research focused on fixed Internet
access, although other parts of the research did allow for more general insights, thereby taking
some account of mobile usage. In addition to the conjoint analysis, respondents to the survey
were also asked questions on their socioeconomic backgrounds, Internet usage, and attitudes
about the Internet and net neutrality. As a preparatory stage, focus group discussions were
also conducted in each of the four countries to provide a basis for how to design the survey,
and they also provided some useful insights which are discussed in this report.

Consumer research findings

The consumer research examined to what extent consumers take certain attributes into
account when choosing an Internet access service. The results show that price is the most
important single attribute of the ones tested, with around 20% of the purchase decision based
on this. This is followed by speed, data cap level and level of access to video streaming, with
12% of the decision based on each of these factors.

Of the ten attributes included in the hypothetical offers that respondents were asked to choose
between, five were related to traffic management: levels of access to video streaming, to VoIP,
to P2P and to online gaming, as well as data cap levels, sometimes with specific data not

1This can be found at Annex 1: Desk Research on the Demand-Side of Internet use - PwC
2The summary report can be found at Annex 2 and the full study can be found at Annex 3: Summary
Report on the Value of Network Neutrality to European Consumers - WIK-Consult, YouGov and Deloitte
and Full Results Report on the Value of Network Neutrality to European Consumers - WIK-Consult,
YouGov and Deloitte

                                                3
BoR (15) 65
counted against the cap. The other five attributes related to criteria known to be important for
consumers’ choice of Internet access service: quality/stability of the Internet connection,
download speed, bundle options, price, and length of the contract.
Attributes of an Internet access service offer that relate to traffic management and net
neutrality play a significant role in consumers’ purchase choice decisions – of the ten attributes
used in this research, half of them were related to traffic management and net neutrality, and
up to half of the decisions of respondents were based on these attributes.
The research measured the relative preference for each attribute within the different options
given to respondents. It showed that having no data cap is far more attractive than either of
the two data cap options of 50 GB and 10 GB. The zero-rating of certain applications3 has a
limited effect when coupled with the 50 GB cap, but has more of an impact in increasing the
attractiveness of offers when the cap is 10 GB. When there is a data cap, out of all the different
application types, the zero-rating of video streaming is seen as most attractive.
The research also measured the preferred levels for each attribute (the “part-worth utilities”)
for access to the specific types of applications. It showed that respondents prefer normal
access to these applications. The level of attractiveness decreases slightly for prioritised
access, before decreasing more significantly for throttled and blocked access. Consumers
therefore seem satisfied with the current methods for accessing applications through best
effort Internet access.
In addition to the conjoint analysis, the survey contained a section on respondents’ attitudes
towards other aspects of net neutrality. The results from this section reveal that the majority
of consumers would not accept the prioritisation of one type of application if this meant that
they lost access to another type. The majority also feel that equal and unrestricted access to
the Internet is a human right. Between 60% and 80% respondents across the four test areas
are happy for Internet Service Providers (ISPs) to manage data traffic in order to keep their
Internet experience stable, while between 50% and 70% are happy for applications to be
prioritised for users who pay extra for this type of service. There was a certain proportion of
non-response to questions about innovation and competition, which suggests that consumers
do not know enough to consider these aspects of the debate. In the focus group discussions,
participants were more familiar with debates about online privacy and freedom of speech than
net neutrality.
The consumer research also gives insights about the effect of different types of consumer
information. In order to find out whether a technical understanding of traffic management and
how the Internet works has an effect on consumers’ purchasing decisions and their opinions
about net neutrality, the participants in the survey were split into two groups; one group was
shown an information package about how the Internet works, how and why ISPs manage
traffic and the possible effects of this on Internet users, while the other group did not see this.
Of those who saw it, this educational information had very little influence on their responses
when making purchase decisions. The close similarities between the two groups’ responses
3Zero-rating is a commercial practice by which consumers are able to access certain content, services
or applications without it counting towards any monthly data cap.
4BoR (15) 65
are likely to be a result of the way that the questions in the conjoint analysis section of the
survey were formulated. The description of the offers that both groups were asked to choose
between contained a brief, clear and effects-based explanation of the end-users’ experience
of certain applications, e.g. “slowed-down video streaming” or “prioritised VoIP”. Respondents
were therefore able to know the potential effects of traffic management practices without
having been educated about traffic management itself. These effects were presented to them
clearly and transparently, and they were able to choose between the offers on that basis. This
suggests that clear, transparent and effects-based information can be effective in helping
users to take traffic management practices into account when choosing an Internet access
service. It is encouraging that, in the research, it did not prove necessary for consumers to
have been educated about the technical nature and operation of traffic management to be
able to take account of relevant ISP practices in choosing a service provider.
For transparency to be effective, it is necessary for consumers to be willing to switch, and for
the switching process to be straightforward and easy. The research findings provided evidence
of consumer willingness to switch in response to the introduction of traffic management. A
significant majority of respondents across all countries say that they would switch in response
to some significant changes in the traffic management policies of their ISP. For example,
between 70% and 86% of respondents agreed with the statement “If my Internet provider
decreased the speed for video streaming unless I paid extra, I would switch provider”.
Likewise, the consumer research also shows consumers pay significant attention to, and
assign significant value to, the traffic management features in their choice of Internet access
package (although it is price which is the most important individual decision criterion for
consumers). However, these hypothetical responses may not translate into actual switching
behaviour – that depends on the ease of switching, consumers’ general desire to go through
the switching process, and the availability of alternative offers.
General readiness to switch underpins effective competition among ISPs, so a finding that
consumers feel unable or unwilling to switch provider should be a significant concern for any
NRA. The WIK-Consult consumer research found that between 50% (Czech Republic) and
73% (Greece) of respondents had switched at some point. They also found that the majority
of consumers in the test areas expressed satisfaction with their current ISP, and that a
perception of value-for-money was the most significant reason consumers cited for not
switching. However, a smaller but still significant proportion of consumers said they were not
considering switching, and over 20% of respondents in both Sweden and Croatia stated that
there are no other providers available for their household. The fact that at least half of
consumers have switched at some point suggests some degree of effectiveness of the
switching process. However, it is a matter of judgement, possibly specific to individual
countries, as to which level of switching and other factors would indicate that the market is
operating effectively and that barriers to switching are not excessively restricting competition.
If an NRA considers that there are significant barriers to switching and unsatisfactory levels of
competition in the market, a net neutrality policy which emphasises transparency and
consumer choice is unlikely to be appropriate, whatever general position is held on net
neutrality regulation. However, the fact that the consumer research identified that consumers
are sensitive to traffic management features that restrict access to popular types of Internet
application suggests that an emphasis on transparent, effects-based information and
5BoR (15) 65
consumer choice may be appropriate where an NRA considers there is effective competition
in the market and consumers are willing and able to switch.
The consumer research attempted to find the economic value that consumers give to the
different levels of the attributes tested, by setting different levels of these attributes (e.g.
normal access, prioritised access, slowed-down access or blocked access) against different
price levels that were used in the conjoint analysis. In relation to data caps, it was found that
offers with a 10 GB data cap were valued at around a third of a price level lower than a 50GB
cap and one price level lower than non-capped offers. Also, the value of normal access to
video streaming is worth around one price level more than an offer with video streaming
applications slowed down.
Developments in the market
BEREC and the European Commission’s 2012 Traffic Management Investigation found that
80% of consumers do not suffer from any non-neutral restrictions in fixed networks. The
current offers in the market still appear to be predominantly “neutral” (i.e. exempt from
differentiation practices), although there are exceptions to this, more often in the mobile
environment than for fixed networks. A number of differentiation practices have been reported
as worth monitoring, including zero-rating.
It is interesting to consider why the market seems to be largely consistent with net neutrality
principles. In the consumer research on fixed Internet access, consumers’ higher valuations
of non-capped services with normal access to applications provide an incentive for ISPs to
offer these services. The incremental cost of offering unlimited access as opposed to capped
access is low for fixed Internet, unlike mobile where the cost is more substantial. It is possible
that an ISP could combine data caps with zero-rating, or the threat of blocking, to incentivise
payment from the supplier of content, as zero-rating has a certain value for the content
provider. It is hard to predict how high this level of income could become, but it seems unlikely
that the revenues from a popular video streaming content provider could approach the
significant levels4 that would be required to compensate the consumer for the introduction of
a 10 GB data cap. Therefore, in the context of the research findings, it would seem to be
sensible for ISPs to offer neutral, uncapped services, even if they may also offer some
differentiated services.
The research does not examine the value that consumers give to application types that are
not yet widely popular. It would be fair to assume that the decrease in consumers’ valuations
of offers that do not allow normal access to these types of application would be lower than the
levels mentioned above for video streaming. However, it is also likely that the payments that
could be made by the providers of these types of applications to ISPs would also be lower, as
a result of their lack of popularity. From these insights, the market for fixed Internet access
would appear to be efficient.
4 As explained in more detail in section V.2.a, this was calculated as being roughly €14 per month in
Greece, roughly 200 kr per month in Sweden, roughly 200 Kč per month in the Czech Republic, and
roughly 80 Kn per month in Croatia
6BoR (15) 65
There are many possible reasons for the instances of non-neutral offers, where these do
appear in the market. It is possible that ISPs underestimate the value that consumers give to
unrestricted access to the Internet. ISPs might not yet know what services are profit-
maximising and would not want to apply restrictions that could possibly damage their business.
It could also be that ISPs have a more individualised approach that allows them to identify
more differentiated segments of the population, some of whom may be more attracted to
cheaper, non-neutral offers, where this is permitted under national rules. It is also a viable
option for ISPs to provide cheaper offers based on differentiation of access speed and/or data
volume, which would not raise concerns regarding net neutrality.
The Internet access ecosystem has already partly responded to the issue of increasing traffic
and the increased use of applications that require more bandwidth with the emergence of
CDNs. Technological progress and competition have led to an ongoing decline of transit
prices, as well as prices for CDN services, all of which has enabled the Internet to cope with
the increase in traffic. Large content providers are increasingly investing in their own
infrastructures and CDN services, thereby trying to exploit economies of scale. It seems
plausible that direct interconnection agreements between content providers and terminating
ISPs might gain in significance.
Conclusions
In the broad net neutrality debate, the overall goal is the continued operation of the Internet
as an open environment, enabling innovation and competition among service providers and
enabling choice and freedom to communicate for consumers. The debate about net neutrality
regulation is about the necessity for, and the form of, regulation to secure this outcome. The
longer-term implications of the choices made by consumers, and of the broader societal
implications of restrictions to Internet access, such as the possible impact on network effects
of future applications, are important elements of the debate, and ones which regulators must
take into account.
Another essential consideration in this regulatory debate is the extent to which consumer
behaviour, and the economic incentives and behaviour of ISPs, can be relied upon to maintain
an open, innovative Internet. The research commissioned for this report sought to explore this
question, primarily for fixed Internet access.
This report, and the underlying research, does not help determine whether the broad benefits
of open Internet access require that all ISP services are neutral or unrestricted. Nor does it
help determine whether it is merely necessary for such neutral services to predominate in the
market, even if some providers offer – and some consumers choose – Internet access services
which are in some way restricted. The evidence from the research suggests that consumers
tend to prefer Internet access packages with normal access to popular applications, and that
these are likely to be economically attractive for ISPs to offer. As long as there is transparency,
and consumers are able easily to switch provider, such services seem likely to predominate,
as they do at present.
However, it also seems possible that there are consumers who would prefer restricted Internet
access services at sufficiently low prices, and that ISP provision of such services will also be
economically viable, alongside the provision of open, unrestricted services, if permitted under
national rules. An alternative would be to offer packages with lower access speed or data
7BoR (15) 65
volume at reduced prices, which would allow end-users to decide how they use their Internet
access.
The research shows that consumers put most emphasis on price in their purchase decision of
an Internet access service, but also base their purchase decision on attributes that relate to
traffic management. They prefer normal access to the application types that were included in
the survey, and offers without data caps are most attractive to them.
Transparent, effects-based information can be effective in helping consumers with their
purchase choice decision, and is more effective than educating them about the technical
nature and operation of traffic management. However, for transparency to be effective,
consumers need to be willing and able to switch. A significant proportion expressed a
willingness to switch should their ISP introduce non-neutral traffic management practices, and
at least half have already switched in all four test countries. Nevertheless, a significant minority
of respondents reported that they had no real choice of alternative provider.
It is difficult to predict how significant a proportion of the market might be captured by restricted
services in the long run; but without specific net neutrality regulatory policies they are likely to
be available in the short term (as at present). If the policy is that such restrictive services must
not be available, in order to capture the broad benefits of open Internet access, prescriptive
regulation may be necessary. However, if policy-makers consider that sufficient benefits of
open Internet access will be realised through a market structure which includes some
restricted services but in which open Internet access is predominant, then competition,
transparency and consumer switching would likely be sufficient. Under all circumstances, it
will be important for NRAs to monitor the nature and transparency of ISP offerings, the access
services which consumers are choosing, their effects on innovation, as well as levels of
competition and ease of switching – and to consider intervention if necessary.
8BoR (15) 65
II. Introduction
1. Aims of the project
The focus of much of BEREC’s Net Neutrality work in previous years5 was on considering the
relevant amendments to the 2009 revisions to the Regulatory Framework for Electronic
Communications, and what NRAs and other players should do to implement them. This work
was mainly comprised of recommended approaches to potential problems. In particular,
BEREC’s December 2012 report on Differentiation Practices and Related Competition Issues
in the Scope of Net Neutrality6 report suggested problematic market developments which may
emerge.
Following these pieces of work, BEREC was keen to find out to what extent these potential
problems are actual problems. We wanted to better understand developments in the market
and what they mean to consumers.
Where BEREC did do some factual work – in the 2012 Traffic Management Investigation
carried out with the European Commission7 – we discovered that, while ISPs faced the same
constraints (e.g. increasing traffic load in the network, competitive markets) they applied
different restrictions or prioritisations, or none at all. Therefore, a key motivation for this project
was to dig deeper and try and understand why ISPs might act in certain ways, for instance in
response to consumer expectations or market incentives.
The objective of this report is to provide BEREC and National Regulatory Authorities (NRAs)
with a more in-depth understanding, particularly from the end-user perspective, of market
dynamics which are relevant to net neutrality. This report is therefore designed to both inform
BEREC’s general approach and to support future analysis by NRAs of their national markets,
enabling them to adapt our regulatory approach to reflect a better understanding of how
consumers and providers interact.
We also hope that the report, and the underlying research we are publishing alongside it, will
provide a useful contribution to the continuing public debate on the complicated and multi-
faceted issue of net neutrality.
2. Approach of the project
At the outset of the project, BEREC considered what information it would need to explore the
issues mentioned above. As a result, we commissioned two pieces of external research.
2.1. Desk research
We determined that much of the information we would be looking for - how consumers are
using the Internet and how the market is developing - existed in the public domain. This was
information that could therefore be gathered through desk research, and BEREC
commissioned a study from PwC for this purpose, which can be found at Annex 1.8
5 BoR (12) 146 Summary of BEREC positions on net neutrality
6 BoR (12) 132 BEREC Report on differentiation practices and related competition issues in the scope
of net neutrality
7 BoR (12) 30 BEREC findings on traffic management practices in Europe
8 BoR (15) 65 Annex 1 Desk Research on the Demand-Side of Internet use - PwC
9BoR (15) 65
2.2. Consumer research
The area where we found detailed publicly-available analysis to be lacking was an
understanding of how consumers value net neutrality. When BEREC looked at what relevant
consumer research existed, we did find some research into consumer understanding and
perceptions of traffic management. But we did not come across anything in the public domain
which quantified the economic value which consumers place on net neutrality.
BEREC therefore published a procurement process for a consumer research study.9 We
considered a standard consumer survey approach where consumers could be asked about
their opinions but we did not believe this would provide sufficient insights about how
consumers value net neutrality when they make purchasing or switching decisions. Instead,
we sought something more granular and detailed - a quantitative economic exercise which
would provide empirical data to draw upon. By using a conjoint analysis approach, as
described on page 12, we hoped to get an understanding of the economic value which
consumers place on different kinds of restrictions on their Internet access – or completely
unrestricted access – when they choose their Internet package.
The procurement was won by WIK-Consult, YouGov and Deloitte. Their summary report can
be found at Annex 210 and their full study can be found at Annex 3.11 The different components
of the consumer research are described in the box below.
Choosing such a granular and detailed approach presented two main trade-offs, given the
budgetary and time constraints of the project. First, it was only possible to carry out the
research in a small number of countries. We considered this to be a necessary trade-off in
order to acquire information which could add real value to the debate and enable us to more
fully explore the issues at hand. We therefore required the consultants to design the research
to take account of, and be representative of, practices in all EU countries.
The selection of countries was done through a segmentation exercise which identified clusters
of typical country profiles from which the consultants selected the four countries in which to
carry out the research. The segmentation exercise used a number of salient indicators to
represent characteristics of the Internet marketplace, such as levels of developments of the
infrastructure and levels of participation in the market.12 While the exercise focused primarily
on a selection of market indicators, the consultants also sought to achieve diversity in the size
and geographic location of the countries selected. In this way, the findings provide a proxy for
the different types of national markets in Europe, making the overall findings broadly
representative of Europe as a whole.
Another necessary trade-off was that it was not possible to fully cover all variations of fixed
and mobile technologies in the consumer research. After some reflection, it was decided to
focus on the home usage of access to the Internet, rather than usage outside the home. For
9 The value of network neutrality to European consumers 2013/S 243-422077
http://ted.europa.eu/udl?uri=TED:NOTICE:422077-2013:TEXT:EN:HTML
10 BoR (15) 65 Annex 2 Summary Report on the Value of Network Neutrality to European Consumers
- WIK-Consult, YouGov and Deloitte
11 BoR (15) 65 Annex 3 Full Results Report on the Value of Network Neutrality to European Consumers
- WIK-Consult, YouGov and Deloitte
12 See sections 4.1 and 4.2 of the WIK-Consult, YouGov and Deloitte Full Results Report
10BoR (15) 65
the purposes of this report, home usage referred to all devices connected to a fixed Internet
connection in the home.13
While NRAs would tend to distinguish between fixed and mobile access, it was felt that looking
at usage situations would be more intuitive for consumers (the subjects of the research). While
BEREC’s 2012 Traffic Management Investigation reported the existence of restrictions on both
fixed and mobile networks, it was noted that home usage covers a far larger proportion of the
bandwidth use which can be subject to traffic management restrictions (e.g. video streaming
and file-sharing). Indeed, as shown in Annex 1, mobile traffic only accounted for 3% of total
Internet traffic in Western Europe in 2013. While some elements of the consumer research
also considered consumers’ Internet usage outside the home, the quantitative economic
exercise which provided the bulk of the research findings consequently looked only at home
usage.
Components of the consumer research study
- Preparatory stage
This stage of the research provided vital information to help frame the consumer survey which
would provide the bulk of the research findings.
In particular, information was sought to gain a solid basis for preparing the information
package which would be provided to half of the consumer survey respondents. This included
a review of the existing research into consumer understanding of, and attitudes to, traffic
management and net neutrality. However, the main input was qualitative consumer research
in the form of a series of Focus Group discussions with consumers in each of the test
countries. As well as informing the design of the information package, the Focus Group
discussions also provided some useful insights which we draw on in this report.
This preparatory stage also included desk research and meetings with NRAs to gather
information about the markets of each of the test countries.
- Consumer survey
The majority of the study’s findings come from the quantitative research which took the form
of a consumer survey which was carried out in the test countries. The survey aimed to
quantitatively assess the extent to which aspects of net neutrality influence a consumer’s
choice for a given Internet access service.
13 The consultants defined home usage as “all devices connected wired and wirelessly to the Internet
through the main (stationary) Internet access of the household, which also includes mobile access
technologies as substitutes for fixed access e.g. LTE at home or USB dongles for private usage”. They
distinguished this “At Home” usage from “Out of home”, which they defined as all wireless devices used
on networks outside the home including mobile networks, and commercial and open WiFi hotspots.
11BoR (15) 65
The survey was composed of two parts, the first being a conjoint analysis experiment.14
Such experiments require respondents to make a series of trade-offs, and the resulting
analysis reveals the relative importance of the component attributes. In this case, the attributes
were different elements of an Internet access package, such as price, speed and brand, as
well as traffic management related attributes, such as whether a package was subject to any
restrictions or traffic management.
The second part of the survey asked a series of questions in order to investigate consumers’
socio-demographic and other relevant characteristics, their attitudes, and their Internet usage
patterns.
In order to achieve this, the participants in the survey were split into two groups; one group
was shown an information package about how the Internet works, how and why ISPs manage
traffic and the possible effects of this on Internet users, while the other group did not see this.
The design of the information package was built on insights gained from the focus group
discussions, where it became apparent that consumers struggled with technical terminology,
and preferred descriptions related to their own experience of using the Internet, as well as the
inclusion of illustrations where possible. Therefore it was presented in the form of a short video
clip that combined text with animated illustrations.15
3. Structure of this report
This BEREC report has been structured into four questions:
1. Section III - How are consumers using the Internet? This short section is designed to
provide a context for the report by describing the main characteristics and uses of fixed
and mobile Internet access offers. It is drawn from the desk research.
2. Section IV - How do consumers value net neutrality? This section looks at the insights
to be drawn from the consumer research to understand consumer preferences,
expectations and attitudes in relation to Internet access products and net neutrality.
3. Section V - How does the ecosystem respond to the characteristics of consumer
demand? This section draws on the desk research and on market developments reported
by NRAs to understand how incentives, and emerging relationships with other market
players, influence the design of ISPs’ offers to consumers.
4. Section VI - What do these insights mean for the net neutrality debate? This closing
section reflects on the findings in the previous sections and looks at implications for policy-
makers and regulators.
14 More information about the exact Adaptive Conjoint Analysis approach used can be found in section
5.3 of the WIK-Consult, YouGov and Deloitte Full Results Report
15 The individual frames can be seen in section 6.7.3 of the WIK-Consult, YouGov and Deloitte Full
Results Report.
12BoR (15) 65
III. How are consumers using the Internet?
1. General trends
In the past twenty years or so, the Internet has been playing an ever increasing role in people’s
lives. Ten years ago, the number of Internet users globally amounted to 1 billion. In 2015, the
number is expected to surpass 3 billion, with more than 50% of them having mobile Internet
access.
People all over the world have abandoned their old fixed dial-up Internet access and are
increasingly opting for high-speed broadband. As part of this trend, consumer Internet usage
has shifted from text-based activities to mostly video traffic16, which already accounts for more
than 50% of world Internet traffic17 and is expected to further rise to 79% by 2018.18 For
comparison purposes, watching a minute of video online consumes 200 times more data than
sending a basic email.
Internet consumption seems to be further intensified by the increased adoption of devices
such as smartphones and tablets that are optimised to access data-heavy Internet
applications. Globally, it is expected that Internet traffic will grow four-fold between 2013 and
2018, and that in 2018 it will be 64 times the volume of what it was in 2005.
However, significant traffic increases could also be observed in the past. Given this, it is
important to note that so far the Internet has been able to cope well with this traffic increase,
as BEREC has shown in its IP interconnection report.19 This is particularly due to competition
and technological progress: e.g. router costs per Gigabyte (GB) were subject to a continuous
decline in the past; a similar development could be observed for network capacities (large
economies of scale) and competition has continuously driven down transit prices in the past.20
Also, the emergence of Content Delivery Networks (CDNs) contributed to effectively cope with
the traffic increase. Generally, the Internet ecosystem has managed to adapt its IP
interconnection arrangements to reflect, among other things, changes in technology, demand
patterns and business models.
Other activities that consumers value and use the Internet for are general searches, e-mail
exchanges and social networking. Consumers demand high-speed broadband performance,
continuous availability, value for money and rich online user interactivity and experience. The
large amounts of traffic that they generate, especially as a result of video and audio streaming
services, puts pressure on Content and Application Providers (CAPs) and ISPs, which in turn
try to respond to rapidly evolving consumer trends and behaviour.
2. Fixed access
As Europe comprises a mix of developed and emerging markets, with various cultural,
economic and linguistic differences, and differences in penetration and availability, it is a
16 http://www.accenture.com/SiteCollectionDocuments/PDF/Accenture-Video-Over-Internet-
Consumer-Survey-2013.pdf
17 http://www.Internetsociety.org/sites/default/files/Global_Internet_Report_2014_0.pdf
18 http://www.cisco.com/web/solutions/sp/vni/vni_forecast_highlights/index.html
19 BoR (12) 130 An assessment of IP Interconnection in the context of Net Neutrality
20 BEREC concluded that “the expected volume increase will not require a significant CAPEX
increase in fixed network. There is no evidence that cost are skyrocketing due to traffic
increase.” (ibid, p. 58).
13BoR (15) 65
challenge to assess the available applications and usage patterns. However, the desk
research we drew on attempted to give an accurate estimation of Internet traffic and
consumption rates in Europe.
In terms of Internet traffic through fixed lines, Cisco estimates that the average European in
Western Europe will generate about 39 GB of Internet traffic per month per connection in 2018,
an increase of 110% from 2013.21 In Central and Eastern Europe the average user will
generate 27 GB of Internet traffic per month in 2018, a 95% increase from 2013.
The highest share of this traffic is generated by video/audio streaming services, especially in
countries where Internet-based video services are available. In terms of downstream traffic in
peak time, the top bandwidth consuming activity across all European countries is streaming
of video and music, which averages around 43%, while web browsing and file sharing are in
second and third place, accounting for 19% and 12% respectively. The upstream traffic
however is dominated by social networking (40%), followed by video/audio streaming (19%)
and web browsing (12%).
Overall, about 70% to 75% of total traffic originates from a small set of popular bandwidth
consuming activities (e.g. YouTube, Skype and Facebook) that are available in most countries.
The rest of the traffic originates from activities that are available only in some countries (e.g.
Netflix, BBC iPlayer).
It is expected that, by 201822, online video and digital TV will be the most highly penetrating
services for fixed networks.
Together with the growth of Internet applications that use rich and data-heavy media such as
high-bitrate Super HD video, the increase in traffic per connection is also associated with the
rise in higher bandwidth connections. Increasingly, consumers are expecting the Internet to
function instantaneously, increasingly reliant on high speeds.
3. Mobile access
Assessing the usage patterns of mobile networks across all European countries is equally, if
not more, difficult than the analysis of fixed networks, due to cultural, economic and
technological diversities. However, one thing that seems unaffected by these differences is
the monthly subscriber consumption which has remained relatively static across many
European countries. In the first half of 2014, the mean monthly usage over mobile networks
for European consumers was observed to be 397 MB, an increase of over 11% from 358 MB
observed six months before.
While in 2013 mobile traffic used to be only 3% of total Internet traffic in Western Europe, it is
projected to grow to 10% in 2018, achieving a compound annual growth rate of 50%.23 In 2018
it will be the equivalent of four times the volume of all Western European Internet traffic in
2005.
The penetration of mobile internet subscriptions in Europe was 68% by the end of 201324,
growing at a rate of 33% (compound annual growth rate, CAGR), and by the time of this report
it is likely that mobile Internet penetration will have overtaken fixed, which was 75% at the end
21 http://www.cisco.com/web/solutions/sp/vni/vni_forecast_highlights/index.html
22 http://www.keepeek.com/Digital-Asset-Management/oecd/science-and-technology/measuring-the-
digital-economy_9789264221796-en
23 http://www.cisco.com/web/solutions/sp/vni/vni_forecast_highlights/index.html
24 http://www.itu.int/en/ITU-D/Statistics/Documents/facts/ICTFactsFigures2013-e.pdf
14BoR (15) 65
of 2013. This trend shows that many consumers prefer using their mobile devices (such as
smartphones and tablets) on the go instead of their PCs/laptops when at home or the office.
Smartphones in particular have changed the way consumers use their handsets. In
combination with high-speed mobile networks, the mobile broadband Internet services
available via handsets can eventually be seen as a substitute for fixed broadband access
services.
For most mobile networks, video/audio streaming is the leading category, accounting for 33%
of the total traffic in peak periods. Social networking and web browsing are the second and
third most popular categories with a share of 20% each. Cisco estimates that video streaming
will make up most of the traffic in the near future, with levels approaching 56% in 2017. This
hunger for more capacity and speed is fed by the availability of smart devices with bigger
screens, consumer demand for high-quality video, the ease of use of on-demand video
streaming services and the upgrade of mobile networks to 4G.
As a consequence of this trend, a key challenge for mobile network operators in the near
future will be to address the increasing demand for higher mobile network capacity and to
keep up investment in networks as well as developing more efficient technological standards.
At the same time, the strong interest among consumers for high speed Internet access
represents a significant economic opportunity for operators. This trend is expected to continue
with more advanced network generations, such as 5G.
15BoR (15) 65
IV. How do consumers value net neutrality?
This section looks at various insights which BEREC gained from the consumer research,
related to:
1. How different attributes are prioritised by consumers
2. Valuation of data caps and zero-rating practices
3. Consumer attitudes
4. Consumer information
5. Switching
As mentioned in section II.2.2 above, the consumer research was carried out across four
countries which were identified as being representative of the diversity of the European
Internet access markets. It is therefore interesting to observe the extent to which the research
suggests there are common trends between the countries.
In looking at the five areas of insight from the consumer research below, we draw out some
differences between countries. However, it is notable that trends for Internet usage are
substantially homogenous across all the test areas. Internet access is no longer seen as
dispensable, with consumers in all countries valuing the ability to be able to always get online.
Usage of devices and applications is almost exactly the same in all four countries: email/web
browsing, video streaming, instant messaging and social networks are the most used
applications; laptops and smartphones are the devices used most frequently to access the
Internet; and the least used devices are games consoles and smart TVs. It is also noteworthy
that the economic asymmetries between the test countries did not significantly impact the
general similarities between the results of all four countries.
1. How different attributes are prioritised by consumers
1.1. Valuing different attributes
As explained in the grey box in Section II, the consumer research included a conjoint analysis
survey to find out how consumers value net neutrality.25 The goal of this part of the survey was
to determine respondents’ preferences in terms of offers for stationary Internet access at
home. Figure 1 below shows the importance of the different attributes tested in the conjoint
analysis for each country. The overall picture shows similar patterns in the different countries.
Price is the most important attribute in all countries, accounting for about 20% of respondents’
decisions made in the conjoint analysis.26 Download speed, data cap, and video streaming
are the second most important, yet are each roughly half as important as price. Speed and
price are the most common differentiation attributes for fixed broadband subscriptions. One of
25 There were no significant differences between the control group not receiving the information package
and the ones who did.
26 While the specific conjoint method chosen (Adaptive Conjoint Analysis) was the preferred option, it
should be noted that this method tends to underestimate the relevance of price in most empirical
studies, as explained in footnote 175, on page 391 of the WIK-Consult, YouGov and Deloitte Full
Results Report
16BoR (15) 65
the application-specific attributes (video streaming) is as important for the consumers as the
most common attribute used for differentiation, download speed.
Figure 1: Relative importance of attributes by country27
Data caps (both with and without zero-rating, where specific applications are exempted from
the data quota) and the ability to stream videos online are attributes that are application-
specific, and which to some extent relate to net neutrality, although net neutrality implies
unrestricted access to all applications.
Based on these results, to what extent can we draw conclusions regarding how consumers
value net neutrality? Does this imply that net neutrality would be an important consideration
for consumers in their purchase decision? Price is considerably more important than access
to each of these application types. When consumers value access to their most important
application types, it does however not imply that the same would apply to any other application
type, in particular not to new and emerging ones.
1.2. Valuing levels of attributes
While the relevance of attributes reflects the importance of whole attributes in the purchase
decision making process of respondents, it does not give any information on which specific
levels of attributes are preferred by respondents. Conclusions on preferences with respect to
attribute levels have to be made on the basis of part-worth utilities.28
Offers without a data cap are, unsurprisingly, clearly preferred over those containing any type
of data cap. Data caps with a 50 GB limit are preferred over those with a 10 GB limit. When a
cap is as high as 50 GB, zero-rating has a very limited effect on consumer preferences. The
zero-rated alternatives are relatively more attractive when consumers are more likely to use
up their data allowance, as is the case when it is 10 GB. Among the options for zero-rated
applications, zero-rating of video streaming applications was the most attractive to
respondents.
Unrestricted and unprioritised access to applications (video streaming, VoIP, P2P and
gaming) is typically the most attractive across all countries. This means that normal usage29
27Figure 7-29 of the WIK-Consult, YouGov and Deloitte Full Results Report
28Part-worth utilities reflect the value an attribute level has to respondents relative to another level of
the same attribute. More information can be found in section 5.3.6 of the WIK-Consult Full Results
Report
17BoR (15) 65
is most attractive. The level of attractiveness decreases somewhat for prioritised access, and
then decreases substantially for restricted access to video streaming applications. Blocked
access is clearly the least preferable.
To what extent can we draw conclusions regarding how consumers value net neutrality based
on their preference for normal access to these applications? Since normal access is preferred
over differentiated access, it indicates that consumers seem satisfied with the current method
for accessing applications via best effort Internet access, which is an important characteristic
of net neutrality. However, the conjoint analysis could not measure all elements of net
neutrality - normal access to specific applications is not the same as a completely application-
agnostic Internet access service, which is another typical characteristic of net neutrality, and
which was not measured by the survey. However, we did gain some insights in the attitudinal
questions asked in the survey and in the focus groups (see section IV.3 below).
1.3. Relationship between price and access to applications
For further analysis of the value of network neutrality to consumers, the relationship between
price and application-specific attributes was investigated. Analyses were performed by
systematically varying the price as well as the accessibility of specific Internet applications. By
simulating offers with different price points and different types of access to P2P/file-sharing,
VoIP services, video streaming and online gaming, utility scores for these offers were
calculated. Other attributes were held constant by including the most attractive level across all
offers simulated per country. Brand was excluded from this principle. Subsequently, utility
scores of one offer (i.e. a specific price and application-specific attribute level) were averaged
across all brands.
Utility scores decrease slightly for prioritised access compared to normal access. Figure 2
below presents the results for the Czech Republic. The results in the other countries show
only minor deviations from this. The lower left graph presents figures for video streaming.
Following the utility levels of the different prices, we can see that, out of four levels, slowed-
down access with the lowest price level has about the same utility score as normal access
with the second lowest price level. This implies that an ISP would be able to make an offer
with slowed-down access that has the same utility as an offer with normal access by lowering
the price by one level (taking into account the price levels used in this survey).
For a differentiation of service from normal to prioritised access only a marginal shift in price
is needed to offer the same utility to a customer. For online gaming, P2P/file-sharing and VoIP
services, the utility for slowed-down access with the lowest price level is higher than normal
access with the second lowest price level. Blocked access of VoIP with the lowest price level
has the same utility as normal access at the second lowest price level.
29 In the conjoint analysis the application-attributes had the following explanation:
“In some cases access to certain applications can vary. You will see the following levels:
Can be used normally
Is prioritised: This means you will have a very stable connection when using this application,
without disruptions like sudden slowdown or reloading.
Is slowed down: This means you will have a slower connection when using this application, so
it can be more often disrupted by e.g. slowdowns or reloading.
Is blocked: This means that the application cannot be accessed at all with this offer.”
18BoR (15) 65
For reduced access to video streaming, the level of utility decreases more sharply than for
other applications. Thus, the price of a package with slowed-down or blocked access to video
streaming would have to be decreased more to be able to offer the same level of attractiveness
as a package with normal access than it would have to be for other application types. There
are differences in preferences among consumers. The consumer segmentation shows that
some consumers place relatively more importance on the accessibility of specific Internet
applications. They use these applications more often and are more sensitive to not having
normal access. Others are relatively more likely to be driven by price. These consumers are
less frequent users of these Internet applications. This shows that a certain proportion of
consumers are more likely to respond to quality-differentiated offers from the ISPs.
Figure 2: Utility scores comparing different price levels and levels of access to the Internet (Czech
Republic)30
It should be noted that Figure 2 above shows the value of normal access to selected
applications that are well-known to consumers, and it is the value of access to these
applications that is investigated here, and not application-agnostic Internet access.
Furthermore, the more popular an application is, such as video streaming, the higher the value
of being able to access it. Therefore, a relevant question to ask is what value a new, unknown
application would have. Extrapolating the values of the applications in the survey seems to
indicate a low value for new applications with few users, which are by definition relatively
unknown before they are potentially able to attract more users. The research does not provide
explicit answers to this question, but we could imagine that consumers might not give much
weight to access to new, unknown applications in their purchase decision.
30 Figure 7-52 of the WIK-Consult, YouGov and Deloitte Full Results Report
19You can also read