MAACHOUK NeighboUrhood profile & strategy Tyre, Lebanon - UN-Habitat
←
→
Page content transcription
If your browser does not render page correctly, please read the page content below
MAACHOUK
NeighboUrhood
profile & strategy
Tyre, Lebanon

                     May 2017
                                1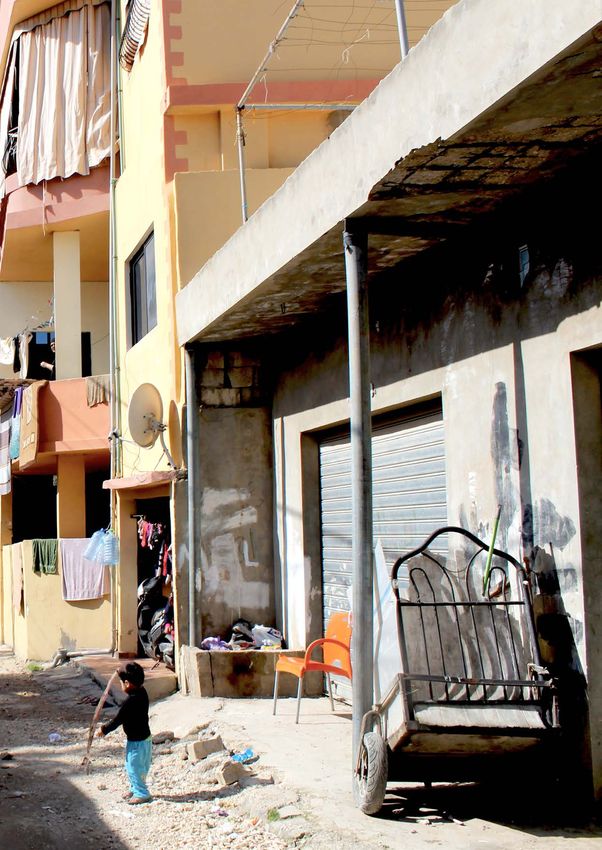
UN-Habitat Lebanon / Neighbourhood PROFILE & STRATEGY/ MAACHOUK - TYRE, LEBANON / 2017

                                                                                         Cover Photo: Riham Kuwatli, UN-Habitat (2017)
                                                                                         Copyright © 2017 UN-Habitat. All rights reserved.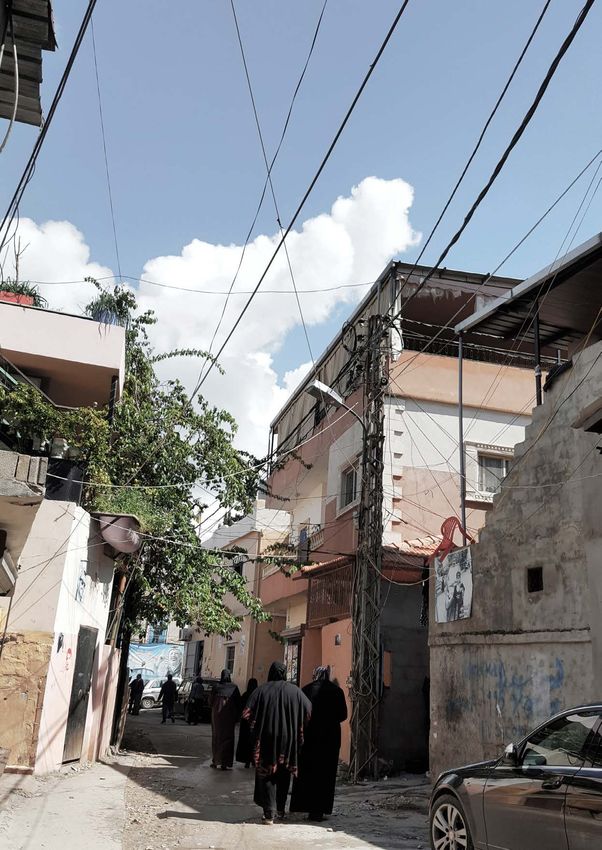
FOREWORD                                                         Credits & Acknowledgements
On behalf of UN-Habitat Lebanon, I would like to express         The Maachouk Neighbourhood Profile and Strategy was
our deep appreciation to the Swiss Embassy in Beirut -           prepared with information collected through field assessments
Swiss Cooperation Office, for their generous support, which      and interviews with local residents and community members.
made this document possible. Our acknowledgement goes            We wish to thank them for their contribution to the production
to the Municipality of Tyre and the Union of Municipalities of   of the Neighbourhood Profile for Maachouk, which provided
Tyre Region for their commitment in facilitating the work of     the foundation for the Neighbourhood Strategy.
the team, contributing to the provision of data and reviewing
drafts.                                                          UN-Habitat Lebanon gratefully acknowledges the support
                                                                 of the Embassy of Switzerland - Swiss Cooperation Office
I highly appreciate the involvement of community members         who funded this report, within the context of “addressing the
and other actors in providing valuable inputs into the           impact of Syrian Refugee Crisis in Tripoli and Tyre project”. The
assessment and validation processes. Our gratitude goes to       generous cooperation, advice and information provided by the
community mobilisers who facilitated the work of the field       Municipality of Sour is recognized, notably that of the Mayor,
team and encouraged community members to be actively             Mr. Hasan Dbouk, and Maachouk Popular Committee (Lajnee
involved in the discussion. And lastly, my full respect to       Shaabiyah).
UN-Habitat team who did a great job in very tough working
conditions.
                                                                 We acknowledge the field work that was conducted by:
                                                                 - Tyre Regional Technical Office: Ali Zein and Ahmad Shaaby
                                                                 - Sahel Zahrani Regional Technical Office: Hussein Khalife,
                                                                    Mirhane Wehbi, Mohamad Wehbi, and Sokna Saleh.
Tarek Osseiran                                                   - Community mobilisers: Mohammad Morshed and Khadija
Country Programme Manager at UN-Habitat Lebanon                     Abdul Aal.
                                                                 - UN-Habitat Lebanon staff: Ali Saad, Amal Merali, Bahaa
                                                                    Kaeen, Christelle Khalil, Dani Harake, Elie Mansour, Hassan
                                                                    Zaiter, Hippolyte Roullier, Lady Habchi, Maryam Nazzal,
                                                                    Mohamad Sayah, Nikolaus Hartz, Maya Majzoub , Samer
                                                                    Chinder, Sawsan Saad, Suzanne Maguire and Peter Khoury.

                                                                 We wish to thank the following community members for their
                                                                 collaboration:
                                                                 Khadija Abdul Aal (Popular Committee), Mohammad Morshed
                                                                 (Popular Committee), Ghassan Hleihel (Popular Committee),
                                                                 Said Khaled Takoush (mokhtar), Hussein Loubany (travel and
                                                                 hajj agent), Dr. Ahmad Morshed (dentist), Mokhaibar Morshed
                                                                 (vegetables seller), Mahmoud Morshed (mosque employee).

                                                                 This report has been prepared by Dani Harake and Riham
                                                                 Kuwalti, with major contributions from Ali Saad, George Abi
                                                                 Sleiman, Julie Brun and Rena Abou Chawareb; and input
                                                                 from Bassam Abdel Samad, Christelle Khalil , Elie Mansour,
                                                                 Mohammad Sayah, Mikhael Daher, Nour Lababidi, Racha
                                                                 Serhal, Sawsan Saad, and all of UN-Habitat Lebanon.
NEIGHBOURHOOD PROFILE PURPOSE                                      NEIGHBOURHOOD STRATEGY PURPOSE
                                                                                         A neighbourhood profile is a multi-sectoral, multi-cohort          The Neighbourhood Strategy is a spatial and thematic phased
UN-HABITAT LEBANON / NEIGHBOURHOOD PROFILE & STRATEGY/ MAACHOUK - TYRE, LEBANON / 2017

                                                                                         spatial analytical tool to improve the urban crisis response       response plan that is informed by the outcomes of the
                                                                                         in poor neighbourhoods in line with the Lebanese Crisis            Neighbourhood Profile (NP) (UN-Habitat, 2016) for the same
                                                                                         Response Plan 2017-2020 and the UN Strategic Framework             area.
                                                                                         for Lebanon 2017-2020.
                                                                                                                                                            UN-Habitat Lebanon produces neighbourhood strategies as a
                                                                                         UN-Habitat produces complementary city* and neighbourhood          basis for fostering coordinated action between partners to the
                                                                                         profiles that each lead to strategy formulation and project        Lebanon Crisis Response Plan and local authorities to enhance
                                                                                         implementation. Neighbourhood profiles inform targeting for        the response in urban neighbourhoods. The strength of the
                                                                                         humanitarian organisations and local authorities. They also        recommendations derives from their area-based nature, as an
                                                                                         contribute to building a national database of comparable data      alternative to cohort-based or sector-based points of entry.
                                                                                         that can be used for better understanding and monitoring of        The area-based approach starts with a defined geography in
                                                                                         urban dynamics in the most vulnerable urban pockets that           which integrated multi-sector and multi-stakeholder action
                                                                                         city and district averages are blind to, and of how these relate   and engagement may be advanced, potentiating optimal
                                                                                         to their wider urban contexts.                                     targetting, holistic programming and operational efficiencies.
                                                                                                                                                            Substantively, the strategies focus on improving living
                                                                                         METHODOLOGY                                                        conditions through community stabilisation, the upgrading
                                                                                         UN-Habitat neighbourhood profiling consists of three phases:       of basic urban services and housing, and improving capacity
                                                                                                                                                            for effective governance. Recommendations are phased in
                                                                                         Phase 1 comprises a field assessment in a two-part process.        order of identified needs, irrespective of the actual or likely
                                                                                         Part one is to identify and record the condition of the            availability of funds.
                                                                                         buildings, the basic infrastructure services, and all commercial
                                                                                         activities, on a base of a comprehensive visual inspection. Part   METHODOLOGY
                                                                                         two involves a population count by residential unit based on       Interventions have been formulated with input from local
                                                                                         open-ended interviews with key informants for each building.       and municipal representatives, active stakeholders, and focus
                                                                                         Information is collected using GIS-based mapping and               group discussions. The strategy suggests actions that respond
                                                                                         systematic questionnaires.                                         to specific social, economic and urban challenges phased in
                                                                                                                                                            the following format:
                                                                                         Phase 2 consists of conducting a series of focus group             - Immediate Response: An intervention that should be
                                                                                         discussions and key informant interviews with residents,           undertaken within six months due to its criticality for social
                                                                                         local public officials (mukhtars), business owners, school         stability or to emergency need in the realm of basic urban
                                                                                         principals, healthcare managers, religious figures, and (I)NGO     service provision.
                                                                                         representatives. The selection of focus group participants         - Short-term Response: An intervention that should be
                                                                                         takes into account factors such as age, gender and nationality.    undertaken within a year to mitigate further deterioration.
                                                                                                                                                            - Mid & Long Term Response: An intervention that should be
                                                                                         Phase 3 entails presenting the findings to municipal               undertaken within two or four years respectively, due either
                                                                                         representatives and community members in order to build            to its secondary or tertiary priority level or to the time frame
                                                                                         consensus regarding problems and opportunities. The                needed for its execution. General strategic directions likely
                                                                                         findings are refined based on feedback from this participatory     to be of ongoing relevance may also be outlined under this
                                                                                         stage. This approach ideally results in a mutual agreement on      response phase.
                                                                                         problems including capacity gaps and priorities.

                                                                                         *The City Profile is a continually updated geographical,
                                                                                         statistical and multi-sectoral description and analysis of the
                                                                                         urban area of a city, where the boundary is defined by the         Disclaimer :
                                                                                         continuously built up area. Its purpose is to inform the urban     The omission of potential interventions may be due to
                                                                                         crisis response, generate a national urban database, lead to a     the selective scope of UN-Habitat and/or the current
                                                                                         City Strategy, and inform strategic project identification.        methodology, or may require further study.
RESOURCES FOR IMPLEMENTATION                                       I. NEIGHBOURHOOD PROFILE                  1

Interventions proposed in this document require resources for      SPACE                                    3
implementation. There is a wide spectrum of resource types
from the monetary to the non-monetary in nature and the            GOVERNANCE                               4
local to non-local in origin.
Monetary resources can emerge from:                                POPULATION                               5
- Local NGOs or municipal budgets, or private sector
oragnisations (e.g. through Corporate Social Responsibilty         SAFETY & SECURITY                        7
spending).
- Non-local national/international donors and NGOs, and            SOCIAL SERVICES                          8
various public sector budgets.
                                                                   LOCAL ECONOMY                           10
Non-monetary resources can be:
- Competences such as local volunteered community-based            HOUSING                                  11
capacities.
- Formal governance capital such as institutional powers           BASIC URBAN SERVICES                    14
vested in municipalities or regional/national state entities.      POTABLE WATER                           14
                                                                   WASTEWATER                               15
Monetary and non-monetary resources are to an extent
                                                                   STORMWATER                               16
interchangeable though interventions typically require a
combination of both for implementation and sustainability.         ELECTRICITY                              17
Monetary resourcing requirements set out against Urban             SOLID WASTE                              18
Upgrading interventions are indicative estimates, and do not       ROADS                                    19
specify sources of capital. Further, costs may be open to value    INFRASTRUCTURE PERFORMANCE              20
engineering; specifically, optimal coordination of interventions
in time and space can maximise impact per unit cost.
                                                                   II. NEIGHBOURHOOD STRATEGY              21

                                                                   GOVERNANCE                              23

                                                                   SOCIAL STABILITY                        24
                                                                   SAFETY & SECURITY                       25
                                                                   LIVELIHOODS                             26
                                                                   A PROTECTIVE ENVIRONMENT FOR CHILDREN   27
                                                                   WOMEN EMPOWERMENT                       28
                                                                   YOUTH EMPOWERMENT                       29

                                                                   URBAN UPGRADING                         31
                                                                   HOUSING                                 32
                                                                   WET UTILITIES                           33
                                                                   ELECTRICITY MANAGEMENT                  37
                                                                   ACCESSIBILITY & MOBILITY                38
                                                                   SOLID WASTE MANAGEMENT                  39

                                                                   CONCLUSION                              40

 UN-Habitat Lebanon City and Neighbourhood reports are
 available online at https://unhabitat.org/lebanon/
 or http://data.unhcr.org/lebanon/.

 For further information including GIS data, contact
 info.lebanon@unhabitat.org.
LIST OF FIGURES LIST OF ACRONYMS & ABBREVIATIONS
Figure 1 Maachouk neighbourhood in context of Tyre 2 EDL Electricité du Liban
UN-HABITAT LEBANON / NEIGHBOURHOOD PROFILE & STRATEGY/ MAACHOUK - TYRE, LEBANON / 2017
Figure 2 Maachouk neighbourhood zone typologies 2
Figure 3 Schematic section of Maachouk neighbourhood 2 GUPW General Union of Palestinian Women
Figure 4 Public/private providers per service 3
LEB Lebanese nationals
Figure 5 Population in Maachouk 4
Figure 6 Residential density of buildings 4 MEHE Ministry of Education & Higher Education
Figure 7 Population distribution by residential unit. 4
Figure 8 Open space gatherings in Maachouk 6 MOEW Ministry of Energy & Water
Figure 9 Educational & health services within metropolitan Tyre 8
NRC Norwegian Refugee Council
Figure 10 Social services within Maachouk 8
Figure 11 Building use at ground floor level 9 PARD The Popular Aid For Relief and Development
Figure 12 Building Conditions 12
Figure 13 Buildings connection to potable water network 13 PRL Palestinian Refugees from Lebanon
Figure 14 Potable water street mapping 13
PRS Palestinian Refugees from Syria
Figure 15 Buildings connection to wastewater network 14
Figure 16 Wastewater street mapping 14 RTO Regional Technical Office
Figure 17 Buildings connection to stormwater network 15
Figure 18 Stormwater street mapping 15 SLWE South Lebanon Water Establishment
Figure 19 Buildings connection to electric network 16
SR Syrian Refugees
Figure 20 Electricity street mapping 16
Figure 21 Street lighting mapping 17 UNDP United Nations Development Programme
Figure 22 Solid waste street mapping 17
Figure 23 Road condition mapping 18 UN-Habitat United Nations Human Settlements Programme
Figure 24 Stairs and alleys mapping 18
UNRWA United Nations Relief and Works Agency
Figure 25 Narrow streets & unlit areas 24
Figure 26 Metropolitan Tyre Land use 25
Figure 27 Value chain based on solid waste management proposed plan 26
Figure 28 Nearby public and UNRWA schools 27 City is used to refer to the multi-municipality
Figure 29 Proposed location for Community Centre and football field 29
urban area focussed on Tyre, defined by the
extent of the continuous built up area.
Figure 30 Proposed space programme (phase 1) 29
Figure 31 Potential space programme (phase 2) 29
Tyre/Sour are used interchangeably by some, here the
term Tyre refers to the multi-municipality
Figure 32 Community Centre multi-purpose space use 29 city and the term Sour is reserved for the
Figure 33 Building structural conditions (phased response) 31 Municipality of Sour.
Figure 34 Building exterior conditions (phased response) 31
Figure 35 Communal spaces conditions (phased response) 32
Figure 36 Building connections to the potable water supply (phased response)33 BIBLIOGRAPHY
Figure 37 Stormwater and wastewater networks response plan 33 AUB, UNRWA. (2014). Socio-Economic Survey of
Figure 38 UN-Habitat wastewater network upgrading project 33 Palestine Refugees in Lebanon
Figure 39 Building connections to wastewater network (phased response) 34
Figure 40 Building connections to stormwater network (phased response) 34 Kaufman. (2006). Between Palestine and Lebanon: Seven
Figure 41 Stormwater planters 34 Shi’i Villages as a Case Study of Boundaries, Identities, and
Figure 42 Electricity management (phased response) 35 Conflict - Middle East Journal.
Figure 43 Building connections to electricity (phased response) 35
Figure 44 Road condition (phased response) 36
NPMPLT. (2005). 1997 figures.
Figure 45 Stairs conditions and on going projects 36
The World Bank. (2015). Population growth (annual %)
Figure 46 Primary roads and main gates of Maachouk 36
Figure 47 Solid waste management (phased response) 37 UNHCR. (2015). Syrian refugees registered by cadaster as
Figure 48 Main upgrading strategies in Maachouk 38 of 2015.12.31
Figure 49 Inter-linkages between urban upgrading interventions and community
development responses 39 UNRWA. (2016). Registration data.
LIST OF TABLES
Table 1 Population distribution by residential unit 5
Table 2 Population estimate for Tyre cadastre 5
Table 3 Capacity, cohorts, and shifts timing of UNRWA and public schools 7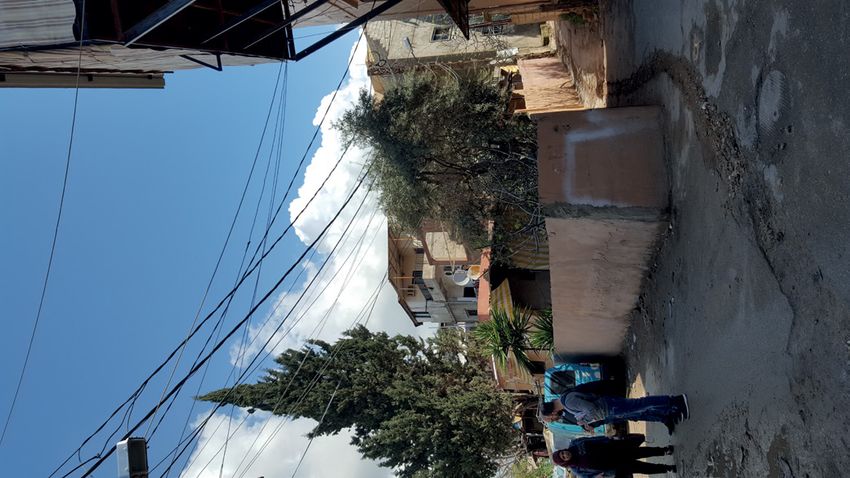
EXECUTIVE SUMMARY
The selection process of Maachouk neighbourhood was jointly
conducted by local authorities, local community representatives,
and UN-Habitat Lebanon. The selection criteria was: an impotent
neighbourhood characterized by a poor socio-economic status,
high refugee influx, and a deficient basic urban services rank.
Boundary verification was carried out through a participatory
approach using community-based knowledge, (I)NGOs
experience, and municipal expertise.

Maachouk is a multinational residential neighbourhood that falls
mostly within the boundaries of Sour Municipality. The formation
of the settlement dates back to the early years following the
Palestinian refugee influx (1948-1952), when Palestinians reached
Maachouk and settled on public lands. Today, the neighbourhood
accommodates diverse nationalities including Palestinians,
Lebanese and Syrian refugees. Labour on a daily-basis constitutes
the main source of income for inhabitants followed by agriculture.
Maachouk comprises one to three-story residential buildings
made of concrete with substandard construction methods and
bad foundations.

The neighbourhood is administered by a Popular Committee
appointed by the Palestinian Liberation Organization to operate
and maintain the basic urban services within Maachouk.
Infrastructure services are dilapidated, particularly sewage,
stormwater management, and roads. Interventions targeting
access to basic urban services in the settlement fall outside the
mandate of The United Nations Relief and Works Agency for
Palestine Refugees (UNRWA), restricted to the boundaries of
the official twelve camps. At the educational level, kindergartens
and primary education are provided within the neighbourhood,
whereas intermediate and secondary schools are located in a
close by area or at a distance from the neighbourhood. As for
health services, Maachouk’s residents faces several constraints
such as affordability, accessibility, limited number of physicians
and narrow range of specialisation.

This report summarizes the main findings based on a multi-
sectoral analysis of primary data. It sets the foundation of a
spatial and phased planning process, leading to the development
of action oriented strategies to enhance urban crisis response.
The strategies focus on improving living conditions through            Metropolitan
community stabilisation, the upgrading of basic urban services         Tyre
and housing, and improving capacity for effective governance.

                                                                     MAACHOUK
PART 1.
NeighboUrhood
profile
SPACE
UN-HABITAT LEBANON / NEIGHBOURHOOD PROFILE & STRATEGY/ MAACHOUK - TYRE, LEBANON / 2017
The neighbourhood of Maachouk is located in
the eastern parts of Tyre city, covers around
0.25 km2 and falls within the boundaries of
Tyre Cadastre. It is located 1 km away from the
Burj El-Chamali Palestinian camp to the east, El-Bass Abbassieh
Sour Camp
and 1,5 km away from El-Bass camp to the Old City
west. It borders the main highway to the south
and the Green Plan1 agricultural lands to the Burj El-Chamali
north. Maachouk is considered one of the most Camp
Maachouk
deprived neighbourhoods of the city.
Sour
Historically, the settlement was first established
in 1948-1952, when displaced Palestinian
refugees settled in Maachouk on public
agricultural lands owned by the Lebanese Burj El-Chamali
State. Maachouk later expanded due to familial
displacements. Archaeological findings show
that the area was already populated in the time
of the Phoenicians, Greeks and Romans. The El-Rashidieh
neighbourhood is characterised by a circular Camp
hill, which is renowned for two historical Islamic Cadastre Boundaries
Shrines dating back to the 18th century. Since the Palestinian Camp Boundary
beginning of the Syrian crisis, Palestinian and Maachouk Neighbourhood Ain Baal
Syrian families fled Syria to live in Maachouk,
Figure 1 Maachouk neighbourhood in context of Tyre
increasing the population by 26%. N
0 500 1000
Batoulay
NEIGHBOURHOOD TYPOLOGIES
Maachouk consists of four zones:
1. The central village-type structure on the hill:
A historical, congested built-up area on all sides
of a hill, with a mausoleum at its top. The area
is separated from its surroundings by streets,
whilst within the area, access is only possible
via narrow pedestrian walkways. The village is
characterized by dense, low quality building 3
structures with poor provision of urban services.
2. The main road: The area is limited to the south 1
by a regional main road connecting Sour to Burj
El-Chamali. The road is framed by two-story 3
warehouses and residential buildings, with wide
spaces for parking and workshops on both sides.
4
3. Residential areas to the West and to the East:
Adjacent to the hill, residential areas with two
2
to three story buildings in medium condition
stretch to both sides. The quality of the buildings
and the open spaces is better on the western
side whilst the area to the east is denser and less Figure 2 Maachouk neighbourhood zone typologies
structured.
4. An industrial–artisanal area to the East:
The density of this area is quite low with some
workshops, warehouses, parking spaces etc.
Within the many wide, open, unused, and thus
badly maintained areas are some single standing
new residential buildings and other poorly Figure 3 Schematic section of Maachouk neighbourhood N
0 100 200
maintained lower structures.
1
The Green Plan falls under the authority of the Ministry of Agriculture. The Green Plan was established in the mid 1960s to implement a project
for “the improvement of the Lebanese mountains”, through land reclamation, irrigation and reforestation activities. http://www.agriculture.gov.lb
2GOVERNANCE
STATE / FORMAL the major incursion of displacement public expenses in the neighbourhood,
from Palestine in 1948. The Lebanese charging households 5,000-10,000
The majority of Maachouk falls within the
Government regards refugees as ‘guests’, LBP per month. Coordination between
Municipality of Sour, with the exception
generally barred from gaining Lebanese the Popular Committee and Tyre
of its eastern side and the main road’s
nationality or work permits in all but a Municipality is limited to addressing
southern side, which falls within the
few sectors. PRS and Syrian refugees urgent problems. Good relationship exist
jurisdiction of the Municipality of Burj
are subject to the same restrictions. between the Popular Committee and
El-Chamali. The entire neighbourhood
However, there has been a naturalisation Tyre Municipality.
is located in Tyre district and belongs
effort in 1994 for residents of the “Seven
to the South Lebanon Governorate.
Villages” - villages at the southern border In the 1980s, Hezbollah and Amal
Maachouk currently embodies a diverse
zone between Palestine and Lebanon– of Movement, two of the most dominant
social pattern ranging from Lebanese,
which some now reside in Maachouk and Lebanese political parties in the south,
Palestinian Refugees from Lebanon
constitute a part of the neighbourhood’s found interest in Maachouk; especially
(PRL), Syrian refugees, and Palestinian
Lebanese population3. due to the migration of poor Shiite families
Refugees from Syria (PRS).
who came from neighbouring villages
Maachouk is regarded as one of 42 NON-STATE / INFORMAL to settle down in affordable Maachouk.
Maachouk is administered by the That led to a demographic change
Palestinian Settlements out of camps,
Popular Committee (Lajnee Shaabiyah) that altered the governance dynamics,
also known as ‘gatherings’ 2, yet not one
appointed by the Palestinian Liberation whilst the Lebanese parties, Hezbollah
of the 12 official camps. UNRWA therefore
Organization. It is denoted as the most and Amal, gained representation in the
does not have the mandate to provide
actively involved body of informal relevant local authorities, resulting in
infrastructure services (water, sewage,
governance within the neighbourhood. increased state-governance involvement
electricity, road networks and shelter),
Tyre Municipality does not usually in the neighbourhood’s affairs.
the agency does however provide social
services e.g., education, health, social provide services in Maachouk; in
return, no taxes are collected. As an Maachouk is suffering a decrease in
protection, etc., to Palestinians from the
alternative, the Popular Committee the quality of already deteriorated
neighbourhood.
is responsible for providing basic services due to the Syrian influx, such as
urban services and maintenance of electricity, waste management and water
State governance structures, within
infrastructure services such as wet provision. This influx did pave the way for
the Maachouk neighbourhood, are
utilities rehabilitation and solid waste (I)NGO’s and international organizations
present locally with one Mokhtar,
management. The Popular Committee such as UNDP, UN-Habitat, NRC and
two municipalities, and a Union of
has limited capacity to perform its role PARD, which were already active in
Municipalities (UoM). Furthermore, the
with lack of financial resources and/or Maachouk, to be rigorously tackling some
Lebanese central administration has
human skills. A local fund was created issues related to stress on services and
not offered a policy response to the
by the Popular Committee to cover socio-economic development.
Palestinian refugees since the start of
SERVICE PROVIDERS
Figure 4 Public/private providers per service
2
UN-Habitat uses for Maachouk the term “Neighbourhood” and not “gathering”. First, Palestinians are also to be found living outside of both
camps and ‘gatherings’, integrated less visibly in the host community’s residential fabric. Second, the term ‘gathering’ focusses attention on one
vulnerable group in the out-of-camp urban fabric which is accommodated in poor, often mixed-nationality residential neighbourhoods, which
also include host populations and other displaced and migrant groups. The implied cohort-based focus is increasingly partial following the recent
influx of Syrian refugees.
3
Kaufman (2006). Between Palestine and Lebanon: Seven Shi’i Villages as a Case Study of Boundaries, Identities, and Conflict - Middle East
Journal.
3POPULATION
POPULATION COUNT
UN-HABITAT LEBANON / NEIGHBOURHOOD PROFILE & STRATEGY/ MAACHOUK - TYRE, LEBANON / 2017
The population was surveyed by an all-cohort resident count of 3,374. From the 1980s, it had a high inflow
residential unit based on key informant Of these, almost half were PRL, and a of low income Lebanese families from
interviews for each building. The quarter SR. The average occupancy per neighbouring villages. Moreover, since
residential unit is a self-contained space residential unit is 3.3 amongst PRL and the Syrian crisis in 2011, many Syrian
used for a residential purpose by one or greatest amongst PRS at 7.3 residents/ and Palestinian refugees have been
more persons and household(s). It could unit. displaced from Syria and settled in the
be an apartment, rooftop add-on, studio, neighbourhood.
workshop, basement etc. The Maachouk Maachouk is now considered as one of the
population survey (Dec 2016) suggests densest neighbourhoods in the city.
3,374
Residential
Residential Density
Density
0 to ofper
15 residents Buildings
of Buildings
building
1 to 15 residents per building
16 to 30 residents per building
0 to
16 15
to residents
30 31
residentsperper
building
building
to 48 residents per building
1631
to to
3051residents
residentsperperbuilding
building
Total Resident Population in Maachouk 31 to 48 residents per building
29% LEB 3.0 average residents / unit
24% SR average residents / unit
45% PRL 3.3 average residents / unit
2% PRS 7.3 average residents / unit
Source: UN-Habitat Lebanon, December 2016
Figure 5 Population in Maachouk Figure 6 Residential density of buildings
POPULATION
180 DISTRIBUTION BY RESIDENTIAL UNIT
Population distribution with respect to number of residents per residential unit, showing actual numbers and percentage breakdown between
LEB, SR, PRL and PRS.
160
SR
PRS
140
21% PRL
1% LEB
120 12% 19%
of Residents
units
100 10%
residential
Number
80
26%
Total of
Total number
63% 53% 47% 48%
60
4%
44% 5%
40
37%
72%
20 34% 33% 30% 6%
27% 32% 30%
71% 8%
24% 33% 20%
28% 25%
18% 6% 33% 60% 20% 100%
0
1 2 3 4 5 6 7 8 9 10 11 and above
Number of residents per residential unit
Number of Residents per Unit
Figure 7 Population distribution by residential unit.
4LEB SR PRL Total4
residents/unit
Number of
% % % % % % % %
1 12 5 12 1 2 1 2 0 43 10 43 3 57 100 57 2
2 31 13 62 6 11 7 22 3 78 19 156 10 120 100 240 7
3 53 22 159 16 18 12 54 7 73 18 219 14 145 100 432 13
4 59 24 236 24 32 21 128 16 89 21 356 23 180 100 720 22
5 45 18 225 23 25 17 125 16 71 17 355 23 141 100 705 21
6 29 12 174 17 23 15 138 17 43 10 258 17 95 100 570 17
7 12 5 84 8 16 11 112 14 13 3 91 6 43 100 287 9
8 1 0 8 1 12 8 96 12 3 1 24 2 17 100 128 4
9 4 2 36 4 4 3 36 5 3 1 27 2 12 100 99 3
10 & 0 0 0 7 5 82 10 1 0 10 1 9 100 92 3
above
TOTAL
246 100 996 100 150 100 795 100 417 100 1539 100 819 33304 100
Table 1 Population distribution by residential unit Number of residential units Number of residents
TYRE POPULATION COUNT
As per UN-Habitat Tyre City Profile, PRL living outside camps in Tyre
Cohorts
Official
Source
population in the city is estimated cadastre are mainly concentrated in
Figures according to the following: the two Palestinian “gatherings” of
Maachouk and Jal el Baher. PRL living
1997 figures Official cadastral figures for the in Maachouk add up to 1533 inhabitants
adapted in various cohorts used by all partners and constitute 38% of the total PRL
LEB5 47,479 LCRP (Govern- to the Lebanese Crisis Response Plan population living outside camps in Tyre
ment of Lebanon
and the United
(Government of Lebanon and the United cadastre, shown in Table 2. It is worth
Nations, 2017) Nations, 2016) suggest a total population noting that PRL living outside camps in
of 99,412 for Tyre. Tyre only make up around 9% of the total
UNHCR Leb PRL population. Figures indicate that
SR 8,147 2015
Syrian refugees constitute 8% of the total
PRL AUB, UNRWA Tyre cadastral population. Nevertheless,
41,200 2014
(camps) when analogized to a 24% Syrian refugee
occupation in Maachouk, it is rendered
PRL5 4,000
UN-Habitat,
evident that a high rate of Syrian refugees
(outside camps) UNDP 2014
occupy the neighbourhood of Maachouk
PRS 2,586 UNRWA 2015 when compared to other neighbourhoods
in the city.
Total6 99,412
Table 2 Population estimate for Tyre cadastre
4
PRS figures are excluded from this table due to their insignificant numbers compared to other cohorts where they add up in total to 44 residents.
5
The 1997 household survey on which this data set is based includes PRL outside camps. Therefore, the 4,000 PRL residing outside camps are
assumed to be included in the Lebanese figures.
6
The total is the sum of LEB, SR, PRL (in camps) and PRS.
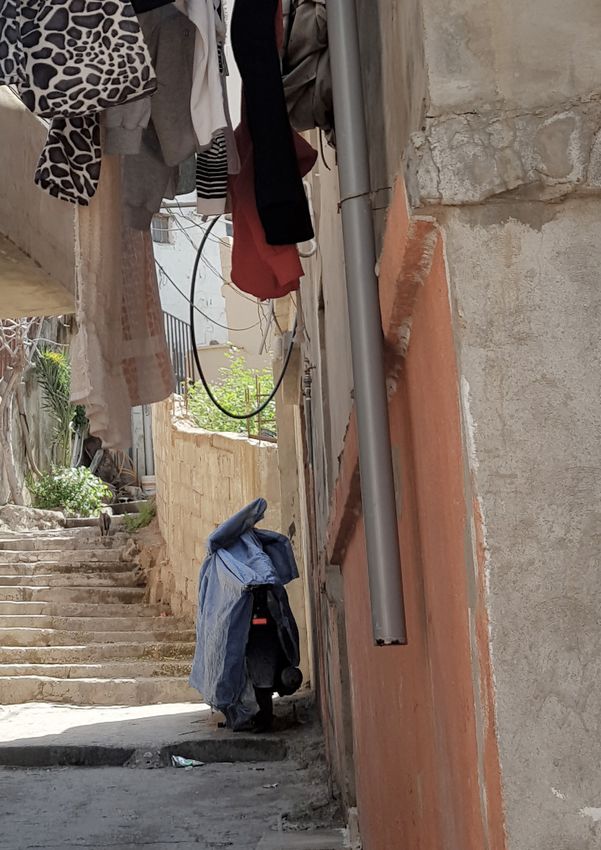
5SAFETY & SECURITY
According to the field survey and The Popular Committee is working on
UN-HABITAT LEBANON / NEIGHBOURHOOD PROFILE & STRATEGY/ MAACHOUK - TYRE, LEBANON / 2017
1
focus group discussions, residents of strengthening social cohesion between
Maachouk share the same living and dwellers by providing urban services for
safety concerns among all cohorts who all cohorts in the neighbourhood. Popular Committee
live together in the neighbourhood. The 2 3
precarious economic situation, lack PUBLIC SPACES / STREETS
4
of basic urban services, deficiency in Social gatherings for both children and
healthcare and educational facilities, adults are limited to streets and around
lack of recreational and open spaces, and coffee shops. There is a lack of public
vulnerability to tension during political open spaces due to the crowded urban
conflicts all hinder safety. fabric and lack of urban planning. Even Gathering
8 spaces
N
Figure Open space gatherings in Maachouk
0 125 250
social gatherings such as condolences
1 Empty land/Football field (Children & male youth)
The survey identified different causes to take place on the streets next to the
2 Street gathering (Children, male youth & elderly)
safety and security concerns: Popular Committee.
3 Cemetery (Everyone)
SOCIAL COHESION Key-informants claim that the 4 Mosque Yard (Children, female youth & elderly)
The 2011 and onwards refugee influx physical fabric and street layout of
from Syria, posed stress on already poor the neighbourhood creates a sense of
social, economic and infrastructural insecurity as streets are narrow and
services, thus creating tension between winding with lack or non-functional
the host community (PRL and LEB) street lights. The feeling of insecurity is
and the refugees (PRS and SR). A larger exacerbated because drug and alcohol
consumer base is utilising the same addiction among the youth is reportedly
facilities, thus creating competition on the rise. Agricultural lands around the
between original communities and the neighbourhood are being used as safe
new refugees. Moreover, unemployment environments by drug users.
in the neighbourhood has increased with
the influx of refugees from Syria, which SECURITY HOLDERS
increased competition on the limited, There is a perceived absence of law
mostly day-to-day and informal jobs. enforcement to uphold security and
Community members argue shortage safety. This is reflected in residents’
of law enforcement, limitation in the reliance on the Popular Committee
capacity of local government and to respond to their security concerns
limited economic activities as main and to resolve problems. The Popular
causes of tension, further engendered Committee and other political
by low provision of community services, parties have established an effective
dependency on political parties, lack of communication platform enhancing N
basic urban services and poverty. security measures in the neighbourhood. 0 125 250
©:UN-Habitat (2016) ©:UN-Habitat (2016)
6SOCIAL SERVICES
Population growth in the neighbourhood
and the city, has increased the challenges
to secure the residents’ access to social
services. Many of the challenges to
social service delivery in Maachouk are
similar to those faced in other parts
of the country. The arrival of refugees
from Syria exerted additional pressure
on education and health services. The
assistance from UNRWA is restricted
to Palestinians. Distance from social
services and transportation affordability
were reported to be a key challenge for
accessing services. ©:UN-Habitat (2016)
EDUCATION
On educational level, a main challenge which are PRL and 20% are PRS. streets. Many students dropped out
for neighbourhood residents is the lack in Palestinian residents opt for UNRWA’s of school due to the unaffordability
provision of intermediate and secondary Al Chajra middle school located in El- of transportation fees. It was also
education levels. Thus, students have to Bass camp approximately 1 km West of reported that many students attend
enrol in schools in a close by area or at a Maachouk that can provide for up to 900 technical institutes instead of higher
distance from the neighbourhood, which students. Lebanese and Syrian refugee educational programs to learn technical
come with associated costs, including students attend three public schools craftsmanship.
higher fees and/or transportation covering all education levels and situated
expenses. within close proximity; Thnawiyat Sour Based on key-informant interviews, a
Al Rasmiya Lil Banat, Madrassat Al large number of Syrian kids are out of
The available education in Maachouk is Masaken Al Rasmiya Al Moutawassita schools to support their families Many of
limited to primary education, with one and Madrassat Burj Al Chamali Al these children are working risky jobs like
UNRWA primary school- Al Tantoura- Moutawassita Al Rasmiya. Focus group welding or picking tobacco.
and two kindergartens. Al Tantoura has a discussions revealed that boys and girls
capacity to accommodate 300 students of all ages walk to classes during the
and has 190 registered students, 80% of school year, on pedestrian-unfriendly
Physical Total Palestinian Num-
LEB SR refugee (AM shift) SR
ID Name Capacity registered ber of
(AM shift) (AM shift) (PM shift)
(per shift) (AM shift) Shifts
PRL PRS
UNRWA Schools
Al Tantoura Primary
1 300 190 - 0 153 37 1 -
School
Al Chajra Primary /
4 900 580 - 0 480 100 1 -
Middle School for boys
Deir Yassine Secondary
6 600 403 - 0 386 17 1 -
School
Public Schools
Madrassat Al Masaken
2 800 628 263 322 43 2 748
Public Middle School
Bourj Al Chamali Public
3 1900 727 550 177 0 2 220
Middle School
Sour Public Secondary
5 1500 1011 1005 6 0 1 -
School for girls
Table 3 Capacity, cohorts, and shifts timing of UNRWA and public schools
7HEALTH
UN-HABITAT LEBANON / NEIGHBOURHOOD PROFILE & STRATEGY/ MAACHOUK - TYRE, LEBANON / 2017
The availability of health services inside • Al Imam Al Khomayni Healthcare Centre Furthermore, it was reported through
the neighbourhood is limited to primary (B) provides a full-time wide range focus group discussions that the
health care. There are three primary of services including consultations, residents of Maachouk use three hospitals
healthcare facilities in Maachouk, these medications, examinations (MRI, in the vicinity of the neighbourhood:
are Khomayni primary healthcare centre CT scan, etc.) and laboratory tests. Government Hospital (D), Jabal Amel (E)
(private), Al Karameh primary healthcare It targets all beneficiaries for a fee and Hiram Hospital (F). Most of UNRWA
centre (private), and UNRWA’s Mobile ranging between 5,000 and 18,000 health care centres are located inside
Health Clinic Point. LBP However, the support of medical camps. The vast majority of Palestinians
services for Syrian refugees inside the utilise UNRWA health facilities even
• UNRWA’s Mobile Health Clinic Point
Khomayni dispensary has stopped. if not in the direct proximity of the
(A) operates part-time in Maachouk
neighbourhood. However, distance
and opens twice per week, covering • Al Karameh (C) provides consultation
from healthcare services, shortage of
PRL and PRS, though with limited services for all residents three times a
medications and transportation fees
consultation services and narrow range week for a fee between 10,000 and
were conveyed as main challenges.
of specialization. 15,000 LBP but with limited number of
physicians.
3 km
2 km
H F
1 km
H E
5
H D
4 2
+ A
1
Maachouk Neighbourhood +B
6 +C
Metropolitan Tyre
3
UNRWA Schools
Primary Schools
Middle Schools
Secondary Schools
Public Schools
Primary Schools
Middle Schools
Secondary Schools
Healthcare Centers
Primary or SDC
Secondary
Kindergarten
Mosque
Police Station
Popular Committee
N
Figure 9 Educational & health services within metropolitan Tyre 0 500 1000
A
1
B
C
Education Health Religious Governance
Figure 10 Social services within Maachouk
8LOCAL ECONOMY
Maachouk is a residential area, with some The commercial activities located painters and construction workers who
economic activity on the main highway along the main road leading to Burj El undergo technical education and then
to the south. The commercial activity Chemali serve local population, as well vocational training in nearby workshops
within the neighbourhood is dominantly as to a city-wide array of consumers lack the means to open their own
composed of small shops divided into seeking affordable products. Some businesses and purchase the required
different categories, including food workshops and small scale industries are equipment and tools.
and grocery, bakery, stationary, coffee also located on the eastern part of the The precarious economic situation inside
shops, galleries for furniture, cell phones, neighbourhood. the neighbourhood is being aggravated
barbers, clothing, and accessories. by the poor basic urban services
Workshops account to 20% of the Focus group discussions reported that provision. This situation is leaving the
commercial activity, covering mechanics, labour on a daily basis is the main source responsibility to the residents’ and the
metal works, cement and stone making, of income for residents followed by Popular Committee which lack financial
construction material, carpenters, paint, agriculture. Poverty is also high amongst resources to undertake much-needed
and repair. Restaurants count 2% of agriculture labourers, as employment infrastructural works, resulting in both
the commercial activity including small is mostly seasonal. Craftsmen like high-cost services, and constraints for
restaurants and snacks. ironworkers, carpenters, builders, operating businesses efficiently.
N
Figure 11 Building use at ground floor level 0 100 200
TYPES OF COMMERCIAL ACTIVITIES
Shops: Workshops:
Food and grocery, Mechanics, metal works,
bakeries, restaurants cement and stone,
80% and snacks, stationary,
coffee shops, galleries
for furniture, cell phones,
barbers, clothing, general
20%
construction material,
carpenters, paint, and
repair.
household goods, textiles,
and accessories.
©:UN-Habitat (2016) ©:UN-Habitat (2016) ©:UN-Habitat (2016)
9HOUSING
UN-HABITAT LEBANON / NEIGHBOURHOOD PROFILE & STRATEGY/ MAACHOUK - TYRE, LEBANON / 2017
Maachouk comprises 403 low rise multi- Each building feature was categorized Predominantly, the buildings in
storey residential buildings of one to into the following rating criteria: Maachouk are informal on public lands
three-storeys in height. Most buildings 1. Good – No apparent problems visible: overlooking building and safety laws and
are made of concrete and corrugated iron Routine maintenance required. without proper construction inspection.
roofs. 2. Fair – Minor repairable problems visible: Even though the buildings don’t show any
Minor repair required. visible signs of structural distress, most
A comprehensive external building buildings are stated to have been built
condition assessment was conducted by 3. Substandard – Failure apparent including using substandard construction methods
UN-Habitat and engineers and architects significant problems: Major repair required. with inadequate structural support
from the Regional Technical Offices 4. Critical – Extensive damage or missing (foundation, concrete mix, steel-concrete
(RTO) under Tyre and Sahel Zahrani element: Urgent repair and/or replacement ratio, etc.), thus provoking vulnerability
Union of Municipalities. required. against hazards (earthquakes). Moreover,
where tenure is illegal, it is practically
The inspection focused on: General findings for the buildings are: impossible for dwellers to secure
1. Structural building condition: structural renovation permits to upgrade their
• 66% of the buildings were built houses due to stringent conditions
elements (i.e. beams, columns) between 1944 and 1975, and 26% forced by the local police. Interviews with
2. Exterior building condition: components between 1975 and 2000
of the building envelope (i.e. walls, roof, residents indicate that there are instances
where housing additions are demolished
windows, doors and balconies) • 97% of the buildings are residential, and dwellers arrested.
3. Communal spaces: shared spaces of with 15% having a commercial ground
buildings (i.e. means of exit, entrances, floor use
lighting, and provision for people with
• 83% of the buildings have a residential
disabilities)
ground floor use
4. Connection to services: building connection
to infrastructure networks (i.e. stormwater,
wastewater and electricity)
STRUCTURAL BUILDING CONDITION
Structural supporting elements I Beams I Columns
BUILDINGS: RESIDENTS:
Routine Maintenace
Good - Routine
maintenance: of residents live in
of buildings have no buildings that need
32% visible sign of distress or
failure in the building. 32% routine maintenance
Fair - Minor repair:
Minor Repair
of buildings have minor
SR
shrinkage cracks in of residents live in
floors and/or walls buildings that need minor
43% with no intrusion back
into building. Continual
monitoring required.
40% repair
PRS
Substandard- Major
repair:
Major Repair
PRL
of buildings show distinct
signs of roof of residents live in
18% or wall leaks, water
penetrating buildings,
and visible rusted
reinforcement.
19% buildings that need major
repair
LEB
Attention needed to
stop further damage.
Critical -
Emergency
Emergency of residents live in
intervention:
7% 9%
buildings that need
of buildings emergency intervention
show severe cracking
or missing structural
supporting elements.
Buildings in critical
state and in need of
urgent rehabilitation.
10EXTERIOR BUILDING CONDITION
Exterior walls I Roof I Windows I Balconies
BUILDINGS: RESIDENTS:
Good - Routine
Maintenance:
Routine Maintenace
of residents live in
of buildings have buildings with exteriors
31%
good exterior conditions
with no failure or problems
of any kind apparent.
Routine maintenance will
30% that need routine
maintenance
be adequate.
Fair - Minor Repair:
of buildings have fair
exterior conditions with
SR
of residents live in
minor problems and buildings with exteriors
Minor Repair
45% slight cracks that are
easily repaired. Continual
monitoring is required.
43% that need minor repair
PRS
Substandard - Major
Repair:
of buildings have a poor of residents live in
PRL
exterior condition with buildings with exteriors
20% 21%
Major Repair
distinct signs of failure that need major repair
including water intrusion,
cracks, deterioration which
requires major repair.
LEB
Critical -
Emergency
Intervention: of residents live in
of buildings have buildings with exteriors
4% 6%
Emergency
dilapidated exterior that need emergency
conditions with severe intervention
failure apparent resulting
in extensive damage
where emergency
attention is called for.
COMMON BUILDING AREAS
Means of Exit I Entrances I Lighting I Provisions for people with disabilities
BUILDINGS: RESIDENTS:
Good - Routine
Routine Maintenace
Maintenance: of residents live in
of buildings have buildings with common
42% functional communal
spaces with gated
entrances, lighting
42% areas that need routine
maintenance
provided in all areas, and
easily accessible exit doors
and staircases.
Fair - Minor Repair: of residents live in
of buildings have minor buildings with common
areas that need minor
SR
Minor Repair
defects in the communal
47% spaces such as minor
problems in entrance
gates.
44% repair
PRS
Substandard - Major
Repair: of residents live in
of buildings have serious buildings with common
defects in the communal
PRL
Major Repair
areas that need major
9% spaces including
malfunctional gates,
electrical wiring problems,
and blocked staircases by
11% repair
obstructions that can be
LEB
removed.
Critical - of residents live in
Emergency buildings with common
Intervention: areas that need
Emergency
2% of buildings have
no and/or damaged
gates or lighting at the
3% emergency intervention
entrances with significant
obstructions to staircases
that can’t be easily
removed in case of
emergencies.
11Building Material
UN-HABITAT LEBANON / NEIGHBOURHOOD PROFILE & STRATEGY/ MAACHOUK - TYRE, LEBANON / 2017
Concrete Concrete with steel additions
Structural Condition
Routine Maintenance Minor Repair Major Repair Emergency Intervention
Exterior Building Condition
Routine Maintenance Minor Repair Major Repair Emergency Intervention
Communal Spaces
Routine Maintenance Minor Repair Major Repair Emergency Intervention
Figure 12 Building Conditions.
©:UN-Habitat (2016) ©:UN-Habitat (2016) ©:UN-Habitat (2016)
12BASIC URBAN SERVICES
POTABLE WATER
BUILDINGS: RESIDENTS:
Potable water is available, every day Functional:
of the week, to a great part of the of residential buildings are of residents live in
connected to water supply buildings with a functional
neighbourhood, but the piping system
is in need of rehabilitation to reduce 95% network with good quality
pipes and no leakages. 96% potable water network
leakages and water losses.
• Water quality is poor and not suitable Malfunctional /
for drinking. connected: of residents live in
of buildings are connected buildings with a
• Water supply is continuous and mostly
meets the domestic water needs. 1%
to the water supply
network but with
minor leakages and/or
inappropriate installation
2% malfunctioned yet
connected potable water
network
• There is a lack of water treatment of water pumps.
for lime scale, in addition to proper
chlorination. Serious defect /
connected: of residents live in
buildings with serious
0%
of buildings are connected
to the network but pipes
have major leakages and
are at the end of their
0% defected yet connected
potable water network
lifecycle.
Missing / Not of residents live in
connected: buildings with no access
2%
to a water supply network
4% of buildings are not
connected to water
supply network, requires
immediate attention
Functional Connected with minor defects Connected with major defects Missing/ Not connected
Figure 13 Buildings connection to potable water network
N
0 100 200
Figure 14 Potable water street mapping
13WASTEWATER
BUILDINGS: RESIDENTS:
• Wastewater sewers are partly clogged
UN-HABITAT LEBANON / NEIGHBOURHOOD PROFILE & STRATEGY/ MAACHOUK - TYRE, LEBANON / 2017
in many parts of the neighbourhood, Functional: of residents live in
of buildings are connected
reducing the capacity of the pipes to an
overloaded network. 47% to the wastewater network
and plumbing system is
properly installed.
50% buildings with a functional
wastewater network
• 34% of the sewage network is
malfunctioning which is causing
environmental risks and health Malfunctional /
problems among neighbourhood connected: of residents live in
of buildings are connected buildings with a
residents.
• Interdependency of stormwater and 7%
to the wastewater network
and/or septic tanks with
minor leakages in the
wastewater plumbing
8% malfunctioned yet
connected wastewater
network
wastewater networks result in flooding system.
of sewage during heavy rainfall,
especially in the west part of the
neighbourhood. Serious defect /
connected: of residents live in
buildings with serious
• During peak discharge, wastewater
overflow through manholes is likely
caused by solid waste disposed in
40% of buildings are connected
to the wastewater network
and/or septic tanks with
major leakage problems
35% defected yet connected
wastewater network
sewers leading to blocking of sewage and/or blockages in
plumbing system.
network.
• Many badly constructed septic tanks
are leaking and connections to the Missing / Street of residents live in
6% discharge:
7%
buildings with no access
main line are minimal to non-existent. of buildings are not to a wastewater network
Additional maintenance costs are connected to a sewer and
discharge their wastewater
associated with desludging septic into open drains on the
tanks. street.
• Most defected building connections to
the network occur in the central historic
zone on the hill generating a flood-
prone area on its outskirts.
Functional Connected with minor defects Connected with major defects Missing/ Not connected
Figure 15 Buildings connection to wastewater network
N
0 100 200
Figure 16 Wastewater street mapping
14STORMWATER BUILDINGS: RESIDENTS:
• The neighbourhood has inadequate
or non-existent stormwater networks, Functional:
of buildings are of residents live in
72% of the streets lack gullies and any buildings with a functional
mean of drainage, causing localised
flooding during rainfall especially in the
9% connected to the network.
Stormwater pipes are
properly installed and
functional.
11% stormwater network
bottom of the slopes to the hill.
• 91% of buildings have malfunctioning/ Malfunctional / of residents live in
missing connections to the stormwater connected: buildings with a
of buildings are not malfunctioned yet
network, contributing to drainage
problems including street stormwater 52% connected to the network.
Stormwater pipes
are properly installed
50% connected stormwater
network
runoff. on external walls but
discharge on street.
• Drainage channels are either narrow or
partially to completely blocked. Serious defect /
connected: of residents live in
of buildings are not con- buildings with serious
• Flooding and inadequate drainage
of stormwater is causing structural
damage to the roads and buildings.
36% nected to the network.
Stormwater pipes are
installed but have serious
defects, leaking and/or
35% defected yet connected
stormwater network
blocked, and discharge on
• Key informants note that poor drainage street.
has a significant impact on the Missing / Street
prevalence of vector-borne diseases discharge: of residents live in
of buildings are not
3% 4%
among neighbourhood residents and buildings with no access
connected to the to a stormwater network
widespread infections. municipal network and/
or have missing/blocked
stormwater roof gutters
• A clear relation is observed between or drains. No stormwater
functionality of the network and pipes installed and
rainwater is leaking on
neighbourhood zones. external walls.
Functional Connected with minor defects Connected with major defects Missing/ Not connected
Figure 17 Buildings connection to stormwater network
N
0 100 200
Figure 18 Stormwater street mapping.
15ELECTRICITY BUILDINGS: RESIDENTS:
• Electrical infrastructure is often
UN-HABITAT LEBANON / NEIGHBOURHOOD PROFILE & STRATEGY/ MAACHOUK - TYRE, LEBANON / 2017
dilapidated and dangerous where Functional:
of buildings are connected of residents live in
electric hazards and tangled overhead
wires are common. 9% with electric
wires properly installed. 9% buildings with a functional
connection to electric grid
• Electricity supply is inadequate to meet
the demands of the residents where
they receive 4 - 6 hours of electrical Malfunctional /
connected: of residents live in
supply per day. of buildings are buildings with a
50% 53%
connected, but have minor malfunctioned yet
• Residents depend on privately owned defects in their connection connected electric grid
to the electrical grid,
power generators to supply the electric wires are installed
remaining hours of electricity per day. externally with limited
safety measures and
The monthly charge for generator weatherproofing..
subscription is around 120,000LBP for Serious defect / of residents live in
5 Amperes. connected: buildings with serious
• The increasing use of power generators
is not being regulated, resulting in
40% of buildings are connected,
but have inadequate
connections to the
35% defected yet connected
electric grid
electrical grid, with electric
additional air and noise pollution. wires causing danger to
building residents.
• Street lights are non-functional when
the main public power supply is down. Missing /Not of residents live in
• Use of renewable energy is minimal
(solar panels, lighting, water heating).
1%
connected:
of buildings are
not connected to the
3% buildings that are not
connected to the electrical
grid
electrical grid.
Functional Connected with minor defects Connected with major defects Missing/ Not connected
Figure 19 Buildings connection to electric network
N
0 100 200
Figure 20 Electricity street mapping.
16Figure 21 Street lighting mapping
*This map is representative only when public electricity is available.
When the power is down, the area is completely dark.
SOLID WASTE
The municipality and the Popular • There are no bins for the litter or the
Committee has created a well-structured generated garbage bags in the whole
collaborative effort for solid waste neighbourhood.
management in successful formal/
• There is a lack of awareness and bad
informal system. The Popular Committee
habits among some residents.
is responsible for collecting the solid
waste on a daily basis using their own • Rampant dumping of garbage on two
pick-up truck. The waste collected is then empty lands leading to the formation
dumped in the solid waste treatment of informal dumpsites, induction of
plant in Ain Baal. environmental degradation, attraction
of insects and rodents, and increasing
risk of vector-borne diseases. ©:UN-Habitat (2016)
• There is an absence of recycling and
sorting waste facilities.
Figure 22 Solid waste street mapping.
N
0 100 200
17ROAD
The road networks in the neighbourhood • 31% of the buildings are not directly
UN-HABITAT LEBANON / NEIGHBOURHOOD PROFILE & STRATEGY/ MAACHOUK - TYRE, LEBANON / 2017
are in a dilapidated state where 82% of linked to an emergency vehicle road
the roads / pathways are showing major network and thus no access for fire
and/or minor signs of deterioration. trucks and no alternative fire hydrants
or similar.
• The southern main road is the only
road in a good condition. • The condition of the roads is
exacerbated by the low width of streets,
• 18% of buildings have no direct access
turning radius, and poor quality of road
to a vehicular road network and are only
surface.
accessible via a pedestrian network of
stairs and alleys. • There is a high frequency of car and
motorcycle accidents.
• Community members reported a high
number of injuries, especially among
children and elderly, due to the bad
condition of pedestrian walkways. © UN-Habitat (2017)
N
0 100 200
Figure 23 Road condition mapping
N
0 25 50
Figure 24 Stairs and alleys mapping.
18INFRASTRUCTURE PERFORMANCE
The measures used to determine infrastructure performance are the three broad dimensions of functionality, coverage and
condition. These categories are evaluated based on a scoring criteria weighted to reflect their relative importance. The scoring
criteria is the following: inadequate (0-0.49), poor (0.49-0.69), fair (0.69-0.79), good (0.79-0.89), and very good (0.89-1).
Waste Water Storm Water
Functionality:
Proportion of streets Functionality:
with functional Proportion of streets
network with functional
network
Coverage: Coverage:
Proportion of Proportion of
population population
connected to connected to
network network
Condition:
Proportion of Condition:
buildings with fair Proportion of day
to good network with public electricity
connection supply
Score Score
Potable Water Electricity
Functionality:
Functionality: Average number
Proportion of buildings of hours for
with fair to good water public electricity
supply provision per day
Coverage:
Proportion
Coverage: of residents
Proportion of connected to
population connected public electricity
to network supply (properly
installed or with
minor defects)
Condition:
Condition: Proportion
Proportion of the of buildings
buildings with fair connected to
to good network public electricity
connection (properly installed
or with minor
defects)
Score Score
Access & Mobility
Functionality:
Proportion of buildings
with emergency vehicle
road access (fire truck,
width of street/turn,
and electricity cables)
Very Poor (0-0.49) Functionality
Coverage:
Proportion of buildings Poor (0.5-0.69) Coverage
with direct access to
vehicular road network
Fair (0.7-0.79) Condition
Condition: Good (0.8-0.89)
Proportion of total
road network in good Very Good (0.9-1)
condition
Score
19You can also read