Alberta Gas Supply and Infrastructure Analysis - AESO
←
→
Page content transcription
If your browser does not render page correctly, please read the page content below
Gas Processing Management Incorporated (GPMi)

Alberta Gas Supply
and Infrastructure
Analysis
The Assessment of Gas Supply and Infrastructure as it relates to the development
and operation of Natural Gas Fired Power Generation in the Province of Alberta

 B, Armstrong, R, Child and T. Joubert
 December, 2016
Ownership and Use of Materials
Gas Processing Management Inc. (GPMi) retains any and all right, title and interest in to the work herein
contained. All uses other than by the Alberta Electrical System Operator (AESO) for the prescribed
Business Purpose shall be pre-approved by GPMi. All ownership rights, title, and other property rights to
all text, images, and other material contained or displayed in this report belongs to GPMi unless the
source is otherwise indicated and constitutes valuable intellectual property. No material from or part of
this document is authorized or intended by GPMi to be assigned or licensed to any other party other
than the AESO unless pre-approved by GPMi. All unauthorized use shall constitute intentional
infringement(s) of GPMi’s intellectual property and shall further constitute a violation of their respective
trademarks, copyrights and other rights, including but not limited to rights of privacy.

Terms and Conditions
The input data, conclusions and recommendations used, presented discussed or documented although
believed to be accurate and correct by GPMi are not warranted or represented by GPMi to be so.

                                                                                                 1|Page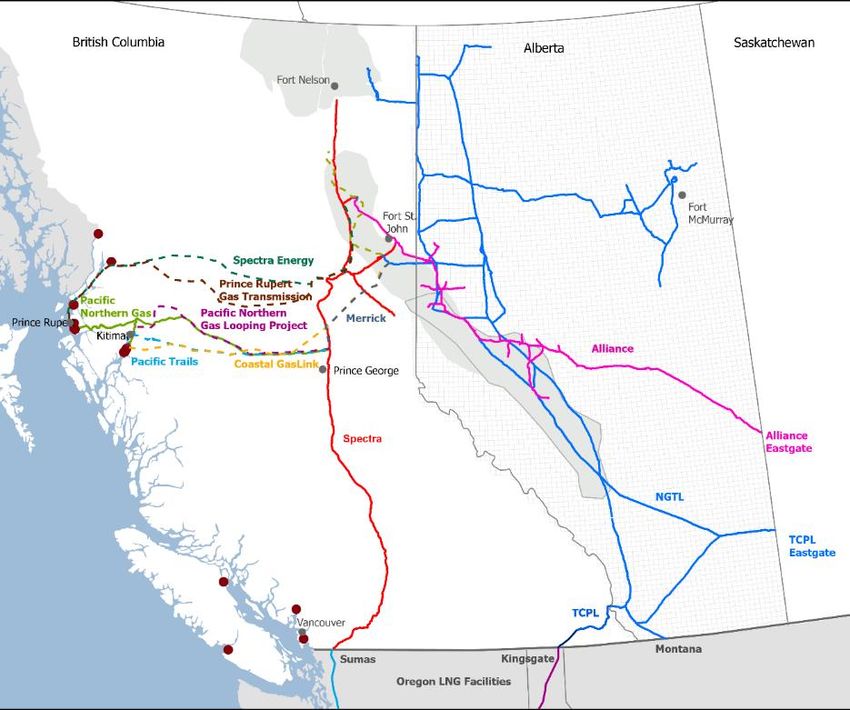
Table of Contents
Ownership and Use of Materials .................................................................................................................. 1
Terms and Conditions ................................................................................................................................... 1
Table of Contents .......................................................................................................................................... 2
Section 1 – Introduction................................................................................................................................ 5
Section 2 – Executive Summary .................................................................................................................... 6
   Western Canadian Natural Gas Overview ................................................................................................ 6
   United States Natural Gas Overview ........................................................................................................ 7
   Canadian and United States Natural Gas Supply, Demand and Systems Comparison ............................. 7
   Intra Alberta Sales Gas Systems ................................................................................................................ 8
   Intra Alberta Natural Gas System Reliability............................................................................................. 8
   Intra Alberta Gas Commercial Arrangements ........................................................................................... 8
   Natural Gas Storage .................................................................................................................................. 9
   Alberta Natural Gas Fired Power Generation Overview ........................................................................... 9
   Alberta Natural Gas Fired Power Generation Dependability and Reliability ............................................ 9
Section 3 - Western Canadian Natural Gas Overview................................................................................. 11
   NEB Outlooks .......................................................................................................................................... 11
   AER Outlooks........................................................................................................................................... 12
   Natural Gas Demand ............................................................................................................................... 12
       Intra Western Canada – Production ................................................................................................... 12

       Western Canada Exports – Marketable Gas ....................................................................................... 15

       Alberta – Marketable Gas ................................................................................................................... 18

   Natural Gas Supply – Marketable Gas .................................................................................................... 21
       Western Canada – Western Canadian Sedimentary Basin ................................................................. 21

       Alberta................................................................................................................................................. 22

   Impact of Hydraulic Fracturing ............................................................................................................... 24
   Natural Gas Resource Potential .............................................................................................................. 25
       Western Canada Sedimentary Basin................................................................................................... 25

       Natural Gas Resource Potential – Alberta .......................................................................................... 26

Section 4 – United States Natural Gas Overview ........................................................................................ 27
   US Natural Gas Demand.......................................................................................................................... 29
   US Natural Gas Supply ............................................................................................................................ 31

                                                                                                                                                 2|Page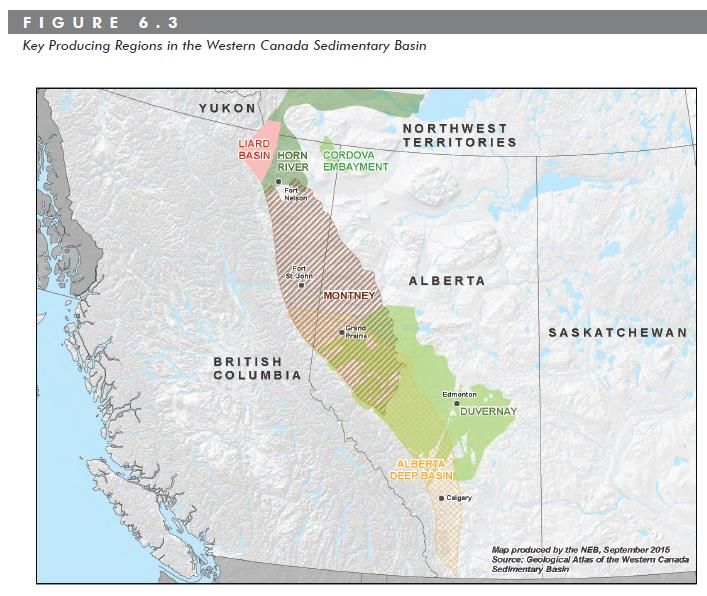
Impact of Hydraulic Fracturing ............................................................................................................... 35
   US Natural Gas Resource Potential ......................................................................................................... 37
Section 5 - Canadian and United States Natural Gas Supply, Demand and Systems Comparison ............. 38
Section 6: Intra Alberta Sales Gas Systems ................................................................................................. 42
   Summary of the Intra Alberta Natural Gas Transport Systems .............................................................. 42
   System Design, Operation and Focus ..................................................................................................... 44
   Pipeline Costs and Delivery Capacity ...................................................................................................... 46
   Pipeline Capacity ..................................................................................................................................... 46
   Gas Transportation System Modifications Development Process.......................................................... 48
   Potential Impact of West Coast British Columbia LNG Plants on the NGTL System in Alberta .............. 50
      Gas Transportation System to Deliver Gas to LNG Facilities .............................................................. 50

      Assume LNG Projects Proceed in the Near Future ............................................................................. 52

      Assume LNG Projects are Delayed ...................................................................................................... 53

Section 7 Intra Alberta Natural Gas System Reliability ............................................................................... 54
   Upstream Segment ................................................................................................................................. 54
   Downstream Segment ............................................................................................................................ 55
   Causes of Transportation System Outages ............................................................................................. 55
      Planned System Outages .................................................................................................................... 55

      Power Failure ...................................................................................................................................... 56

      Unplanned outages ............................................................................................................................. 56

   High Level Natural Gas Fired Power Development Scenarios ................................................................ 57
      Gas Generation Capacity to Replace Existing Coal Generation Plants ............................................... 57

Section 8: Intra Alberta Gas Commercial Arrangements ............................................................................ 60
   NGTL System Commercial Overview....................................................................................................... 60
      NGTL Jurisdiction................................................................................................................................. 60

      NGTL Services ...................................................................................................................................... 60

      Tolling Methodology ........................................................................................................................... 61

      Requesting Service on the NGTL System ............................................................................................ 63

      System Expansions and Extensions..................................................................................................... 63

   NIT and the Gas Market .......................................................................................................................... 64
      Types of Transactions ......................................................................................................................... 65

                                                                                                                                            3|Page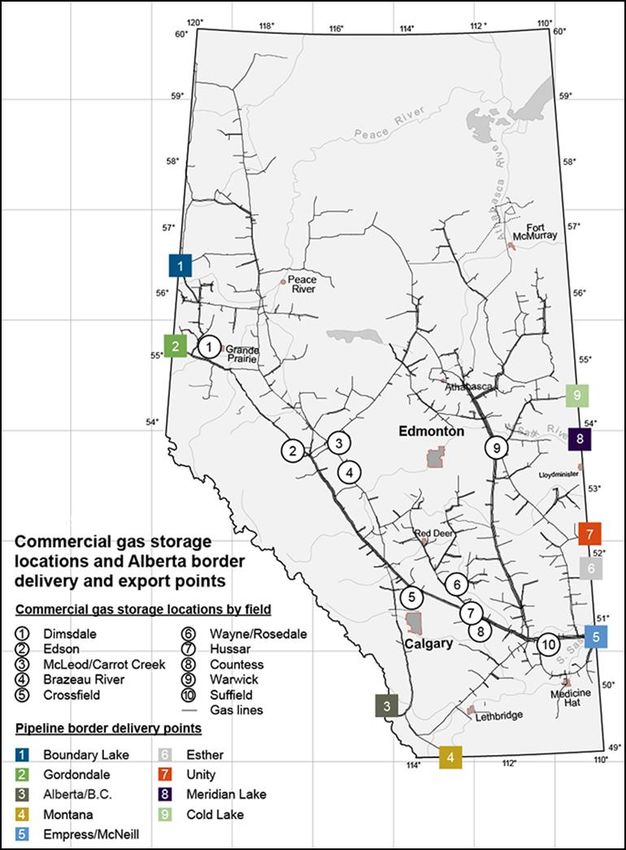
Spot Market ........................................................................................................................................ 65

       Natural Gas Futures ............................................................................................................................ 68

   Commercial Requirements ..................................................................................................................... 68
   Summary ................................................................................................................................................. 69
Section 9: Storage ....................................................................................................................................... 70
   Storage Terminology ............................................................................................................................... 70
   Types of Storage Facilities....................................................................................................................... 70
   Physical Storage ...................................................................................................................................... 71
   Commercial Storage ................................................................................................................................ 75
   Storage Receipt and Deliveries ............................................................................................................... 77
   Gas Storage Contracts ............................................................................................................................. 78
Section 10 – Alberta Natural Gas Fired Power Generation Overview ........................................................ 81
   Natural Gas Requirements for Power Generation.................................................................................. 81
   Natural Gas Resource.............................................................................................................................. 81
   Gas Supply System for Power Generation .............................................................................................. 82
   System Ability to Manage Volatility ........................................................................................................ 84
       Pipeline Storage .................................................................................................................................. 84

       LNG Storage ........................................................................................................................................ 84

   NGTL Commercial Operations................................................................................................................. 85
       Short Term Response to Rapidly Changing Demand .......................................................................... 85

Section 11- Alberta Natural Gas Fired Power Generation Dependability and Reliability ........................... 87
   Resource Risk .......................................................................................................................................... 87
   Supply Risk .............................................................................................................................................. 87
   Commercial Risk ...................................................................................................................................... 89
       Commercial Access to Gas Storage Capacity ...................................................................................... 90

       Fuel Switching ..................................................................................................................................... 90

   Physical Delivery System Risk ................................................................................................................. 90

                                                                                                                                               4|Page
Section 1 – Introduction
The following report has been commissioned by the Independent System Operator operating as the
Alberta Electrical Systems Operator (AESO). The purpose of the report is to assist them in understanding
the operation of the Alberta (AB) and Western Canada Natural Gas Systems as they relate to the
development and operation of dependable and reliable large scale natural gas fired electrical power
generation in AB as a replacement for coal fired power generation and back up to electrical power
generated by renewable sources. The Report examines AB, Western Canada as the AB systems are
interconnected to those in British Columbia (BC), Saskatchewan (SK) and the United States (US). The US
is included as their natural gas systems are interconnected with those in Western Canada through
export pipelines and have the potential to impact operations in Canada.
The Study utilizes available public source data to provide a detailed understanding of:
Natural gas demand, supply and available resource in AB, Western Canada and the US and a
comparison of the systems in Western Canada and the US.
Intra AB Natural Gas Systems, the overall reliability and dependability of those systems and their
commercial operations. Where the operation of the system is interconnected with BC and SK,
the analysis has been expanded to include Western Canada. The analysis includes natural gas
production, gathering and processing, sales gas transportation and storage.
The potential operation of large scale Natural Gas Fired Power Generation and the factors that
will affect the reliability and dependability of that Generation.
5|Page
Section 2 – Executive Summary
The analysis of the natural gas systems in Western Canada and the integration of large scale natural gas
fired electrical power generation concludes that there is substantial natural gas resource, a dependable
delivery system and established commercial processes underpinning its operation. However, there are
characteristics of the natural gas system that will need to be monitored and managed to ensure future
reliability of electricity supply from natural gas fired power generation, especially in regions with a high
concentration of such assets. Some potential areas of assessment include:
Regions such as Lake Wabamun could potentially have a high concentration of natural gas-fired
generation that may be dependent upon a limited pipeline infrastructure for fuel supply. As the
pipeline infrastructure is expanded to allow for increased natural gas demand for power
generation, analysis of planned and forced pipeline outages needs to be completed with
potential mitigation plans where significant reliability issues may arise. Such mitigation activities
may include redundant pipelines or minimizing the number of electric power generators that
are dependent upon a single pipeline.
The timing to develop additional pipeline infrastructure in fully contracted delivery point regions
needs to be reviewed to ensure reliable fuel supply on a timely basis to meet the incremental
natural gas demand for electrical power generation.
The supply of natural gas into the system is relatively inflexible over the short term (i.e., within
hours) with fluctuations in demand or supply generally balanced through the use of system line
pack and natural gas storage. The system was not originally designed with the capability to
respond to large short term fluctuations in natural gas demand that may evolve based on the
requirements of electrical power generation (i.e., increased volatility in natural gas demand for
electric power generation resulting from changes in renewables electrical production). The
generation facilities may need to consider the installation of on-site storage of natural gas or
fuel switching capability to ensure fully dependable operation to manage low probability high
impact events where natural gas from the system may not be available.
For increased long-term reliability, natural gas storage facilities within the Alberta system should
be assessed (particularly withdrawal capacities) as natural gas fired electrical power generation
and renewables generation increase in Alberta.
Additional recommendations as the power and natural gas markets become more integrated include:
1. Natural gas system operators and electric power generation developers work together to ensure
that the influx of new natural gas electric power generation does not impact regional system
reliability.
2. To ensure reliability of fuel supply, electric power generators should consider high-priority, high-
capacity transportation services and storage contracts. These may include on-site storage
contracts and facilities.
The following summary provides the high level observations from the following sections:
Western Canadian Natural Gas Overview
Total Western Canada Natural Gas Demand (including production facility fuel) is expected to
increase to 13.4 Bcf/d in 2040 from 9.1 Bcf/d in 2015. Industrial use is the largest consumer of
natural gas at 6.3 Bcf/d in 2015 (70% of the total) increasing to 8.7 Bcf/d in 2040 (65% of the
6|Page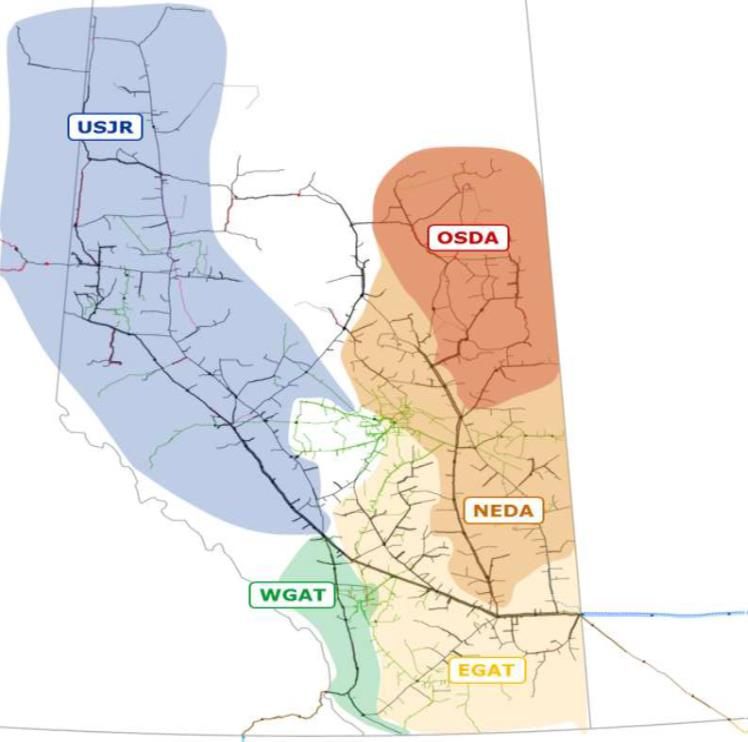
total). Electric Power generation is the second largest consumer of natural gas at 1.1 Bcf/d in
2015 (12.7% of the total) increasing to 2.6 Bcf/d in 2040 (19.5% of the total)1.
Canadian Natural Gas production is expected to increase to 17.9 Bcf/d in 2040 from 15.1 Bcf/d
in 20152. Non-LNG exports are expected to decrease from 5.2 Bcf/d in 2015 to 0.2 Bcf/d in 2040.
The EIA forecasts a similar trend but is slightly more bullish on overall net imports3 to the US
indicating 1.6 Bcf/day in 20404. Production from the WCSB in 2015 (14.8 Bcf/d) represents 98%
of total Canadian supply and >99% in 2040 (17.8 Bcf/d).
The NEB Reference Case forecasts natural gas production from the Western Canadian
Sedimentary Basin to grow to 17.8 Bcf/d in 2040 from 14.8 Bcf/d in 20155. AB production is
forecast to drop to 9.5 Bcf/d in 2040 (53% of the total) from 10 Bcf/d in 2015 (67% of the total)
as production grows in BC to meet the forecasted LNG Demand. BC production is forecasted to
grow to 8.2 Bcf/d in 2040 from 4.4 Bcf/d in 2015 (46% of Total WCSB production in 2040 from
30% in 2015).
The NEB EF 2016 provides an estimate of Natural Gas Resource Potential for the Western
Canadian Sedimentary Basin (WCSB). Based on 2015 Marketable Production of 5.2 Tcf/year
(14.3 Bcf/d), the WCSB has 164 years of remaining life on the Reference Case Remaining
Marketable Resource and 255 years at the High Price Forecast6.
United States Natural Gas Overview
The EIA Reference Case expects US Natural Gas Demand increases to 94.3 Bcf/day in 2040 from
75.3 Bcf/d in 2015. In 2040, Electric Power Generation is expected to be the largest demand
source at 35% of total demand.
The EIA AEO2016 Reference Case provides a range of forecast of US Dry Gas Production7; dry gas
production is expected to grow to 115.4 Bcf/day in 2040 from 74.5 Bcf/day in 2015. In 2040, the
US will be a net exporter of natural gas.
As of Jan 1, 2013, the EIA estimates technically recoverable US dry natural gas resource at 2,300
Tcf8. At the 2015 dry gas production rate of 27.2 Tcf/year this represents a life of 84 years.
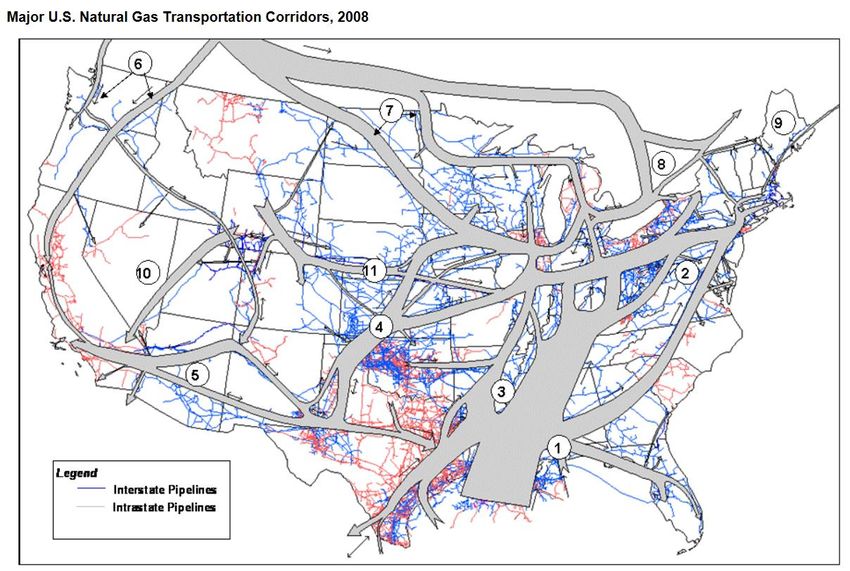
Canadian and United States Natural Gas Supply, Demand and Systems Comparison
Both the US and Western Canada have significant natural gas resources and productive capacity
(both absolutely and relative to demand).
Productive capability is diverse and connected to the major demand areas by a network of sales
gas pipeline systems.
Geographically the producing areas are located relatively near the demand centers in both the
US and Western Canada.
One of the key factors in the reliability of the supply sources are the duplication of access paths
to market. Western Canada has considerable redundancies built into the system that may not
1
Includes natural gas consumed in field operations. From the NEB EF 2016
2
Excludes natural gas consumed in field operations. From the NEB EF 2016
3
Net imports are defined as imports less exports
4
Source US Energy Information Systems (Oct 2008)
5
From the NEB EF 2016
6
From the NEB EF 2016
7
Source US Energy Information Administration (Oct 2008)
8
Source US Energy Information Administration (Oct 2008)
7|Page
be present when a state is dependent upon gas supplies located out of state. This discontinuity
does introduce a potential reliability risk that is not present in Western Canada.
Intra Alberta Sales Gas Systems
AB has a well-established extensive gas transportation network. The combined Nova Gas
Transmission Limited (NGTL) and ATCO system is the system most likely to be utilized by the
proposed natural gas fired power generation facilities.
NGTL has developed a sophisticated planning and project execution process to respond to
customer requests for new or modified gas receipt or delivery points and to make any existing
system modifications required transport gas to Intra AB and export markets.
The development of West Coast LNG export facilities will have a significant impact on Western
Canada gas transportation systems. The impact on the NGTL system in AB will be more
significant if the proposed LNG facilities are deferred and or reduced in scope due to increased
pressure on the existing system to deliver gas south and east of the growth producing areas.
Intra Alberta Natural Gas System Reliability
AB has a robust gas supply and delivery system with very high system reliability from producing
facilities through the transportation system to end users. The upstream segment of the system
consists of a large number of gas gathering and processing facilities that operate essentially
independent of each other. The downstream transportation segment has significant redundancy
and flexibility to provide alternative gas flow paths in the event of a planned or unplanned
outage in one part of the system.
Reliability of the supply system upstream of natural gas fired power generation facilities is
critical. Gas supply assurance is dependent upon three main factors: supply (ultimately
resource) availability, capacity of the infrastructure to deliver the required supply and the
reliability of that infrastructure to deliver the available resource.
NGTL has several methods in place to notify customers of planned outages and their impact on
customers. The highest gas supply risk due to a single point outage to a specific natural gas fired
powered generation facility is a failure or outage on a dedicated single pipeline to the facility.
The impact of failures upstream of dedicated pipelines is mitigated by the redundancies and
flexibility of the system.
Depending on the location of new natural gas fired power generation facilities, significant
modifications could be required to provide a reliable source of supply. In particular, the
infrastructure to supply gas to the Wabamun area west of Edmonton requires upgrading if
natural gas fired power generation facilities are located in that area.
Intra Alberta Gas Commercial Arrangements
The NGTL system provides a well-developed commercial system for transportation and title
transfer of gas.
NGTL system expansions, tolling and operations are under NEB jurisdiction. This requires NGTL
to provide services as a common carrier in an open and non-discriminatory fashion.
Nova Inventory Transfer (NIT) with the Natural Gas Exchange (NGX) and over the counter
trading makes AB one of the largest and most liquid gas trading hubs in North America.
Typically, gas transfers ownership 5 to 6 times per day before it is delivered off the system.
Spot market prices in the short term can be sensitive to supply and demand dynamics. Driven
8|Page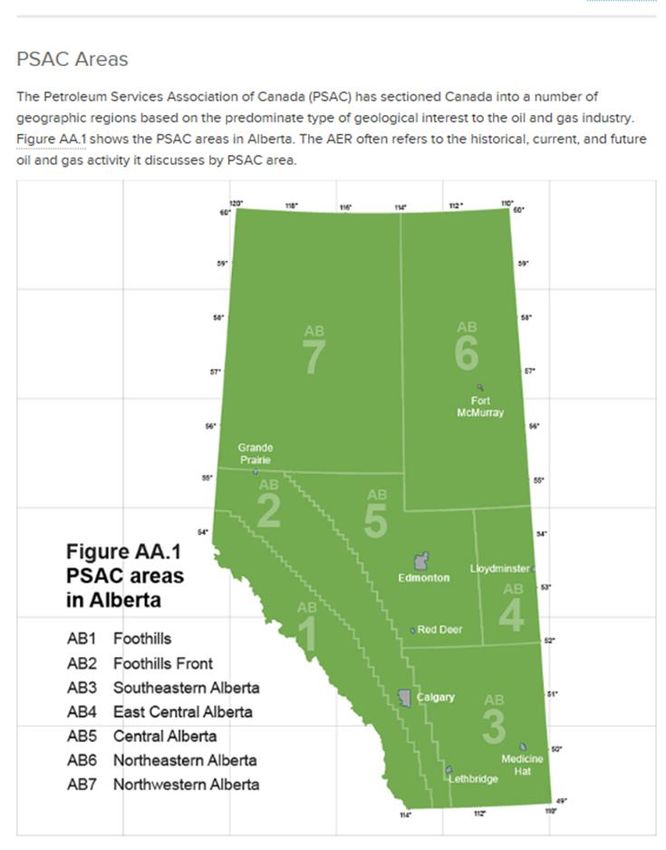
primarily by price, the market balances thorough changes in storage injects or withdrawals,
export balancing and line-pack adjustments. These factors combine to moderate price spikes.
Natural Gas Storage
There are eight operating natural gas storage facilities in AB with a total storage capacity of
approximately 450 Bcf. In BC, the Aitken Creek facility adds another 77 Bcf of storage to western
Canada.
Driven primarily by price signals, storage facilities are used to balance supply and demand needs
and can change system balance by up to 2 Bcf/d day over day with a maximum evidenced
withdrawal rate from storage of 4 Bcf/d.
Storage in AB is operated as merchant enterprises (versus regulated open access facilities)
where owners negotiate contracts with clients. Commercial terms of these contracts are based
on market conditions.
Alberta Natural Gas Fired Power Generation Overview
The NGTL system currently handles significant seasonal volatility through operational
optimization and the use of storage and line pack. The system compensates for periodic large
outages or abnormal operating conditions and maintains supply to customers in essentially all
circumstances. The current system design can manage storage with withdrawal swings at a rate
of up to 2 Bcf/d. However, superimposing large swings in demand (as the result of start-up of
substantial natural gas fired power generation) at a time when withdrawals from storage are at
maximum (in addition to much smaller weather related swings and larger seasonal variations) is
untried and is difficult to predict without a more detailed assessment.
With installation of large scale natural gas powered electrical generation, we need to assure the
ability of the commercial and physical systems to provide short term fuel supply in response to
significant and immediate demand increases (0 to 4 hours) and to continue to provide that
natural gas over an extended period of time to operate the power generation facilities (24 plus
hours). In addition to the flexibility that the normal physical and commercial operation of the
NGTL system provides, the specific power generation facilities could install “pipeline” storage to
handle periods of short term fuel shortage or install “LNG” storage to handle periods of short
term or extended fuel variability or shortage.
The natural gas supply in Western Canada on a short term basis is relatively inflexible.
Fluctuations in natural gas demand are generally managed commercially to access the available
natural gas supply. Through the trading desks, the fluctuations in demand are met by accessing
gas storage, shifting natural gas export volumes or by re-allocating Intra-Canada demand.
Alberta Natural Gas Fired Power Generation Dependability and Reliability
The risks associated with the physically and commercially available natural gas supply can be
categorized as Western Canada gas resource, Western Canada hourly and daily supply,
commercial access, and physical delivery system.
With respect to overall Western Canadian Natural gas supply (based on the NEB EF 2016
Analysis), the addition of 10,000 MW of natural gas fired power generation will be more than
underpinned by the available resource. Anticipated growth of demand for natural gas fired
power generation will put upward pressure on the price of natural gas within Western Canada
9|Pageand, given sufficient cycle time, the development of additional supplies of natural gas to meet
the long term need.
Natural gas movement through the NGTL systems varies over time as demand and supply
changes. On a short term basis, natural gas supply is fairly inflexible to daily variations. Short
term variations in natural gas demand are met by natural gas withdrawals from storage, re-
allocation of natural gas exports or re-allocation of Intra-Western Canada demand.
Gas supply risk is highest during the period when natural gas storage reservoirs are late in their
withdrawal cycle (generally late winter – natural gas demand exceeds supply), shortages in gas
supply would result in an increased Western Canada spot price and a shift of gas supply from
export and other Intra-Western Canada demand in the response to shifts in net backs. The
ability to shift demand decreases as export volumes drop and a higher percentage of demand is
focused on electrical power generation. These risks are mitigated by the installation of on-site
storage (LNG), assuring commercial access to available gas storage withdrawal volumes or fuel
switching. LNG storage options have been discussed in Section 10.
10 | P a g eSection 3 - Western Canadian Natural Gas Overview
The following analysis of Western Canadian Natural Gas is based on data sourced from the Alberta
Energy Regulator (AER) and the National Energy Board (NEB).
NEB Outlooks
The NEB, in its outlook Canada’s Energy Future 2016 (EF 2016), provides an overview of energy supply
and demand in each of the Canadian Provinces and Territories and for the Western Canadian
Sedimentary Basin (WCSB). A Western Canada look can be developed by summing that from Alberta
(AB), British Columbian (BC) and Saskatchewan (SK). The outlook is presented in two reports, Energy
Supply and Demand Projections to 20409 and the Province and Territories Outlooks10 with detailed data
backup11. Their projections provide valuable insight into Canada’s energy future and a context to
understand the development and operation of Natural Gas Fired Power Generation in the Province of
AB. In its introduction to its outlook, the NEB indicates:
“The projections presented in both EF 2016 and this supplemental report are a baseline for discussing
Canada’s energy future and do not represent the Board’s predictions of what will take place in the
future. The projections in EF 2016 are based on assumptions which allow for analysis of possible
outcomes. Any assumptions made about current or future energy infrastructure or market
developments are strictly theoretical and have no bearing on the regulatory proceedings that are or
will be before the Board.
Only policies and programs that are law at the time of analysis are included in the EF 2016
projections. As a result, any policies under consideration, or new policies developed after the
projections were completed in the summer of 2015, are not included in this analysis. Several
provinces announced new energy plans and policies prior to the Paris climate conference in late
2015. These announcements and policy changes are not included in the EF 2016 projections12.”
The EF 2016 contains six Cases for energy supply and demand in Canada covering various uncertainties
to 2040. These Cases are outlined in the following figure with overviews of the assumptions in the cases
described. For the purpose of this assessment, the Reference Case will be used primarily as its basis.
Where applicable, the other Cases have been included to ensure that the range of possible outcomes
are considered.
9
https://www.neb-one.gc.ca/nrg/ntgrtd/ftr/2016/2016nrgftr-eng.pdf
10
https://www.neb-one.gc.ca/nrg/ntgrtd/ftr/2016pt/nrgyftrs_rprt-2016-eng.pdf
11
Canada’s Energy Future 2016: Update - Energy Supply and Demand Projections to 2040 - Appendices – Oct 2016
12
From Canada’s Energy Future 2016 Province and Territory Outlooks
11 | P a g eFigure 3.1: An Overview of the NEB EF 2016 Projections and Key Assumptions13
AER Outlooks
The Alberta Energy Regulatory (AER) annually provides the ST98 Assessment of Alberta’s Energy
Reserves (2015) and Supply/Demand Outlook from 2016 to 2025 (ST 98-2016)14:
“As part of this mandate, one of the AER’s key services is to provide credible information about AB’s
energy resources that can be used for good decision making. To this end, the AER issues a report
every year that gives stakeholders independent and comprehensive information on the state of
reserves, supply, and demand for AB’s diverse energy resources: crude bitumen, crude oil, natural
gas, natural gas liquids, sulphur, and coal15.”
The ST98-2016 provides a single case outlook for AB that can provide further understanding of the
energy outlook for the Province as part of this assessment.
Natural Gas Demand
Intra Western Canada – Production
The NEB EF 2016 provides forecasts of demand by energy source (Electricity, Natural Gas, Refined
Petroleum Products (RPP) and Liquid Petroleum Gas (LPG), Biofuels and Emerging Fuels, and Others) by
Province and Territory. The following analysis sums the Provincial analyses for BC, AB and SK to provide
a look for Western Canada. The demand is intra province and does not included gas moved to other
13
From Canada’s Energy Future 2016 Province and Territory Outlooks
14
http://www.aer.ca/data-and-publications/statistical-reports/st98
15
From the ST98-2016 Report
12 | P a g eareas of Canada or exported to the United States (US); natural gas exported to the US is analyzed
separately. Demand is reported in Pentajoules/year and discussed here in Bcf/day16;
The NEB analyzes demand as primary and secondary end-use17. Primary demand is the total energy used
including end-use demand and the energy required to generate electricity. It is calculated by adding the
energy used to generate electricity (fossil fuels, hydro, nuclear and renewables) to total end-use
demand and then subtracting the end-use demand for electricity. Removing end-use electricity demand
from the total avoids double counting18. Secondary (end use) demand is forecast in four categories:
Residential is the energy consumed by Canadian households. This includes energy used for
space and water heating, air conditioning, lighting, large appliances, and other energy using
devices like televisions and computers.
Commercial is a broad category that includes offices, stores, warehouses, government and
institutional buildings, utilities, communications, and other service industries. It also includes
energy consumed by street lighting and pipelines. Buildings use energy for space and water
heating, air conditioning, lighting, appliances and other devices. Pipelines use energy to power
pumps or compressors that move oil and natural gas through pipelines.
Industrial includes manufacturing, forestry, fisheries, agriculture, construction, mining, and oil
and natural gas extraction.
Transportation includes passenger and freight on-road transportation, as well as air, rail,
marine, and non-industrial off-road travel, such as recreational all-terrain vehicles and
snowmobiles.
Demand includes natural gas consumed in field producing and processing operations. For example, this
would include the combustion of natural gas by natural gas producers to operate field gathering,
compression and processing. The NEB supply analysis is based on Marketable natural gas that excludes
those volumes.
The following chart shows Reference Case natural gas demand by demand type (total including
production facility fuel). Total Western Canada Natural Gas Demand is expected to increase to 13.4
Bcf/d in 2040 from 9.1 Bcf/d in 2015. Industrial use is the largest consumer of natural gas at 6.3 Bcf/d in
2015 (70% of the total) increasing to 8.7 Bcf/d in 2040 (65% of the total). Electric power generation is
the second largest consumer of natural gas at 1.2 Bcf/d in 2015 (12.7% of the total) increasing to 2.6
Bcf/d in 2040 (19.5% of the total).
16
Pentajoules/year are converted to Bcf/d by using a factor of 0.9478 Bcf per Pentajoule
17
Excerpts from the NEB EF 2016
18
Net natural gas used for electrical power generation is calculated by taking the total adjusted Primary Energy
Demand for natural gas and subtracting the Secondary Demand for natural gas
13 | P a g eFigure 3.2: Western Canada Natural Gas Demand – By Type19
Gas used to generate electricity is the second largest component of Western Canada Demand, the
following table summarizes that demand by province.
Table 3.1: Western Canada Natural Gas Demand for Electrical Power Generation20
Natural Gas Demand Bcf/d 2015 2025 2040
Alberta21 0.93 1.49 2.13
British Columbia 0.02 0.06 0.06
Saskatchewan 0.18 0.25 0.43
Total 1.15 1.79 2.63
In comparison, the Alberta Energy Regulator estimates the natural gas demand for electrical power
generation at 0.8 Bcf/d in 2015 and 1.09 Bcf/d in 202522.
The following figure shows Reference Case natural gas demand by province (total including production
facility fuel). AB is the largest consumer of natural gas in Western Canada at 7 Bcf/d in 2015 (77% of the
total) increasing to 10.5 Bcf/d in 2040 (78% of the total). In 2040, the NEB forecasts that total demand
intra BC will be 1.5 Bcf/d (11.3% of the total) and in SK 1.4 Bcf/d (10.7% of the total).
19
Based on data from the EF 2016 Energy Supply and Demand Projections to 2040
20
Based on data from the EF 2016 Energy Supply and Demand Projections to 2040
21
The NEB EF 2016 Reference Case forecasts adjusted primary demand for coal in AB will decrease to 300
Pentajoules per year in 2040 from 462 in 2015 (a decrease of 35%) with the assumption that AB coal fired power
generation is still operating
22
Based on data from the AER ST98 2016
14 | P a g eFigure 3.3: Western Canada Natural Gas Demand – By Province23
Western Canada Exports – Marketable Gas
There are three other sources of demand for Western Canadian natural gas;
1. Movement to other provinces for consumption.
2. Export to the US.
3. Export off shore as Liquefied Natural Gas (LNG).
The NEB EF 2016 provides forecasts for natural gas exports, allowing us to understand the impact that
exports have on the overall supply/demand balance. Note that both the following supply and demand
forecasts are in Marketable Gas excluding natural gas used to fuel surface production facilities and, as a
result, are less than the total demand as summarized in the preceding section.
The following chart shows total Canadian natural gas supply, demand, LNG exports and conventional
exports in the Reference Case. Canadian Natural Gas production is expected to increase to 17.9 Bcf/d in
2040 from 15.1 Bcf/d in 2015. Non-LNG exports are expected to decrease from 5.2 Bcf/d in 2015 to 0.2
Bcf/d in 2040. The EIA forecasts a similar trend but is slightly more bullish on overall net imports24 to the
US indicating 1.6 Bcf/day in 204025. Production from the WCSB in 2015 (14.8 Bcf/d) represents 98% of
total Canadian supply and >99% in 2040 (17.8 Bcf/d). Total Canadian Demand in the following figure
excludes non-marketed natural gas production used directly by those that produce it (including: flared
gas, in situ oil sands consumption, etc.).
23
Based on data from the EF 2016 Energy Supply and Demand Projections to 2040
24
Net imports are defined as US imports less exports
25
Source US Energy Information Systems (Oct 2008)
15 | P a g eFigure 3.4: Canadian Natural Gas Supply26
The following chart provides a range of net exports in the High, Low and Reference Case. Net exports
are the difference between Canadian marketable natural gas and Canadian demand and include both
conventional and LNG volumes. In the Reference Case, export volumes decline until 2019 when the first
exports of LNG are forecasted to begin. Growth in LNG Exports continue until 2023 after which total
exports decline to 2040. In the High Price Case, exports continue to grow due to the higher natural gas
prices. The converse occurs in the Low Price Case.
Fiugre 3.5: Canadian Net Exports of Natural Gas27
One of the key variables to be considered in WCSB demand is the timing and pace of West Coast LNG
Development. The NEB considered three LNG Development Cases in the EF.2016 analysis; High,
Reference and No Development.
The following figure shows forecast LNG Exports from the WCSB in the 3 LNG Cases. The Reference and
High Cases assume the start-up of initial liquefaction capacity in 2018/19. In 2019, the Reference Case
indicates 0.3 Bcf/d of LNG exports with 0.8 Bcf/d in the High Case. The Reference Case indicates peak
26
Based on data from the EF 2016 Energy Supply and Demand Projections to 2040
27
From the EF 2016 Energy Supply and Demand Projections to 2040
16 | P a g ecapacity development in 2026 to 2040 with 2.4 Bcf/d of Exports. The High Case indicates peak capacity
development in 2034 to 2040 with 6.2 Bcf/d of exports. LNG is forecast to be a significant component of
required supply by 2040. In the Reference Case LNG represents 14% of the supply requirement and 29%
in the High Case28.
Figure 3.6: WCSB LNG Exports29
The following figure summarizes (at the end of 2015) Global LNG Supply and the LNG Liquefaction
Capacity that was under construction as of that date, projects under construction (mostly in the US and
Australia) would add 13 Bcf/d of capacity.
Fiugre 3.7: Worldwide LNG Liquefication Capacity Additions30
28
Since the NEB prepared the EF 2016 forecast, the projects being developed in Western Canada have slowed; on
stream dates in the late 2010’s or early 2020’s are probably overly optimistic. Peak development forecast in the
out years of the forecast (2030+) may still be realistic
29
Based on data from the EF 2016 Energy Supply and Demand Projections to 2040
30
NEB Canadian Energy Dynamics Highlights of 20015 - Figure 17 LNG Liquefaction Capacity 2010 to 2019
17 | P a g eThe following figure summarizes LNG pricing in 2015 relative to 2013/14. The monthly average Japan
Korea Marker spot price fell from a high of US$19.40 per MMBtu in early 2014 to an average of US$7.45
per MMBtu in 2015. Pricing of LNG traded under oil-linked contracts dropped in response to the decline
in crude oil prices.
Figure 3.8: LNG and Henry Hub Natural Gas Prices31
These changes in the world LNG Market has introduced uncertainty in the timing and ultimate
development of Canadian LNG. Curtailment of development would put pressure on Canadian natural gas
pricing as supply competes for existing markets in Canada and the US and would result in slowed
development as economics are negatively impacted.
Alberta – Marketable Gas
The AER ST98-2016 analysis contains historical and forecast (to 2025) natural gas demand and
production data. The analysis provides a complete view of AB demand as it includes gas that is moved
out of the Province within Canada and for export to the US. Demand and Supply is expressed in
Marketable Gas32 that excludes natural gas used in Production Operations. As a result, the forecasts are
less than that incorporated into the NEB total demand for AB as that analysis includes gas consumption
for production and processing operations.
The following figure shows natural gas demand for AB to 202533. Total natural gas demand in AB in 2015
was 10.6 Bcf/day and forecast to decrease to 8.1 Bcf/day in 2025. In 2015, intra-AB demand accounted
for 49% (5.2 Bcf/day) of total AB demand, increasing to 69% (6.3 Bcf/day) in 2025. Removals (to Eastern
Canada and export to the US) are forecasted to decrease to 2.5 Bcf/day in 2025 from 5.4 in 2015.
Oilsands industrial use is the largest consumer of natural gas in the province accounting for 34% of intra-
31
NEB Canadian Energy Dynamics Highlights of 20015 - Figure 18 LNG and Henry Hub Natural Gas Prices
32
The AER defines marketable gas as the gas that remains after the raw gas is processed to remove
nonhydrocarbons and heavier natural gas liquids and that meets specifications for use as a fuel
33
From the ST98 Report
18 | P a g eAB demand in 2015 (1.8 Bcf/day) and forecast to increase to 45% in 2025 (2.9 Bcf/day). Electricity
generation accounts for 16% of intra-AB demand in 2015 (0.8 Bcf/day) and is forecast to increase to 17%
in 2025 (1.1 Bcf/day).
Figure 3.9: Alberta Marketable Gas Removals and Demand by Sector34
One of the components of natural gas demand in AB is gas consumed in the production of crude
bitumen. The AER in its ST98 analysis forecasts both Crude Bitumen production and related natural gas
demand. From the AER Website:
“Crude bitumen is extra-heavy oil that in its natural state does not flow to a well. It occurs in sand
(clastic) and carbonate formations in northern AB. Crude bitumen and the rock material it is found
in, together with any other associated mineral substances other than natural gas, are called oil sands.
For administrative purposes, the geological formations and the geographic areas containing the
bitumen are designated as oil sands areas (OSAs). Combined, these areas occupy an area of about
142 000 square kilometers (km2) (54 000 square miles). Other heavy oil is deemed to be oil sands if it
is located within an OSA. Since some bitumen within an OSA will flow to a well, it is amenable to
primary development and is considered to primary crude bitumen in this report35.
From the ST98 Analysis, the following figure summarizes the AER’s forecast of Crude and Bitumen
production to 2025.
34
Figure S5.5 is from the ST98 2016 Website Report
35
From the ST98 Report
19 | P a g eFigure 3.10: Alberta Crude Bitumen Production36
From the ST98 Analysis;
“Total mineable raw production is expected to grow 40 per cent by 2025 relative to 2015 levels;
Suncor’s Fort Hills and further expansions at Imperial’s Kearl are forecast to contribute the bulk of
the added production. Compared to 2015, total in situ production is expected to grow 75 per cent by
2025. As with mineable production, the outlook for in situ production is slightly lower relative to last
year’s forecast due to the reassessment of project start dates in light of the current low price
environment.”
The following figure shows Natural Marketable Gas Demand for AB Industrial – Oil Sands37. Consumption
if forecast to increase from 1.8 Bcf/d in 2015 (17% of total AB Demand) to 2.9 Bcf/d in 2025 (32%).
Changes in development of crude and bitumen has the potential to substantially impact the demand for
Marketable Gas in AB.
Figure 3.11: Alberta Industrial – Oil Sands Natural Gas Demand38
36
Figure S3.3 is from the AER ST98 2016 Website Report
37
From ST98
38
Based on data from the AER ST 98 Report
20 | P a g eNatural Gas Supply – Marketable Gas
Western Canada – Western Canadian Sedimentary Basin
The NEB EF 2016 provides outlooks of natural gas supply by Province and Territory and for the Western
Canadian Sedimentary Basin (WCSB)39. The following analysis is for the WCSB.
The following chart shows WCSB natural gas supply to 2040 in the 6 NEB analyzed cases40 (marketable
gas). The Reference Case forecasts natural gas production from the Western Canadian Sedimentary
Basin to grow to 17.8 Bcf/d in 2040 from 14.8 Bcf/d in 2015.
Figure 3.12: WCSB Natural Gas Supply by Case41
The following chart shows WCSB natural gas supply to 2040 by Province for the Reference Case
(marketable gas). AB production is forecast to drop to 9.5 Bcf/d in 2040 (53% of the total) from 10 Bcf/d
in 2015 (67% of the total) as production grows in BC to meet the forecasted LNG Demand. BC
production is forecasted to grow to 8.2 Bcf/d in 2040 from 4.4 Bcf/d in 2015 (46% of total WCSB
production in 2040 from 30% in 2015).
39
The Western Canadian Sedimentary Basin (WCSB) is the sedimentary basin underlying most of Western Canada
including southwestern Manitoba, southern Saskatchewan, AB, northeastern BC and the southwest corner of the
Northwest Territories. It consists of a massive wedge of sedimentary rock extending from the Rocky Mountains in
the west to the Canadian Shield in the east. This wedge is about 6 kilometers (3.7 miles) thick under the Rocky
Mountains, but thins to zero at its eastern margins. The WCSB contains one of the world's largest reserves of
petroleum and natural gas and also has huge reserves of coal. Of the provinces and territories within the WCSB, AB
has most of the oil and gas reserves and almost all of the oil sands. From EF 2016
40
From EF 2016
41
Based on data from the EF 2016 Energy Supply and Demand Projections to 2040. Note that the Reference and
Constrained Cases data sets plot over each other
21 | P a g eFigure 3.13: Western Canada Natural Gas Supply by Province42
Alberta
As with demand, the AER analyzes natural gas production in the ST98-2016 Report. Production is
reported by gas type (coal bed methane (CBM), shale gas and gas from oil wells) and by the Petroleum
Services Association of Canada (PSAC) areas for conventional production; the following map highlights
the PSAC areas.
42
Based on data from the EF 2016 Energy Supply and Demand Projections to 2040
22 | P a g eFigure 3.14: Petroleum Services of Canada Natural Gas Forecasting Areas43
The following chart shows AB Supply by PSAC area44 (marketable gas). Marketable Natural Gas
production in the province is forecast to drop to 8.8 Bcf/day in 2025 from 10.6 Bcf/day in 2015. The
largest production area is the Foothills Front accounting for 47% of AB production in 2015 (5 Bcf/day)
and forecasted to increase to 52% in 2025 (4.57 Bcf/day).
43
The figure is from the ST98 Report
44
From the ST98 Report
23 | P a g eFigure 3.15: AB Marketable Gas Production by Geographic Area45
The following chart shows the AER and NEB forecasts of natural gas supply (marketable gas). The NEB’s
Canada’s EF 2016 indicates a slightly less conservative view of AB forecasted production. The EF 2016
Reference Case production is forecast at 9.5 Bcf/d in 2040 down from 10 Bcf/d in 2015. The outcomes
from the five Cases range from a high of 13 Bcf/d (High Price) to 8 Bcf/d (Low Price) in 2040. The AER ST
98 forecast is slightly higher historically and approximates the NEB Low Case Forecast.
Figure 3.16: AB Natural Gas Production by Case46
Impact of Hydraulic Fracturing
One of the key technology advances that has impacted the supply and resulting price of natural gas has
been the advent of long reach horizontal well drilling and multi stage hydraulic completions. These
approaches have allowed the industry to produce natural gas (and oil) from tight conventional and shale
formations that had previously been uneconomic to develop. These advancements have also triggered
45
Figure S5.1 is from the AER ST98 2016 Website Report
46
Based on data from the AER ST98 Report and from the EF 2016 Energy Supply and Demand Projections to 2040.
Note that the Reference and Constrained Cases data sets plot over each other
24 | P a g econsiderable discussion on the expansion of hydraulic fracturing and the impact that it could have on
ground water supplies. The NEB EF 2016 provides an outlook of natural gas production for the WCSB by
gas type that provides some insight into future gas production and infer the potential for curtailment of
supply should significant changes be made to the regulations that support the use of hydraulic fracturing
and the development of the corresponding resource.
The following chart shows the Reference Case forecast by gas type (marketable gas). Tight gas is the
predominate gas type by 2040 growing to 13.6 Bcf/d in 2040 from 8 Bcf/d in 2015 (77% of total WCSB
production in 2040 from 54% in 2015). In the Reference Case, there is some growth in Shale gas as
production grows to 1.1 Bcf/d in 2040 from 0.6 Bcf/d in 2015. In combination, tight and shale gas are
anticipated to provide 83% of the overall gas supply in the Reference Case.
Figure 3.17: WCSB Natural Gas Supply by Play Type47
Within the Canada, regulations that control hydraulic fracturing and their impacts are primarily a
provincial responsibility. With the development of a high percentage of the natural gas supply currently
dependent upon hydraulic fracturing, any significant changes to that practice (disallowing or curtailing
hydraulic fracturing) would have an impact on the natural gas supply.
Natural Gas Resource Potential
One of the key variables that need to be considered is the remaining recoverable resource in Western
Canada and in AB.
Western Canada Sedimentary Basin
The NEB EF 2016 provides an estimate of Natural Gas Resource Potential for the Western Canadian
Sedimentary Basin. The following table shows remaining Marketable Resource for 3 Cases (Reference,
Low Price and High Price). Based on the 2015 WCSB Marketable Production of 5.2 Tcf/year (14.3 Bcf/d),
the WCSB has 164 years of remaining life on the Reference Case Remaining Marketable Resource and
255 years at the High Price Forecast.
47
Based on data from the EF 2016 Energy Supply and Demand Projections to 2040
25 | P a g eTable 3.2: WCSB Marketable Resource48
WCSB Remaining Marketable Resource (Tcf) Reference Low Price High Price
Conventional49 599 474 936
Tight Gas Portion50 528 403 866
Montney Tight Gas Portion 447 348 738
CBM 34 20 52
Shale Gas51 222 157 337
Horn River Portion 78 61 96
Sub Total 855 651 1325
Natural Gas Resource Potential – Alberta
The following table shows resource at year end 2015 for AB. Based on 2015 Production of 3.9 Tcf/year
(10.7 Bcf/d - as compared to Marketable Production of 8.8 Bcf/d), the Province has 8 years of remaining
life on its Established Reserves and 57 years of remaining life on its Ultimate Recoverable Resource52.
Table 3.3: Alberta Resource53
AB Resource (Tcf)
Initial in-place Resources 351
Initial established Reserves 201
Cumulative Production 169
Remaining Established Reserves 31.3
Annual Production 3.9
Ultimate potential recoverable Resource (excluding unconventional natural gas) 223
48
Based on data from the EF 2016 Energy Supply and Demand Projections to 2040
49
Includes the following tight gas and Montney Resources
50
Includes the following Montney Resource
51
Includes the following Horn River Resource
52
Note that the AB resource numbers exclude unconventional natural gas resources
53
Based on data from the AER ST98 2016 analysis (Table 1 Executive Summary)
26 | P a g eSection 4 – United States Natural Gas Overview
The major impacts of the replacement of coal fired power generation in AB will be on the Western
Canada natural gas systems, however those systems are linked to the US and need to be understood in
the larger context.
The following analysis of US Natural Gas Demand and Supply is based on information sourced from the
US Energy Information Administration (EIA) Website and Publications. The EIA is part of the US
Department of Energy and a principal agency of the US Federal Statistical System responsible for
collecting, analyzing, and disseminating energy information to promote sound policymaking, efficient
markets, and public understanding of energy and its interaction with the economy and the environment.
EIA programs both short and long term energy outlooks for all types of energy used in the US.
(Petroleum and Other Liquids, Natural Gas, Electricity, Coal, Renewables and Alternate Fuels, and
Nuclear and Uranium).
Key sources of data for the US natural gas system from the EIA include the: Annual Energy Outlook 2016,
Natural Gas 2015 Annual Publications and latest AEO2016 Energy Forecasts. For the purpose of this
analysis, the Reference Case from the AEO2016 Forecast will provide key data and insights.
The AEO2016 forecast generally contains a spread of outcomes based on the impact of three oil price
inputs. From the EIA Website:
“Key influences on consumption and production are price trends and the reactions of consumers and
producers to those trends, which in turn influence future prices. EIA has developed three price cases
to examine a range of potential interactions of supply, demand, and prices in world liquids markets:
The Reference case and alternative Low Oil Price and High Oil Price cases. While the three oil price
cases represent a wide range of uncertainty in future markets, they do not capture all possible
outcomes. Because EIA's oil price paths represent market equilibrium between supply and demand,
they do not show the price volatility that occurs over days, months, or years.”
The following figure shows the oil price forecast that is the basis of the 3 oil based EIA Modelled Cases54.
54
Source US Energy Information Systems (Oct 2008)
27 | P a g eYou can also read