Year-in-Review: 2011 Energy Infrastructure Events and Expansions - Infrastructure Security and Energy Restoration
←
→
Page content transcription
If your browser does not render page correctly, please read the page content below

Year-in-Review: 2011
Energy Infrastructure Events and Expansions

  Infrastructure Security and Energy Restoration
 Office of Electricity Delivery and Energy Reliability
             U.S. Department of Energy

                      April 2012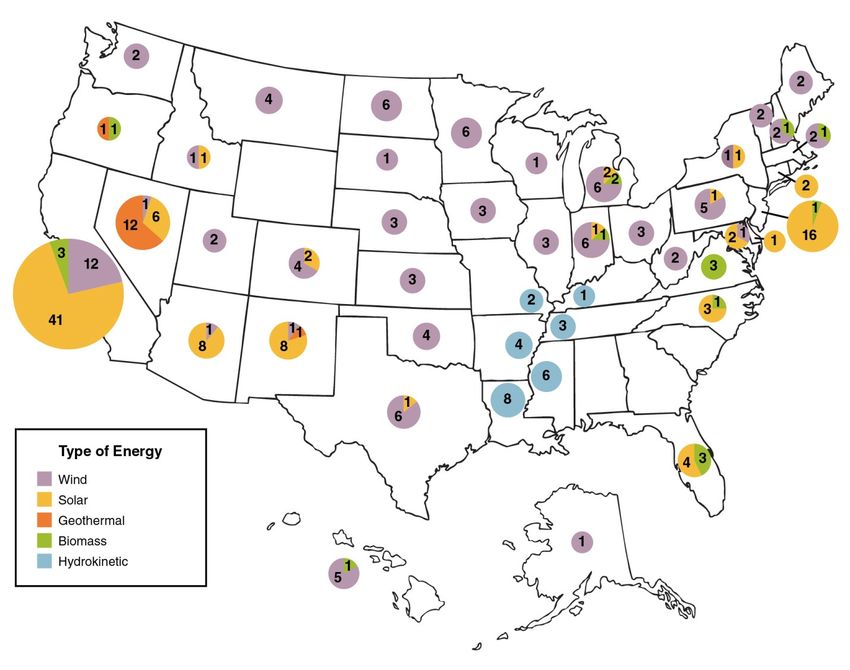
For Further Information
This report was prepared by the Office of Electricity Delivery and Energy Reliability under the
direction of Patricia Hoffman, Assistant Secretary, and William Bryan, Deputy Assistant
Secretary.

Specific questions about this report may be directed to Alice Lippert, Senior Technical Advisor
(alice.lippert@hq.doe.gov).

Contributors include Rick Tidball, Kevin DeCorla-Souza, and Laura Gehlin.

   DOE / OE / ISER                                  ii                                2011 YIR
Contents
1.       Introduction..................................................................................................................................... 4
         1.1         Background and Organization........................................................................................ 4
         1.2         Data Sources and Limitations ........................................................................................ 5
         1.3         Financial and Economic Context ................................................................................... 5
2.       Major Developments ..................................................................................................................... 7
         2.1         Summary of Incidents and Disruptions ......................................................................... 7
         2.2         Disruption Analysis ........................................................................................................ 10
         2.3         Electricity Disruptions .................................................................................................... 10
                     2.3.1 Customer Outages .................................................................................10
                     2.3.2 Power Plant Outages ..............................................................................12
         2.4         Natural Gas Disruptions ................................................................................................ 13
                     2.4.1 Production and Processing Plants ..........................................................13
                     2.4.2 Pipelines .................................................................................................14
         2.5         Petroleum Disruptions ................................................................................................... 15
                     2.5.1 Production ..............................................................................................15
                     2.5.2 Refineries and Fractionators ...................................................................16
                     2.5.3 Transportation ........................................................................................17
                     2.5.4 Hours-of-Service Exemptions .................................................................18
         2.6         Biofuel Disruptions ......................................................................................................... 19
         2.7         Cyber Security ................................................................................................................ 20
3.       Infrastructure Changes ............................................................................................................... 21
         3.1         Electricity ......................................................................................................................... 21
                     3.1.1 Coal-fired Plant Retirements ...................................................................21
                     3.1.2 Coal- and Natural Gas-fired Plants – New Capacity ...............................22
                     3.1.3 Renewable Plants – New Capacity .........................................................23
                     3.1.4 Nuclear Power Plants .............................................................................24
                     3.1.5 Transmission Expansion and Smart Grid Implementation.......................26
         3.2         Natural Gas Projects...................................................................................................... 27
                     3.2.1 Natural Gas Processing Plants ...............................................................27
                     3.2.2 Natural Gas Pipelines .............................................................................28
                     3.2.3 LNG Export Terminals ............................................................................29
         3.3         Petroleum Projects ......................................................................................................... 29
                     3.3.1 Refineries ...............................................................................................30
                     3.3.2 Transportation ........................................................................................30

     DOE / OE / ISER                                                              1                                                       2011 YIR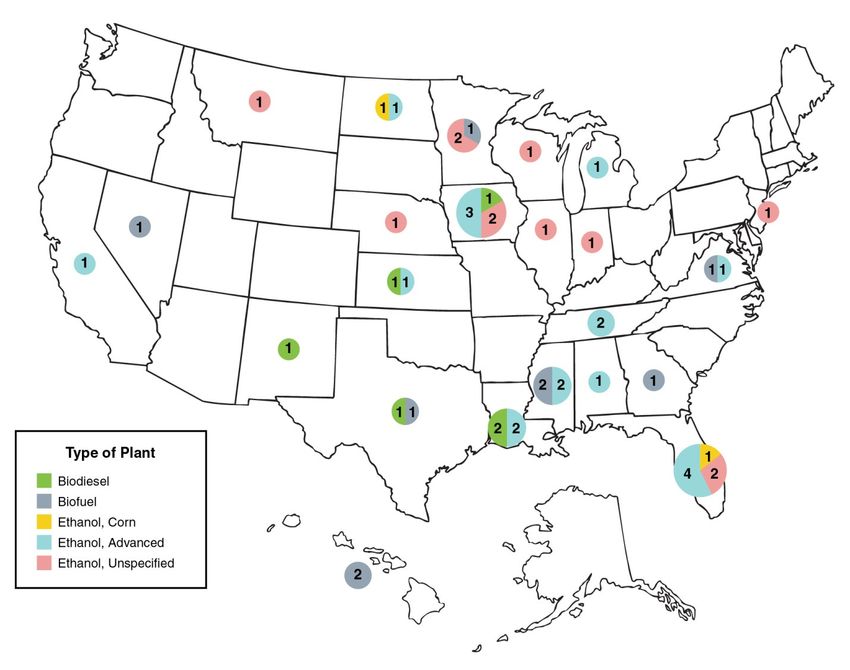
3.4        Biofuels ............................................................................................................................ 32
                      3.4.1 New Biofuel Plants .................................................................................32
                      3.4.2 Plants in Transition .................................................................................33
                      3.4.3 Distribution Infrastructure ........................................................................34
                      3.4.4 Policy Changes and Funding ..................................................................35
4.         International Events .................................................................................................................... 36
           4.1        Incidents and Disruptions.............................................................................................. 36
           4.2        Infrastructure Projects ................................................................................................... 37
                      4.2.1 Petroleum ...............................................................................................37
                      4.2.2 Natural Gas ............................................................................................39
                      4.2.3 Renewables ............................................................................................39
Appendix A.           Criteria for EAD Story Selection................................................................................... 41
Asset or Sector Activity (grouped by energy type) .......................................................................... 41
Type of Event or Disruption ................................................................................................................ 41
Criteria by Story Category1 .................................................................................................................. 41
Appendix B.           Major Developments, 2011 ........................................................................................... 42
Appendix C.           Hours-of-Service Exemptions Citations ...................................................................... 48
Appendix D.           Petroleum Infrastructure Projects ................................................................................ 53
Appendix E.           Abbreviations .................................................................................................................. 55

     DOE / OE / ISER                                                               2                                                       2011 YIR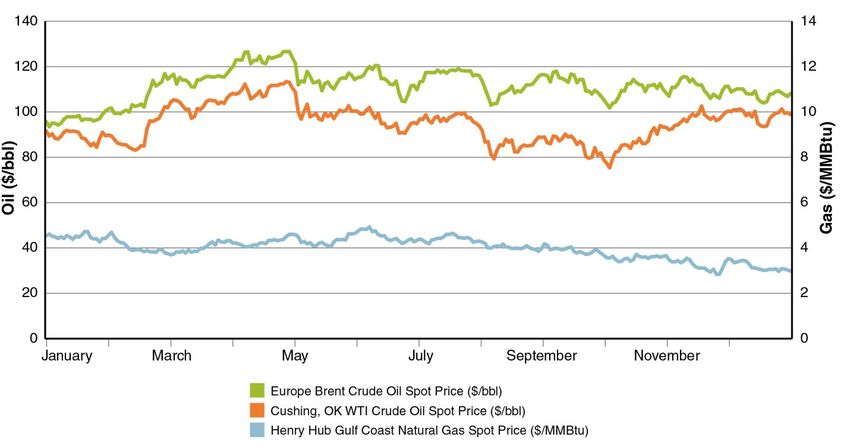
Figures
Figure 1. U.S. Oil and Gas Spot Prices, 2011 .............................................................................. 6
Figure 1. 2011 Timeline for Major Stories ..................................................................................... 7
Figure 3. Major U.S. Electric Customer Outage Events, 2010–2011 ..................................... 10
Figure 4. U.S. Electric Customer Outage Events by Cause and Magnitude, 2011 .............. 12
Figure 5. Unplanned Power Plant Outages, 2011 ..................................................................... 13
Figure 6. U.S. Refinery Disruption Events by Cause, 2011 ..................................................... 17
Figure 7. New Power Plant Capacity in the United States, 2011 ............................................ 22
Figure 8. Number of New and Proposed Renewable Energy Projects, 2011 ....................... 24
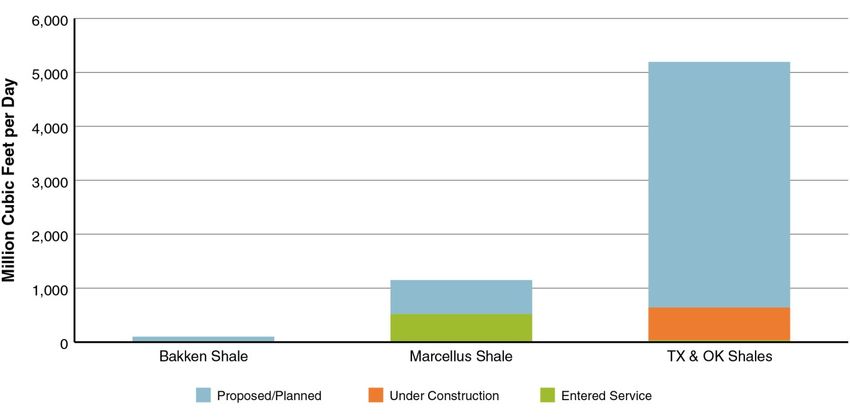
Figure 9. Capacity of New Natural Gas Processing Plant Projects by Shale Play ............... 28
Figure 10. Number of Proposed Biofuel Projects, 2011 .............................................................. 33
Tables
Table 1. Hours-of-Service Waivers Issued, 2011 ..................................................................... 19
Table 2. Proposed LNG Export Terminal Projects ................................................................... 29
DOE / OE / ISER 3 2011 YIR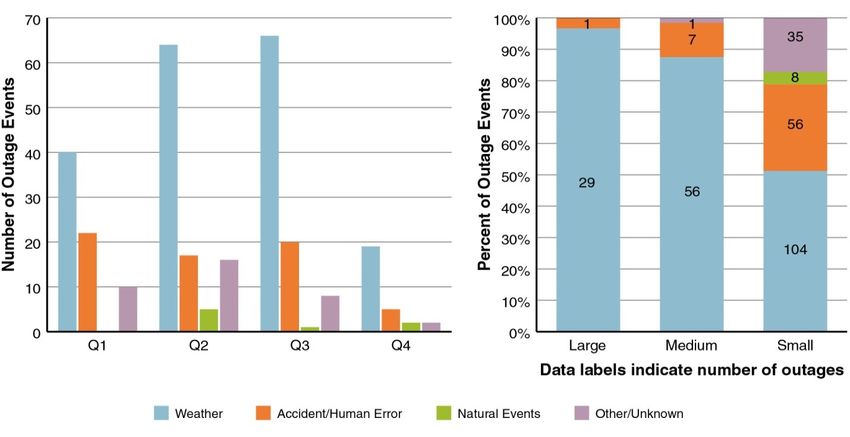
1.        Introduction
The 2011 Year-in-Review (YIR) provides a summary of significant energy disruptions and
infrastructure changes that occurred in the United States throughout 2011. The focus is on the
United States, but international events that impacted the United States are also reported.

1.1       Background and Organization

The 2011 YIR is based primarily on information reported in the Energy Assurance Daily (EAD)
between January 1, 2011 and December 31, 2011. The EAD contains summaries of energy
sector highlights and is published Monday through Friday by the U.S. Department of Energy
(DOE), Office of Electricity Delivery and Energy Reliability (OE), Infrastructure Security and
Energy Restoration (ISER) Division.

In 2011, stories were grouped by the level of impact on energy infrastructure into one of the
following categories (see Appendix A for selection criteria):1
      •   Major Development
      •   Energy Sector Stories (sub-divided into electricity, petroleum, natural gas, and other
          energy types)
      •   Energy Notes

Major Development stories describe events that disrupt energy service to a large segment of the
population and/or damage critical assets in the energy sector. These events frequently show up
in newspaper headlines and in television news reports. The EAD focuses on only the event’s
impact to the energy sector, and not on the widespread impact of the event. As an example,
Hurricane Irene in August 2011 knocked out power to millions of customers, and this powerful
storm was reported as a Major Development story for several days. While Hurricane Irene had
many disastrous impacts, the focus of the EAD was on the magnitude of the initial power outage
and the progress in restoring power to electricity customers.

Most events covered are not classified as Major Developments; rather, they fall into the Energy
Sector Stories category. Energy Stories are based on significant events, but the level of
disruption or damage is less widespread than a Major Development. Finally, Energy Notes
describe noteworthy energy sector events whose impacts are typically confined to a relatively
small geographic region.

1
 In 2012, the EAD story categories were revised to remove the “Energy Notes” section and add an “International
News” section.

     DOE / OE / ISER                                         4                                       2011 YIR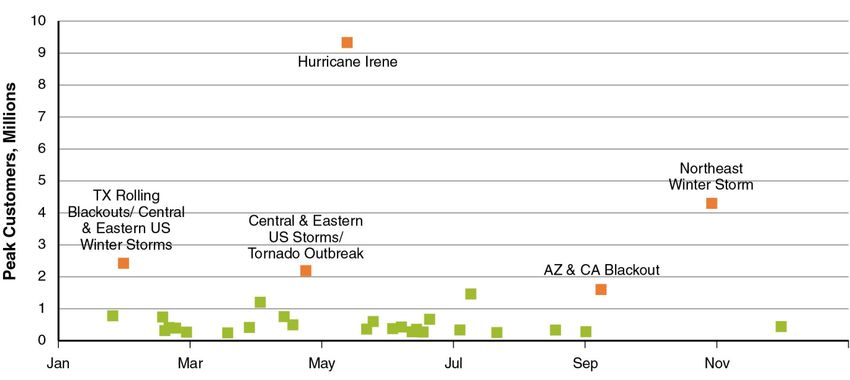
1.2        Data Sources2 and Limitations

The EAD is derived from publicly available information. Classified or business-confidential data
are not used, nor is information that is accessible only through subscription services. As a
result, the EAD—and by extension, the 2011 YIR—should not be viewed as an exhaustive
summary of all significant energy events.

The 2011 YIR is subject to regional or regulatory reporting differences. For example, California
and Texas State agencies tend to release more energy information into the public domain than
other States. This abundance of information can distort the balance of stories published, with
more coverage appearing for California and Texas. Similarly, the U.S. Nuclear Regulatory
Commission (NRC) provides an abundance of public information on nuclear power plants,
including daily records on the operational status of all 104 nuclear power plants in the United
States. There is no equivalent reporting mechanism for coal, natural gas, or any other class of
utility-scale power generation. As a result, there is often a large number of nuclear power plant
stories compared to coal and other plant types, even though coal accounts for significantly more
electricity production in the United States—about 45 percent from coal-fired plants and about 20
percent from nuclear plants.3

Due to the limited scope of data sources used to support the EAD, readers are cautioned to not
use data in the 2011 YIR to support detailed analyses. Comparisons between 2010 and 2011
are provided in the 2011 YIR to highlight a few selected trends, but these comparisons are
based only on stories captured by the EAD and should not be viewed as rigorous comparisons
between events that occurred in 2010 and 2011. Readers are advised to view the 2011 YIR as
a snapshot of newsworthy events and broad trends that shaped the U.S. energy sector in 2011.

1.3        Financial and Economic Context

Price trends for crude oil and natural gas in 2011 are shown in Figure 1. Natural gas prices
averaged between $3.80 and $5.00 per million British thermal units (MMBtu) through early
June, and then began a steady decline to close the year at about $3.00/MMBtu. This decline
represents sustained increases in natural gas supply stemming from new natural gas production
from the Marcellus and Utica Shale formations in the Appalachian region and the Eagle Ford
Shale formations in South Texas. The increased supply coupled with a warmer-than-normal
winter has lowered the market price to levels not seen since 2002.

2
 Unless noted otherwise, the source for all information in this report is the Energy Assurance Daily
(www.oe.netl.doe.gov/ead.aspx).
3
    http://www.eia.gov/electricity/annual/html/table2.1a.cfm

      DOE / OE / ISER                                          5                                       2011 YIR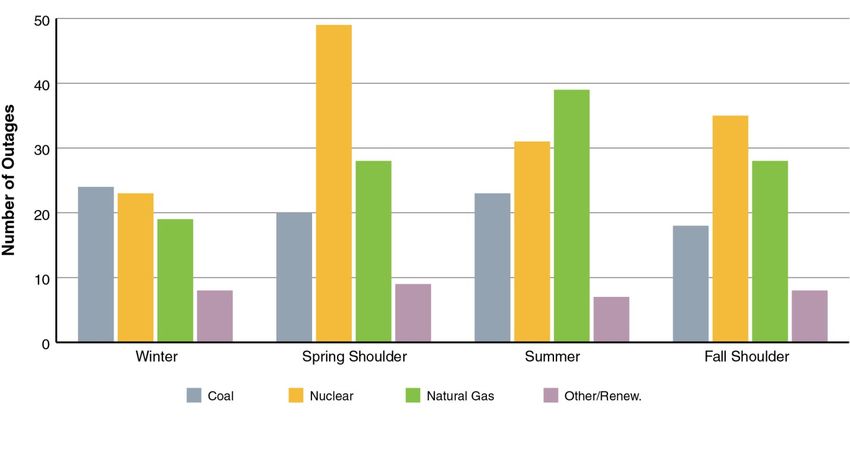
Figure 1.     U.S. Oil and Gas Spot Prices, 2011

Figure 1 shows two crude oil benchmark prices: U.S. West Texas Intermediate (WTI) and North
Sea Brent. Crude prices rose for both benchmarks through May 2011, driven primarily by the
Libyan crisis and the Arab Spring unrest. Thereafter, the Brent price varied between $110 and
$120 per barrel (bbl), while the WTI price declined to levels under $80/bbl by early October
before increasing to around $100/bbl by the end of the year.

Historically, WTI has typically traded at a slight premium to Brent. In 2011, however, the market
price for Brent was as much as $28/bbl more than WTI. The reason for this departure from
historical price trends was that crude oil inventories in Cushing, Oklahoma—the location used to
determine WTI prices—grew substantially in 2011 as a result of crude production from the
Williston Basin and Bakken field in North Dakota, production from other U.S. oil fields, and
supplies from Western Canada. Lack of pipeline infrastructure out of Cushing to Gulf Coast
refining centers resulted in inventory constraints, and Cushing crude had to be heavily
discounted to move it by pipeline—and in some cases, by truck—to the Gulf Coast. As noted in
Section 4 (Infrastructure Changes), a large number of petroleum transportation projects were
announced in 2011 to address these inventory constraints, and some have already been
implemented (including railcar shipments of Bakken crude to the Gulf Coast). Significantly more
pipeline capacity out of Canada and the Bakken and Eagle Ford regions may become available
over the next 3 to 4 years.

   DOE / OE / ISER                                 6                                 2011 YIR
2. Major Developments
This section provides a summary of major incidents and disruptions reported in the Energy
Assurance Daily (EAD) during 2011.
2.1 Summary of Incidents and Disruptions
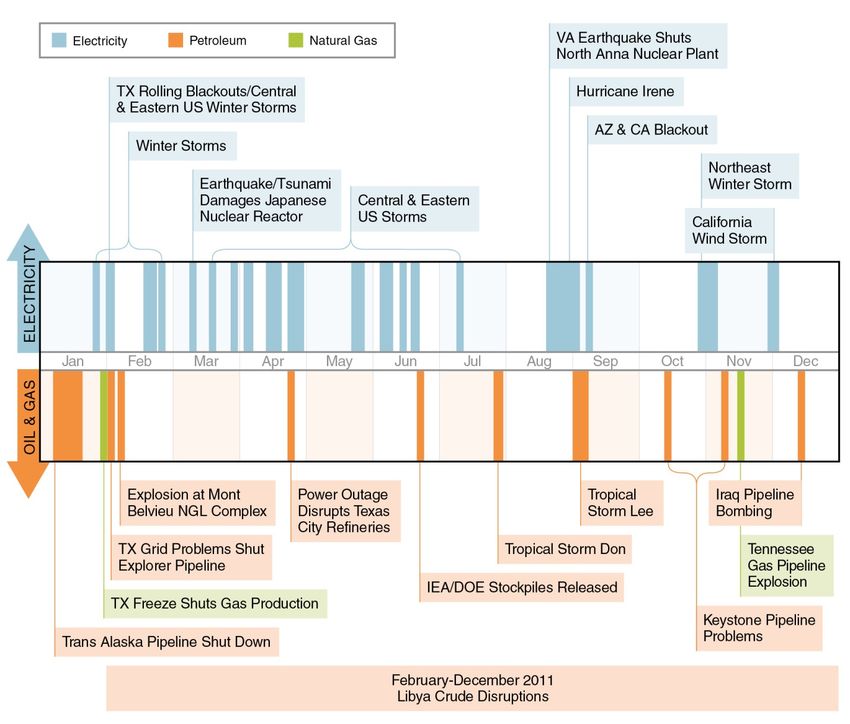
In 2011, there were 37 unique energy events that met the criteria for a major disruption,
including three events impacting international energy assets (see Figure 2 for timeline,
Appendix A for classification criteria, and Appendix B for a full list of all major developments).
Disruptions to energy assets were primarily caused by weather or natural events, including
hurricanes, tropical storms, snowstorms, tornadoes, and earthquakes. Equipment failure and
human error were responsible for four disruptions.
Figure 2. 2011 Timeline for Major Stories
DOE / OE / ISER 7 2011 YIR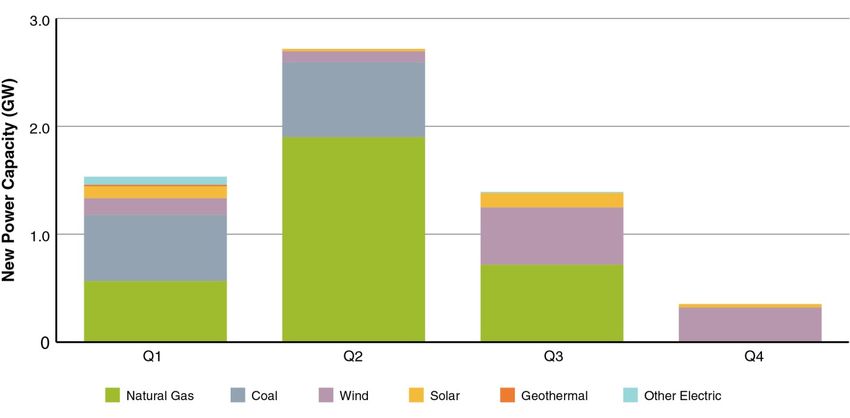
Twenty-seven major disruptions involved domestic electricity assets in 2011. Of these, the most
significant were:
   •    Hurricane Irene, which knocked out power to more than 9.3 million customers along the
        East Coast and Puerto Rico in August;
   •    A severe winter storm, which knocked out power to 4.3 million customers in the
        Northeast in late October;
   •    A severe winter storm system across the Central and Eastern United States and rolling
        blackouts in Texas caused by freezing conditions—together affecting a peak of 2.4
        million customers in early February;
   •    A string of ten powerful spring and summer thunderstorms that knocked out power to
        utility customers across the Central and Eastern United States from March to July,
        including a powerful wave of thunderstorms and a “Super Outbreak” of tornados in April,
        which knocked out power to 2.2 million customers; and
   •    A substation failure in Arizona in September, which tripped a major transmission line and
        knocked out power to 1.6 million customers in Southern California and western Arizona,
        and nearly 1.2 million customers in northwest Mexico.

In addition to these customer outage events, an August earthquake with its epicenter in Mineral,
Virginia forced the shutdown of two nuclear reactors at Dominion Power’s 1,953 megawatt
(MW) North Anna nuclear power plant. Both units at the plant remained shut until the NRC
approved their restart in November.

Five major disruptions involved natural gas in 2011, and three of the most significant were:
    •   The February Texas freeze, which forced the shut-in of 600 million cubic feet per day
        (MMcf/d) of gas production in Texas;
    •   Tropical Storm Don in July, which shut-in an estimated 1.35 billion cubic feet per day
        (Bcf/d) of gas in the Gulf of Mexico; and
    •   Tropical Storm Lee in September, which shut-in a peak of 2.2 Bcf/d of gas production in
        the Gulf of Mexico.

Eight major disruptions involved domestic petroleum assets in 2011. The most significant of
these disruptions were:
   •    A leak on the Trans-Alaska Pipeline System, which curtailed Alaska North Slope crude
        output by up to 600,000 barrels per day (b/d) for 9 days in January;
   •    An April power outage that shut units at three Texas City refineries—some for more than
        a week;
   •    Tropical Storm Lee in early September, which shut-in a peak of 846,670 b/d, or roughly
        60 percent, of the oil production in the Gulf of Mexico, and forced the closure of the
        Louisiana Offshore Oil Port (LOOP); and

   DOE / OE / ISER                                  8                                 2011 YIR
• Two brief shutdowns of TransCanada’s 591,000 b/d Keystone Pipeline in October and
November.
Three international events met the criteria for inclusion as major disruptions in the EAD. In late
February, unrest in Libya led to a Civil War, which continued for much of the year, disrupting as
much as 1.6 million barrels per day of crude output, and eventually prompting the International
Energy Agency (IEA) and DOE to release 60 million barrels of crude oil over 2 months from
emergency stockpiles. In March, an earthquake triggered a tsunami that heavily damaged the
Fukushima-Dai’ichi nuclear power plant in Japan, and shut down eleven other nuclear plants as
well as six refineries. In the wake of the disaster, regulators increased scrutiny at nuclear
facilities around the world, including in the United States. In December, terrorists bombed a
pipeline serving the Rumaila oilfield in Southern Iraq, cutting production by 700,000 b/d.
DOE / OE / ISER 9 2011 YIR2.2 Disruption Analysis
Energy disruptions that occurred in 2011 are grouped into four energy sectors: electricity,
natural gas, petroleum, and biofuels. A fifth cross-cutting category, cyber security, is discussed
following the four energy sectors.
2.3 Electricity Disruptions
Electricity disruptions are discussed from two perspectives: customer outages and power plant
outages.
2.3.1 Customer Outages
Power outages affecting a large number of utility customers occurred more frequently and
affected a larger number of customers in 2011 compared to 2010 (see Figure 3). In 2010, there
were 17 disruptions that affected 250,000 or more customers, with the largest outage affecting
nearly 1.3 million customers. In 2011, there were 30 disruptions that affected 250,000 or more
customers, with five of these outages affecting more than 1.5 million electricity customers.
Twenty-nine of the 30 significant outages in 2011 were caused by weather, and one was man-
made.
Figure 3. Major U.S. Electric Customer Outage Events, 2011
Five events with more than 1.5 million peak customer outages (noted in orange in Figure 3):
1. Hurricane Irene, 9.3 million customers, August 22–September 4: Hurricane Irene
was recognized as a major storm long before making landfall. When it did make landfall,
it resulted in less coastal damage than anticipated, but Upstate New York and Vermont
suffered severe flooding. Power outages occurred along Irene’s entire path, beginning
DOE / OE / ISER 10 2011 YIRin the U.S. Virgin Islands and Puerto Rico and moving up the Eastern Seaboard from the
Carolinas to New England before dissipating. Affected customers peaked at 8.38 million
customers on the East Coast and 0.95 million in Puerto Rico.
2. Northeast Winter Storm, 4.3 million customers, October 29–November 7: An
unusually early snow storm shattered October snowfall records for many areas in the
Mid-Atlantic and New England. The snow was very wet and heavy and occurred early
enough that many trees still had their leaves. This caused many trees to fall, bringing
down power lines.
3. Texas Rolling Blackouts and Central & Eastern U.S. Winter Storms, 2.4 million
customers, January 31–February 2: Sustained low temperatures in Texas caused a
number of problems for the Texas grid, ranging from freezing equipment and controls to
loss of gas pressure and freezing water pipes, causing outages to power plant fuel and
cooling systems. Fifty units totaling 7 gigawatts (GW) were forced out during the freeze,
leading to rolling blackouts across the State, affecting about 1.2 million customers within
Texas. As the storm system proceeded east, another 1.2 million customers were
affected across the Midwest, Mid-Atlantic, and New England.
4. Central & Eastern U.S. Storms and Tornado Super Outbreak, 2.2 million
customers, April 25–28: Tornados and other strong thunderstorms had already led to
two large customer outages in the South and another in the Midwest in April 2011 when
this tornado outbreak occurred.
5. Arizona & California Blackout, 1.6 million customers, September 8: In September,
a worker error at an Arizona substation tripped a 500 kilovolt (kV) transmission line,
cutting power to 1.6 million customers in Arizona and California, with the majority of
customers located in the San Diego Gas & Electric service territory. In addition to the
U.S. customer outages, this event caused nearly 1.2 million customer outages in
Mexico.4 This event was the only non-weather-related outage to affect more than
250,000 customers in 2011.
As shown in Figure 4, the second quarter (2Q) and third quarter (3Q) had the highest number of
outage events, which were driven primarily by weather events. Q2 and Q3 had 102 and 94
outage events, respectively, compared to 70 outage events in Q1 and 27 events in Q4.
Outages caused by human error and accidents (including equipment failure) ranged from five in
Q4 to 22 in Q3.
A breakdown of large, medium, and small disruptions in 2011 is shown in Figure 4. All but one
of the 30 large disruptions were caused by weather. Weather events were also the dominant
cause of medium-sized outages. Weather, however, was responsible for only about half of the
smaller events, with the remainder caused by accidents, human error, other natural events, or
unknown reasons.
4
Outage figures revised from those initially reported in the EAD to represent more accurate information reported
by utilities after publication. “Pacific Southwest Outage.” SDG&E. Presentation at Disaster Assistance and
Recovery Forum. March 6, 2011. http://bclc.uschamber.com/sites/default/files/SD%20Regional%20Forum%20-
%20Earthquake%20Power%20Outage%20Challenges.pdf
DOE / OE / ISER 11 2011 YIRFigure 4. U.S. Electric Customer Outage Events by Cause and Magnitude, 2011
Notes: 1) Small 10,000-50,000
2) Medium 50,000-250,000
3) Large >250,000
2.3.2 Power Plant Outages
With the exception of nuclear plants, data on power plant outages are less comprehensive than
data on customer outages. While significant customer outages are almost always widely
reported by utilities and the media, power plant outages frequently do not receive the same level
of attention. For coal, natural gas, hydroelectric, and other power plant outages, the EAD relies
on publicly available industry newsletters, company announcements, and regulatory entities
(e.g., the California Independent System Operator and the Texas Commission on
Environmental Quality). As a result, the coverage of non-nuclear power plant outages varies
substantially between States and regions, and between companies that own these assets. In
contrast, scheduled and unscheduled outages of nuclear plants are closely tracked and
reported by the U.S. Nuclear Regulatory Commission (NRC), and as a result outage data
reported for nuclear plants is relatively comprehensive compared to information reported for
coal- and natural gas-fired power plants.
Figure 5 shows U.S. power plant unplanned (or forced) outages, and outages where the cause
was unknown or not reported. Based on reports in the Energy Assurance Daily (EAD) in 2011,
outages for coal-fired units were relatively flat across the seasons and outages for natural gas-
fired plants actually peaked during the high-demand summer months. Since natural gas-fired
plants operate more often during the summer, it is not unusual to see more forced outages for
natural gas-fired plants during this season. Because coal-fired plants operate at base load in
most regions, forced outages are likely to occur in all seasons.
DOE / OE / ISER 12 2011 YIRFigure 5. Unplanned Power Plant Outages, 2011
Note: Includes power plant outages where the cause was unknown or not reported.
2.4 Natural Gas Disruptions
Over the course of 2011, the EAD reported numerous disruptions to natural gas assets,
including disruptions at natural gas processing plants, pipelines, platforms, fields, and wells.
Most of these events were caused by equipment failure, power failure, or were weather-related.
The number of significant events impacting natural gas infrastructure was more than twice as
high in 2011 than in 2010. The 2010 Year-in-Review (YIR) highlighted seven significant
disruptions to natural gas infrastructure, including two well explosions, three pipeline explosions,
and an explosion at a liquefied natural gas (LNG) storage facility. In the 2011 YIR, 15
significant disruption events are highlighted, including 3 events impacting natural gas production
and processing assets, and 12 events impacting natural gas pipelines.
2.4.1 Production and Processing Plants
Major disruptions to natural gas production and processing infrastructure were primarily
weather-related. Smaller disruptions were largely caused by equipment failures or the loss of
power. Major disruptions to natural gas production and processing infrastructure are
summarized in the bullets below:
• Tropical Storm Lee: Tropical Storm Lee, which moved through the Gulf of Mexico in
early September, disrupted natural gas output for more than a week. Shut-ins peaked at
2.2 billion cubic feet per day (Bcf/d), or about 42 percent, of total natural gas output from
platforms in the federally administered Gulf of Mexico.
DOE / OE / ISER 13 2011 YIR• Tropical Storm Don: This storm moved through the Gulf in late July and forced the
shut-in of an estimated 1.35 Bcf/d of natural gas production.
• Texas Freeze: In late January and early February extreme freezing conditions forced
the shut-in of more than 600 million cubic feet per day (MMcf/d) of natural gas
production in Texas, including 250 MMcf/d in the East Texas Basin, 220 MMcf/d in the
Fort Worth Basin, and 215 MMcf/d in the Texas Gulf Coast basin.
2.4.2 Pipelines
Several high-pressure transmission pipelines experienced shutdowns in 2011, including several
ruptures and explosions at the Tennessee Gas Pipeline, which experienced three explosions,
and on the Pacific Gas & Electric (PG&E) pipeline system, which experienced two ruptures
during pressure tests in California. The most significant natural gas pipeline events of 2011 are
summarized in the bullets below:
• Tennessee Gas Pipeline Explosions: El Paso’s Tennessee Gas Pipeline experienced
three major explosions in 2011. An explosion in February in Ohio caused El Paso to
declare force majeure on deliveries. An explosion on a 25-inch segment in Ohio in mid-
November destroyed at least two buildings and started a number of fires. Two days
after the blast, the Pipeline Hazardous Materials Safety Administration issued a
corrective order against Tennessee Gas, ordering the company to reduce operating
pressure by 20 percent. Just 3 days after the order, a third explosion ripped through the
line in Mississippi, forcing the evacuation of 20 homes. The Tennessee Gas Pipeline
stretches from the U.S. Gulf Coast to the Northeast and has multiple supply and delivery
points along the way.
• PG&E Pipeline Ruptures: A 34-inch PG&E pipeline supplying the San Francisco Bay
area ruptured in October while the company was conducting a pressure test prior to
boosting gas levels to meet winter demand. The line is one of two major transmission
lines that supply much of the San Francisco Bay Area’s natural gas. The company
planned to replace the line in about a week. A second PG&E pipeline, a 24-inch line
near San Mateo, California, also ruptured during a pressure test in November.
• TransCanada Pipeline Explosion: A February explosion and ensuing fire shut two of
three pipelines making up TransCanada’s Canadian Mainline system in Ontario,
Canada, reducing overall system flows by as much as 1.1 Bcf/d. One of the two lines
sustained major damage and was out for weeks, while a second line was shut as a
precautionary measure.
• Gulf South Pipeline Fire: A mid-February fire in a compressor station led the Gulf
South Pipeline Company to reduce throughput by about 300 MMcf/d along its natural
gas pipeline in Texas. The Gulf South Pipeline system transports natural gas throughout
Texas, Louisiana, Mississippi, Alabama, and Florida.
DOE / OE / ISER 14 2011 YIR• Neptune Gas Plant Upset and Nautilus Pipeline Shutdown: An upset at the Neptune
gas processing plant in Louisiana forced Enbridge to shut its 600 MMcf/d Nautilus gas
pipeline that serves offshore Louisiana gas producers.
• CenterPoint Energy Pipeline Explosion: A 20-inch pipeline in Minnesota operated by
CenterPoint Energy exploded in March near one of the company’s maintenance
facilities. CenterPoint said that the incident did not impact deliveries to its customers.
• ExxonMobil Pipeline Rupture: An ExxonMobil subsea pipeline ruptured in September,
forcing the company to shut-in 280 MMcf/d of natural gas production in the Gulf of
Mexico.
• Ruby Pipeline Fire: In December, El Paso shut its 1.5 Bcf/d Ruby pipeline for several
days and declared force majeure on deliveries after a fire broke out on ancillary
equipment connected to one of the line’s 42 valves in Utah. The line moves natural gas
from western supply basins to markets in the U.S. West Coast.
• Bison Pipeline Rupture: TransCanada’s Bison natural gas pipeline, which runs from
Wyoming to North Dakota, ruptured in Wyoming in July, forcing the company to shut the
line for repairs. The line was carrying 365 MMcf/d at the time of the incident, below its
maximum capacity of 477 MMcf/d.
2.5 Petroleum Disruptions
In 2011, several major incidents in the petroleum sector triggered significant disruption to
infrastructure assets across the petroleum supply chain. This section highlights major domestic
incidents.
2.5.1 Production
Two major oil production disruptions of 2011 were caused by tropical storms impacting offshore
production in the Gulf of Mexico.
Tropical Storm Lee: The Bureau of Ocean Energy Management, Regulation, and Enforcement
(BOEMRE) reported on September 2 the evacuation of 169 platforms and 16 rigs in the U.S.
Gulf of Mexico due to Tropical Storm Lee. At its peak on September 6, 846,670 barrels per day
(b/d) of oil production was shut-in, or about 60.5 percent of total U.S. Gulf of Mexico production.
In addition, the Louisiana Offshore Oil Port (LOOP) was also shut due to poor sea conditions
stemming from the storm. Oil operations in the Gulf were largely restored by September 9.
Tropical Storm Don: Offshore production companies began to evacuate platforms and rigs in
the U.S. Gulf Coast on July 28. At its peak on July 29, 56 platforms and 4 rigs were evacuated,
which shut-in 166,554 b/d of oil production, according to the Bureau of Ocean, Energy
Management, Regulation and Enforcement (BOEMRE). According to news reports, however,
618,000 b/d of oil production was shut-in. Workers returned to the evacuated platforms on July
31 and August 1, after the storm had passed.
DOE / OE / ISER 15 2011 YIR2.5.2 Refineries and Fractionators
Refinery outages triggered by weather impacts on the power grid caused several notable
outages in the Gulf Coast region in 2011, and a major explosion occurred at the Mont Belvieu
natural gas liquids (NGL) hub in Texas. This section gives a summary of those refinery
outages, based on EAD reports.
Texas City, Texas Power Outages: Power outages across southeastern Texas on April 25–26
caused major issues for area refineries. In many cases, drought and wind conditions caused
salt to build up on power line insulators, which led to outages. (Normally, rain washes away
such build-ups.) The outages forced BP to shut all units at its 406,570 b/d Texas City refinery
on April 25. The first of two crude distillation and cracking trains restarted on May 3, and the
second came on-line towards the end of May. The power outages also shut most units at
Valero’s 225,000 b/d Texas City refinery on April 25–26, but operators were able to restore the
facility to its normal processing rates by May 3. Units were also shut at Marathon’s 76,000 b/d
Texas City refinery and resumed normal operations on April 27. The refinery shutdowns forced
Enterprise Product Partners and Genesis Energy to divert flows along their jointly-owned,
400,000 b/d Cameron Highway oil pipeline away from Texas City.
Port Arthur, Texas Lightning Strike: Valero’s 287,000 b/d Port Arthur, Texas refinery was
shut for nearly a month after a lightning strike on June 6. The lightning strike destroyed the
motor on a wet gas compressor, which in turn shut the refinery’s 100,000 b/d coker and its
175,000 b/d crude unit.
Ponca City, Oklahoma Thunderstorms: Thunderstorms caused power outages that affected
ConocoPhillips’ 198,400 b/d Ponca City refinery on August 8. The company began restarting
the refinery on August 9, but restart operations were not complete until August 15.
Mont Belvieu, Texas Fractionator Explosion: On February 8, a pipeline explosion at
Enterprise Products Partners’ 305,000 b/d NGL fractionation facility in Mont Belvieu, Texas
triggered a subsequent fire in the facility’s NGL storage area. The fire was contained and
extinguished, and two of the facility’s four NGL fractionation units resumed operations on
February 9. The event also caused ONEOK Partners to cease operations at its 160,000 b/d
Mont Belvieu-1 fractionator, adjacent to the Enterprise complex, for precautionary reasons. The
ONEOK fractionator reopened on February 9.
Figure 6 shows significant refinery disruption events in 2011 with a breakdown by cause.5 The
most common cause for disruptions, as was the case in 2010, was equipment failure.
Equipment failures include compressor outages, pump failures, equipment leaks, boiler system
failures, and other mechanical failures. Following equipment failures, power failures were the
next largest cause of disruptions. Power outage events highlight a critical interdependency
between the petroleum and electric power industries.
5
The “cause” is determined by the initial action. For instance, if a transfer line leak leads to a fire, this would be
classified as an “equipment failure” due to the initial cause of the line leaking.
DOE / OE / ISER 16 2011 YIRFigure 6. U.S. Refinery Disruption Events by Cause, 2011 2.5.3 Transportation Crude oil is largely transported by marine vessels or pipelines. These assets deliver the vast majority of the world’s crude oil supply, including that of the United States. Pipelines are more susceptible to outage events as they can sprawl for thousands of miles across the country and rely heavily on other assets within the petroleum industry to function properly. The pipeline outages in 2011 stemmed from a variety of problems including weather, equipment malfunctions, and external issues (problems at assets adjacent to pipeline operations). The following pipeline and tanker incidents were some of the most notable and significant of 2011. Alyeska Trans Alaska Pipeline System (TAPS) Leak: The 800-mile TAPS pipeline transports 640,000 b/d of crude oil from Prudhoe Bay, Alaska to the marine port in Valdez, Alaska. On January 8 a pipeline leak was discovered, forcing operators to fully shut the pipeline for 3 days. To prevent the pipeline and associated tanks from freezing, operators restarted the pipeline at a reduced rate on January 11, but shut it down again on January 15 to install a bypass pipe around the leak site. The pipeline shutdown forced oil producers in Prudhoe Bay to decrease their production to 12 percent of normal rates from 640,000 b/d to 75,600 b/d. Full production resumed January 17.6 TransCanada Keystone Pipeline Issues: TransCanada shut down its 591,000 b/d Keystone pipeline on October 13 due to a lack of storage at an Enbridge terminal in Superior, Wisconsin. The pipeline, which spans from Hardisty, Alberta to refineries in the Mid-Continent, was restored to service the next day, on October 14. The pipeline was shut again less than a month later on November 9 due to mechanical issues, but again it restarted the next day, on November 10. Enterprise NGL Pipeline Spill: Flood waters from the Missouri River caused a 33,600 b/d Enterprise NGL pipeline leak in Iowa, spilling 140,000 gallons of natural gasoline into the DOE / OE / ISER 17 2011 YIR
Missouri River on August 13. The 10-mile pipeline segment, which carries NGLs from Decatur,
Nebraska to Onawa, Iowa, was immediately shut down following discovery of the leak. The
pipeline was placed back into service in October following repairs.

Silvertip Pipeline Spill: ExxonMobil’s 12-inch, 40,000 b/d Silvertip Pipeline spilled 42,000
gallons (1,000 barrels) of crude oil into the Yellowstone River in Montana on July 1 after river
flooding exposed the pipeline to debris. The pipeline disruption caused supply outages at
ExxonMobil’s 60,000 b/d Billings, Montana refinery. The pipeline restarted on September 24.
On October 10, ExxonMobil announced it had restored operations at the Billings refinery.

Tanker Hijackings: On February 9, Somali pirates hijacked a very large crude carrier (VLCC)
about 220 miles off the coast of Oman in the Indian Ocean. The tanker was carrying about 2
million barrels of Kuwaiti crude oil destined for refineries on the U.S. Gulf Coast. Pirates held
the VLCC for nearly 2 months until April 8, when the tanker was freed.

2.5.4      Hours-of-Service Exemptions

Hours-of-Service (HOS) regulations (49 CFR Part 395) restrict the amount of time drivers are
allowed to operate commercial vehicles and mandate time-off requirements between shifts to
ensure on-road safety. During emergency situations, State governments will often issue
exemptions to these regulations, to maintain the supply of critical fuels such as heating oil,
propane, gasoline, and diesel fuel. The EAD tracks HOS exemptions to identify events that
have triggered States to enact emergency management measures.7

In 2011, 49 waivers were issued across 23 States, including legacy waivers issued as a result of
winter weather in 2010 that continued into 2011 (see Table 1). The majority of exemptions
were issued in States in the eastern and southern regions of the United States, though some
States in the Mid-Continent and even New Mexico issued waivers. All the waivers in the winter
2010–2011 were issued because of winter storms or abnormally cold temperatures. The driver
waivers issued in the latter half of 2011, however, were due to a variety of causes, including
Hurricane Irene, Enterprise’s pipeline leak, and demand surges in the Dakotas.

7
    http://www.fmcsa.dot.gov/rules-regulations/topics/hos/index.htm

      DOE / OE / ISER                                           18                     2011 YIR
Table 1. Hours-of-Service Waivers Issued, 2011
Winter 2010–2011 Winter 2011–2012 (1)
State
Start Date End Date Days Start Date End Date Days
Connecticut 1/5/2011 2/14/2011 41 10/29/2011 11/26/2011 29
Delaware 1/11/2011 1/14/2011 4
Georgia 12/13/2010 1/20/2011 39
Illinois 12/27/2010 1/30/2011 14 (2)
Iowa 8/27/2011 Uncertain N/A
Kansas 2/1/2011 Uncertain N/A
Maine 1/20/2011 2/16/2011 28
Maryland 12/29/2010 1/30/2011 10 (2) 8/26/2011 9/16/2011 22
Massachusetts 1/28/2011 2/8/2011 12
Missouri 1/31/2011 2/11/2011 12
New Hampshire 1/19/2011 2/12/2011 25
New Jersey 1/3/2011 2/15/2011 44
New Mexico 1/19/2011 1/26/2011 7
New York 12/8/2010 2/19/2011 74
North Carolina 12/17/2010 2/9/2011 55 8/25/2011 12/15/2011 113
North Dakota 10/31/2011 11/15/2011 16
Ohio 2/4/2011 2/11/2011 7
Oklahoma 2/1/2011 3/3/2011 30
Pennsylvania 12/29/2010 2/7/2011 29 (2)
Rhode Island 1/21/2011 2/11/2011 22
South Carolina 12/14/2010 2/13/2011 62
South Dakota 9/26/2011 11/30/2011 66
Virginia 12/16/2010 2/8/2011 55 8/25/2011 9/19/2011 26
Notes: 1) Winter 2011-2012 waivers only include waivers issued prior to December 31, 2011
2) Illinois, Maryland, and Pennsylvania experienced multiple waiver events within the listed time period.
3) Cells in gray indicate that no waiver event was issued during that time period.
Source: Data obtained from the National Propane Gas Association (www.NPGA.org) and State waiver
information. See Appendix C for exemption citations.
2.6 Biofuel Disruptions
There were minimal disruptions at biofuel refineries reported in 2011, with the most significant
being a 2-day outage at the Quad County Corn Processors’ ethanol plant in Iowa due to a
tornado. The EAD reported four rail-related events in 2011. The most serious of these rail
events occurred when half the railcars on a 62-railcar train carrying ethanol derailed in Arcadia,
Ohio in February, and 8 of the derailed cars exploded. A 60-railcar train carrying ethanol
derailed in Illinois in October, which also resulted in several cars exploding. Two railcars
derailed and caught fire in Oregon in May, and two cars derailed in Texas in September,
resulting in ethanol leaks.
DOE / OE / ISER 19 2011 YIR2.7 Cyber Security
While cyber security remains a serious concern, 2011 passed without any major publically
reported attacks on the U.S. energy infrastructure. The topic, however, is frequently discussed
at high levels and several cyber security plans were proposed or announced in 2011, including:
• In January, the U.S. Government Accountability Office released a report describing how
cyber security measures have been incorporated into the nationwide smart grid roll-outs
and outlined key challenges that remain to be addressed.
• The North American Electric Reliability Corporation formed a task force in March to
consider the impacts of a coordinated cyber attack on the reliability of the bulk power
system.
• The NRC approved the cyber security plans of two nuclear plants, Indian Point in New
York and Oyster Creek in New Jersey.
• The California Public Utility Commission proposed new rules to protect the security and
privacy of consumer data collected by smart meters.
• Pike Research reported in August that electricity companies are expected to spend $4.1
billion industry-wide from 2011 to 2018 on cyber security.
• The Massachusetts Institute of Technology released a study in December advocating
the formation of a single Federal agency to address cyber security threats to the U.S.
power grid, rather than the numerous groups currently overseeing the system’s security.
In November, hackers were believed to have taken over the controls of a water plant in
Springfield, Illinois and caused a water pump motor to burn out. However, it was later
discovered that the pump had simply failed, and a contractor traveling in Russia had remotely
logged into the plant’s computer system, falsely suggesting a foreign intrusion. While the Illinois
incident was a false alarm, oil company executives at the World Petroleum Congress in Doha in
December reported that cyber attacks on their systems are becoming more frequent and more
sophisticated.
DOE / OE / ISER 20 2011 YIR3. Infrastructure Changes
The previous section provided a summary of significant disruptions in the energy sector during
2011. In this section, the focus is on changes to the energy infrastructure.
Disruptions and infrastructure changes can be viewed differently. With disruptions, the cause is
frequently severe weather or equipment failure, leading to energy problems measured in hours
or days. Following a disruption, the goal is to repair damaged assets as quickly as possible and
return the infrastructure to the condition preceding the event.
Infrastructure changes are typically driven by underlying economic conditions or regulatory
requirements. When business conditions driven by economic or regulatory factors lead to an
infrastructure change—such as shutting down a refinery or installing a wind farm—the change is
long-lasting, often times signaling a fundamental shift in the energy infrastructure.
3.1 Electricity
Changes in the electricity infrastructure are discussed under the following headings:
• Coal-fired Plant Retirements
• Coal- and Natural Gas-fired Plants – New Capacity
• Solar and Wind Plants – New Capacity
• Nuclear Power Plants
• Transmission Expansion and Smart Grid Implementation
3.1.1 Coal-fired Plant Retirements
Two significant air pollution rules released by the U.S. Environmental Protection Agency (EPA)
in 2011 may impact coal-fired plants, potentially leading to early retirement for some coal-fired
plants.
• The Mercury and Air Toxics Standards (MATS) rule seeks to regulate mercury and
particulate matter emissions across the country. Until this rule was passed, there were
no Federal standards to limit power plant emissions of mercury and other toxic metals.
Plants will have 4 years from the start of the program to either install the necessary
control technologies or retire.
• The Cross-State Air Pollution Rule (CSAPR) regulates regional sulfur dioxide and oxides
of nitrogen emissions in eastern States and was finalized in July 2011. This rule is
intended to replace the 2005 Clean Air Interstate Rule. While this rule was initially
expected to take effect in January 2012, in December 2011 a Federal judge issued a
stay of the 2012 implementation. Nonetheless, it is expected that some form of the rule
will take effect in the near future.
DOE / OE / ISER 21 2011 YIRIt is important to note that the U.S. coal fleet is aging and that natural gas prices are at relatively
low levels. These economic factors, in addition to regulatory factors such as MATS and
CSAPR, are also expected to drive coal-fired plant retirements.
During 2011, the Energy Assurance Daily (EAD) contained reports for 22 coal-fired plant
retirements, totaling 11 gigawatts (GW) (compilation of announced, planned, and firm reports8).
Most of the 22 coal-fired plant retirements were planned to take place by 2015, with some as
late as 2025. The primary reason cited for these retirements was changes in EPA regulations.
EPA regulations were mentioned as a reason for closure of 13 of the 22 retiring coal-fired
plants. The announced retirements were concentrated in regions that currently have the most
coal-fired capacity, like the Midwest and Southeast, but some announcements were for plants in
Texas, Massachusetts, and Washington State. For perspective, there is about 310 GW of coal-
fired capacity in the United States.
3.1.2 Coal- and Natural Gas-fired Plants – New Capacity
Figure 7 illustrates new power plant capacity that came on-line during 2011. Of the
approximately 6 GW of capacity reported to have come on-line, just over half (3.2 GW) was
natural gas-fired. The second quarter (Q2) showed the highest level of new natural gas
capacity with 1.9 GW coming on-line.
Figure 7. New Power Plant Capacity in the United States, 2011
Two large coal-fired units came on-line in 2011, totaling 1.3 GW. In January, Wisconsin Energy
began operating a 615 (megawatt) MW unit at its Oak Creek plant. In June, Longview Power
began operating its new 695 MW plant in West Virginia.
8
“Announced” plants reflect plans to build at some point in the future. “Planned” plants are those where permitting or
other approval processes have begun. “Firm” plants are those where site preparation or other construction activities
have been initiated.
DOE / OE / ISER 22 2011 YIRThere were about 40 announcements of natural gas-fired plant builds reported in 2011, totaling
nearly 20 GW. Many of these natural gas announcements are proposed plans to co-fire or
convert existing coal-fired plants.
3.1.3 Renewable Plants – New Capacity
In 2011, many renewable projects, especially small solar generation, were driven by the
expiration of the 1603 Federal Cash Grant Program (expired on December 31, 2011). The cash
grant reimbursed 30 percent of the capital costs for eligible renewable projects and was easier
for small developers to obtain than the investment tax credit, which isn’t due to expire until the
end of 2016. As shown in Figure 7, there were about 300 MW of new solar builds in 2011.
As with solar, many wind developers took advantage of the Federal Production Tax Credit,
which is set to expire at the end of 2012. The EAD reported about 1.1 GW of new wind capacity
in 2011, which is about 20 percent of the total new U.S. generating capacity reported in the EAD
in 2011.9
In 2011, there were numerous announcements or proposals for renewable power generation
plants. Figure 8 illustrates the geographic distribution of proposed and new renewable projects
by type. Most proposed projects were either wind or solar, but some biomass and geothermal
projects were also announced or brought on-line in 2011.
9
The value of 1.1 GW is based on stories picked up by the EAD. For comparison, the American Wind Energy
Association reported 6.8 GW of installed wind in 2011 (http://www.awea.org/learnabout/industry_stats/index.cfm).
While wind capacity numbers are relatively large compared to total capacity additions, the amount of electricity
generated with wind is significantly smaller. For example, in 2011 2.9 percent of the electricity generated in the
United States was produced from wind (http://205.254.135.24/electricity/monthly/pdf/epm.pdf).
DOE / OE / ISER 23 2011 YIRFigure 8. Number of New and Proposed Renewable Energy Projects, 2011 Predictably, renewable energy projects are closely linked to the energy resource quality. Solar projects are more common in geographic locations with a high solar incidence, such as the Western United States; wind projects are most prevalent in the Midwest; and hydrokinetic projects are concentrated along the Mississippi River. State-level policies are also an important driver in renewable development. For example, California and New Jersey have renewable portfolio standards with strong solar incentives, and as a result, these two States accounted for the bulk of announced solar projects in 2011. 3.1.4 Nuclear Power Plants The nuclear meltdown at the Fukushima Dai’ichi plant in March 2011 brought renewed attention to the nuclear sector in the United States. While there were no major physical changes to the U.S. nuclear infrastructure in 2011, there has been increased scrutiny on nuclear power plants in the last year, with some States calling for closures. Highlighted below are a few recent developments that stemmed from both the Japanese disaster and other opposition to nuclear power: DOE / OE / ISER 24 2011 YIR
•   Within days of the earthquake, New York Governor Andrew Cuomo renewed his
       opposition to the Indian Point nuclear facility in Westchester County, recommending the
       shutdown of the plant when the operating licenses for the plant’s two reactors expire in
       2013 and 2015. Owner and operator Entergy expressed interest in new Federal
       licenses to keep the plant running another 20 years. New York’s power grid operator
       has said that the shutdown of Indian Point, which provides about 25 percent of the
       power in New York City and Westchester, could lead to electric reliability problems.
   •   NRG Energy canceled the development of a new unit at its South Texas nuclear site
       following the Fukushima disaster. Tokyo Electric Power Company, which had about a
       20 percent ownership stake in the South Texas project, withdrew financing to cope with
       problems related to the Fukushima disaster.
   •   A dispute regarding the relicensing of the Vermont Yankee plant began in 2010 when
       the State of Vermont denied its relicensing. (The plant’s operating license was set to
       expire in March 2012.) The State is being challenged by the plant’s owner, Entergy.
       Despite the controversy and reported leaks, in March 2011 the U.S. Nuclear Regulatory
       Commission (NRC) issued the plant a 20-year license extension. The case is ongoing in
       Federal courts.

Despite these setbacks, several companies proceeded with planned or proposed nuclear units
at new and existing sites. The majority of these developments are occurring in the South and
Gulf Coast regions, including Georgia, Alabama, Tennessee, Florida, and Texas. Elsewhere,
utilities in Utah and Idaho are seeking nuclear permits. Newsworthy events from 2011 include:
   •   Southern Company’s continued construction preparation at the site of two new Vogtle
       units near Augusta, Georgia. In February 2012, the NRC approved the construction
       license for Vogtle, the first granted in the United States since the Three Mile Island
       incident in 1979.
   •   In April, the NRC issued its final environmental impact statement in support of South
       Carolina Electric and Gas’ plans to construct two new nuclear reactors at the existing
       Summer nuclear power plant in South Carolina.
   •   The NRC and U.S. Army Corps of Engineers (USACE) completed the final
       environmental impact statement for the proposed Comanche Peak units 3 and 4. The
       two new units would add 3.4 GW of capacity to the 2.3 GW already generated at the
       site. According to the NRC and USACE, no environmental concerns preclude granting a
       license to Luminant for the two units. Luminant plans to bring the units on-line in 2022 if
       funding can be secured.
   •   The Tennessee Valley Authority (TVA) aims to finish building the second 1,150 MW
       nuclear power reactor at its Watts Bar facility in Tennessee by 2013. The construction
       permit for units 1 and 2 was granted in 1973, but after the completion of unit 1, unit 2
       was delayed until recently.
   •   TVA resurrected plans in June to complete the 1,260 MW Bellefonte Nuclear unit 1 in
       Hollywood, Alabama by 2018–2020. Previous work on the reactor stopped in the 1980s.

   DOE / OE / ISER                                  25                                2011 YIR
• TVA plans to submit an application to the NRC to install one or more small modular
reactors at the Clinch River Site in Roane, Tennessee. These small modular reactors
are a new innovative design that could reduce installation barriers and costs.
• Alternate Energy Holdings received rezoning approval to build the 2,800 MW Idaho
Energy Complex nuclear plant in Payette County, Idaho. The company hopes to begin
commercial operations at the plant in 2018.
• In October, Progress Energy’s Florida utility received approval from the Florida Public
Service Commission (FPSC) to recover the costs for building two new 2,200 MW
reactors in Levy County, Florida. The utility initially planned to operate the reactors by
2016–17, but it has delayed that timeline until 2020.
• Florida Power & Light received approval in October from the FPSC to recover the costs
needed to build two new 2,200 MW reactors, which will be units 6 and 7, at its Turkey
Point plant, with commercial operation planned for 2022–2023.
• Blue Castle Holdings discussed a proposed 3,000 MW nuclear power plant near Green
River, Utah with the NRC as part of the early site permitting process in October.
3.1.5 Transmission Expansion and Smart Grid Implementation
The EAD reported 65 proposed new transmission project announcements in 2011. These
announcements covered many project types, including low voltage substation connections, local
transmission upgrades for larger power plants at existing sites, and high voltage direct current
lines traversing large distances. A large number of announced projects were designed to bring
renewable energy sources from remote regions to load centers. Of the 65 announced projects,
28 named connecting renewable power sources to the grid as their primary objective. Many
more did not cite renewable power specifically, but did connect areas with high wind or solar
potential to areas with high demand.
The move to adopt smart grid technologies accelerated in 2011 on the heels of American
Recovery and Reinvestment Act funding. A few noteworthy smart grid investments by utilities
and market operators include:
• PEPCO: $500 million
• Midwest Independent System Operator (ISO): $17.3 million
• San Diego Gas & Electric: $3.5–3.6 billion by 2020
• New York ISO: $74 million
Several other organizations announced smart grid integration plans, including Pacific Gas &
Electric (PG&E), Bonneville Power Administration, and Duke Energy. A report by Pike
Research estimates that annual revenue in the smart grid managed services market will
increase from $470 million in 2010 to $4.3 billion by 2015.10
10
http://www.telecompetitor.com/report-smart-grid-managed-services-worth-a-look-by-telecom/
DOE / OE / ISER 26 2011 YIRYou can also read


