Techno-Economic Assessment Guidelines for CO2 Utilization
←
→
Page content transcription
If your browser does not render page correctly, please read the page content below
POLICY AND PRACTICE REVIEWS
                                                                                                                                             published: 31 January 2020
                                                                                                                                         doi: 10.3389/fenrg.2020.00005

                                            Techno-Economic Assessment
                                            Guidelines for CO2 Utilization
                                            Arno W. Zimmermann 1 , Johannes Wunderlich 1 , Leonard Müller 2 , Georg A. Buchner 1 ,
                                            Annika Marxen 1 , Stavros Michailos 3 , Katy Armstrong 4 , Henriette Naims 5 ,
                                            Stephen McCord 4 , Peter Styring 4 , Volker Sick 6 and Reinhard Schomäcker 1*
                                            1
                                             Institute of Chemistry, Technische Universität Berlin, Berlin, Germany, 2 Institute of Technical Thermodynamics, RWTH
                                            Aachen University, Aachen, Germany, 3 Energy 2050, The University of Sheffield, Sheffield, United Kingdom, 4 UK Centre for
                                            Carbon Dioxide Utilization (CDUUK), The University of Sheffield, Sheffield, United Kingdom, 5 CO2 Utilisation Strategies and
                                            Society, Institute for Advanced Sustainability Studies (IASS), Potsdam, Germany, 6 The Global CO2 Initiative, The University of
                                            Michigan, Ann Arbor, MI, United States

                                            Carbon Capture and Utilization (CCU) is an emerging technology field that can replace
                                            fossil carbon value chains, and that has a significant potential to achieve emissions
                                            mitigation or even “negative emissions”—however in many cases with challenging
                                            technology feasibility and economic viability. Further challenges arise in the decision
                                            making for CCU technology research, development, and deployment, in particular
                                            when allocating funding or time resources. No generally accepted techno-economic
                                            assessment (TEA) standard has evolved, and assessment studies often result in “apples
                           Edited by:
                                            vs. oranges” comparisons, a lack of transparency and a lack of comparability to
                           Tao Wang,
             Zhejiang University, China     other studies. A detailed guideline for systematic techno-economic (TEA) and life cycle
                         Reviewed by:       assessment (LCA) for CCU technologies was developed; this paper shows a summarized
                              Ning Wei,     version of the TEA guideline, which includes distinct and prioritized (shall and should) rules
  Institute of Rock and Soil Mechanics
                           (CAS), China
                                            and which allows conducting TEA in parallel to LCA. The TEA guideline was developed in
                     Atsushi Kurosawa,      a co-operative and creative approach with roughly 50 international experts and is based
     Institute of Applied Energy, Japan
                                            on a systematic literature review as well as on existing best practices from TEA and
                *Correspondence:
                                            LCA from the areas of industry, academia, and policy. To the best of our knowledge,
               Reinhard Schomäcker
           schomaecker@tu-berlin.de         this guideline is the first TEA framework with a focus on CCU technologies and the
                                            first that is designed to be conducted in parallel to LCA due to aligned vocabulary
                   Specialty section:
                                            and assessment steps, systematically including technology maturity. Therefore, this
         This article was submitted to
        Carbon Capture, Storage, and        work extends current literature, improving the design, implementation, and reporting
                            Utilization,    approaches of TEA studies for CCU technologies. Overall, the application of this TEA
               a section of the journal
         Frontiers in Energy Research
                                            guideline aims at improved comparability of TEA studies, leading to improved decision
          Received: 06 August 2019
                                            making and more efficient allocation of funds and time resources for the research,
         Accepted: 09 January 2020          development, and deployment of CCU technologies.
         Published: 31 January 2020
                                            Keywords: CO2 utilization, CCU, carbon capture and utilization, techno-economic assessment, TEA,
                            Citation:
                                            standardization, harmonization, life cycle assessment
     Zimmermann AW, Wunderlich J,
    Müller L, Buchner GA, Marxen A,
  Michailos S, Armstrong K, Naims H,
     McCord S, Styring P, Sick V and
                                            INTRODUCTION
                Schomäcker R (2020)
      Techno-Economic Assessment            Reports by the Intergovernmental Panel on Climate Change (IPCC) and the US National
        Guidelines for CO2 Utilization.     Academies emphasize that meeting the global temperature goals of 1.5◦ C or even 2◦ C above pre-
               Front. Energy Res. 8:5.      industrial levels will require the removal of carbon dioxide (CO2 ) from the atmosphere (IPCC,
      doi: 10.3389/fenrg.2020.00005         2018; National Academies of Sciences Engineering and Medicine, 2019). Carbon Capture and

Frontiers in Energy Research | www.frontiersin.org                                  1                                                  January 2020 | Volume 8 | Article 5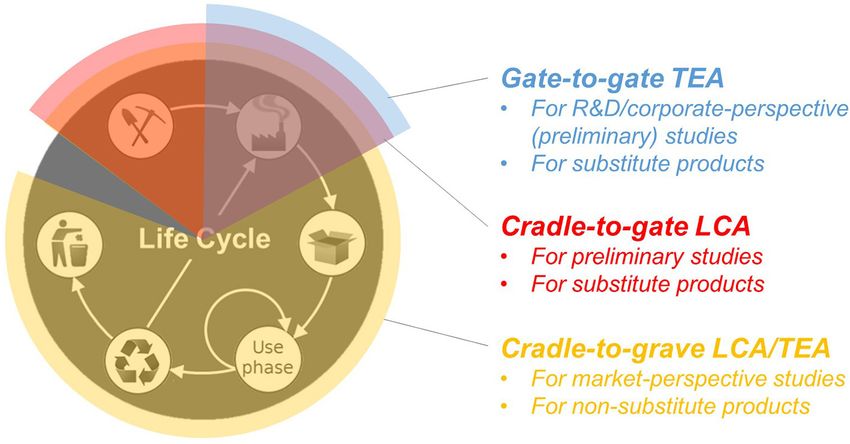
Zimmermann et al.                                                                                               TEA Guidelines for CO2 Utilization

Utilization (CCU) is an emerging technology field that can               lack of transparency in assumptions and intermediate results
replace fossil carbon value chains with significant potential in         as well as the lack of a generally accepted TEA standard;
emissions mitigation or even negative emissions (Mikkelsen               all of which make assessments and comparisons of CCU
et al., 2010; Artz et al., 2018; Kätelhön et al., 2019; Tanzer           technologies difficult.
and Ramírez, 2019). CCU includes a variety of technologies                  To address these challenges, thereby increase comparability
that separate the greenhouse gas CO2 from point sources or               and put decision making to advance CCU technologies on a
ambient air and consume CO2 to make products or services,                rigorous and transparent basis, the first of a kind guideline for
aiming to provide economic, environmental, and social benefits.          standardized TEA for CCU technologies was developed; the
CCU products include concrete (e.g., Lafarge, Carboncure),               work presented here is a summary of this detailed guideline
carbonate aggregates (e.g., Carbon8, MCI), fuels (e.g., Sunfire,         document (Zimmermann et al., 2018). The TEA guideline was
SkyNRG), polymers (e.g., Covestro, Novomer, Econic), methanol            developed based on an extensive literature analysis and in a co-
(e.g., CRI) or carbon monoxide (e.g., Opus12) (CO2 Sciences              operative and creative approach, weighing the various opinions
and The Global CO2 Initiative, 2016; Zimmermann et al.,                  and perspectives present in the field and striving for a consensus.
2017; Bushuyev et al., 2018). Even though CO2 is an abundant             The guideline further provides systematic, step by step guidance
resource in the atmosphere, its economic capture and cost-               on how to produce sound comparisons and how to create
effective use still require substantial research and development         and provide transparency, comparability, and reliability of TEA
efforts. To advance further development of CCU requires                  studies for CCU technologies. The TEA guideline was developed
allocation of funds and time resources primarily to economically         in parallel with a guideline for Life Cycle Assessment (LCA) in a
promising technologies. It is therefore paramount to assess the          one-year project by the partners RWTH Aachen, The University
economic viability of a process upfront using a detailed techno-         of Sheffield, IASS Potsdam and TU Berlin. Besides the detailed
economic assessment (TEA) in addition to an environmental                guidelines and this work, several additional publications are
assessment that is based on life cycle assessment (LCA).                 available: An overview of both guidelines (Armstrong et al.,
TEA is a methodology framework to analyze the technical                  2019), a summary LCA guideline (Müller et al., submitted),
and economic performance of a process, product or service                three worked examples for methanol, e-fuels and mineral
and “includes studies on the economic impact of research,                aggregates (Michailos et al., 2018; McCord et al., 2019;
development, demonstration, and deployment of technologies”              Zimmermann et al., 2019).
(SETIS ERKC, 2016), quantifying the cost of manufacturing and
market opportunities.
    For the related field carbon capture and storage, a set              APPROACH
of international standards (ISO 27912–ISO 27919) has been
developed that clarify the scoping and evaluation of CO2                 The TEA Guidelines were developed in seven phases, literature
capture systems (see ISO, 2016a). For CCU, TEA is reported to            analysis, workshop 1, creation of draft, workshop 2, revision of
be commonly used in industrial companies following internal              draft and expert review before they were published in an extended
standards—however usually remains unpublished. Published                 report, see Figure 1.
CCU-related TEAs, such as government reports or academic                     For the first phase of the TEA guideline development,
papers, do not yet follow consistent approaches (Zimmermann              literature analysis, a prior study that analyzed 29 papers
and Schomäcker, 2017). In contrast to LCA, the number                    (Zimmermann and Schomäcker, 2017) was extended following
of publications is by orders of magnitude smaller for TEA,               a similar approach; Literature was identified systematically
and overarching methodological standards are lacking. Most               through keyword search covering CO2 utilization and techno-
academic TEAs in CCU follow chemical engineering text books              economic assessment in the Web of Knowledge search engine.
such as Peters et al. (2003), Sinnott and Towler (2009), and             As in the prior study, a narrow and a broad search were
Turton et al. (2012). In recent years, CCU-relevant TEA-                 carried out on September 6th, 2017 and resulted in a list of
only approaches for example by Sugiyama (2007), Otto et al.              219 peer-reviewed journal articles (“papers”) [for search terms
(2015), and TEA-LCA-integrated approaches for example by                 see Appendix, for further description of literature selection
Azapagic et al. (2016) and Thomassen et al. (2019) have                  (see Zimmermann and Schomäcker, 2017)]. Besides the 29
been suggested. While providing great practices, the available           papers from the prior study, further 34 new papers, which
approaches remain currently too generic, leaving a significant           focused on both CCU technologies and applied techno-economic
number of methodological choices open, or lack sector-                   assessment, were identified. Additional six relevant papers and
specific guidance for CCU. The current discussion in scientific          11 non-peer-reviewed publications (“reports”) that fulfilled the
conferences, industry reports, and academic literature points            criteria but did not show up in the search results were added.
out that comparing the economic viability or technological               Overall, 69 papers and 11 reports (see Table A1) formed the
feasibility of the various CCU approaches, either of individual          basis for analysis. Furthermore, relevant procedures and rules
technologies or a system of technologies, is challenging and             of standard literature were included (Peters et al., 2003; ISO
that the number of apples vs. oranges comparisons is high                14044, 2006; Sinnott and Towler, 2009; EC-JRC, 2010; Turton
(Pérez-Fortes et al., 2014a; Naims et al., 2015; Roh et al., 2016;       et al., 2012). The literature analysis resulted in a systematic
Yuan et al., 2016; Zimmermann and Schomäcker, 2017). The                 overview of assessment approaches, economic, technical and
significant challenges in TEA for CCU development are the                environmental assumptions, methods, and indicators applied.

Frontiers in Energy Research | www.frontiersin.org                   2                                         January 2020 | Volume 8 | Article 5
Zimmermann et al.                                                                                                  TEA Guidelines for CO2 Utilization

                                                                          FIGURE 2 | Phases of techno-economic assessment.

                                                                         were invited as in workshop 1 based on prior work, representing
                                                                         a diverse set of backgrounds (26% industry, 38% academia,
                                                                         35% policy).
                                                                             The fifth phase was the revision of the detailed guideline
 FIGURE 1 | Development approach.
                                                                         draft, during which the 187 most urgent change requests
                                                                         were implemented. The remaining requests were left for the
                                                                         following version due to time constraints, but are currently under
A list of 30 key issues for further discussion in co-creation            consideration in a follow-on project.
workshop 1 was derived (see Figure A1). The relevant LCA                     The sixth phase comprised of a written review from
phases and procedures of ISO 14044 and the ILCD handbook                 four leading academic researchers (“peer-review”), which was
were adapted to TEA.                                                     implemented in the revision of the draft. Finally, the detailed
   The second phase of the TEA Guidelines development was                guideline document was published in the depository of the
preparing, conducting, and evaluating workshop 1, a two half-            University of Michigan (Zimmermann et al., 2018) and launched
day, in-person discussion meeting, hosted in November 2017 at            at the ICCDU 2018 conference in August for a scientific audience
IASS Potsdam. Four semi-structured discussion sessions were              as well as at the EIT house in Brussels in October 2018 for a
held on 30 key issues, one for each assessment phase, resulting in       policymaker and industry audience (IASS, 2018).
specific guidance for each of the key issues. The discussion group
consisted of 5 project members and 10 external participants,             TEA GUIDELINES
which were invited based on their publications and presentations
on techno-economic assessment in CO2 utilization. The group of           Overview
10 external participants represented a diverse set of backgrounds        This article presents the summary of the TEA Guidelines,
(40% industry, 40% academia, 20% policy).                                including all required and recommended guideline rules, which
   The third phase was the drafting of the detailed guidelines,          are printed in bold:
an iterative and interactive process, including all co-authors
                                                                         • Shall rules, the minimum requirements to achieve a
of this publication. The first draft was based on the literature
                                                                           standardized assessment, and
overview, literature best practices, and guidance of workshop 1
                                                                         • Should rules, the recommended requirements to produce an
and follow-up discussions on the 30 key issues.
                                                                           assessment of greater depth;
   The fourth phase was preparing, conducting, and evaluating
                                                                         • Please note that the “may” rules are not covered in this article,
workshop 2, a full day in-person discussion meeting hosted on
                                                                           but only in the detailed guideline document.
April 10th, 2018, at TU Berlin. The session design used three
groups, rotating through topical sessions on goal and scope,             This work transfers and applies many concepts from ISO 14044
inventory, interpretation and reporting, presenting feedback, and        (ISO 14044, 2006) and the ILCD handbook (EC-JRC, 2010) to
discussing change requests independent of each other. Based              TEA. Following LCA, TEA is subdivided into the phases: goal
on the documentation and recordings, 266 individual change               and scope, inventory, calculation of indicators, interpretation,
requests were identified. Besides the 15 members of the project          and reporting (see Figure 2); due to its importance reporting
team, 34 external participants attended. External participants           is counted as an own phase of the assessment. In the goal

Frontiers in Energy Research | www.frontiersin.org                   3                                            January 2020 | Volume 8 | Article 5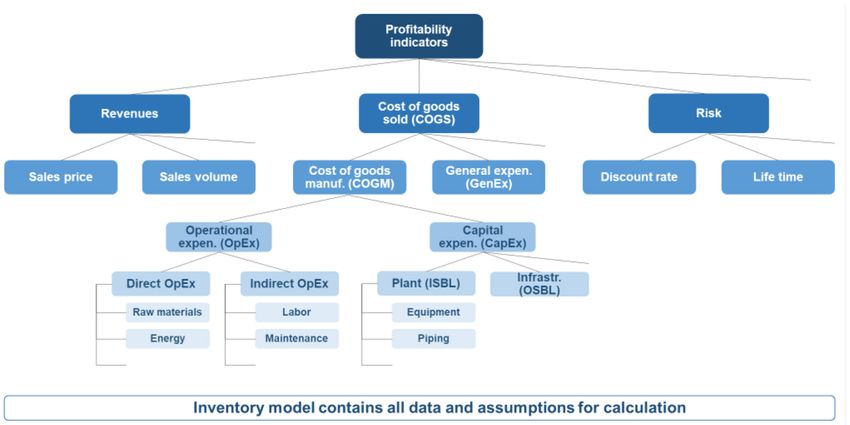
Zimmermann et al.                                                                                                      TEA Guidelines for CO2 Utilization

phase, practitioners define the goal for the overall study. In             TABLE 1 | Common TEA perspectives.
the scope phase, experts define what aspects to include and
                                                                           Common perspectives      Description
how to conduct the comparison. In the inventory phase, they
collect all relevant data. In the calculation phase, experts               R&D perspective          Assessment of specific project(s) in research or
specify the calculation procedure and produce the results.                                          development; either identification of significant
In the interpretation phase, practitioners evaluate the quality,                                    barriers and drivers (hot-spots) for a single project
consistency, and robustness of outcomes; while they carry                                           or comparison of various projects

out some aspects of interpretation throughout the study, they              Corporate perspective    Analysis of projects in development and
                                                                                                    deployment; assessment of investment alternatives
produce conclusions and recommendations only at the end. As                                         and comparison to existing processes; use of
TEA is an iterative process, practitioners will likely go back in                                   detailed process data is common
loops, specifying and improving the assessment in each round.              Market perspective       Analysis of new concepts and their transformation
Finally, all phases and their outcomes are summarized in a TEA                                      of value chains; focus on the effects of new policies,
report (see Figure 2).                                                                              the best use of resources or the best way of
                                                                                                    obtaining a specific utility

Goal
In the first phase, the goal of the study is defined, including the
main questions, the context, the intended use, the limitations,            • Commissioners and authors of the study (e.g., funding
and the audience of the analysis. The goal determines all other              organization, university, company, individual)
parts of the TEA study. While practitioners define an initial goal         • Limitations in the usability from assumptions or methods (e.g.,
at the beginning of the work, they can refine or adapt it during             time, location or specific use cases of the products).
the study—but with caution.
                                                                           Assessment Scenarios
Perspectives and Principles of Assessment Goals                            As TEA studies are supporting decision making with long-
Prior studies and the here conducted analysis of CCU                       term implications, especially for CCU products that often
literature show that comparisons between TEA studies are often             require substantial investments, scenario analysis can be a useful
challenging (Zimmermann and Schomäcker, 2017), especially                  approach to investigate the impact of different core assumptions.
when comparing technologies of varying disciplines, markets,               Practitioners can define TEA scenarios either in the initial
and technology maturities. First and foremost, all assessments             goal phase or when having reached the interpretation phase
need to be based on process concepts that are technologically              where experts identify key data for improvement and refine
plausible; for example, proposed concepts do not violate the               the study goal in another iteration (also see iterative approach
laws of thermodynamics. Before the assessment, a “sanity                   in sections Data Quality and Uncertainty and Sensitivity
check,” for example, checking kinetics as well as mass and                 Analysis). If scenario analysis is applied, all scenarios used for
energy balances, needs to be conducted by practitioners                    analysis shall be distinct and physically as well as economically
also synonymously described here as “experts.” As research,                plausible. Scenarios used should alter factors accounting for
development, and deployment of CCU products involve a range                dynamic changes (e.g., analysis of various competing technology
of stakeholders, TEAs for CCU are typically conducted from                 developments or consequences of large-scale technology adoptions,
different perspectives—in this report three different perspectives         analysis of different potential states in future markets and
as specified: R&D, corporate and market (see Table 1). Each                regulation or societal acceptance). The base case scenario shall
perspective targets a different audience and poses its specific            serve as a baseline for analysis extending current trends in
questions, relevant for defining the assessment goal. When                 terms of technology performance, sales prices, and volumes as
comparing product applications (e.g., is it more profitable to use         well as policies and acceptance. Scenarios shall be developed
methanol as a chemical or as a fuel? Is it more land-efficient to          in interaction with the stakeholders of the study to ensure they
use algae for food or fuel?), the assessment needs to be carried out       remain relevant to the audience. Scenario assumptions and data
first by each application individually before a comparison can be          should be provided at open access to facilitate future work.
carried out.                                                               The analysis and reporting of uncertainty for each scenario are
    In summary and following the principles of LCA, goals of               essential and are further described in interpretation (see section
TEAs shall state clearly and unambiguously:                                Interpretation). If practitioners integrate TEA and LCA, they
                                                                           shall use the same set of scenarios. The LCA guidelines offer
• The study context, especially comparison to what, location,              four scenarios (status quo, low decarbonized, high decarbonized,
  time horizon, scale and partners                                         full decarbonized), which can serve as a helpful starting point for
• The intended application and reasons for carrying                        scenario definition (see LCA guidelines, Annex 10.1). For further
  out the study (e.g., decision support for R&D funding                    reading on scenario analysis see Liu et al. (2008), Mahmoud et al.
  allocation, investment decisions or policy, and regulation;              (2009), Amer et al. (2013).
  methodological studies)
• Target audience (e.g., R&D experts, funding agencies, investors,         Scope
  corporate management, policy makers, NGOs, journalists,                  Building on the goal, practitioners describe in the assessment
  the public)                                                              scope what aspects of a product they will assess and how they

Frontiers in Energy Research | www.frontiersin.org                     4                                              January 2020 | Volume 8 | Article 5
Zimmermann et al.                                                                                                           TEA Guidelines for CO2 Utilization

TABLE 2 | Examples of CCU product applications and market segments (not exhaustive).

CCU class                    CO2 -based fuels                  CO2 -based chemical                CO2 -based material                 CO2 -avoidance
                                                               products                           products

Product                      Fuels for efficient and           Methanol for chemical              Polyols for flexible                Lowering CO2
application                  clean transportation              production                         foams                               emissions of another
                                                                                                  Waste treatment for                 process (e.g., cement
                                                                                                  industrial ashes                    or steel)
Market                       Fuels with low                    Chemicals with a low               High-quality flexible               Large-scale CO2
segment                      NOx /soot emissions or            carbon footprint                   foams for mattresses                avoidance for steel
                             heavy-duty vehicles                                                  Low-quality aggregates              plants
                                                                                                  for low-cost concrete               Small-scale CO2
                                                                                                                                      avoidance for
                                                                                                                                      biogas plants

will compare it to competing solutions. Significant activities in                 carbon footprint, commodities, and specialties). In corporate-
the scope phase are identifying the intended product application,                 perspective TEAs, practitioners should include a description of
the subject of analysis (product system) and in what dimension it                 at least one customer group and their needs. They can classify
is compared to other systems (functional unit), in what quantity it               customer needs as essential, desirable, and useful (Cussler and
is compared to other systems (reference flow), further specifying                 Moggridge, 2011). Fulfilling all essential user needs is obligatory
the system (system elements), defining what is included and                       for customer acceptance. Fulfilling a desirable user needs can
excluded from the assessment (system boundaries), selecting                       provide a competitive advantage. Table 2 lists examples of CCU
systems for comparison (benchmark systems), understanding                         product applications and market segments.
how far the technologies are from market-entry (technology
maturity) and what parameters and measures are used (criteria                     Functional units and reference flows
and indicators). From the scope, practitioners can derive the                     The functional unit is the dimension of how practitioners
requirements for the following phases inventory, calculation, and                 compare the reference system to a benchmark (e.g., mass or
reporting (ISO 14044, 2006; EC-JRC, 2010).                                        distance). The functional unit shall be defined according to
                                                                                  the study goal and documented clearly in the report. The
Product Applications and Functional Units                                         functional unit definition depends on product properties and
CCU product applications                                                          the number of applications. For products with the same
In general, the product application shall be defined according to                 chemical structure, composition, or characteristics as benchmark
the study goal and documented clearly in the report. Potentially,                 products (“substitutes”), experts shall define the functional unit
CCU products can provide applications other than similar,                         on a mass or energy basis. For products with a structure
conventional products (e.g., carbonation of mineral slags is waste                or characteristics different to benchmark products (“non-
treatment but also creates aggregates for cement). The definition                 substitutes”), practitioners shall derive the functional unit from
of product applications depends on how many applications                          the product performance (e.g., performance of new power storage
exist. For products with a small number of applications,                          vs. existing solutions). The reference flow is the quantity of
practitioners should define one relevant application (e.g., fuels                 comparison (e.g., 1 kg, 1 MJ, 100 km), typically over a period
for transportation, polyols for foams). For products with a large                 (e.g., 20 years). The reference flow can be expressed either in
number of applications or where the application cannot be                         a functional unit oriented way (e.g., 1 kg of polyol) or in a
specified, the product itself should serve as the application (e.g.,              product-oriented way (e.g., per mattress, softcore, 180 cm width,
methanol, or carbonate aggregates) and the expert should include                  10-year durability) (EC-JRC, 2010). If the TEA study is conducted
a detailed description of the product (e.g., molecular structure                  together with an LCA, the functional unit shall be consistent for
and properties). For cases of multiple applications, a key question               both studies. Table 3 lists examples.
is how many can be carried out at the same time. If multiple
applications can be carried out in parallel, practitioners should                 Product Systems
define a relevant “application-mix” (e.g., for multiple ash sources               Deriving a CCU product system and its elements
for CO2 mineralization). If only one of multiple applications                     The “system boundary” defines the limits of the assessed product
can be carried out at a time, selecting only one application is                   system and describes which system elements belong to it.
sufficient (e.g., polyols for flexible or rigid foams, energy storage             Material flows and energy flows crossing the system boundary are
for household-scale or grid-scale).                                               referred to as “input flows” and “output flows” (see Figure 3).
   The product applications should be defined specific to the                        When defining system elements, choosing an appropriate level
market segment as it is recommended to compare products                           of detail is crucial; Practitioners shall use process units as a
with equal performance. Comparing products with different                         basis for system elements (e.g., electrolysis, CO2 capture, methanol
performances is possible but requires a good understanding                        synthesis). The assessment should not only be carried out for
of price-performance correlations (e.g., market segments: low                     the product system overall, but each system element individually,

Frontiers in Energy Research | www.frontiersin.org                            5                                            January 2020 | Volume 8 | Article 5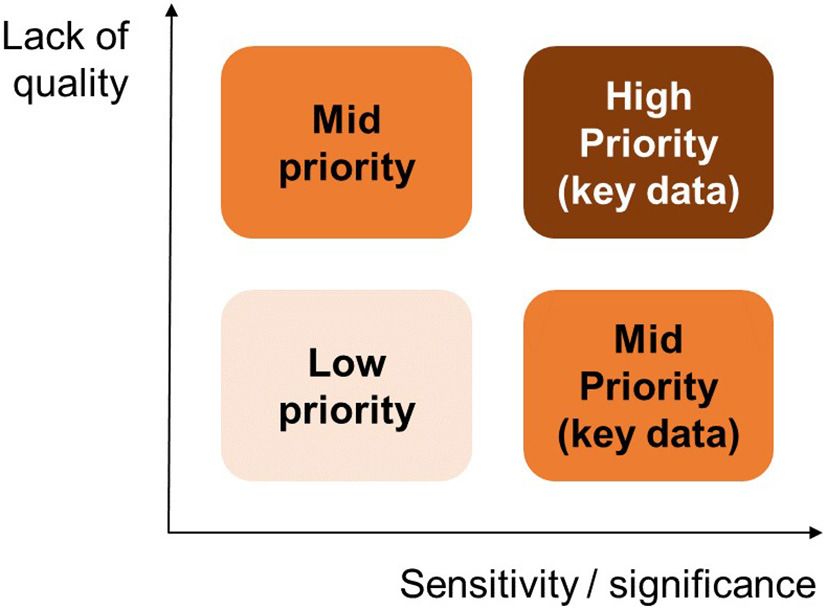
Zimmermann et al. TEA Guidelines for CO2 Utilization
TABLE 3 | Examples of CCU substitutes, the basis of comparison, functional units and reference flows.
Substitutes Non-substitutes
CCU class/ Chemical products Material products Fuels Energy storage All
Properties systems
Basis for comparison Mass Material performance Energy Storage performance Service or performance
provided
Functional unit e.g., mass, plant output e.g., mass, plant output e.g., energy, mass, e.g., energy, plant Compare the
plant output output performance of new to
existing solutions
Reference flow e.g., 1 t methanol, 1.6 e.g., 1 t concrete, 50 e.g., 1 MJ of H2 , 2.5 e.g., storing 1 MJ of e.g., 1 t, 1 MJ, the
Mt/a plant output over kt/a plant output over Mt/a diesel over 20 a electricity, 80 MWh output of conventional
20 a 20 a battery plant over 20 a
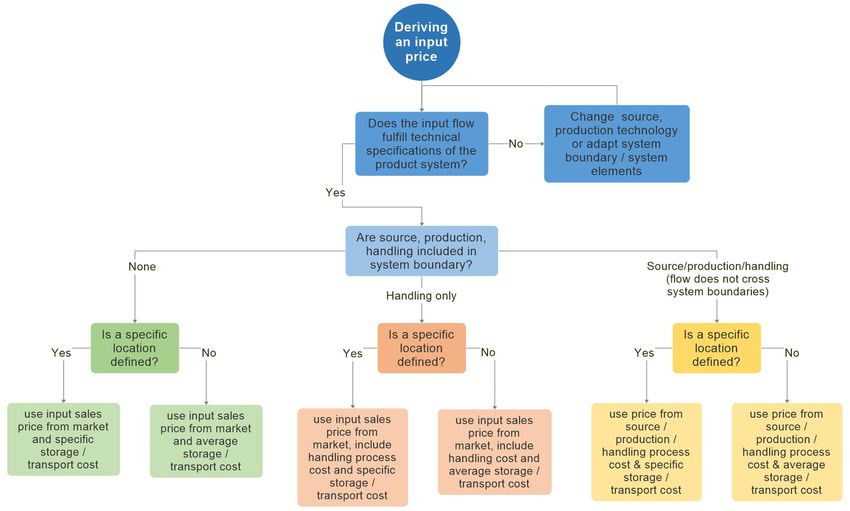
phases are likely to be the same as for benchmark products;
a gate-to-gate approach is therefore sufficient. For non-
substitutes, the indicator values could significantly change when
including the use and disposal phases, due to a different
structure and properties. This change should either be addressed
by including price-performance correlations in gate-to-gate
assessments which help to include rational decision making
of users, or by extending the system boundaries to cradle-to-
grave to include impacts from the whole life cycle (also see
LCA Guideline, chapter C.4.2.1). If the intention is to integrate
economic and environmental assessment, practitioners shall
derive the system boundaries from the LCA Guidelines; also see
Figure 4 for different boundary possibilities.
The approach of Life Cycle Costing (LCC) can be helpful
when extending the boundaries to cradle-to-grave (Swarr
et al., 2011a; Sell et al., 2014; ISO, 2017). However, the high
FIGURE 3 | An exemplary product system with its elements, boundaries, number and wide variety of LCC approaches lead to reduced
input, and output flows.
comparability of the studies. Recent discussions of integrating
LCC and LCA exist, which could be helpful when addressing
an integrated techno-economic-environmental assessment with
meaning that each system element should serve as the accounting cradle-to-grave boundaries (see Swarr et al., 2011b; ISO, 2017;
unit for inventory, calculation, interpretation, and reporting. Miah et al., 2017; Dong et al., 2018).
General guidance on defining the scope for product systems that
include carbon capture is provided by the standards ISO 27912 Including or excluding CCU upstream processes in system
and ISO 27919 (ISO, 2016a, 2018). boundaries
Common questions are whether to include or exclude CO2
Deriving CCU product system boundaries capture, separation and transport processes, hydrogen or
Overall, the system boundaries shall be consistent with the electricity production. Any exclusion does not mean that the
TEA goal and perspective. Practitioners can derive TEA system study does not account for the upstream economic impacts,
boundaries from two points of views: the perspective of the but that practitioners replace process-specific technical and
study and product properties. TEAs with an R&D or corporate economic data with average or generic data. Therefore, such
perspective typically focus on product development and draw exclusion cannot result in zero cost input flows, as it is unlikely
the system boundaries around the activities of a company (gate- that suppliers provide CO2 or H2 or electricity without charge.
to-gate). This approach resembles the cradle-to-gate approach The decision shall be made for each process individually to
in LCA as economic “impacts” of resource extraction are serve the assessment goal, data availability, data requirements,
represented by input prices. TEAs with a market perspective and the audience. In the case of an independent TEA, experts
can draw the system boundaries around a whole value chain shall include any upstream process that lies in the focus of
involving multiple organizations, spanning from processing to the assessment goal, that is required for linking other system
the use phase and disposal. Such TEA gate-to-grave system elements, or that significantly contributes to the uncertainty
boundaries are especially relevant for policy audiences. of the results. If practitioners conduct TEA and LCA studies
Furthermore, TEA system boundaries need to be consistent in parallel, CO2 capture, separation, and transportation shall
with product properties. For substitutes, the use and disposal be included in system boundaries (see LCA Guidelines chapter
Frontiers in Energy Research | www.frontiersin.org 6 January 2020 | Volume 8 | Article 5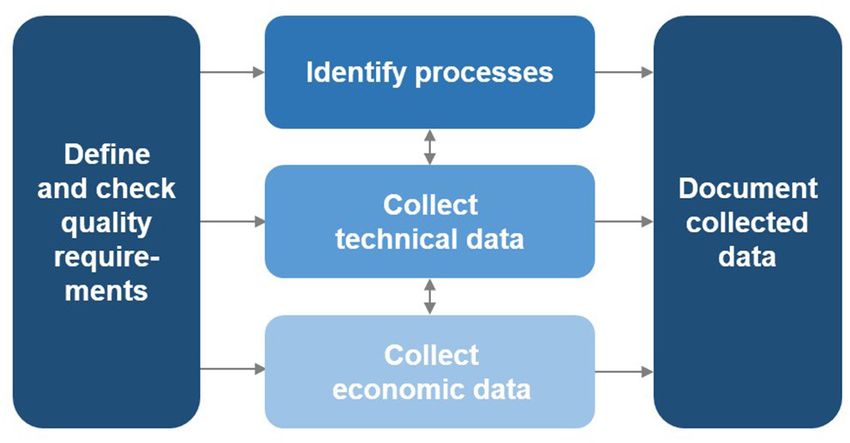
Zimmermann et al.                                                                                                           TEA Guidelines for CO2 Utilization

 FIGURE 4 | The scope of TEA and LCA in the product life cycle, adapted from von der Assen (2016).

4.2); other upstream processes shall follow the LCA principles.                    Presentation of a product system
Following the iterative approach (see section Data Quality), it                    Product systems, their elements, and boundaries shall be
might be that an upstream process is excluded at first and added                   presented in a graphical scheme (see Figure 3), such as an
later when it becomes apparent that they significantly contribute                  extended block flow diagram. The required specifications for all
to uncertainty. If this is the case, but practitioners exclude                     input flows shall be described, including mass flows and their
upstream processes nevertheless, they shall provide a reason.                      composition, energy flows, and their type of carrier, temperature,
                                                                                   and pressure.
Multiproduct systems                                                               Benchmark Product Systems
Product systems can have multiple raw materials or multiple                        The term “benchmark” is used for other products or services
products (also called multifunctionality). However, comparing                      providing the same application. Benchmark product systems
systems with different products is challenging. For systems                        can have similar or different technologies compared to the
with multiple products, practitioners should take into account                     reference product systems (e.g., thermochemical, electrochemical,
relationships and dependencies between products. When the                          biochemical or photochemical pathways) and belong either to
system produces multiple products, such as coupled products,                       existing technology regimes (e.g., CCU methanol compared to
at the same time (dependent products), experts need to include                     conventional methanol) or to new ones (e.g., transport by CCU
all dependent products in the assessment (e.g., coupled products                   fuel vehicles vs. battery electric vehicles). Essential for identifying
of water electrolysis—both, hydrogen and oxygen, need to be                        and selecting relevant benchmarks is a good understanding of
included). How to address multiproduct systems in TEA depends                      the product application (see section Product Applications and
on the perspective of the study and whether the practitioners                      Functional Units). Benchmarks shall be selected and stated
integrate TEA and LCA studies. If LCA and TEA studies are                          according to application and assessment goal. Customer needs
integrated, experts shall apply the same method for solving                        should be used to identify where the product might have a
multiproduct systems. However, setting the system boundaries                       competitive advantage (Cussler and Moggridge, 2011; Saavedra,
and creating the inventory can be challenging (see LCA                             2016). Practitioners shall select the currently most common
Guidelines, chapter 4.3). If practitioners do not integrate TEA                    or “best in class” products as benchmark products; one or
and LCA studies, their approach can follow any principle that                      multiple products can be selected (e.g., comparing a CCU
ensures meaningful results. TEAs for multiproduct systems                          material to three materials available on the market). Besides, they
typically calculate indicators for all products combined without                   should additionally include benchmark products that might be
separating the indicator value for the particular products (e.g.,                  relevant in the future in the assessment (e.g., extending the prior
calculating profits for a whole plant, including all products it                   comparison by two promising future material concepts).
makes). Another approach is allocation, where experts allocate a
share of the result to each product following a key. One particular                Assessment Indicators
allocation approach is economic allocation, where, for example,                    In the following “criterion” is referred to as a parameter
the overall profit can be allocated to each product by the revenue                 in decision making (e.g., profitability), “indicator” as a
that this product generates. However, an economic allocation                       representative measure for a criterion (e.g., net present value)
is challenging in case of highly uncertain prices and therefore                    and “method” as the way of generating an indicator (e.g.,
practitioners need to apply it carefully.                                          an equation for net present value). Practitioners derive the

Frontiers in Energy Research | www.frontiersin.org                             7                                           January 2020 | Volume 8 | Article 5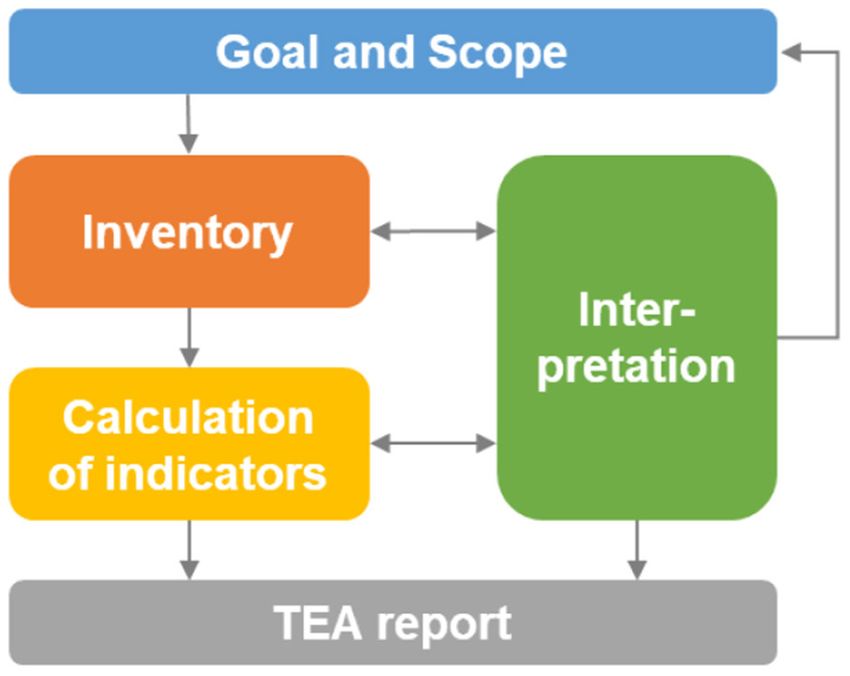
Zimmermann et al.                                                                                                                      TEA Guidelines for CO2 Utilization

TABLE 4 | List of example criteria and indicators.

Area                Criterion           Indicator examples

Technical           Energy demand       Heat demand, cooling demand, electricity
                                        demand, primary energy demand
                    Energy efficiency   Lower heating value efficiency, higher
                                        heating value efficiency, energy/exergy
                                        efficiency, CO2 capture penalty
                    Mass demand         Mass demand of individual inputs, mass of
                                        CO2 converted
                    Mass efficiency     Atom economy, yield, percentage of CO2
                                        converted
Economic            Processing effort   Operational expenditure (OpEx)
                    Investment effort   Capital expenditure (CapEx)                        FIGURE 5 | Five phases of TEA inventory creation.
                    Product margin      Market-derived margin for a product,
                                        company-internal margin
                    Product volume      Market volume for a product,
                                        company-internal demand                           • Specific indicators for the assessment of product systems
                    Resource            Market volume for feedstocks,
                                                                                            including carbon capture are provided in the standards ISO
                    availability        company-internal availability of resources,         27912 and ISO 27919 (ISO, 2016a, 2018).
                                        number of suppliers
                                                                                          The selected indicators shall be compliant with the assessment
                    Profitability       Profit, net present value, internal rate of
                                        return                                            goal (e.g., select cost and revenue indicators for a corporate-
                    Profit/cost per     Cost per kg benchmark product
                                                                                          perspective TEA) and accessible for the intended audience
                    functional unit     equivalent, cost per km, cost per MJ              (e.g., detailed indicators for researchers, aggregated indicators
                                        stored                                            for politicians). As the goals for CCU TEAs relate to techno-
Techno-economic Technology              Technology Readiness Level (TRL)                  economic questions, indicators from both fields should be
                maturity                regarding market introduction                     selected. The selected indicators and methods shall be compliant
                                        (Horizon2020 definition), company internal
                                                                                          with technology maturity, which indicates whether data is
                                        maturity rating
                                                                                          available and whether estimation methods can be used (e.g.,
                                                                                          approximated or measured energy demand for OpEx). With
                                                                                          increasing maturity, the level of technical detail increases and the
choice of criteria, indicators, and methods from the assessment                           understanding of products, costs, and markets improve; overall
goal and technology maturity, which needs to be defined                                   data becomes more reliable and representative and estimation
before the assessment (Buchner et al., 2018, 2019). A lack of                             methods increase in quality. Depending on the maturity simpler
indicator standardization was demonstrated for CCU TEAs:                                  or more complex indicators can be chosen (e.g., simpler static
A high number of indicators is currently used to evaluate                                 relative profit vs. more complex dynamic net present value).
one criterion, and different methods are applied to derive one
indicator, representing a significant obstacle for comparison                             Inventory
(Zimmermann and Schomäcker, 2017). Table 4 shows examples                                 After the goal and scope phase, the inventory phase follows next.
of criteria and indicators.                                                               The general approach to establish the inventory model covers
   Many TEAs use the indicators technology readiness levels                               five interlinked phases: defining requirements for data quality,
(TRL), operational expenditure (OpEx), and capital expenditure                            identifying relevant technical processes, collecting technical and
(CapEx); however, the used definitions and calculation methods                            economic data as well as documenting the collected data (see
vary widely. The detailed guidelines cover definitions and                                Figure 5). In this paper, data is described according to its type
methodological approaches of TRL, OpEx, and CapEx (for                                    (process-specific, industry-average, or generic) and according to
CapEx and OpEx see section Economic Indicators, for TRL                                   its sources (primary or secondary).
see detailed guideline section A). Indicators and methods
                                                                                          Data Quality
can be selected from the list presented above, or from the
                                                                                          First, practitioners shall define quality requirements for each
pool of indicators used in similar TEA studies or chemical
                                                                                          data point—according to the assessment goal and scope (e.g., for
engineering textbooks:
                                                                                          methanol production– primary, process-specific data for the system
• General TEA indicators and methods for the chemical                                     elements of reaction and distillation, and secondary, average data
  industry can be found here (Peters et al., 2003; Sinnott and                            for all other system elements). Second, data quality shall be
  Towler, 2009; Turton et al., 2012)                                                      checked and documented during data collection. The aim is
• Specific indicators for the assessment of early-stage                                   to substantially reduce time and effort by first collecting high-
  technologies are discussed here (Sugiyama et al., 2008;                                 quality data sets only when these contribute sensitively to the
  Patel et al., 2012; Kabatek and Zoelle, 2014; Otto et al., 2015;                        TEA result and second increasing data quality step by step until
  Buchner et al., 2018)                                                                   it matches the requirements (iterative approach). The iterative

Frontiers in Energy Research | www.frontiersin.org                                    8                                               January 2020 | Volume 8 | Article 5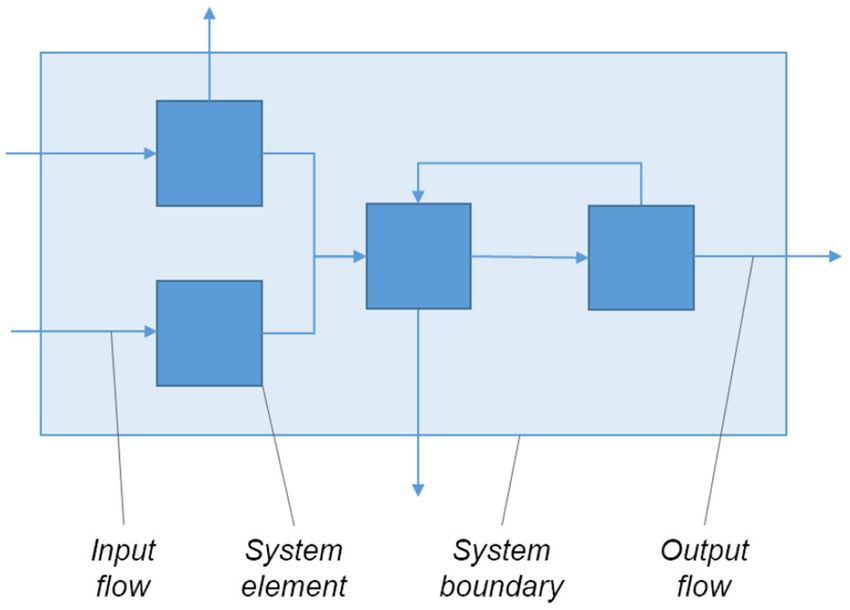
Zimmermann et al.                                                                                                     TEA Guidelines for CO2 Utilization

approach reduces effort by helping to identify and increase                      For analyzing the economic criteria, practitioners require data
the quality of significant data points only. Sensitivity analysis            on cost, sales prices, and market volumes. In many cases, the
and uncertainty analysis help to characterize each parameter                 cost of a plant is not available but needs to be estimated (see
during the inventory model creation (see section Uncertainty and             section Economic Indicators). For deriving the sales price of
Sensitivity Analysis).                                                       substitutes, a value-based approach is recommended; a cost-plus
    In each iteration, practitioners should choose types and                 pricing approach can serve as an approximation. For the sales
sources of data according to the quality requirements. In the                price of non-substitutes, a price-performance approach can be
first iteration, low data quality can be the starting point. In              used. The market volume for substitutes can be derived from the
the second and following iterations, experts need to raise the               market volume of benchmark products; estimating the market
quality requirements and collection effort where necessary (e.g.,            volume for non-substitutes can be challenging.
input price data from an open internet platform in the first                     Practitioners shall describe the temporal and regional context
iteration, from a commercial price database in the second iteration,         of the study (e.g., value chain characteristics) as well as
and from a market study in the third iteration). If practitioners            their related limitations and risks, and justify context-specific
cannot improve data quality to a satisfactory level, they might              assumptions and parameters. If prices or market volumes
not be able to answer the questions posed in the goal. Thus,                 are estimated based on similar studies, a reasonable overlap
they should either adjust goal and scope according to data                   between temporal and geographical conditions is required, so
availability or discontinue the study. In general, with increasing           limitations are not underestimated. For example, governmental
maturity of the assessed process, more process-specific and                  regulations might strongly vary between locations and impact the
primary data should be used, as this data increasingly represents            feasibility of the product system (e.g., subsidies on feedstock, taxes,
the projected process at the deployment stage. However, experts              environmental regulations).
should use generic or average data from secondary sources,                       For economic data in the inventory model, input prices play
where sufficiently representative.                                           a crucial role. It is, therefore, necessary to derive prices for input
    Practitioners should aim at collecting data available at the             flows that cross the system boundaries. In some cases, it might be
corresponding technology maturity: The technology maturity of                of additional interest to derive a price of a flow between system
a product system gives an indication, whether specific data points           elements (e.g., the internal production cost of 1 kg of hydrogen
can be collected directly at high quality or need to be estimated.           via electrolysis as a basis for comparison to other production
For CCU, where many early-stage technologies are under                       alternatives). Deriving an input price, in general, depends
development, and for which relevant, high-quality economic data              on three major factors: technical specifications, assessment
is not available, data estimation is particularly important. Based           boundaries, and location. First, the technical specifications of
on the available data from the present technology maturity, the              the input flow need to match the requirements by the product
projected plant (TRL 9) is estimated. Practitioners shall state any          system, such as in quantity, quality, and development over time.
problems with the acquisition of confidential data clearly.                  If the input flow does not meet these requirements, practitioners
                                                                             need to change the input flow source or production technology,
                                                                             modify the system boundary, or change the system elements. For
Collecting Data                                                              example, if an input flow does not reach the purity required by
Overall, data collection shall follow data requirements, selected            the product system, a purification step could be added to the
methods and indicators, and the defined assessment goal. As TEA              product system. Second, practitioners need to define whether or
aims to guide the improvement of the overall product system, but             not the source, production, or additional handling steps, such as
also of individual elements, the collection and documentation of             purification, compression or heating, of a flow are included or
data for each identified system element become necessary. The                excluded by the assessment boundaries. In the example, experts
level of detail shall follow the identified processes based on the           need to account for the added purification step in the assessment.
system elements.                                                             Please note that if they include the source, production, and
    Technical data comprises energy and material flows, process              handling in the assessment, the discussed flow does not cross the
conditions, and equipment specifications, among others;                      system boundaries and is not an input to the product system,
practitioners obtain technical data primarily from process                   instead it flows between system elements; however, deriving a
design. Economic data comprises of costs of equipment, prices                price for such flow can be of interest. Third, if practitioners
of inputs and outputs as well as market information. Similar to              define a specific location of the input source, the specific cost
technical data, economic data can be obtained from a variety of              for transportation and storage can be used, otherwise applying
sources (e.g., quotes, databases, experts, literature) but in contrast       average cost is sufficient. In the example, the production could
validity is much more limited to the scenario (e.g., location of             be in the same industrial park, and experts could include simple
quote) and values can vary significantly between sources (e.g.,              transportation cost by pipeline.
internal company prices vs. market prices). When collecting                      Practitioners should also adapt the quality of price data
data from different sources, practitioners should carry out                  and the number of sources to technology maturity. In early
harmonization, which means keeping uniformity and aligning                   research and development stages, market-average price data
assumptions (e.g., adapting data to the same year, continuous use            should be used; typically, few secondary sources are sufficient.
of lower heating value). Where possible, technical and economic              In development stages, experts should include market-average
data shall be related to the functional unit and reference flow.             price data that is date and location specific; typically, secondary

Frontiers in Energy Research | www.frontiersin.org                       9                                           January 2020 | Volume 8 | Article 5
Zimmermann et al. TEA Guidelines for CO2 Utilization
FIGURE 6 | Deriving an input price.
sources are still sufficient, but multiple sources need to be should consider a source or supply with the lowest technically
included. In deployment, practitioners should use process- required concentration of CO2 , they cannot only base the
specific data and primary sources. The detailed guidelines choice of emission source on the lowest price. Source and
provide a further description. capture processes need to be critically reviewed, as these might
If the technology maturity is low, experts have to include cause higher environmental burdens compared to alternatives,
learning curves and improvements for the system elements, for requiring a proper LCA. A practice-relevant overview of flue gas
both reference product systems as well as the benchmark systems; qualities is provided in the standard ISO 27912 (ISO, 2016a).
The cost reduction from building the first of a kind (FOAK) Second, deriving a CO2 price is dependent on the system
and nth of a kind (NOAK) plant needs to be taken into account boundaries, meaning whether practitioners include or exclude
(Rubin, 2014, 2016; van der Spek et al., 2017a,b) CO2 source, capture, and compression from the assessment. The
CO2 price shall be related to the assessment scope, especially
Deriving a CO2 Price to emission source and CO2 capture technology. When experts
Deriving a CO2 price depends on technical specifications, system include CO2 capture in the system boundaries, the base case
boundaries, and location (see Figure 6). First, the technical CO2 price shall represent the cost of capture and compression;
specifications of flue gas source, CO2 capture, and utilization the CO2 price shall be calculated based on the full process
need to be consistent. Key factors are, for example, CO2 providing the CO2 stream. Including handling steps such as CO2
concentration or quantity. Furthermore, practitioners need to purification or compression in the assessment, also requires to
clarify whether the product system uses the CO2 -containing flue include handling cost based on the process. When practitioners
gas directly or requires an additional purification step. Some exclude CO2 capture, they should derive the base case CO2 price
CCU processes require concentrated and therefore typically more from a market price, which they can collect from a supplier quote.
expensive CO2 -containing flows, while others operate with less Third, deriving a CO2 price is dependent on whether a specific
concentrated and therefore also typically less expensive ones location has been defined or not, meaning that assessments
as the purification step can be left out. If the specifications with a specified location require data of local CO2 sources,
of the CO2 -containing flow do not meet the requirements of while others can be sufficiently assessed with regionally average
the product system (e.g., too high impurities or too low CO2 data. If the assessment goal and scope define a particular
concentration), practitioners can change the source or production location, a location-specific CO2 price shall be derived. When
technology or adapt the system boundaries or system elements, the practitioners exclude the CO2 capture from the system
such as separation processes to the assessment. While experts boundaries, a location-average price is sufficient, but the distance
Frontiers in Energy Research | www.frontiersin.org 10 January 2020 | Volume 8 | Article 5Zimmermann et al. TEA Guidelines for CO2 Utilization
between the source and the utilization plant should be also hydrogen price is, like any price, dependent on the three
considered. The CO2 price shall be estimated considering significant factors: technical specifications, system boundaries,
transport. Detailed guidance on pipeline transport of CO2 can and location (see Figure 6).
be found in the standard ISO 27913 (ISO, 2016b). First, the technical specifications of hydrogen production
One typical pitfall when deriving a CO2 price from literature is need to be consistent with its consumption, which can be
mixing up the cost of CO2 captured, and the cost of CO2 avoided. hydrogen concentration in the output stream, output quantity,
“Cost of CO2 captured” relates all processing cost of CO2 capture or process durability. If not already completed in the maturity
to the amount for CO2 available for utilization; practitioners shall assessment, practitioners shall document the maturity of the
report the cost of CO2 captured or otherwise include a statement. underlying hydrogen production technology and discuss their
In contrast, “cost of CO2 avoided” (or “CO2 abatement cost”) current and future viability. Experts shall include a mature
relates all processing cost of capture and production to the hydrogen production (TRL 9) as system element in the base
amount of CO2 emissions avoided; “CO2 avoided” means the case; future and low carbon footprint technologies should be
difference in CO2 emissions between the product system and the included as scenarios (see Häussinger et al., 2011 and IHS
benchmark system. To calculate the quantity of CO2 avoided, life Markit, 2015). When selecting the hydrogen production process,
cycle assessment is required, underlining the active link between practitioners should favor “green” hydrogen generation and need
TEA and LCA. to consider environmental trade-offs. If the specifications or the
In the inventory model and the TEA report, the key hydrogen-containing flow do not meet the requirements of the
technological and economic assumptions for deriving a CO2 product system (e.g., too many impurities or too low process
price shall be documented, such as: durability), practitioners can change the production technology
(e.g., from alkaline electrolysis to PEM electrolysis), adapt the
• Technologies: capture, compression, transport and storage
system boundaries or change the system elements (e.g., adding
concepts, CO2 concentrations, flow rates, flow conditions
the separation of impurities).
• Prices: process-specific or average, cost of CO2 capture
Second, deriving a hydrogen price is dependent on the system
• Limitations: regional restrictions, reference year and applied
boundaries, whether practitioners include or exclude hydrogen
transformation factors.
production from the assessment. If hydrogen production turns
When deriving the CO2 price from literature, the reported values out to be a significant cost driver, data requirements are high,
range from 5 USD/tCO2 to 180 USD/tCO2 (Metz et al., 2005; and therefore, experts should include hydrogen production in
Zero Emission Platform, 2011; Lackner et al., 2012; Wilcox, 2012; the system boundaries. If the hydrogen production is included,
de Coninck and Benson, 2014; Smit et al., 2014; Naims, 2016; the hydrogen price shall be calculated based on the full process
Leeson et al., 2017), while the EU Prodcom database reports an cost. If hydrogen production is excluded, practitioners shall
EU-28 market average value of 78 EUR/tCO2 (70 USD/tCO2 ) for use the input sales price from the market. Including system
2016 (Eurostat, 2018). Any selected cost data or cost ranges from elements for handling (e.g., purification or compression) in the
literature shall be checked and harmonized to ensure the use assessment, also requires to add process based costs for these
of adequate assumptions, such as same units, same base year, handling elements.
appropriate scales, matching technology maturity and consistent Third, deriving a hydrogen price is dependent on the location.
boundary conditions. If a specific location has been defined (e.g., onsite production
This work refrains from recommending the use of regulatory or delivery from within the industrial park) the storage and
adjustments or cost lowering mechanisms regarding the transport cost shall be included relating to this location. If a
estimation of CO2 prices in the base case. Although specific specific location has not been defined in greater detail (e.g.,
examples of such mechanisms exist (e.g., emission trading schemes delivery by road from the Netherlands or shipping from Saudi
or carbon taxes), significant regional differences and future Arabia) cost of transport and storage shall be included, but it
political decisions add to high underlying complexity. Including is sufficient to use average cost. For hydrogen prices (also see
these mechanisms in the base case, would decrease comparability Hart et al., 2015; IEA, 2015). In general, the hydrogen price shall
between TEAs, which is, therefore, not recommended. Instead, represent the cost of production or a market price; hydrogen
practitioners may consider the use of regulatory adjustments for generation and compression shall both be represented in the
additional scenarios to the base case. price. All parameters, especially energy sources and prices, shall
be clearly documented.
Other Key CCU Inputs For transparency, hydrogen generation should be described
Besides CO2 , there are many more crucial inputs for systematically and in detail. Typical pitfalls when deriving
CCU technologies, such as hydrogen, electricity, and hydrogen prices are:
mineral inputs, which are discussed in the following
section. The detailed guidelines provide guidance on • Assuming an optimistic future hydrogen production
further inputs. technology or a larger than currently feasible production scale
in the base case scenario
Hydrogen as an input • Selecting an inexpensive but environmentally impactful
Hydrogen generation can have both substantial economic and hydrogen production technology and omitting an analysis of
environmental impacts for many CCU studies. Deriving a the environmental trade-offs
Frontiers in Energy Research | www.frontiersin.org 11 January 2020 | Volume 8 | Article 5You can also read