R 1321 - The power of text-based indicators in forecasting the Italian economic activity - Banca d'Italia
←
→
Page content transcription
If your browser does not render page correctly, please read the page content below
Temi di discussione
             (Working Papers)

             The power of text-based indicators in forecasting the Italian
             economic activity

             by Valentina Aprigliano, Simone Emiliozzi, Gabriele Guaitoli, Andrea Luciani,
             Juri Marcucci and Libero Monteforte
March 2021

                                                                                    1321
                                                                           Number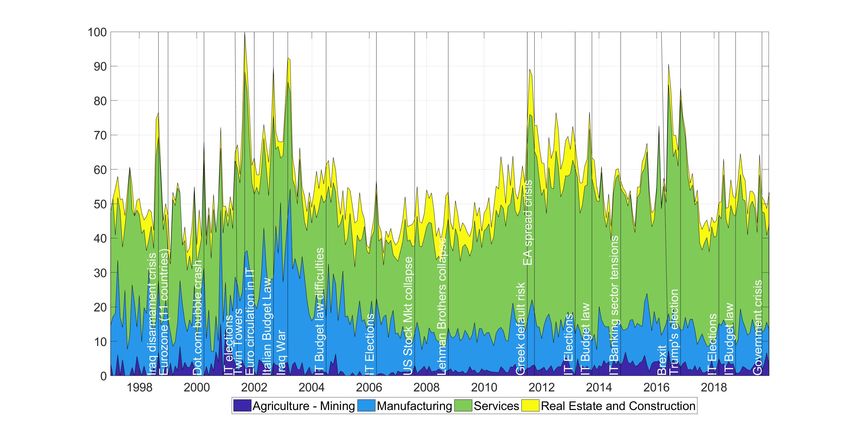
Temi di discussione
(Working Papers)

The power of text-based indicators in forecasting the Italian
economic activity

by Valentina Aprigliano, Simone Emiliozzi, Gabriele Guaitoli, Andrea Luciani,
Juri Marcucci and Libero Monteforte

Number 1321 - March 2021
The papers published in the Temi di discussione series describe preliminary results and
are made available to the public to encourage discussion and elicit comments.
The views expressed in the articles are those of the authors and do not involve the
responsibility of the Bank.

Editorial Board: Federico Cingano, Marianna Riggi, Monica Andini, Audinga
Baltrunaite, Marco Bottone, Davide Delle Monache, Sara Formai, Francesco
Franceschi, Adriana Grasso, Salvatore Lo Bello, Juho Taneli Makinen, Luca
Metelli, Marco Savegnago.
Editorial Assistants: Alessandra Giammarco, Roberto Marano.

ISSN 1594-7939 (print)
ISSN 2281-3950 (online)
Printed by the Printing and Publishing Division of the Bank of Italy
THE POWER OF TEXT-BASED INDICATORS IN FORECASTING
                       THE ITALIAN ECONOMIC ACTIVITY

        by Valentina Aprigliano*, Simone Emiliozzi*, Gabriele Guaitoli†, Andrea Luciani*,
                             Juri Marcucci* and Libero Monteforte*‡

                                                                 Abstract
       Can we use newspaper articles to forecast economic activity? Our answer is yes and, to
this aim, we propose a brand new economic dictionary in Italian with valence shifters, and we
apply it on a corpus of about two million articles from four popular newspapers. We produce
a set of high-frequency text-based sentiment and policy uncertainty indicators (TESI and
TEPU, respectively), which are timely, not revised and computed both for the whole economy
and for specific sectors or economic topics. To test the predictive power of our text-based
indicators, we propose two forecasting exercises. First, using Bayesian Model Averaging
(BMA) techniques, we show that our monthly text-based indicators greatly shrink the
uncertainty surrounding the short-term forecasts of the main macroeconomic aggregates,
especially during recessions. Secondly, we employ these indexes in a weekly GDP growth
tracker, delivering sizeable gains in forecasting accuracy in both normal and turbulent times.

JEL Classification: C11, C32, C43, C52, C55, E52, E58.
Keywords: forecasting, text mining, sentiment, economic policy uncertainty, big data, BMA.
DOI: 10.32057/0.TD.2021.1321

                                                                 Contents
1. Introduction ......................................................................................................................... 5
2. Data...................................................................................................................................... 7
   2.1 Why newspapers-based indicators ............................................................................... 7
   2.2 The News Corpus ......................................................................................................... 8
   2.3 The Italian Economic Dictionary ............................................................................... 10
   2.4 Computing the sentiment............................................................................................ 11
3. A text-based sentiment indicator for Italy ......................................................................... 12
   3.1 Sentiment by Topic and by economic sector .............................................................. 13
   3.2 Comparison with other soft indicators of economic activity...................................... 15
   3.3 Sentiment heterogeneity across sources ..................................................................... 16
4. Textual Economic Policy Uncertainty for Italy................................................................. 17
   4.1 TEPU index for Italy .................................................................................................. 18
   4.2 TEPU indexes by topic and sector.............................................................................. 19
5. Empirical applications ....................................................................................................... 20
   5.1 Monthly BMA model ................................................................................................. 20
   5.1 A text-based weekly economic tracker....................................................................... 26
6. Conclusions ....................................................................................................................... 31
References .............................................................................................................................. 32
Appendix: Additional Figures and Tables ............................................................................. 36
_______________________________________
* Bank of Italy, Directorate General for Economics, Statistics and Research.
†
  University of Warwick.
‡
  Ufficio Parlamentare di Bilancio.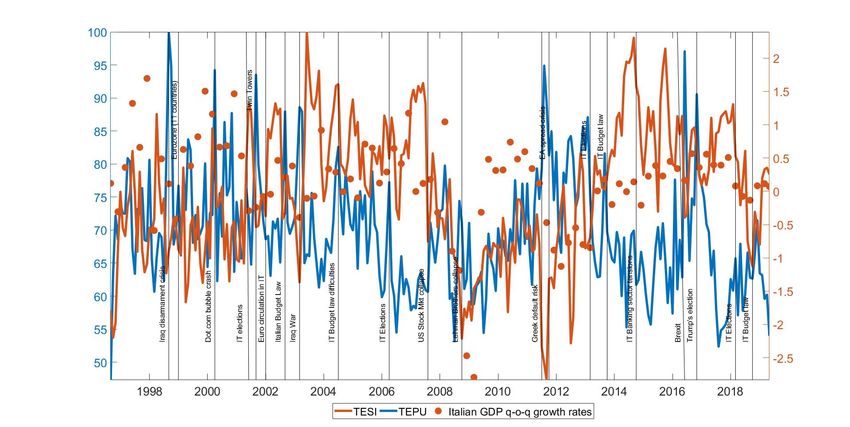
1
1       Introduction
Many radical transformations have been reshaping the structure of the economy in the
last decades. Globalization fostered capital and financial linkages across the world, while
the shift from manufacturing to services and digital technologies is structurally changing
our economies. These radical transformations, together with the legacies of the Global
Financial Crisis, before the Covid-19 outbreak, have been challenging the cornerstones
of macroeconomic theory and traditional statistical tools for economic analysis and fore-
casting (Ng and Wright, 2013; Bok et al., 2018). Notwithstanding, analysts today can
benefit from a proliferation of novel nontraditional data characterized by high frequency
and high dimensionality and obtained from unconventional and previously unexplored
sources. The big-data phenomenon is indeed spreading in economic analysis.
    In this work, we explore one of the most peculiar types of this new information: text
data, which differ from traditional data because of their unstructured nature. Text data -
like this paragraph - represent a source of valuable qualitative information for (or about)
economic agents, encoded through the complex rules of language. Recent advancements
in statistical and computational methods have allowed researchers to access and process
such data in order to extract quantitative information suitable for statistical models, such
as forecasting models (Gentzkow et al., 2019a).
    We use a multi-source database of Italian newspaper articles related to economic news
to build a set of sentiment and uncertainty measures along the lines put forward by Soroka
(2006), Tetlock (2007), Ardia et al. (2017), Loughran and McDonald (2011), Loughran
and McDonald (2014), Baker et al. (2016) and then we use these indicators to nowcast
and forecast the Italian real economic activity.
    With respect to alternative sources of textual data, such as tweets from Twitter,
newspaper articles have interesting properties that make their use particularly appealing:
i) they have no (meaningful) space restriction, allowing for a more natural use of language
and to explain more deeply or extensively about the news; ii) they are easily organized into
topics, allowing us to explore topical sentiment and uncertainty regarding Monetary and
Fiscal Policy, Economic Conditions, Domestic Policy and several other categories; iii) the
    1
     We would like to thank Eleni Kalamara, Andrea Nobili, Dooruj Rambaccussing, Roberta Zizza and
participants to the 31th (EC)2 Conference on “High dimensional modeling in time series”, the 2020 Bank
of Italy and Federal Reserve Board Joint conference on “Nontraditional data & Statistical Learning with
Applications to Macroeconomics”, the Bank of England virtual conference on “Modelling with Big Data
& Machine Learning: Measuring Economic Instability”, the 21st IWH-CIREQ-GW Macroeconometric
Workshop on “Forecasting and Uncertainty”, and the 2020 World Congress of the Econometric Society
for their helpful comments. An earlier version of the paper circulated under the title “Sentiment and
Uncertainty indexes for forecasting Italian economic activity”. The views expressed herein are those of
the authors and do not necessarily represent the views of the Bank of Italy or the Eurosystem. All
remaining errors are our own. Corresponding author: Simone Emiliozzi, Bank of Italy, via Nazionale, 91,
00184, Rome, Italy. Email: simone.emiliozzibancaditalia.it.

                                                  5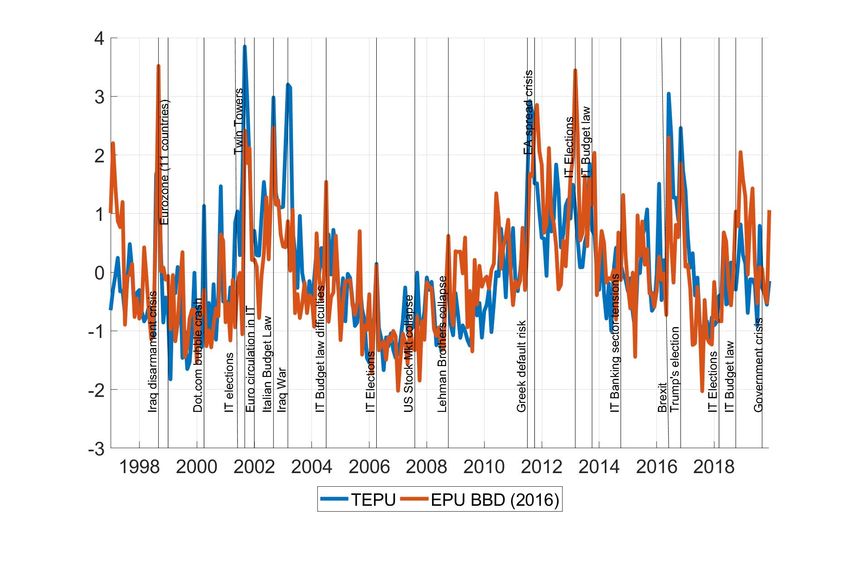
daily number of articles is relatively more stable than that one of tweets, entailing better
properties of the series and a correct interpretation of intensive and extensive margins.
As for Italy, we have survey-based evidence of the importance of newspapers in shaping
key firms’ decisions regarding investment or employment. Using the Bank of Italy Survey
on Inflation and Growth Expectations (SIGE), we show that firms put a great amount
of confidence on news read on newspapers. In fact, news is the most important source of
information after the contacts with customers and suppliers.
    Unlike the existing literature, we employ Italian-language newspaper articles from
multiple sources. Including multiple newspapers allows us to smooth the individual-
newspaper bias. The choice of the language is due to the fact that the number of newspa-
per articles about the Italian economy written in Italian is much larger than the number
of English articles about the same topic from international sources (such as Bloomberg).
Our database is extracted from Dow Jones Factiva one of the largest archives used in the
forecasting literature using textual based indicators (Thorsrud, 2018; Fraiberger, 2016;
Bybee et al., 2019; Kelly et al., 2018; Shapiro et al., forthcoming 2020). Kalamara et
al. (2020) have recently analyzed around half a million articles from three main British
newspapers showing that simple text-based indicators can improve economic forecasts,
in particular during downturns. Rogers and Xu (2019) have also recently analyzed the
predictive performance of different measures of economic uncertainty in the US to forecast
real and financial outcome variables, showing some additional predictive content of such
measures. Similarly, Rambaccussing and Kwiatkowski (2020) use around 400 thousand
UK newspapers articles from 1990 to 2018 to nowcast inflation, unemployment and output
in the UK. They do not find evidence of superior performance of sentiment for inflation,
while for output and unemployment forecasting the sentiment inferred from media seems
useful.
    One of our main contributions is the construction of an Italian dictionary of economics-
specific terms, tailored for capturing news related to the Italian real economic activity.
We enrich our dictionary with valence-shifting words2 which help to capture the correct
polarity of each sentence.
    The sentiment and uncertainty indexes that we build display consistent signals. To
the best of our knowledge, we are the first to document a negative correlation between
sentiment and uncertainty measures for Italy derived from textual data, similar to the
one found in survey data (Bachmann et al., 2013). Moreover, our indicators help in
tracking the real-time evolution of the economic activity at different frequencies. Using a
Bayesian Model Averaging approach, our monthly-aggregated indicators have high inclu-
   2
     Valence-shifting terms are negations, conjunctions, adverbs that can change the general meaning of
a sentence. In general valence-shifting terms can switch the polarity of close words or amplify or reduce
their sentiment intensity.

                                                   6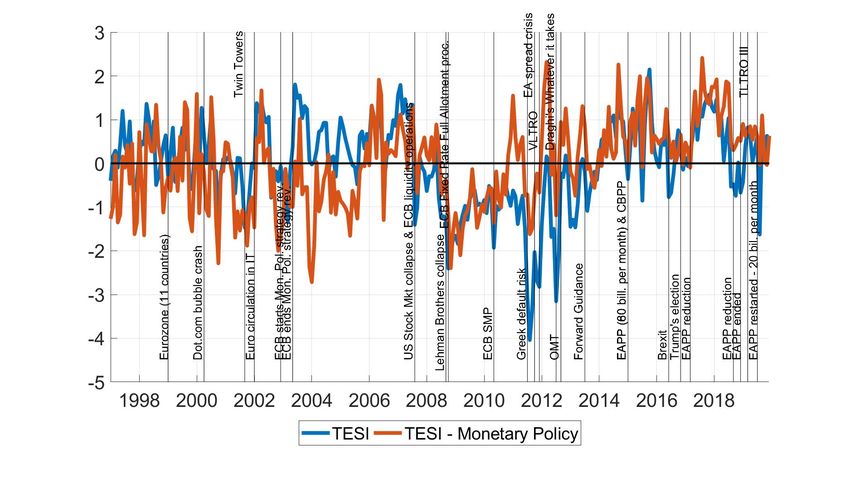
sion probabilities compared with the standard soft and hard indicators commonly used
in nowcasting. Furthermore, their inclusion tends to improve density nowcasts and fore-
casts, while the gains in terms of point-forecast are more limited and concentrated during
recessions. We also explore the weekly properties of our text-based measures, building an
high-frequency tracker of the Italian GDP as in Lewis et al. (2020) and Delle-Monache
et al. (2020). These indexes provide large point forecast gains over a simple benchmark
model when nowcasting the Italian GDP, in particular during recessions.
    The rest of the paper is organized as follows. Section 2 contains the description
of our textual database, the dictionary and the methodology put forward to compute
the sentiment indexes. Sections 3 and 4 present the overall Sentiment and Economic
Policy Uncertainty (EPU) indices and their sub topics (economic conditions, government,
monetary and fiscal policy, domestic policy and labor markets, to cite just a few). Section
5 contains the empirical forecasting application. Section 6 concludes.

2       Data
2.1     Why newspapers-based indicators
Sentiment indicators and topic analysis are becoming popular tools for forecasting and
structural analysis. Newspapers-based indicators can be a timely source of information
to track the business cycle, as already documented by recent papers (Thorsrud, 2018;
Kalamara et al., 2020; Bybee et al., 2019; Shapiro et al., forthcoming 2020; Rambaccussing
and Kwiatkowski, 2020).
    We provide novel evidence on why newspaper-based sentiment indicators are relevant
for economic purposes by interviewing the firms participating in the Survey on Inflation
and Growth Expectations conducted by the Bank of Italy (SIGE). The survey asks to
rank up the three main sources of information out of a list of six (newspapers, TV news,
institutional or trade associations’ publications, analysis carried out by private companies,
contacts with customers and/or suppliers, social networks) used for taking important
business decisions such as investing and hiring.3
    We find that firms consider newspapers a relevant and reliable source of information:
they were ranked second as the most reliable information channel, after ”Direct contact
with clients and/or suppliers”. A reasonable outcome, since supply-chain relations are
crucial for business. Figure 1 shows that almost one third of the sample claims to use
    3
    The questionnaire can be found at https://www.bancaditalia.it/pubblicazioni/
indagine-inflazione/2019-indagine-inflazione/12/index.html?com.dotmarketing.htmlpage.
language=1. The exact wording of the question and the available options have been reviewed and
approved after a pilot, which provided feedback on the clarity and the effort necessary to answer the
question. The questionnaire was filled by almost 1200 Italian firms during the last quarter of 2019.

                                                 7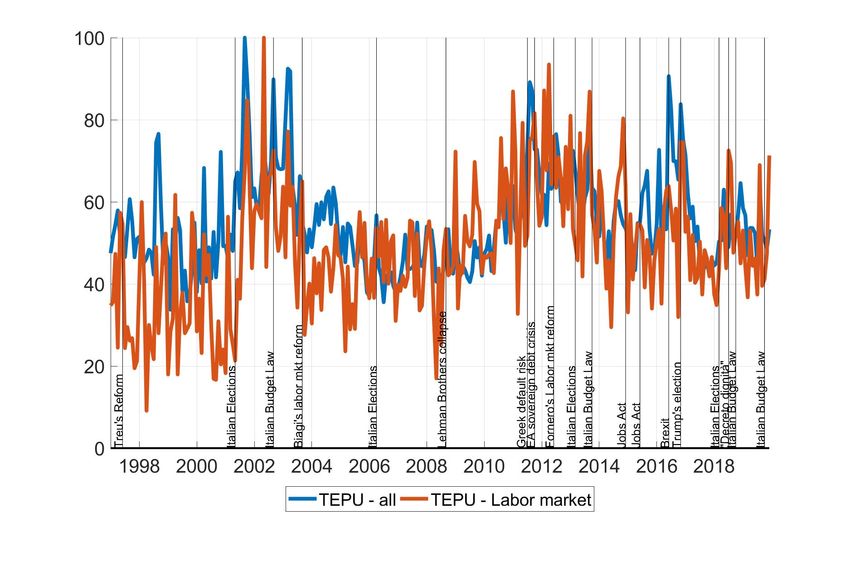
newspapers as their main source of news to inform their business decisions, while almost
60% reported newspapers among the top three most reliable sources out of the six choices
allowed in the survey.
    Among all high-frequency publicly available sources, newspapers remain the most
important one, while TV news and social networks are ranked first by less than 3% of the
firms and in the the top-three by less than 25%.

                                                 Figure 1

Sample size: 1199 respondents. First mentions sum to 1. Blue bars do not sum to 3 despite three answers
were available since some respondents (12.5%) provided only one answer (6.7%) or two (5.8%).

2.2        The News Corpus
We use articles extracted from the repository Factiva.4 Factiva’s records include the
title, text, date and source of each article, along with a number of other metadata and
an automatically generated category tagging (e.g. topic, companies’ name, geographical
region; see figure A.1 in the Appendix for a FACTIVA article snippet).
We download all articles talking about the Italian economy from the four main national
newspapers: Il Corriere della Sera, Il Sole 24 Ore, La Repubblica and La Stampa (both
paper and online editions), which have a significant national circulation and are available
   4
       https://professional.dowjones.com/factiva/.

                                                     8
for a reasonable number of years among all newspapers in the Italian language.5 Figure 2
shows the number of articles by year and source and the share of articles for each source
in each year.
Figure 2: Count of articles by year and source.
After the exclusion of articles including less than 100 words and of financial markets’
purely technical news,6 our final dataset contains over 1.6 million articles spanning from
January 1997 to December 2019.
The text (”corpus”) of the articles undergoes a preliminary screening (”pre-processing”),
to get rid of words and characters that are not informative (i.e. articles, non-adversative
conjunctions, non-meaningful punctuation).7
5
According to Accertamenti Diffusione Stampa (ADS), i.e. the company that certifies the circulation
of newspapers in Italy, Il Corriere della Sera and La Repubblica are the top two newspapers in Italy in
terms of average circulation (with 216,149 and 165,748 copies sold in 2018, respectively), La Stampa is
the fifth one (131,744 copies sold in 2018), while Il Sole 24 Ore is the tenth one (79,928 copies sold in
2018), but it is the most important Italian economic and financial newspaper. Data are available at this
link http://www.adsnotizie.it/_dati_DMS.asp.
6
We find all categories which refer to technical market communications or wraps of the daily market
prices and exclude them from our database, as the quantitative correspondent of such news is already
available, i.e. the stock market index time series itself.
7
Our corpus has approximately 350,000 unique terms before stemming, too many to be directly utilized
92.3 The Italian Economic Dictionary
In order to extract quantitative information from textual data and to shrink the dimension
of the available information we use a dictionary based approach. We compile an Italian
economic dictionary focused on economic and financial terms that recur often in journalis-
tic jargon (Soroka, 2006; Tetlock, 2007; Loughran and McDonald, 2011, 2014; Fraiberger,
2016). The dictionary is a set of words (unigrams) and phrases (n-grams) associated
with a ”polarity” (positive or negative meaning) and a ”weight” (module that charac-
terizes the relative importance of a word in a statement; see Table A.2 in the Appendix
for a small sample of our dictionary). Differently from the literature, our dictionary is
enriched with a set of valence-shifting words and specifically tailored for newspaper jargon.
A word or a ”n-gram” carries its initial ”polarity” that can be positive or negative
according to its meaning. As an example, debito (debt) starts with a negative polarity
while fiducia (trust) with a positive one. Some common collocations or phrases carry
their own meanings, possibly different from the sum of the individual words they are
made by. As an example, consider the ”bi-gram” debt growth, which carries an overall
negative meaning, despite the fact that ”growth” is positive, as ”debt” is negative.8
A ”valence shifter term” is a word which does not have a meaning on its own, but
affects both polarity term’s sign and module. For example, one can think about negations
(e.g. fall of GDP) and the amplification (deamplification) of a word in the vocabulary
(e.g. lot of uncertainty).
Our final dictionary, after stemming, contains 433 and 190 unique polarity and valence-
shifting terms, respectively.
For the compilation of our dictionary we do not use an unsupervised algorithm such
as Latent Dirichlet Allocation (LDA) (Blei et al., 2003), Word2Vec (Mikolov et al., 2013)
or GloVe (Pennington et al., 2014). N-grams are included via a supervised process where
the researcher includes relevant economic and financial terms exercising a great effort in
balancing negative and positive polarity terms to balance the dictionary. Our method-
ology is however transparent since the n-grams included in the dictionary are publicly
available and it is possible to debate on the opportunity of their inclusion (exclusion).
Our dictionary based method is fast in computing sentiment for very large corpora as the
one used in this work, while the unsupervised algorithm listed above can run into troubles
for statistical applications such as forecasting. This huge number of elementary words is far above the
160,000 terms commonly used in the Italian language and is due to the presence of English words (for
example, Recovery Plan, Buy-Back, Next Generation EU, etc.), names, strictly financial terms appearing
in short forms (for example, MRO, EAPP, TLTRO, etc.), but also typos.
8
One could argue that ”growth” is a neutral word unless associated to a meaningful name, but it is
classified as a positive word by a number of dictionaries. In economics, talking about ”growth” usually
implies an increase in output and therefore economic development.
10since they are computationally very demanding and suffer from multimodality problems
that make topic identification challenging (Roberts et al., 2016).
2.4 Computing the sentiment
Our sentiment indicators are computed using the R package Sentometrics (Ardia et al.,
2017), which allows fast sentiment computations (see figure A.2 in the Appendix for a
schematic pipeline of the procedure).
Once the text is cleaned and processed, the sentiment is calculated at article-level as
the sum of polarities divided by the number of words.
To give an example of how this approach works in practice, consider the following
sentence extracted from an article appeared on the 10th December 2019 online edition of
Il Sole 24 Ore: ”tra gennaio e ottobre il calo complessivo dell’output è dell’1,2% ” (”Pro-
duction fell by 1.2% overall between January and October”). After our text processing
routine, the sentence is collapsed in
gennaio ottobre calo complessivo output
(January October fall overall production)
to which our estimation procedure assigns a sentiment score of −0.2. In order to see how
this is computed, we highlight and classify the words which find a match in our dictionary:
gennaio ottobre calo
|{z} complessivo output
| {z }
Shifter −1 Polarity 1
The token “output” is assigned total polarity 1 × (−1) = −1 since a shifter with value −1
(“fall ”) appears within 5 words and it has not been used already together with another
polarity term. Since there are 5 words in the trimmed sentence, the total sentiment score
of article j (SSj ) is computed as
NP
words
Polarityi × Shifter(i)
i 1 × (−1)
SSj = = = −0.2
N words 5
Table 1 shows some examples of how our dictionary works on a selection of newspaper
headlines.9 While we almost always correctly classify the sign of the sentence, we are able
to capture only partially the actual depth of the positivity/negativity. Our classification
is helped by the inclusion of valence shifter terms, which allow a better signing of most
polarity terms.
9
The sentences have been translated from Italian to English in such a way to leave a sense of how
certain common collocations are overridden by the newspaper headlines’ jargon and style.
11Table 1: Sentences and associated Sentiment score
Sentence Sentiment
GDP has fallen -1.000
Ex Ilva, does ArcelorMittal risk to leave Taranto? -0.257
Oil: new cuts by OPEC, but the group argues about quotas -0.143
Clash on plastic and sugar taxes. Renzi raises the bar: I don’t want to vote, but [...] -0.083
Censis: Italians, left with no confidence, leave even the BOT. -0.029
More jobs and output. The government’s plan for a ”mixed-property” ILVA 0.257
China lends a helping hand on duties, financial indexes are positive 0.000
Istat, GDP at +0.2% in 2019. Growth expected to pick up in 2020 0.250
Ex Ilva, Conte against ArcelorMittal: ”the plan is not yet ok, we will reject it” 0.000
Debt has grown -0.500
Note: Sentences are translated from Italian, and the Sentiment is calculated using our Italian
dictionary. Sentiment measures are the raw output and are not re-scaled.
The sentiment indicator in a given day t is obtained as a weighted average of the
articles’ scores SSj , with the weights equal to the articles’ length, that is defined as the
total number of words in the text after the removal of stop-words.10
3 A text-based sentiment indicator for Italy
Figure 3 depicts our overall Text-based Sentiment Indicator (TESI), derived from newspa-
per articles from January 1997 to December 2019, along with the quarterly GDP growth
rate (both standardized). Vertical bars represent key events for the Italian economy dur-
ing this time.11
It is important to clarify that TESI is calculated in real time, while GDP data come
from a vintage downloaded in January 2020. The contemporaneous comovement between
the two series over the whole sample at the quarterly frequency is 0.45: it is low at the
beginning of the sample, between 1997 ad 2001, while it starts to increase from 2002
onward.
10
When taking sentiment averages among all articles published in a given day, we include in the
computation of the index all articles with zero/almost zero score, so that our indicators - in particular
the topical/sectoral ones - are not affected by large swings in the economic sentiment of a small fraction
of articles.
11
Since the source coverage of our database is limited until 2001, the measure before that year must
be interpreted with caution.
12Figure 3: Italian GDP (q-o-q growth rates) and TESI (daily data aggregated at monthly
frequency). Vertical bars represent important events for the Italian economy.
Notes: TESI is calculated using daily articles in real time, while GDP growth rates are calculated using
the vintage published by ISTAT in January 2020. Both series are standardized to have mean zero and
variance one.
TESI tracks important episodes for the Italian economy. It decreases after negative
events, such as the Iraq disarmament crisis in 1998, the Dot-com bubble in 2000, the
burst of Iraq war in 2003, the US stock market collapse in 2007, the financial crisis after
the burst of Lehman Brothers in 2008, the Greek risk of default in 2010, the start of the
Sovereign Debt Crisis in 2011, the Brexit referendum in 2016, the 2019 Italian Budget
Law discussion in October 2018 and finally the Government crisis in August 2019. It
increases rapidly following the end of the Dot-com bubble in 2000, the period before the
Great Recession, the recovery period in 2014 and 2015, and in 2017 when global trade
was robustly growing.
3.1 Sentiment by topic and by economic sector
We use a Factiva’s proprietary algorithm for articles tagging that assigns each article in
our corpus to one or more granular subjects (e.g. economic news, sales figures, economic
growth/recession), to estimate sentiment indexes for several economic topics and economic
sectors. To exploit the richness of information provided by Factiva, we group their 300
detailed article categories into 15 topics (economic conditions, private sector, monetary
13policy to name but a few) and 21 sectors (see table A.1 in the Appendix for the details).
These groupings are not mutually exclusive since the same article in the corpus can be
used multiple times in the computation of the sentiment for each topic. This feature is
due to the fact that newspapers articles deal with several topics. 12
Figure A.3a in the Appendix displays the contemporaneous correlation between TESI
and the 15 topic-indicators. The first row of the graph underlines the high correlation
between TESI and the sentiment indicators related to economic conditions and to the
private sector; those related to finance, government and monetary policy display a lower
degree of association. Figure A.3b shows the contemporaneous correlations between TESI
and the 21 sector-indicators. The former correlates strongly with the indicators calcu-
lated for the services, manufacturing, wholesale retail, business consumer services and
real estate & construction, which are the most important sectors in the National Accounts.
Figure A.4 displays three of the most important sentiment indicators out of the 15
computed by topic: 1) government/fiscal policy; 2) monetary policy and 3) labor market.
The Sentiment about the topic ”government/fiscal policy” (Figure A.4a) is calculated
building on Factiva categories about government finance, budget and taxation, public
debt, sales and income taxes and many others. It is highly correlated with TESI (0.7)
and its dynamics matches up well key events of the Italian politics and fiscal policy. It
tends to decrease sharply before national elections and to rebound thereafter (es. in 2001,
2006 and 2013). It reached historical low levels during the Sovereign Debt Crisis in 2011,
with the fall of Berlusconi’s Government in November 2011, during harsh political and
public debates about Budget Laws (i.e. September 2002; July 2004 when Siniscalco took
over Tremonti as Italian Treasury Minister, October 2018) and finally during the last
Government crisis in August 2019.
Figure A.4b displays the sentiment about monetary policy conditions and it is cal-
culated aggregating categories such as ECB, Central Bank interventions, interest rates
and money supply among others. This index peaks with the introduction of the euro in
January 1999 and with the change of the ECB monetary policy strategy in March 2003. It
reaches minimal values during the episode of the stock market crash in August 2007, the
Lehman collapse in September 2009, the Sovereign Debt Crisis and with the announced
reductions of the Asset Purchase Programme. Further it sharply increased after impor-
12
Suppose that a given article is composed of only two topics and that it is talking with a positive
tone about monetary policy and with a negative one about labour market conditions in Italy. Suppose
further that its overall score is positive. The article will be classified as positive in both topics. However,
comparing the topical index with the overall sentiment TESI, it is still possible to see if the press is
speaking about a given topic with a relatively better (or worse) tone, giving rise to interesting comparisons.
14tant monetary policy interventions of the ECB such as the fixed rate full allotment tender
procedure introduced in October 2008, the launch of the Security Market Programme in
May 2010, the VLTRO in December 2011, Draghi’s ”Whatever it takes” in July 2012,
the launch of OMT in September 2012, the launch of TLTRO in 2014, the start of the
Asset Purchase Programme announced in January 2015 and its restart in September 2019
(Hartmann and Smets, 2018; Neri and Siviero, 2019).
Finally Figure A.4c shows the sentiment index for Labor Market conditions,13 com-
puted using articles tagged in categories such as: employment/unemployment, general
labor issues, lay-offs/redundancies, job search. The index increases in months where im-
portant labor market reforms were passed in Italy, such as the Treu reform in June 1997,
the Biagi’s law in September 2003, the Fornero reform in June 2012, the first tranche of
the Jobs Act in December 2014, its second tranche in June 2015 and the Dignity decree
in July 2018.
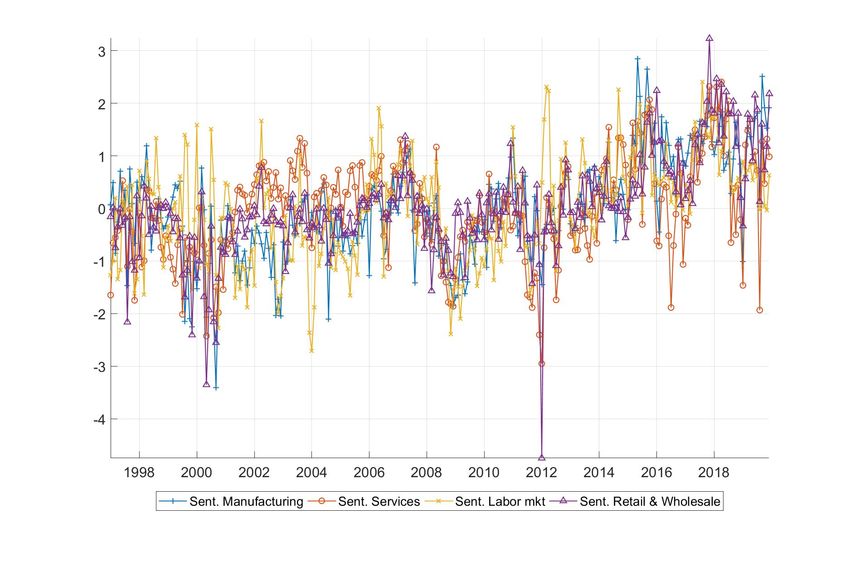
Some of the sector-sentiment indicators used in the empirical application in section 5
are displayed in Figure A.5.14
3.2 Comparison with other soft indicators of economic activity
We compare TESI with measures of consumers’ and firms’ expectation about the economic
conditions commonly used in nowcasting and forecasting Italian GDP: i) the Markit com-
posite Purchasing Manager Index for Italy; ii) the Italian business (IESI) and Consumer
Confidence indexes produced by ISTAT. Our sentiment indicator is a mixture of firms
and consumers expectations, with more weight given to news regarding businesses.15
An advantage of our TESI over the standard sentiment indicators, such as the PMIs
(published by Markit) or the the confidence indexes produced by Istat is that it can be
computed (and released) at higher frequencies such as weekly or daily. Moreover, the
Markit and Istat indicators are based on data collected in the first half a given month,
while our sentiment can account for events occurring along the entire month. This means
that relevant events happening in the second half of each month would be captured by
the standard sentiment measures with a delay of one month, while our TESI would be
able to capture them with 1-2 days of delay at most.
Figure A.6a shows TESI, the Italian composite PMI and the q-o-q variation of the
Italian GDP. The contemporaneous correlation between our Sentiment Index and the
13
One should be careful in interpreting the labor market sentiment index as an attempt to estimate
an indicator of the state of this market. The index is a measure of how positive (negative) some labor
market news are commented by journalists in the press.
14
All the sentiment indicators not reported in the paper are available upon request.
15
Topic indicators may be relevant for tracking firms or consumers beliefs. This is left for further
analysis.
15composite PMI is 0.5 at the monthly level.16
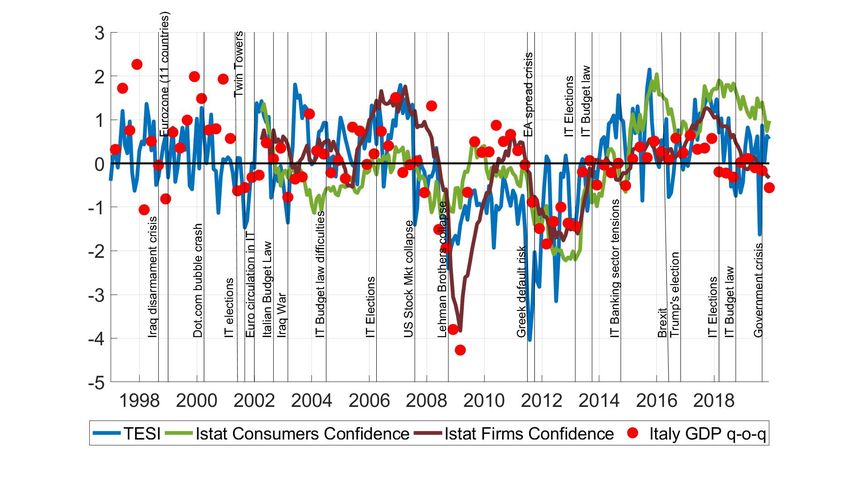
Figure A.6b displays TESI together with business’ and consumers’ confidence indices
released by ISTAT. Looking at the contemporaneous correlation, the Sentiment aligns
better with businesses’ confidence rather than consumers’ one.
Finally, Figure A.7 shows a comparison at monthly frequency between TESI and the
Istat Social Mood on Economy (SME) index based on Twitter feeds.17 Our measure has
several advantages: i) it covers a longer time span, while the Istat index starts only in
February 2016; ii) we provide a topical and sectoral decomposition of sentiment unlike
the SME; iii) our index is based on major Italian newspapers articles while SME relies
only on Twitter. The contemporaneous correlation between the two indices at monthly
frequency is moderate (0.3). The association is elevated at the beginning of the sample,
from February 2016 till June 2017. Instead, they tend to move in opposite directions
during the first phase of the US-China trade dispute with the failed agreements in July
2017 and during the course of 2019. During the Italian Government crisis in August 2019
our indicator collapsed, while SME jumped up to high positive values. In this short time
span TESI tracks better than SME the dynamics of Italian GDP growth.
3.3 Sentiment heterogeneity across sources
Since our sources may differ by political alignment, main focus (generalist news/ eco-
nomic), geographical interest (national/local) and style, we compute complementary sen-
timent indicators by newspaper to look at the differences. The results can be seen in
Figure A.8 for Il Corriere della Sera, La Repubblica, Il Sole 24 Ore and La Stampa.
We find a relevant level of heterogeneity in the sentiment computed across different
newspapers. In particular, while all big events and trends show up in all the four news-
papers and the overall trend seem similar, some differences arise in the monthly variation
in some sub-periods and in the first two moments of the series. This last feature does not
emerge in Figure A.8, where the series are standardized in order to focus on the first two
differences.
For example, between 2015 and 2017 GDP growth reached its maximum (considering both
q-o-q and y-o-y variations) since the Great Recession, but different sources show very dif-
ferent dynamics. The overall indicator has a slight negative trend between 2015 and late
2016, which seems inconsistent with the GDP growth figures. However, the change in
the aggregate indicator is driven by a strong negative movement in the sentiment of La
16
This high correlation is recorded also between the sentiment and the other PMI subcomponents such
as PMI manufacturing, services and their forward looking components.
17
The Istat Social Mood on Economy (SME) index based on Twitter feeds con be downloaded here
https://www.istat.it/en/archivio/219600
16Stampa and La Repubblica, while this fall is smaller for Il Corriere della Sera and Il Sole
24 Ore. On the contrary, all newspapers but La Repubblica seem to be overly pessimistic
during 2018 and 2019. La Repubblica and Il Sole 24 Ore also seem to have had much
worse news during the peak of the Sovereign Debt crisis than during the Great Recession,
when GDP fell by more and faster. Overall, no newspaper seems to outperform the others
in tracking the GDP strictly better over the full sample.
These differences in local trends can be related to two phenomena. First, newspapers
can be generally biased against the current government in power. This is a well-known
fact in the literature, as seen and measured in a number of works such as Groseclose and
Milyo (2005) and Gentzkow and Shapiro (2010); Gentzkow et al. (2019b). Moreover, the
four newspapers considered in our sample seem to have a different topical composition of
their articles, suggesting a different reactivity of the sentiment series to different types of
events.
4 Textual Economic Policy Uncertainty for Italy
Measuring Economic Policy Uncertainty (EPU henceforth) has become a key issue in re-
cent years since the seminal work of Baker et al. (2016) (see also Rogers and Xu (2019)
for an interesting application to forecasting). Following their methodology we propose
several textual EPU indexes for Italy (TEPU henceforth) using newspaper articles at
daily, weekly and monthly frequency. The availability of the topic tags allows us to con-
struct granular topical-uncertainty indicators differently from Ardizzi et al. (2019) that
propose an overall EPU index derived from articles in Bloomberg and tweets from Twitter.
Our TEPU indexes are computed as:
Nt
P
1 [TEPU Article]i
i
TEPUt = (1)
Nt
where Nt is the number of articles published at time t, while we define ”TEPU Article”
any piece of news which contains at least one ”uncertainty word” (incert* or incertezz* in
Italian, with * being a wild card) and one ”policy word” as defined in Baker et al. (2016)
for their Italian EPU indicator.18 The TEPU index is the share of articles satisfying these
criteria. Our TEPU indexes differ from those in Baker et al. (2016) for Italy since the
denominator Nt in equation (1) is different for two reasons. First we use a larger set of
newspapers; second while Baker et al. (2016) use all the articles published on a given day,
18
See the Appendix in Ardizzi et al. (2019) for the adaptation of the ”policy word” to the Italian case.
17we use only those focusing on economics 19 .
While variation in their EPU index can be driven by an increase in the coverage of
economic news over the total amount of news in a given day, TEPU is more robust to
such changes by construction. Despite these differences, our overall TEPU index for Italy
is strongly correlated with the monthly Baker et al. (2016) EPU index as Figure A.10
shows. The monthly contemporaneous correlation between the two indicators is high and
close to 0.8.
4.1 TEPU index for Italy
Figure 4: Textual Economic Policy Uncertainty index for Italy (TEPU) calculated on all
available sources (Blue line; daily data are aggregated at the monthly frequency); Italian
GDP (red dots) all sample September 1996 - May 2019; all sources
Notes: TEPU is calculated using daily articles in real-time, while GDP growth rates figures are calculated
using the vintage published by ISTAT in November 2019.
The monthly Italian TEPU index is shown in Figure 4 together with the quarterly
growth rates of Italian GDP and selected important events for Italy. The negative con-
temporaneous correlation between TEPU and GDP growth pointed out by the literature
19
We use a broad filter to select the articles that speaks about economic activity and finance.
18is evident. The tone of the newspapers articles gets more negative after bad episodes
associated with a slowdown of the economic growth. This goes with strong spikes in our
economic policy uncertainty index, as for example during the Dot.com bubble in 2000;
after the struggling process to approve some Budget laws in Parliament in 2004 and, more
recently, in 2018; during the Global Financial Crisis, where a big jump in EPU occurred
after the Great Moderation period, and the Sovereign Debt Crisis in 2011; after Brexit
and Trump’s elections and during the the Government crisis in August 2019.
The negative correlation between Sentiment and Uncertainty indexes is a well consolidated
result in the literature, and we prove it for our measures of sentiment and uncertainty
derived from textual data (see Figure A.9 in the Appendix, where the contemporaneous
correlation is -0.4).
4.2 TEPU indexes by topic and sector
Our TEPU measure is derived exploiting all the articles available in our dataset that are
related to economic and financial news. Similarly to sentiment, we use Factiva’s propri-
etary algorithm to calculate TEPU indexes by topic and sector (see the Table A.1 in the
Appendix for the full list). Figures A.11a and A.11b show the time series of indicators
calculated by topic and sector, together with a dating of important events having impacts
on the Italian economy. Key events imply, according to their nature, different EPU spe-
cific indicators spiking up.
TEPU by topic is meant to capture the uncertainty in several sides of the economy such
as monetary or fiscal policy, economic conditions and labor markets: as evident from Fig-
ure A.11a these topics seems to explain a lot of variation in our textual economic policy
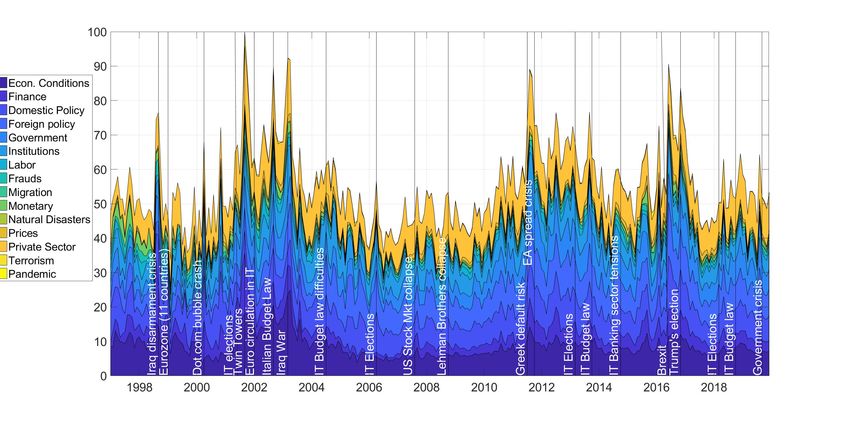
measures. TEPU calculated by sector is useful in detecting which sectors are the principal
sources or are mostly affected by the business cycle uncertainty. Figure A.12a shows the
contemporaneous correlation table of the overall TEPU index and its 15 components. The
correlation patterns are similar to those previously described for the macro-topic compo-
nents of our overall TESI: the highest correlation is reached by the topics on the top
left part of the figure. Figure A.12b displays the contemporaneous correlation between
the overall TEPU index and those built by economic sector. Also in this case results are
similar to those described for sentiment in section 3.1: the correlation is higher for indexes
calculates on articles about services, manufacturing, retail sales and construction sectors.
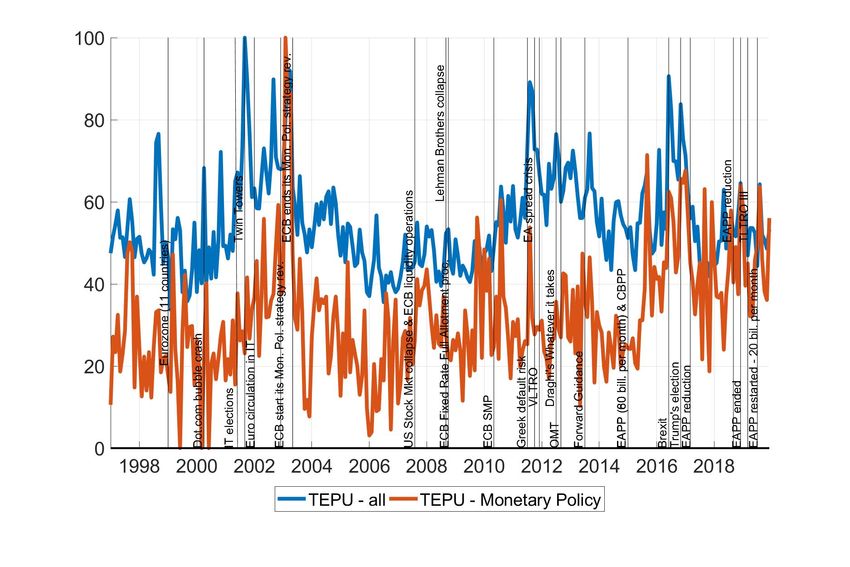
Figure A.13 in the Appendix shows the three main TEPU macro topic indicators out of
the 15 computed: 1) TEPU about government/fiscal policy; 2) TEPU about monetary
19policy, and 3) TEPU about labor markets.
Figure A.13a displays our TEPU index on government and fiscal policy articles. In
the first part of the sample, the main peaks are around the Iraq’s disarmament crisis
towards the end of 1998, the Dot-com bubble in April 2000, Bush’s election in November
2000. Afterwards, it moderately increases in periods when controversial Budget Laws
had to pass the Parliament scrutiny and during national elections times. In the second
part of the sample, high uncertainty episodes are the Sovereign Debt crisis, the Brexit
referendum, the election of Trump, the fall of Renzi’s government in December 2016 after
the failed Constitutional Law referendum and the Government crisis in August 2019.
TEPU reached its minimum when Italy adopted the euro at the beginning of 1999.
Figure A.13b shows TEPU stemming from monetary policy articles (Husted et al.,
2019). Uncertainty regarding monetary measures was low when the euro was adopted.
After that moment it stayed on low levels till the Global Financial crisis, when ECB
started to adopt several unconventional measures such as the Fixed Rate Full Allotment
Procedure after the Lehman collapse in October 2008 (Hartmann and Smets, 2018). The
monetary TEPU decreased after the approval of important measures taken by the ECB
such as the institution of the Security Market Programme in May 2010; the launch of
the Very Long Term Refinancing Operations in December 2011; the Outright Monetary
Transactions in September 2012; the announcement of the Expanded Asset Purchase
Programme in January 2015 and the its restart after the announcement of APP purchases
announced by the Governing Council in June 2019. On the contrary the index jumped
up after the announcement of the reduction of the APP Programme in July 2017.
Finally, Figure A.13c shows TEPU for news concerning the Labor market. The index
increased after the approval of important reforms for Italy such as the Treu’s reform in
June 1997 and the Biagi reform in September 2003.
TEPU indicators by sector, also used in the empirical application, are displayed in
Figure A.14.20
5 Empirical applications
5.1 Monthly BMA model
We conduct a pseudo real-time forecasting experiment21 to asses the ability of TESI and
TEPU indices to track the economic activity. The Bayesian model averaging (BMA)
described in Bencivelli et al. (2017) is employed to nowcast and forecast one step ahead
20
EPU indexes not reported in the paper are available upon request.
21
We use the last available vintage of data, i.e. December 2019, and we cut it recursively and we
reproduce the missing values’ pattern at the end of the sample.
20the quarterly growth of both GDP and some of its main components (value added in
service sector, VAS, which account for about 70% of the total economic activity in Italy;
households consumption, HHC, and gross fixed investments, GFI).
BMA provides useful statistics to evaluate whether and to what extent our text-
based indices contribute to improving both point-wise and density forecasts. The Monte
Carlo Markov chain (MC3 ) simulations are used to construct the confidence bands of the
regression coefficients, the posterior inclusion probabilities (PIPs) of each regressor and
to assess the ability of the text-based indices to shrink the uncertainty surrounding the
forecasts.
BMA averages across the S randomly drawn models
y = αs 1T + Xs βs + , ∼ N (0, h−1 IT ) (2)
where Xs is a T × Ks matrix with a subset of Ks regressors, weighting by their posterior
probabilities (assuming an equal prior probability for all the models).22 Model M s is
drawn among all the R = 2n possible ones, where n is the number of regressors. At each
iteration, model M s+1 includes a variable in M s or removes it. Based on M s , the marginal
likelihood p(y|M s ) is estimated and the acceptance probability is computed as
h p(y|M s+1 ) i
p(M s , M s+1 ) = ,1 (3)
p(y|M s )
If M s is accepted, its implied forecast is
s
ŷt+h = E(yt+h |yt , M s ) (4)
and the final forecast is
S
1X s
ŷt+h = ŷ (5)
S s=1 t+h
The information set overall includes eight text-based indices distinguished by topic
(sentiment and TEPU for economic conditions, service and manufacturing activity and
sentiment for labor market and retail sales, see Table A.3 in the Appendix) and a selection
of well-suited indicators extensively used to shape the short-term economic outlook, like
the industrial production, Purchasing Managers’ Indices (PMI), business and consumers’
confidence indices, investors’ expected earnings and, only for the HHC model, new cars
registrations23 . All the variables are demeaned (see Table A.3 for the detailed list of
22
Refer to the extensive analysis in Bencivelli et al. (2017) for details.
23
The HHC model does not include business confidence for service and manufacturing sectors and
investors’ expected earnings
21variables included in each model and their pre-treatment). We train our model using
data from January 2001 to December 2010, and we perform an out-of-sample forecast
until December 2019 using a recursive window where the BMA is re-estimated as new
data become available in real time.
The standard deviation of the investors earning expectations can be reasonably in-
terpreted as an uncertainty measure and it has an appreciable negative correlation with
the quarterly variation of the GDP. Therefore, it is particularly interesting comparing the
latter to our uncertainty measure extracted from the textual data.
Figure 5 shows the nowcasts made with a model including our text-based indices (TB-
model) with respect to a benchmark model, which excludes them from the information set.
BMA’s estimates are shown surrounded by the 25th and 75th percentiles bands, jointly
with the historical data of the q-o-q growth of the targets variable. The TB-model turns
out to grasp more effectively the depth of the downturn during the sovereign-debt crisis
for all the targets. TB-model’s nowcast is significantly negative for GFI in 2012.Q1, when
the investments dropped by almost 6%, unlike the benchmark which provides a fairly
brighter outlook. TB-model also tracks better the swing of the investments in 2017 and
2018, partly due to the uncertainty regarding the renewal of tax incentives. TB-model
tracks the contraction of households’ consumption between 2011 and 2014 significantly
better than the benchmark but it is less effective in 2016, when it overestimates the
slowing path of the dependent variable.
Table 2: Relative RMSFE for nowcasting (n) and forecasting (f)
2011.1 - 2014.12 2015.1 - 2019.12 2011.1 - 2019.12
n f n f n f
GDP 0.93 0.91 1.17 1.16 1.00 1.00
VAS 0.97 1.21 1.08 1.08 1.00 1.00
GFI 1.03 0.94 1.13 1.08 1.03 1.00
HHC 0.83 0.79 1.46 1.29 0.99 1.00
On the full sample the point forecasts do not show sizeable gains using the TB-model
instead of its competitor, as measured by the relative RMSFE in Table 2 (the ratio
between TB-model’s and benchmark’s RMSFE). In general, TB-model tends to lower the
RMSFE during the most turbulent period in the sample, in particular for households’
consumption.
The most interesting results derive from the density forecast assessment, based on the
likelihood ratio test by Amisano and Giacomini (2007) (see Table 3). TB-model definitely
22Figure 5: Nowcasts of the quarterly growth of GDP and its components (% changes)
(a) TB-model (GDP) (b) Benchmark (GDP)
(c) TB-model (VAS) (d) Benchmark (VAS)
(e) TB-model (GFI) (f) Benchmark (GFI)
(g) TB-model (HHC) (h) Benchmark (HHC)
outperforms the benchmark, in particular during the sovereign-debt crisis, when the higher
volatility challenges the forecasting heavily. Our TESI and TEPU indices squeeze the
uncertainty around nowcasts and forecasts of the GFI evolution, both during crisis and
in normal times.
BMA simulations provide the posterior inclusion probabilities as a measure of the
23Table 3: Average log score
2011.1 - 2014.12 2015.1 - 2019.12 2011.1 - 2019.12
n f n f n f
GDP 9.1 8.6 -15.6 -22.4 6.1 6.6
VAS 5.3 6.6 -7.1 -10.3 3.7 6.4
GFI 3.6 23.7 6.9 10.5 4.6 24.5
HHC 14.6 12.2 -9.4 -11.8 11.4 11.8
relative importance of each regressor in explaining the variance of the dependent variable.
By exploiting the pseudo real-time iterations, we can evaluate how PIPs evolve over time.
The results, presented in Figure 6, refers to the nowcasting; TESI is an outstanding
competitor of its popular counterparts produced by Markit (PMI) and by Istat (IESI).
Our TEPU is as informative as the standard deviation of investors’ expected earnings,
which is a strong predictor for the short-term evolution of the Italian economic activity.
TESI is picked more frequently than IESI for nowcasting GDP’s quarterly growth. The
index referred to the topic ”services activity” outperforms both the equivalent PMI and
the Istat confidence throughout the sample and this result proves robust with respect to
the target variable. The TESI for services is an important regressor per se: it is selected
up to 80% times for nowcasting GDP after the trough recorded in the sovereign-debt
crisis. Further the PIPs of the TESI for manufacturing is comparable to those of PMI
and Istat surveys indices. In the HHC model, TESI markedly overshadows the consumers’
confidence index by Istat in the aftermath of the crisis and in the last two years, when
it is persistently selected for nowcasting. Our EPU index for services is selected more
frequently than the investors’ expected earnings in both VAS and GFI models; for the
latter, the PIP of the uncertainty measure extracted from the newspapers reaches almost
50% during the recovery phase, notwithstanding its high variability.
In order to measure the actual contribution of our sentiment and TEPU indices in
the forecasting regressions, we focus on the coefficients. Figures from 7 to 10 show the
results for the nowcasting exercise; the sentiment and TEPU indices extracted from the
newspapers weigh more than many competitors such as official confidence indexes and
PMIs. Text-based indices’ coefficients display the expected sign and are larger in mag-
nitude contrary to those attached to standard indicators, implying that they capture a
reliable signal. TESI for manufacturing outperforms Istat’s counterparts for manufactur-
ing, services and consumers and it is outstanding even in comparison with the industrial
production index. PMIs are forced on the wrong side: their contribution is shrunk toward
24Figure 6: Posterior inclusion probabilities 25
zero and the sign of the betas is negative almost throughout the sample. TEPU gives a
negative contribution as expected and its size is appreciable, particularly during the most
turbulent period, unlike the investors’ expected earnings, which is significantly close to
zero in the same time interval and it becomes positive after 2015.

       Figure 7: Regression coefficients and 25th-75th percentiles for GDP model

    In the VAS model the coefficients associated to the Istat sentiment indices display
a better pattern than that one of TESI, while PMI-services performs poorly. TEPU
is again more suitable than investors’ expected earnings, showing the correct sign. As
for GFI, which is a volatile component of the GDP, TESI contributes more to explain
its variance during the most critical period; the investors’ expected earnings index has
a negative and sizable coefficient up to 2015, when its contribution fades while TEPU
plays a not negligible role during the whole sample. In HHC equation our sentiment
index specific for the labor topic has a significantly positive contribution throughout the
sample; moreover the coefficient of our TEPU is significantly negative during the first part
of the sample during the Sovereign Debt Crisis in 2011, when both new cars registrations
and the consumers’ sentiment index by Istat lost their informative power glaringly.

5.2    A text-based weekly economic tracker
Following Lewis et al. (2020) and Delle-Monache et al. (2020) we build a weekly indi-
cator of economic activity for Italy with two innovations: i) a different dataset, focused

                                            26
Figure 8: Regression coefficients and 25th-75th percentiles for VAS model
Figure 9: Regression coefficients and 25th-75th percentiles for GFI model
27Figure 10: Regression coefficients and 25th-75th percentiles for HHC model
mainly on sentiment and uncertainty indexes; ii) a slightly diverse modeling approach
that includes the Italian GDP y-o-y growth rate in the estimation of the weekly tracker.
Adding the weekly TESI and TEPU series to a set of standard macroeconomic variables
commonly used in nowcasting (see Table A.4 for the full list of variables), we obtain
large point-forecast gains in weekly nowcasts of the quarterly Italian GDP growth. These
improvements in forecast accuracy are large across the whole out-of-sample period (2009-
2019) and every sub-period, with a 0.88 relative RMSFE in both expanding and rolling
window for in-sample training, but are particularly strong (0.74 relative RMSFE with
expanding window, 0.65 with rolling window) during periods of negative growth (2009,
2011-2013).
We build two weekly datasets where monthly variables have been disaggregated at
weekly frequency via Chow-Lin methodology (Chow and Lin, 1971), using the higher fre-
quency indicators available. The first dataset (X Bench ), used to calculate the benchmark
weekly index , contains traditional data used in nowcasting such as electricity consump-
tion and PMIs; the second dataset (X T ext ) expands the first dataset to include sentiment
(TESI) and uncertainty indicators (TEPU) for Italy. We make an horse race between
Bench T ext
two weekly economic activity indexes, ZM A,t and ZM A,t , derived from the two datasets
as follows:
1. We extract for each dataset the first principal component;
282. We take a 13-periods (≈ one quarter) moving average of the first principal compo-
nent.
Bench T ext
Since ZMA,t and ZMA,t are standardized principal components, we scale them to the
quarterly year-on-year GDP growth rate, ∆Yyoy,t , via the following regression:
i
∆Yyoy,t = αti + βti ZMA,t + εt t = 1, . . . , T and i = Bench, T ext (6)
Using the estimated coefficients in (6) we compute the value of the two weekly GDP
trackers at week t, Wti for i = Bench, T ext, as:
Wti = α
bti + βbti ZMA,t
i
t = 1, . . . , T and i = Bench, T ext
For training the model we use only available data for both the GDP and the principal
component up to week t and we compute the corresponding nowcast error as:
errorti = ∆Yyoy,t − Wti .
We train our model using weekly data from January 2001 to December 2010; the out-
of-sample goes from January 2011 till December 2019. Forecasting accuracy measures
are computed on out of sample data using both an expanding and a rolling (335 weeks)
window.
Table 4: Relative RMSFE of Weekly GDP trackers
Expanding Rolling (335 weeks)
All sample 0.85 0.83
Negative GDP 0.88 0.96
Positive GDP 0.82 0.75
Table 4 shows the relative RMSFE as the ratio between the two weekly activity indexes
taking the one computed with traditional data (WtBench ) as the benchmark. The one that
includes TESI and TEPU series (WtT ext ), displays a better performance in nowcasting the
year-on-year GDP growth since the relative RMSFE is smaller than 1. For the rolling
sample, we run a Diebold-Mariano test 24 and find that the gains are significant at the
5% level.
Figure 11a shows the point forecast gains documented in table 4 for the rolling case
over the whole out of sample horizon. Similar results are obtained when an expanding
scheme is implemented (Figure A.15a).
24
The DM test is not consistent for nested models if the sample is expanding.
29You can also read