Lawrence Berkeley National Laboratory - Recent Work - eScholarship.org
←
→
Page content transcription
If your browser does not render page correctly, please read the page content below

Lawrence Berkeley National Laboratory
Recent Work

Title
Italian prototype building models for urban scale building performance simulation

Permalink
https://escholarship.org/uc/item/8q57r16d

Authors
Carnieletto, L
Ferrando, M
Teso, L
et al.

Publication Date
2021-04-01

DOI
10.1016/j.buildenv.2021.107590

Peer reviewed

 eScholarship.org                                 Powered by the California Digital Library
                                                                  University of California
DOI: 10.1016/j.buildenv.2021.107590

Italian Prototype Building Models for
Urban Scale Building Performance
Simulation
Laura Carnieletto1, Martina Ferrando2,3, Lorenzo Teso4,5,
Kaiyu Sun3, Wanni Zhang3, Francesco Causone2, Piercarlo
Romagnoni5, Angelo Zarrella1, Tianzhen Hong3
1Department   of Industrial Engineering, Università di Padova,
Padova, Italy
2Department of Energy, Politecnico di Milano, via

Lambruschini 4, 20156 Milan, Italy
3Building Technology and Urban Systems Division,

Lawrence Berkeley National Laboratory, Berkeley,
California, United States
4Faculty of Science and Technology, Libera Università di

Bolzano, Bozen, Italy
5Department of Architecture and Arts, Università Iuav di

Venezia, Venice, Italy

Energy Technologies Area
April 2021
Disclaimer:

This document was prepared as an account of work sponsored by the United States Government. While this
document is believed to contain correct information, neither the United States Government nor any agency
thereof, nor the Regents of the University of California, nor any of their employees, makes any warranty,
express or implied, or assumes any legal responsibility for the accuracy, completeness, or usefulness of any
information, apparatus, product, or process disclosed, or represents that its use would not infringe privately
owned rights. Reference herein to any specific commercial product, process, or service by its trade name,
trademark, manufacturer, or otherwise, does not necessarily constitute or imply its endorsement,
recommendation, or favoring by the United States Government or any agency thereof, or the Regents of the
University of California. The views and opinions of authors expressed herein do not necessarily state or
reflect those of the United States Government or any agency thereof or the Regents of the University of
California.
Italian Prototype Building Models for Urban Scale Building Performance
                                                       Simulation
   Laura Carnieletto1,*, Martina Ferrando2,3, Lorenzo Teso4,5, Kaiyu Sun3, Wanni Zhang3, Francesco Causone2,
Piercarlo Romagnoni5, Angelo Zarrella1, Tianzhen Hong3
                             1
                               Department of Industrial Engineering, Università di Padova, Padova, Italy
                      2
                       Department of Energy, Politecnico di Milano, via Lambruschini 4, 20156 Milan, Italy
  3
    Building Technology and Urban Systems Division, Lawrence Berkeley National Laboratory, Berkeley, California, United States
                          4
                            Faculty of Science and Technology, Libera Università di Bolzano, Bozen, Italy
                          5
                            Department of Architecture and Arts, Università Iuav di Venezia, Venice, Italy

                          *Corresponding author: laura.carnieletto@unipd.it, phone: +39 049 827 6895

Abstract: Urban building energy modeling (UBEM) seeks to evaluate strategies to optimize building energy use at urban
scale to support a city’s building energy goals. Prototype building models are usually developed to represent typical urban
building characteristics of a specific use type, construction year, and climate zone, as detailed characteristics of individual
buildings at urban scale are difficult to obtain. This study investigated the Italian building stock, developing 46 building
prototypes, based on construction year, for residential and office buildings. The study included 16 single-family buildings,
16 multi-family buildings, and 14 office buildings. Building envelope properties and heating, ventilation, and air
conditioning system characteristics were defined according to existing building energy codes and standards for climatic
zone E, which covers about half the Italian municipalities. Novel contributions of this study include (1) detailed
specifications of prototype building energy models for Italian residential and office buildings that can be adopted by
UBEM tools, and (2) a dataset in GeoJSON format of Italian urban buildings compiled from diverse data sources and
national standards. The developed prototype building specifications, the building dataset, and the workflow can be applied
to create other building prototypes and to support Italian national building energy efficiency and environmental goals.

Keywords: Urban Building Energy Model (UBEM); Building Prototypes; Building Typology; Residential Sector;
Building Stock Modelling; Italy

1. Introduction
The human population in cities is constantly growing, together with urban energy usage and greenhouse gas emissions
[1]. This poses great challenges for decision-makers (e.g., policymakers, distribution and transmission system operators,
district heating and cooling managers, urban designers, and researchers) who aim to decrease energy consumption while
improving living conditions in cities [2]. However, the lack of information about the energy use and energy savings
potential of building stocks in cities is widespread [3]. One option for obtaining this information is to collect high
granularity measured data through monitoring campaigns, but these methods are expensive and highly time-consuming,
thus (yet) unsuitable [4]. In this context, the need to model all or part of a city’s building stock and to simulate various
energy scenarios has grown. Thus, different urban building energy modeling (UBEM) tools have been developed. UBEM
differs from building energy modeling (BEM) of individual buildings, achieved through traditional building performance
simulation (BPS) software, mainly in the size of the stock modeled and usually on the descriptive data availability. BEM
is primarily focused on single buildings or small blocks, usually with detailed information of individual buildings (i.e.,
detailed description of layers of the envelope constructions [5]; geometry, heating, ventilation and air conditioning
(HVAC) systems; occupants’ behavior [6]), including highly detailed analyses [7]. Conversely, UBEM models at least a
large block (i.e., dozens of buildings) and up to all buildings in a city (ranging from tens of thousands to millions of
buildings). When dealing with such a large number of buildings, dataset development and computational efforts can be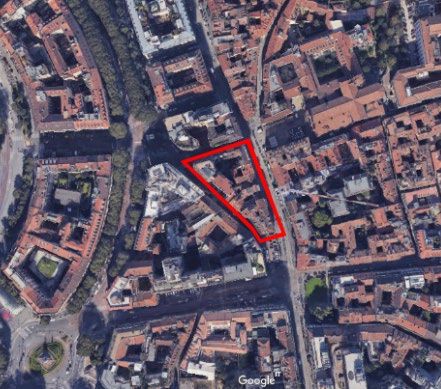
challenging, and thus, a few approaches emerged to better describe the buildings to ensure affordable labor and
computational efforts [8].

UBEM is typically grouped into top-down and bottom-up models [9]. Top-down models link the energy use of the
building stock to socioeconometric, technical, or physical drivers. Conversely, bottom-up models compute single building
energy consumptions and eventually combine the results at different scales. Specifically, the energy calculation method
can be statistical or physics-based. These physics-based models are derived by BEM and exploit single time-step
calculations, considering the energy balance of buildings [10]. These models simulate in detail the building and locate it
in the urban environment, trying to include physics interactions among buildings, between buildings and microclimate or
other entities (e.g., water bodies, trees, streets), and within time [11]. The bottom-up physics-based models are the ones
that are gaining momentum in the last years. This is mainly due to the increase of the computational capacity of computers
and to the need to design urban energy systems and to plan sustainable urban development. In fact, among the main
strengths of these models is the ability to predict future scenarios and achieve a high spatial and temporal detail of the
results [12]. For example, lumped-capacitance models can perform district simulations several times to evaluate the
impact of energy efficiency measures, requiring low computational resources [13]. However, the amount of data required
to model the buildings is not lower than it is when conducting BEM. Therefore, to manage time and computation efforts
while reaching the desired output, both in terms of spatial and temporal resolution, building modeling becomes a challenge
that must be addressed before running any simulation, as described in the following sections.

    1.1.The building stock modeling challenge
The modeling of building stocks is composed of two main steps: geometry settings and characterization of this geometry
with the necessary thermophysical properties [14]. Thus, to achieve the proper level of description of large districts or
cities, detailed building prototypes are necessary to represent correctly the urban environment according to the typical
technologies and constructions of a nation. Usually, details of large building stocks are collected through census data
and/or surveys [15], because large datasets are not always available. Both types of data are usually anonymous and not
linked to a specific geometry. Single-building billing or metering data and energy certificates may also be available, but
sometimes just for a relatively small part of the input needed when using UBEM tools [15]. For building modeling at a
large scale, a combination of different data collected from different sources must be exploited [16]. This raises issues
related to the integration of data with different terminology, and/or time and spatial resolution.

In BEM, the geometry is usually well known, and its description can also reach the detail level of single rooms and
furniture. Conversely, in UBEM, this level of detail is not achievable for large building stocks; therefore, buildings are
usually simplified to simple boxes as extrusion of their footprint along their heights. This is due to the lack of detailed
data for all buildings in the stock, but also to the necessity of decreasing the computational effort during the simulation
process, maintaining a realistic geometrical description [17]. To simplify this step, UBEM tools usually allow integration
with geographic information system (GIS) technologies and formats. Particularly, the CityGML format is under
development to become a standardized method to describe and collect urban data [18]. It is a GIS format that allows the
representation of the geometry at a different level of detail and includes some elements of the surroundings (e.g., terrain,
vegetation, water bodies, transportations). However, these data formats are not always available, and this lack strongly
hinders the usage of UBEM tools.

The second step involves associating the necessary characteristics with the geometry. The specific information related to
the building fabric, systems, and usage schedules must be set for all the buildings included in the model. Usually, to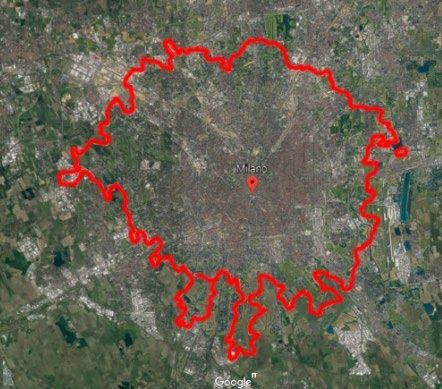
simplify this step, modelers use archetypes - ideal buildings that include the whole set of characteristics needed to run an
energy simulation. These characteristics are usually average values, proven to be representative of the specific building
stock or a part of it. The association of the archetype to a specific building is usually done by exploiting variables such as
main building function, distributive parameters defining a building typology (e.g., tower, detached), construction year,
and others. A specific extension of the CityGML format, called Energy ADE [19], attaches to the building geometry a
basic characterization, which greatly helps the modelers. Especially, for bottom-up physics-based UBEM tools, some
characteristics of the archetype (e.g., window to wall ratio, floor-ceiling height) are left to be parametric values that are
useful to customize the final geometrical characterization of every single building in the model.
To better address the topic, a literature review of papers regarding archetypes was conducted in June 2020. Particularly,
Boolean operators (i.e., AND, OR, and NOT) and exclusion criteria were utilized to adjust the research query executed
in Scopus. A total number of 262 publications resulted from the search, and a second screening on titles and abstracts
helped to exclude other irrelevant publications, bringing the final set to 150 publications. Within this group,
34 publications with an available full text were selected. Only publications with the specific aim of presenting new
archetypes or methodologies for their generation were included. The result of the review is presented in Table 1. For each
publication, the main characteristics are highlighted (i.e., location and size of the case study, included building type that
regards typology and/or function, generation method followed, final number of archetypes, type of archetype, and
declared novelty).
Table 1: Main references available in the literature regarding archetypes and/or their generation methodology
Location of the Size of the case Building Number of Type of Verification
Authors Method3 Novelty
case study study1 type2 archetypes archetype method
Use of large
Ahern and Sg + An + Goodness Of Fit on
Ireland 406,918 (S) RHS 35 Full empirical
Norton, 2020 [20] Ca + Ag real annual data
databases
Percentage
Focus on error on Annual
De Jaeger et al.,
Genk, Belgium 847 (N) SFD Ag Inferred Full occupant Energy Use
2020 [21]
behavior Intensity from
statistical databases
NRSME on specific
KPI (e.g., peak
De Jaeger et al.,
Belgium 1,230 (S) SFD Cu Inferred Full Methodology demand), and on
2020 [22]
Annual Energy Use
Intensity
chi-square ( χ2 ) test
Molina et al.,
Chile 6.5 million (S) RHS Cu About 500 Full Location of statistical
2020 [23]
significance
Beck et al., 2020 Nottingham, United Focus on Application on a
D SFD Ca 5 Geometry
[24] Kingdom Geometry similar case study
Comparison against
Ali et al., 2019 Multi-scale annual site energy
Ireland S, R, U, D RHS Sg Various Full
[25] methodology from validated
simulation results
Percentage
difference and
Focus on
Buttitta et al., deviation against
United Kingdom S RHS Sg Inferred Full occupant
2019 [26] Annual metered
behavior
Energy Use
Intensity
Comparison against
annual energy
Pasichnyi et al., Multi-goal
Stockholm, Sweden U WBS V Various Full declarations from
2019 [27] methodology
the city of
Stockholm
Comparison with
records of 2014-17
Yi and Peng, 2019 Focus on
Seoul, South Korea 51,351 (D) RHS St Inferred Full period on the
[28] cooling loads
Cooling Degree
Days
Comparison with
other studies on
Streicher et al.,
Switzerland 25,000 (S) RHS St 54 Full Whole nation Swiss registered and
2019 [29]
simulated Energy
Use Intensity
Calibration of
Wang et al., 2018 Data-driven
Denmark S AB Cu Inferred Full models based on
[30] methodology
TABULA
Results checked
Lavagna et al., against average
Europe S RHS St 24 Full Whole EU
2018 [31] previous LCA
assessments
The methodology
St Methodology
Kristensen et al., includes a Bayesian
Denmark 150 (S) RHS (Bayesian Inferred Full coupled with
2018 [32] calibration process +
inference) calibration
use in a case study
Calibrated and
validated on
Nägeli et al., 2018
Switzerland S RHS Ag Inferred Full Methodology aggregate Annual
[33]
Energy Use
Intensity
The method is tested
through a case study
Heating/ comparing the
Li et al., 2018 Yuzhong District in
D RHS Cu + DI Inferred Cooling Methodology archetypes’ Energy
[34] Chongqing, China
energy Use Intensity against
detailed dynamic
simulations.
Cross-validation
within the
Newcastle upon methodology and
Urquizo et al., Multi-scale
Tyne, United D, N, B RHS Cu Various Various final comparison
2018 [35] methodology
Kingdom with Annual
metered Energy Use
Intensity
The methodology
includes a Bayesian
Comparison of calibration +
Cerezo et al.,
Kuwait City, Kuwait 336 (U) RHS V Various Full different comparison with
2017 [36]
methodologies metered Annual
Energy Use
Intensity
Information
Tornay et al., Urban canopy
France S WBS DI About 12 Full compared with other
2017 [37] model
statistical databases
Pittam et al., 2017
Cork, Ireland 10,318 (U) PHS DI 18 Full Case study n.d.
[38]
Information
Variation of the
Monteiro et al., compared with
Lisbon, Portugal N RHS Various Various Full number of
2017 [39] national statistical
archetypes
databases
Calibrated and
Inclusion
validated with
unknown
Sokol et al., 2017 Cambridge, annual and monthly
2,263 (U) RHS St Inferred Full parameters as
[40] Massachusetts metered data of
probability
Energy Use
distributions
Intensity
Annual Energy Use
Loga et al., 2016 20 European Geographical Intensity compared
S RHS DI + EA Various Full
[41] Countries extension with national/local
statistical databases
City centers of
Berg et al., 2016
Palermo, Italy and D WBS St n.d. Full Case study n.d.
[42]
Visby, Sweden
Calibrated and
Comparison of validated with
Cerezo et al.,
Kuwait City, Kuwait U RHS V Various Full different annual metered data
2015 [43]
methodologies of Energy Use
Intensity
Annual Energy Use
Ballarini et al., Middle Climatic Location and Intensity compared
S RHS DI + EA 32 Full
2014 [44] Zone of Italy extension with local statistical
databases
Pittam et al., 2014 Annual Energy Use
Cork, Ireland 10,449 (U) PHS DI 20 Full Case study
[45] Intensity compared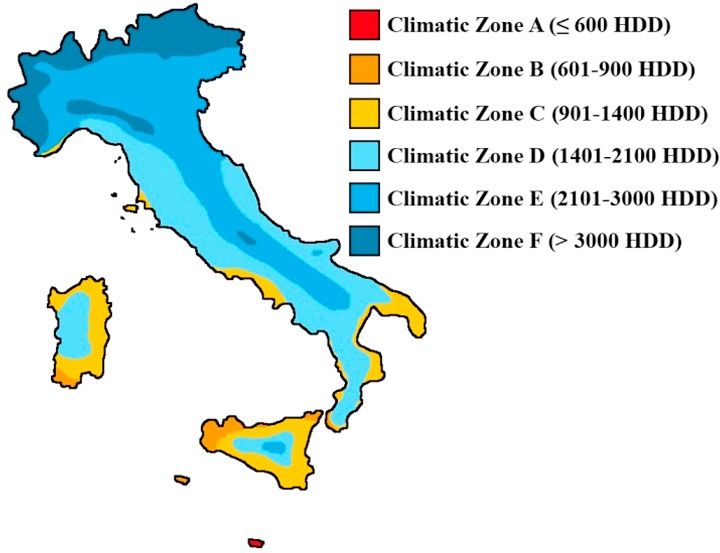
with local statistical
                                                                                                                                               databases
                                                                                               F: 99; G:                                       Annual Energy Use
                      France, Germany,                           G: RHS;
 Mata et al., 2014                                                                             122; S:                      Extension and      Intensity compared
                      Spain and the          S                   others:        Sg                             Full
 [15]                                                                                          120; UK:                     NR                 with local statistical
                      United Kingdom                             RHS + NR
                                                                                               252                                             databases
                                                                                                                                               Simulated energy
 Kragh and
                                                                                                                            Extension and      results compared
 Wittchen, 2014       Denmark                1,526,284 (S)       RHS            Cu             About 27        Full
                                                                                                                            methodology        with local national
 [46]
                                                                                                                                               databases
                                                                                                                                               Annual Energy Use
 Vimmr et al.,                                                                                                              Extension and      Intensity compared
                      Chez Republic          S                   RHS            Cu             n.d.            Full
 2013 [47]                                                                                                                  methodology        with local national
                                                                                                                                               databases
 Famuyibo et al.,
                      Ireland                S                   RHS            St + Cu        13              Full         Methodology        n.d.
 2012 [48]
                                                                                                                                               Annual Energy Use
 Ballarini et al.,                                                                                                          Extension and      Intensity compared
                      Piedmont, Italy        R                   RHS            Cu             n.d.            Full
 2011 [49]                                                                                                                  methodology        with local national
                                                                                                                                               databases
 Dascalak et al.,                                                RHS (but                                                   Extension and      Application on a
                      Greece                 S                                  Cu             24              Full
 2011 [50]                                                       extendable)                                                methodology        case study
                                                                                                                                               Comparison based
                                                                                                                            Focus on office
 Fabrizio et al.,                                                                                                                              on various research
                      Italy                  S                   OF             BM             1               Full         and
 2011 [51]                                                                                                                                     over Italian Office
                                                                                                                            methodology
                                                                                                                                               building stock
 Tooke et al., 2011   Neighborhood in
                                              264 (N)            SFD           Cu             3              Geometry       Based on Lidar      n.d.
 [52]                 Vancouver, Canada
                       1
                         S = State/National, R = Regional/County/Zone, U = Urban, D = District, N = Neighborhood, C = Community/Block
                       2
                         RHS = Residential Housing Stock, PHS = Public Housing Stock, SFD = Single-family dwellings, AB = Apartments buildings, NR = Non-
                       residential, OF = Offices, WBS = Whole building stock
                       3
                         Sg = Segmentation, Ca = Classification, Ag = Aggregation, Cu = Clustering, V = Various, St = Statistics, DI = Data Integration, EA = Expert
                       Assumptions, BM = Benchmarking

Size refers to the dimension of the area or the number of buildings that are analyzed. However, the definition of the terms
used in literature is not always explicitly defined. Thus, a differentiation to refer to the size of a case study is proposed in
this study. The basic case is an entire state or nation (Figure 1A) (e.g., Italy). Then, each state can be divided into regions
or zones (Figure 1B), (e.g., Lombardy). The case study can focus on a specific urban area or city (Figure 1C) (e.g., Milan)
or a specific district (Figure 1D) (e.g., the central district in Milan, called Municipio 1), or a neighborhood (Figure 1E)
(e.g., the Brera neighborhood in Milan). At last, when buildings are aggregated together and divided from other buildings
by streets, they can be defined as a block (Figure 1F). The six different sizes emerged also in the literature review. In the
publications, 50% dealt with archetypes developed for an entire state or nation, 18% with an urban area or a city, 16%
with a district, 8% with a neighborhood, 5% with regional/zones, and 3% with block case studies.

                              A                                         B                                             C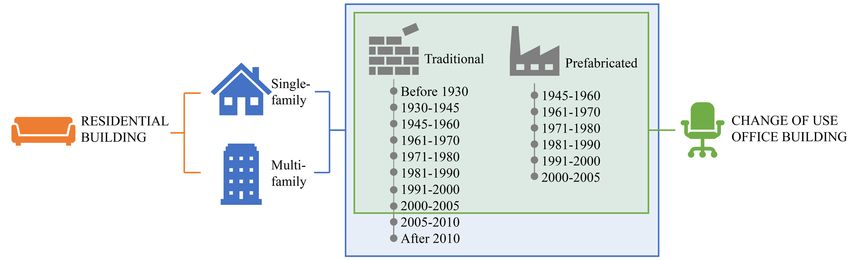
D                                          E                                        F
                Figure 1: Case study size: (A) state, (B) region, (C) city, (D) district, (E) neighborhood, (F) block.

Regarding building use typology, only 9% of the studies modeled the entire building stock. The majority of the case
studies (65%) focused on the residential building stock in general, 12% on single-family dwellings, 6% on apartment
buildings, and 6% of the publications dealt with public housing stock. Therefore, 94% of the publications focused on
residential buildings. Only 3% of the studies addressed office buildings, and 3% addressed non-residential buildings in
general.

As summarized in Figure 2, clustering was the primary method used to generate archetypes (30% of the publications),
but also more general terms, such as segmentation (8%), classification (5%), and benchmarking (3%) were used. Of the
studies, 8% used aggregation methods, and 16% were based on various types of statistics. Finally, 16% of the studies
used data integration as one of the fundamental steps of the archetype generation, whereas 5% were based on some
assumptions on experts’ knowledge. 8% of the publications used a mix of more than one method. Depending on the used
methodology, the number of archetypes can be declared to be fixed and derived by the analysis of the presented data, or
it can be inferred by the methodology itself when applied to different case studies. The term “various,” reported in Table
1, means that different case studies were analyzed in the same paper, bringing to different numbers of final archetypes.

                        Figure 2 Summary of the methods to defined archetypes from the literature review

The majority of the studies focus on Europe, due to the Typology Approach for Building Stock Energy Assessment
(TABULA) project and its follow-up Energy Performance Indicator Tracking Schemes for the Continuous Optimisation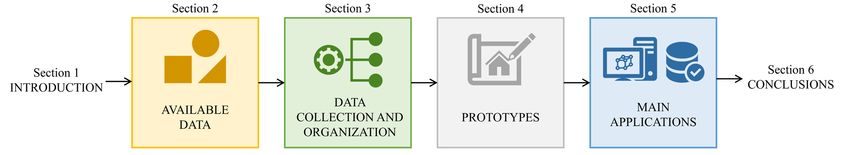
of Refurbishment Processes in European Housing Stocks (EPISCOPE) [41,44,46,47,49,50]. These projects sought to
establish a common classification approach for residential buildings at the national level for 21 European countries. They
also make nations aware of the importance of archetypes models. As a matter of fact, archetypes are fundamental, not
only so that UBEM can provide an overview of the building stock, but also for their explanatory potential, to provide a
taxonomy of the stock. Moreover, they can be used directly to estimate different quantities (e.g., energy use, materials),
to simplify the complexity of the building stock through different levels of detail, and to help frame and benchmark
potentials [27]. Generally, and especially due to the TABULA/EPISCOPE projects, numerous archetypes are available
for the Italian context (e.g., [31,41,47,51]). The developed archetypes are completed with simple models that are run to
quantify the basic energy use of the represented buildings. However, this approach is not suitable for the use of bottom-
up physics-based tools such as the City Building Energy Saver (CityBES). These tools require a certain amount of
flexibility for application of the thermophysical characteristics to the specific geometry of each building in the model,
based on its footprint and height. For this reason, archetypes flexible enough to be suitable for this new UBEM approach
are needed, and these are usually called prototypes. Even though the terms archetype and prototype are often used
interchangeably, here a differentiation is proposed. In this paper, an archetype is intended as an ideal example with an
unchanging form that can never be modified, while a prototype is the first version of something that later updates can
modify or improve [49] (i.e., a building energy model in this case) and is characterized by a parametric geometry (e.g.,
based on fixed parameters like window-to-wall ratio or percentage of the heated area).

Lastly, the methods used to verify the resulting archetypes are highlighted. In most cases, the energy results of the
archetypes are directly compared with average annual energy data stored at local or national levels or metered for a
specific case study. In some other cases, in the methodology itself, especially when it is based on clustering, a calibration
step is included. For a few cases, a validation step is not mentioned because the archetypes are directly based on statistical
analysis on the local or national databases. However, it must keep in mind, that for this new approach to UBEM, the
validation and calibration processes are still considered a challenge [11], due to lack of available data, especially at high
granularity, the limitations due to computation effort to run numerous simulations.

    1.2. Aims and outline
This study arose from the intention to use one of the most advanced bottom-up physics-based UBEM tools for case studies
on retrofitting the building stock in Northern Italy, to reduce energy use and carbon emissions in buildings to support
local government and Italian national energy and environmental goals. Upon reviewing the available dataset and
archetypes developed for the Italian context, it became clear that even if advanced and detailed projects like TABULA
and EPISCOPE existed, prototypes suitable for this kind of large-scale analysis were missing. The United States
Department of Energy (DOE) developed some guidelines for building models of the national building stock [53],
explaining the workflow process and the reference input that was followed to characterize the American building stock.
The same general idea was followed in this research, investigating two main urban building topologies (i.e., residential
and office buildings) based on which prototypical energy models were developed with envelope and energy systems
characterization.

This paper aims to characterize prototype buildings for Italian Climatic Zone E, which is suited for bottom-up physics-
based UBEM tools that require geometry inputs given as a semantic geo-referenced dataset (e.g., CityGML or CityJSON).
In particular, residential buildings (i.e., single-family dwellings, apartment buildings, public housing stock) and office
buildings are included. This approach allows the application of an automated workflow for the simulation of larger city
areas, while the existing archetypes representative of the Italian building stock are based on a fixed and defined geometry,
thus hardly usable to investigate districts of real buildings with UBEM tools. The results from this study are: (i) a
methodology that can be followed to expand and improve the prototype set for other climatic zones in Italy and European
countries, (ii) the option to customize the presented characteristics of prototypes for other UBEM tools, in particular
considering that the geometry is not fixed but depends on the input geometry, and (iii) an overview of the current urban
data availability in the Italian context and the limitations and future perspectives to boost the usage and usability of UBEM
tools.
This study is intended as the first phase effort of a larger project that aims to sensitize municipalities and researchers in a
collection of new data and integration of existing datasets. Potentially, accurate prototype building models able to describe
the whole Italian building stock, including all the building functions and climatic zones, could be developed through the
coordinated actions of a larger number of stakeholders. Since the comparison with measured data is not easy to carry out
when entire districts are considered due to both the lack of data and complexity of the comparison on aggregated values,
the prototypes will be shared to use them on a large-scale in order to extend the network on this.
The remaining parts of the paper are organized as shown in Figure 3: Section 2 presents the current Italian data and
archetype availability, along with their limitations and differences from prototypes; Sections 3 explains the process of
collection, selection, and organization of data that led to the definition of prototypes described in Section 4; Section 5
describes the main applications of these resulting prototypes, and Section 6 concludes the paper with some final
considerations and future outlooks.
Figure 3: Schematic of the paper workflow
2. Review of existing Italian building data and archetypes
Buildings datasets exploitable for bottom-up physics-based UBEM need to include two groups of integrated information:
geometrical data and thermophysical properties. Some particular features (e.g., window-to-wall ratio, thermal zoning,
ceiling height, sill height) guarantee a certain level of flexibility to allow a proper adaptation of the characteristics to the
geometry, enabling energy models with a relatively high level of detail for every building.
The first group of information (i.e., geometrical) is usually easy to gather thanks to the use of GIS software and map
provider services. This is the main difference from using existing archetypes that usually have a fixed geometry; results
may be influenced when comparing buildings in urban city centers with buildings that have layouts different than a
rectangular geometry. The ability to use real geometry as an input allows archetypical models to be applied to real districts
and cities, therefore developing a parametric model closer to reality. For the second set of information (envelope
properties, internal loads, HVAC systems and related inputs), the data collection process is more challenging and time-
consuming, especially when dealing with large datasets. The difficulties are related to the data collection, which is not
done in an integrated and cohesive way. The absence of datasets that allow the characterization of large stocks of buildings
(including both geometrical and thermophysical properties) and the lack of databases where data are integrated andharmonized have prohibited all but a few Italian city neighborhoods from being studied utilizing bottom-up physics-based
UBEM tools. These tools, widely used in other countries interested in reducing energy use and carbon dioxide (CO2)
emissions of buildings, have the goal of obtaining an integrated and optimized design of retrofit interventions.
Unfortunately, in the present state, only a few examples address the Italian context [16,44,54].
Currently, some Italian standards (summarized in Table 2) and the TABULA project [55] are the only databases available
to characterize envelopes and systems of building stocks. However, the standards, although they collect a large amount
of information, merely describe the geometrical and characteristics of the Italian building stock in a separate, non-
integrated way. TABULA and EPISCOPE projects tried to fill that gap, but the developed energy models are not suitable
for bottom-up physics-based UBEM tools like CityBES because they need single customized energy models for each
building.
Table 2: Collection of the Italian standards describing the building stock
Title Year Type Main goal Useful collected data
First standard on building energy Criteria for building insulation and
Law 373 1976 National
efficiency heating systems
Energy efficiency in buildings and Envelope insulation and efficiency of
Law 10 1991 National
renewable energy sources the generation system
Degree days of the climatic zone
DPR 412/93 1993 National Define climatic condition
considered and heating setpoint
Air conditioning systems for thermal
UNI 10339 1995 National Ventilation rate for office buildings
comfort in buildings
Lighting reference values for office
EN 12464 2004 European Lighting on working spaces
buildings
Legislative Italian Transposition of the Directive Thermal transmittance of buildings and
2005 National
Decree 192 2002/91/EC HVAC systems efficiency
Input parameters for design and
EN 15251 2007 European assessment of energy performance of Ventilation rate for office buildings
buildings
Masonry building walls and systems
UNI/TS 11300 General guidelines for building energy
2008 National spread based on regions and
performance
construction years
Transposition of Directive 2010/31/ EU Criteria and methodologies to improve
Law 90 2013 National of 19 May 2010, on energy buildings’ energy performance and to
performance in buildings integrate renewable energy sources
Main building constructions (walls,
UNI/TR 11552 Extension of Appendix A of UNI/TS
2014 National roofs, floors) spread based on regions
11300
and construction years
Energy performance of buildings —
Schedule and condition of building,
ISO 18523 - 1 2016 International Reference schedules for internal loads
zone, and space usage for energy
calculation
Energy performance of buildings —
EN 15193 2017 European Reference lighting loads
Energy requirements for lighting
Energy performance of buildings —
Input parameters for design and
EN 16798 2019 European Definition of internal loads
assessment of energy performance of
buildings
The following section presents the main Italian standards and the TABULA project in more detail.2.1. Italian Standards
The main information required for a precise definition of Italian prototype buildings that will be presented in detail
in the following sections are summarized in Table 3.
Table 3: Summary of the main sources of information for the development of Italian prototypes
Retrieved Geographical Integration and
Coverage Level of detail
Information Level Consistency
Data scattered throughout
the standard and not Geographical
uniformly presented. coverage focuses
Masonry building walls Lack of
Lack in consistently mostly on northern
UNI/TS and systems spread based National; description for
presenting the Italy. Time
11300 on regions and Regional new surfacing
geographical and coverage only
construction years. technologies.
historical distribution of partially represents
the structures in the reality.
country.
Geographical
Main building Lack of detailed data for coverage focuses Discrepancies in
constructions (walls, some geographical areas. mostly on northern the degree of
UNI/TR National;
roofs, floors) spread Incomplete data on the Italy. Time detail for
11552 Regional
based on regions and historical succession of coverage only envelope
construction years. the construction methods. partially represents elements.
reality.
database of the main
Focused specifically on
types of residential
residential buildings,
buildings for pre-defined Focus on the Lack of details
even though
geometries contains the building stock of a for buildings that
TABULA National representative of an entire
construction and single region of are not used as
region, simulated with
installation northern Italy. households.
climatic data of a single
characteristics of
city.
residential buildings.
Statistical data recovered
Data divided into various
from past censuses Geographical Lack of detailed
National; databases, at large scale
ISTAT regarding geometric and coverage at the data at lower-
Regional integration of data can be
thermophysical features national level. scale levels.
time-consuming.
of buildings.
Agenzia Data on energy Missing a platform where Specific data for
National; Data collected on
delle consumption of all data are collected and every
Municipal the whole country
Entrate buildings. harmonized. municipality.
Topographic database Data collected by the
with geometrical and municipality, but a Data are specific
Cadastral Coverage on a
geo-referenced Municipal platform with collected for every
Data national scale.
buildings’ and harmonized data is municipality.
characteristics. missing.
2.1.1. UNI/TS 11300
In 2002, the European Commission issued the Directive 2002/91/EC on the energy performance of buildings [56]. This
directive introduced general guidelines for various European countries for the adoption of a methodology of calculation
for building energy performance, the definition of minimum energy requirements, the inspection of heat generators and
systems, and the definition of energy classes for buildings. This directive was transposed into the Italian legislation after
the intervention of a technical committee and applied through the adoption of national Technical Standard UNI/TS 11300,
which was issued in 2008 [57] and modified in 2014.
The UNI/TS 11300 Technical Standard was created to define a unique calculation methodology for determining building
energy performance. It is divided into four parts. The first gives guidance for the determination of the building’s energy
requirements for summer and winter air conditioning. The second is more specific and focuses on primary energy
requirements and efficiencies for winter air conditioning and domestic hot water (DHW) production. The third partprovides information on determining the primary energy demand and efficiency for summer air conditioning, and the
fourth guides the use of renewable energy and other methods of energy generation for space heating and hot water
production [57]. In particular, the first and second parts of the standard provide useful information exploitable for the
definition of archetypes.
The first part, “Determination of the thermal energy needs of the building for summer and winter air conditioning, defines
the monthly methods for the calculation of thermal energy needs for heating and cooling. The technical specification is
addressed to all possible applications provided by UNI EN ISO 13790:2008 - design calculation, energy assessment of
buildings through the calculation in standard conditions, or in particular, climatic and operating conditions. To simplify
the methodology for the calculation of energy needs and consumption relating to existing buildings whose envelope’s
thermophysical characteristics are unknown, the standard provides appendixes containing details of the most widespread
opaque and transparent structures in Italy [58].
The standard’s first appendix shows the thermal transmittance of the opaque components of existing buildings. A table is
dedicated to each element of the envelope in which a transmittance value is assigned according to the thickness of the
element and the main construction technologies with which it is made. To complete this first appendix, a summary table
categorizes every possible component of the envelope, namely vertical opaque closures to the outside and the inside, flat
and pitched roof, the floor under any non-conditioned environment, and basement on cellar, pilotis, and ground. These
are categorized according to three conditions: climate zone (C or D, and E or F, according to Presidential Decree 412/1993
[59], which divides the peninsula into six climatic zones from “A” to “F” (Figure 4), based on heating degree days (HDD),
year of construction (from 1976 to 1985 or from 1986 to 1991), and an element’s thickness (variable from 0.20 to 0.40
m). Knowing these three conditions, it is possible to obtain the thermal transmittance value of a particular element built
in a given period in a given climate zone and having a given thickness [60].
Figure 4: Italian climatic zone distribution [59]
The standard’s second appendix is organized as an abacus of the wall structures used in Italy. The abacus aims to provide
information on the main masonry structures used in the building industry and their spread throughout the country. The
first half of the appendix is a list that concerns only the description of certain types of opaque vertical walls, describing
their composition in terms of materials and indicating for each material the density and conductivity. The second half
deals with the geographical spread of the elements described in the previous part. For some Italian regions, mainly in the
north, tables are proposed according to the time of construction, and the most widespread type of wall among thosedescribed above is suggested. A third column contains additional information on the type of structure that is suggested
for particular areas (e.g., historical centers) or particular building use (e.g., social housing) [60].
The second part, “Determination of primary energy needs and yields for the winter air conditioning and domestic hot
water production” defines the efficiency of heating and DHW production systems, and the overall primary energy needs
of such systems. In this case, there are no appendices from which it is possible to obtain detailed data, but a series of
tables containing pre-calculated values are provided. These tables present different data for each type of heat generator
and distribution system, which are characterized according to their insulation, which is derived from the installation date:
before 1961, between 1961 and 1976, between 1977 and 1993, and after 1993. Through this series of tables, it is also
possible to characterize the buildings for technological systems [61].
2.1.2. UNI/TR 11552
In 2014, Standard 11300 was updated in all its parts in the light of new regulations on the containment of energy use by
the European Commission [60–63]. This revision took place following the conclusion of the TABULA project, which
started in 2009 and concluded in 2012. For the project, fifteen European states worked on the creation of a database for
each country with residential reference buildings capable of representing the entire stock of that state [64,65], as further
discussed in Section 3.2. Following that project’s conclusion, and thanks to the new data and knowledge obtained, the
Italian Thermotechnical Committee (CTI) decided to extend the appendix (Appendix A) that in the UNI/TS 11300 of
2008 contained the abacus of opaque structures composing residential buildings, and make it an independent technical
report called Technical Report UNI/TR 11552.
The first half of the report presents the main construction types used in Italy in three parts. Each part describes a different
envelope element: perimeter walls in the first part, floors in the second, and roofs in the last part. Each of the three parts
reports the main technologies that are usually used in the construction of the elements of the envelope. For each
technology, there is a description of the layers for which the thermophysical characteristics are indicated. Thermal
transmittance and other characteristics are calculated for different combinations of layer thicknesses. The second half
shows the geographical spread of the structures described above. As for the Appendix of Standard 11300, tables are
proposed concerning some Italian regions, mainly northern ones, where the main construction techniques are suggested
according to the period of construction. The main novelty that can be found in this second version concerns a considerable
increase in the degree of detail as regards the data for the Piedmont region. This is because the work developed during
the TABULA project was based mainly on buildings built in that region [66].
2.1.3. Observations on Italian standards
The analysis of the standards for determining the thermal energy needs of the building, and the subsequent technical
standard containing the abacus of the structures, reported in the previous paragraphs, highlight some problems that must
be addressed.
Integration and consistency: UNI/TS 11300 is the first standard that provides data for the characterization of existing
buildings from a thermophysical point of view in case of impossibility to carry out more in-depth analysis. However,
these data are scattered in the first two parts of the standard and are not presented uniformly. Regarding the constructions,
only the vertical walls are included, and they are presented in the first half of Annex A in UNI/TS 11300 part 1. The data
concerning the geographical distribution of the constructions are covered in the second half of Annex A. Finally, the data
concerning heating and DHW systems are contained in UNI/TS 11300 part 2. This situation was not resolved by the
evolution of the legislation. With the revision of 2014, the part concerning the structures and their geographical location,
expanded and adapted according to the new data, became the Technical Standard UNI/TR 11552, while the dataconcerning building systems remained as it was in UNI/TS 11300 part 2, also revised in 2014. Thus, no integration
between the data is guaranteed, and they remain divided between various standards and their versions. Moreover, there is
a lack of a single integrated database that is easy to access and complete.
Level of detail: In the first version of Standard 11300, when the abacus of existing structures was drawn, the focus was
only on the vertical opaque elements. This lack is also addressed by the authors of the standard, who in the introductory
chapter emphasize how incomplete and constantly updated the list is. This update took place with the 2014 revision of
the standard. In the new version, this deficiency has been partly resolved. With the extension of the abacus, more elements
have been added to describe the main technologies that make up the building envelope, but the vertical opaque structures
still are treated in greater detail than the roofs and floors: for the perimeter walls, numerous examples deal with the
different types of construction, from the most traditional (such as stone walls or masonry) to the more modern ones (such
as prefabricated walls). This degree of detail is not reached by the other categories, which are treated in less detail. Only
a few examples are presented for horizontal structures that are defined as representative of more than one hundred years
of construction techniques. In this way, the typical variety of the different areas of Italy is reduced to a few examples that
only partially reflect reality.
Geographical coverage: When analyzing the part of the abacus of the structures that tries to define the geographical
spread of construction technologies, it is clear the attention is mainly focused on Northern Italy. In the first version of the
abacus contained in Appendix A of the UNI/TS 11300 standard, the northern regions considered were Liguria, Lombardy,
Veneto, and Emilia. The rest of the Italian peninsula was characterized by Tuscany, Abruzzo, and Campania. With the
revision in 2014, only one region was added—Piedmont—again, located in Northern Italy. This particular focus on
Northern Italy shows the lack of continuous geographical coverage. Large portions of the Italian territory with specific
climates and conditions are not included, making the abacus usable only in cases where the structures are located in the
indicated or neighboring areas, or where the climatic and context conditions of the areas not included are similar to those
that are included.
Time coverage: Regarding time coverage, the situation is also similar to the geographical spread. The tables that show
the coverage of the structures’ territory show periods during which certain construction technologies were in use. Except
for what is described for the Piedmont region, which presents a good level of detail, the time is usually divided into two
classes—from 1900 to 1950 and from 1950 onwards—with some exceptions in 1970. This time division only partially
represents reality. In particular, after 1950, the prefabrication of buildings and the introduction of energy-saving laws [67]
were brought to the development of new building techniques, creating greater variability that is not reflected in the
suggested time classes.
2.2. The TABULA project
Between 2006 and 2016, the Intelligent Energy Europe Program (IEE) launched three consecutive projects to make
retrofitting residential stock simpler and more efficient. The first DATAMINE project, which started in 2006 and ended
in 2008, had the task of improving knowledge about the energy performance of building stock through the use of energy
performance certificates (EPC) [68]. The data collected and analyzed represent the basis from which the TABULA project
started in 2009. The aim was to classify the building stock according to the energy properties of the buildings and to
define for each category representative archetypes of all the buildings that are part of it [64,69]. Starting from the results
obtained with this second project, between 2013 and 2016, the EPISCOPE project used the archetypes defined during
TABULA to monitor the renewal activities of the European building stock through the calculation of building renovationscenarios at different scaling levels. The results of the assumed scenarios and monitoring procedures aim to track progress
in terms of building energy performance and help stakeholders ensure adequate levels of refurbishment to achieve the
European targets for 2020, 2030, and 2050 [70–72].
The objective of TABULA, the second project started by IEE, was the creation of a database of the main types of
residential buildings in Europe for pre-defined geometries. The database, divided by member states, contains the
construction and installation characteristics of residential buildings in the 13 European states that participated in the
project. The stock of residential buildings that the project aims to study has been divided according to the size of the
buildings and the period in which they were built. The results obtained from this classification are presented, employing
tables in which the main data concerning the characteristics of the geometry, envelope, and the distribution systems for
domestic hot water, heat, and cooling, if present, are presented for each time class and building typology. These building
typologies have been used for the definition of energy consumption in the business as usual scenario and the definition
of two categories of retrofit interventions: light renovation and deep renovation. These renovation scenarios are designed
to support policymakers at various levels in the definition of energy improvement interventions in residential buildings
[73,74]. Italy also participated in this project, but given the difficulty in finding consistent data at the national level for
the characterization of the residential building stock, the analysis was carried out only for one Italian region where the
availability of information was adequate: Piedmont [44].
For the construction of the Italian building typology, the analysis presented started from the identification of 10 classes
that determine the period of construction of the building, defining dimensional, construction, and energy characteristics;
each one typical of that historical period. Each period of construction is characterized by buildings with different
dimensions that meet the different construction needs typical of that period. Four classes with specific extensions and
geometry have been identified: single-family house, terraced house, multi-family house, and apartment block. These two
groups of characteristics (i.e., construction year and building typology) contribute to creating the building typology matrix
[44]. The matrix is made up of cells of rows that determine the time classes and columns that define the geometry of the
building according to the four classes previously indicated. The buildings that are represented in the cells are defined as
model buildings, and these are assigned with geometric construction and system characteristics partly derived from
archetypes (i.e., buildings whose characteristics are defined following statistical analysis and partly derived from real
buildings, representative of that building category in that period when there is a lack of statistical data) [75]. The data
used for the description of buildings from the point of view of building systems are derived from the experience of the
study’s authors and the advice of experts in the field, as well as from the support of scientific literature. The technical
systems have been defined mainly through the use of the UNI/TS 11300 standards, and partly through the experience of
the authors together with the scientific literature [76]. The buildings obtained and characterized for technological systems
and construction features have been simulated to define performance in both the business as usual and retrofit scenarios.
A quasi-steady state monthly model was used to calculate the final and primary energy requirements for space heating
and DHW, and for CO2 emissions. The climatic data of the city of Turin have been assigned as a necessary input for the
climate characterization of buildings. The results obtained with simulations of the business as usual scenario represent
the typical archetypes of residential buildings located in climate zone E, which according to Italian legislation is
characteristic of municipalities between 2,100 and 3,000 heating degree-days [76].
2.2.1. Observations on TABULA project
After analyzing how TABULA was developed, some considerations must be addressed to understand its suitability for
UBEM tools.Integration: The TABULA project was born from the will of the European Commission to create a method to define
entire stocks of buildings, whether national or regional, through the use of archetypes that describe the main characteristics
of the entire stock by summarizing those buildings in a single typical construction. Given the nature of the project, the
attention is rightly placed on those buildings used only as housing units, leaving aside all those buildings that, although
partly having spaces used as dwellings, also use spaces for the commercial, receptive, or tertiary sector. The TABULA
project represents a good percentage of the buildings that make up the building stock of the Piedmont region but still
lacks integration with other building typologies (i.e., no buildings that have functions other than purely residential are
included).
Consistency: A second issue that emerges from the data analysis for the definition of building needs is the use of a single
file for climate data. Although defined as representative of the whole Piedmont region, the stock of buildings is simulated
using only the typical climate data of the city of Turin [76]. This inconsistency can cause problems when buildings
simulated with the climatic characteristics of a city placed in zone E are located in a mountain environment, and therefore
in climate zone F, or areas belonging to climate zone E are in more rural conditions.
Geographical coverage: As in the previous example, from the analysis of the TABULA project it is possible to see how
the simulations on the archetypes defined in the first phase were carried out using Turin’s climate data. The results
obtained were used to define the characteristics of the entire stock of buildings in the Piedmont region. Since it is defined
as one of the most representative building stocks in climate zone E, the archetypes obtained from the previous simulations
are defined as representative of all the buildings located in municipalities belonging to zone E. Given the lack of
exhaustive and detailed data on the types of residential buildings characteristic of the other climatic zones that characterize
the Italian peninsula (namely, A, B, C, D, and F) there is a lack of complete geographical coverage for the entire Italian
peninsula, making this study usable only for stocks of buildings that are located in geographical areas corresponding to
that of Piedmont. The TABULA project represents 944,690 buildings, 18.2% of total residential buildings in climate zone
E (5,191,960) and 7.7% of all Italian residential buildings (12,187,698) [77–79].
2.3. Other building databases
There are also cases where the previous resources were not used to define the thermophysical characteristics of buildings,
so different methodologies and resources were used. They are mostly studies conducted at two different spatial levels—
regional and municipal—and for each a different database was used.
Studies that focus on the characterization of residential buildings at the municipal level deal with several buildings that
are usually not too tall, either because of the study’s narrow focus or because the authors chose to focus only on a part of
the entire residential stock. In these cases, the definition of the buildings’ characteristics is usually very detailed because
more specific and communal level resources are used for small datasets. The geometrical and geo-referenced
characteristics of the buildings are deduced from the municipal topographic database, and through these characteristics,
it is possible to model the buildings under study three-dimensionally. By consulting the cadastral data, it is possible to
find not only finer-grained information. To define typical equipment and systems, statistical data recovered from the
census and made available by Istituto Nazionale di Statistica (ISTAT) are used. Finally, data on energy consumption are
obtained from Agenzia Delle Entrate [80], which periodically communicates them to the relevant municipal offices. These
databases, which are characterized by a uniform structure throughout the national territory, do not have a platform where
all data are collected and harmonized, so time-consuming data linking work is necessary [16,54,81].Despite the high level of detail that can be achieved with this methodology, it is not recommended for studies at national
or regional levels because there is no database that collects all the necessary data at the national level. This methodology
is therefore mainly suitable for municipalities or districts, since the main databases used are at the municipal level, and
the work of linking and harmonizing the data obtained from different sources is time-consuming.
As for studies carried out at the regional level, the procedure is different. Due to the large number of buildings in the
building stock, it is not possible to conduct a detailed analysis as can be done with smaller datasets. It is also not possible
to simply add up the consumption for each building because of the high number of buildings and the lack of knowledge
of the energy consumption of the buildings in the stock. Therefore, a statistical approach is used for analysis at the regional
or national level, through the definition of model buildings characterized by geometric and thermophysical features that
are considered representative of certain categories and are defined as archetypes. Statistical data collected, organized, and
published by ISTAT is used to define the necessary characteristics. The archetypes were determined according to the
building’s age, and each period was characterized by a typical construction technology that defined the envelope from a
geometric and thermophysical point of view. These are then assigned (again, on a statistical basis) to the systems for
heating, cooling, and domestic hot water, thus obtaining a series of archetypes representative of the different categories
that make up the entire building stock [82–84].
The use of this type of database is suitable in cases where the number of buildings making up the stock is too high to
proceed with the methodology described above. Although the results are not as detailed as would be in an analysis of a
set of buildings at the municipal level, the results obtained in some applications of this methodology show a good
correspondence between the consumption data obtained in reality and the consumption data obtained as a result of
simulations in steady-state, with deviation values about 10% [82].
3. Prototype building model development
According to the annual report of the Energy Conservation in Buildings and Community Systems (ECBCS), archetypes
and prototypes can be created from expert opinion, top-down statistics on characteristics of the stock, an empirical
database of the entire stock of buildings, or an empirical database of well-classified reference buildings [85].
3.1. Selected building typologies
The analysis done by ISTAT regarding the building typology at the national level shows that 84% are residential buildings
and among them, about 52% corresponds to single-family houses. In 2017 the energy consumption related to residential
housing was about 33 million tonnes of oil equivalent (Mtoe), of which 70% was related to heating and cooling, 3,8%
less than 2016 [77]. These data show the importance of the new policies developed at national and regional levels to
decrease energy need in residential buildings and thus their energy use. In particular, this work focused mostly on Italian
climatic zone E (2101You can also read