Physico-chemical characterization of urban aerosols from specific combustion sources in West Africa at Abidjan in Côte d'Ivoire and Cotonou in ...
←
→
Page content transcription
If your browser does not render page correctly, please read the page content below
Atmos. Chem. Phys., 20, 5327–5354, 2020
https://doi.org/10.5194/acp-20-5327-2020
© Author(s) 2020. This work is distributed under
the Creative Commons Attribution 4.0 License.

Physico-chemical characterization of urban aerosols from specific
combustion sources in West Africa at Abidjan in Côte d’Ivoire and
Cotonou in Benin in the frame of the DACCIWA program
Aka Jacques Adon1 , Catherine Liousse1 , Elhadji Thierno Doumbia2 , Armelle Baeza-Squiban3 , Hélène Cachier1 ,
Jean-Francois Léon1 , Véronique Yoboué4 , Aristique Barthel Akpo5 , Corinne Galy-Lacaux1 , Benjamin Guinot1 ,
Cyril Zouiten6 , Hongmei Xu1,7 , Eric Gardrat1 , and Sekou Keita8
1 Laboratoire d’Aérologie, Université de Toulouse, CNRS, UPS, Toulouse, France
2 CentreNational de Recherche Météorologiques (CNRM) UMR 3589, Météo-France/CNRS, Toulouse, France
3 Réponses Moléculaires et Cellulaires aux Xénobiotiques_RMCX, Université Paris Diderot, Unité de Biologie Fonctionnelle

et Adaptative-RMCX, CNRS, UMR 8251, Paris, France
4 Laboratoire de Physique de l’Atmosphère, Université Félix Houphouët-Boigny, Abidjan BPV 34, Côte d’Ivoire
5 Laboratoire de Physique du Rayonnement, Université d’Abomey-Calavi, Abomey-Calavi, Bénin
6 Géosciences Environnement Toulouse, Université de Toulouse, CNRS, UPS, Toulouse, France
7 Department of Environmental Science and Engineering, Xi’an Jiaotong University, Xi’an, China
8 UFR Sciences Biologiques, Université Péléforo-Gbon-Coulibaly de Khorogo, BP 1328 Khorogo, Côte d’Ivoire

Correspondence: Aka Jacques Adon (adonjacks@gmail.com) and Catherine Liousse (lioc@aero.obs-mip.fr)

Received: 27 April 2019 – Discussion started: 11 June 2019
Revised: 26 March 2020 – Accepted: 30 March 2020 – Published: 6 May 2020

Abstract. Urban air pollution in West Africa has yet to be      spectively. The annual PM2.5 levels at almost all sites are sig-
well characterized. In the frame of DACCIWA (Dynamics-          nificantly higher than the WHO guideline level of 10 µg m−3 .
Aerosol-Chemistry-Cloud Interactions in West Africa) pro-       As for PM mass, (EC) and (OC) concentrations are also max-
gram, intensive measurement campaigns were performed in         imal at the ADF site, accounting for up to 69 % of the to-
Abidjan (Côte d’Ivoire) and Cotonou (Benin), in dry (Jan-       tal PM mass. Such a high content is mainly linked to wood
uary 2016 and 2017) and wet (July 2015 and 2016) seasons,       burning for domestic cooking and commercial food smok-
at different sites chosen to be representative of African ur-   ing activities. Dust contributions are dominant at CT (57 %–
ban combustion sources, i.e., domestic fires (ADF), traffic     80 %), AT (20 %–70 %), and AWB (30 %–69 %) sites and es-
(AT) and waste burning (AWB) sources in Abidjan and traffic     pecially in the coarse and fine-particle modes at the CT site
source in Cotonou (CT). Both the size distribution of partic-   and in the coarse fraction at the AT site, which may be ex-
ulate matter (PM) and their chemical composition including      plained by the impact of long-range desert-dust transport and
elemental carbon (EC), organic carbon (OC), water-soluble       resuspended particles from the roads, in addition to anthro-
organic carbon (WSOC), water-soluble inorganic ions (WSI)       pogenic sources. The contributions of WSI to the total PM
and trace metals were examined. Results show very high PM       mass, mainly driven by chloride, nitrate, and calcium in the
concentrations at all sites and a well-marked seasonality as    fine and/or large particles, are highly variable according to
well as a strong spatial variation. The average PM2.5 mass      the sites but remain less than 30 %. Values are generally 1–
concentrations during the wet season are 517.3, 104.1, 90.3,    3 times higher in the wet season than in the dry season. This
and 69.1 µg m−3 at the ADF, CT, AT, and AWB sites, respec-      is due not only to anthropogenic emissions but also to ni-
tively. In the dry season, PM2.5 concentrations decrease to     trate formation by reaction processes and natural emissions.
375.7 µg m−3 at the ADF site, while they increase to 269.7,     The concentrations of trace elements reflect well the trends
141.3, and 175.3 µg m−3 at the CT, AT, and AWB sites, re-       in dust at the traffic and AWB sites, with a predominance

Published by Copernicus Publications on behalf of the European Geosciences Union.
5328 A. J. Adon et al.: Physico-chemical characterization of urban aerosols
of Al, Na, Ca, Fe, and K, keys markers of crustal dust. This CIWA (Dynamics-Aerosol-Chemistry-Cloud Interactions in
study constitutes an original database that characterizes spe- West Africa) program dedicated a specific work package to
cific African combustion sources. “Air Pollution and Health” dealing with pollutant character-
ization related to health issues through toxicological studies
and epidemiological studies.
Campaigns have been organized from December 2014 to
1 Introduction March 2017 in Abidjan and Cotonou. The strategy was to
measure aerosol chemical composition in different sites, rep-
The impact of anthropogenic pollution on environment and resentative of the main prevailing urban sources in West
health has been demonstrated by numerous studies in Europe Africa following Liousse et al. (2014) and Keita et al. (2018).
and North America, which have contributed to the implemen- Two typical traffic-sampling sites were chosen, one in Abid-
tation of emission reduction policies. By contrast, air pollu- jan (Côte d’Ivoire) and another one in Cotonou (Benin), to
tion in Africa is far from being well characterized, although take into account differences in terms of fleets, type of fuel
it is suspected to be responsible for negative health outcomes used, and quality of roads. Indeed, in Cotonou, the majority
(WHO, 2014). This is a major problem since Africa is an of population uses two-wheel vehicles using gasoline fuel or
intense emitter of pollution from anthropogenic sources that gasoline and oil fuel, whereas in Abidjan, the vehicle fleet
include domestic fires, vehicular traffic, waste burning, and is dominated by four-wheel engines using diesel fuel. Mea-
growing oil and mining industries. It has also one of the surements were also performed at domestic fire and waste
fastest growing urban populations in the world, especially burning sites, both located in Abidjan.
in West and East Africa (United Nations, 2019). As a con- For a period of 2 years, PM2.5 mass and carbonaceous
sequence, it has been shown that massive urbanization and aerosol were weekly measured, and results are discussed in
rapid economic growth could be responsible for tripling an- Djossou et al. (2018). In this paper, we focus on the results
thropogenic emissions in Africa between 2000 and 2030 (Li- from the intensive campaigns. We present measurements ob-
ousse et al., 2014). Moreover, it is important to recall the im- tained at each site during the wet and dry seasons of the
pact of biomass burning and dust sources in the African at- studied periods: (i) PM size distribution and mass concentra-
mospheric composition, especially occurring during the dry tions; (ii) PM chemical composition including carbonaceous
season. All of this results in a major degradation of urban aerosol, water-soluble organic carbon, water-soluble inor-
air quality and an impact on the health of exposed popu- ganic ions, dust, and trace elements in different size fractions.
lations. Only a few studies on this subject have been con- Experimental method including description of sites, types of
ducted in West Africa (Val et al., 2013; Dieme et al., 2012; measurements and analyses, and meteorological conditions
Kouassi et al., 2009) despite the high atmospheric pollutant will be presented in the Sect. 2, whereas results and discus-
concentrations already measured to be on the same order as sion are discussed in the Sects. 3 and 4 of the paper, respec-
in Asian megacities and well above WHO international stan- tively.
dards (WHO, 2014).
West Africa is then a unique laboratory to study urban
pollution. Previous studies conducted under the framework 2 Experimental method
of the AMMA (Analyses Multidisciplinaires de la Mousson
Africaine) and POLCA (POLlution des Capitales Africaines) 2.1 Description of sites
programs have revealed very high average particulate mass
concentrations in Cotonou (Benin), Bamako (Mali), Dakar Measurement campaigns have been performed in wet sea-
(Senegal), and Yaoundé (Cameroon) during the dry season sons (20–26 July 2015 and 4–13 July 2016) and dry seasons
(Doumbia et al., 2012; Val et al., 2013), suggesting that the (7–15 January 2016 and 5–14 January 2017) at three sites in
population may be affected by negative health outcomes. For Abidjan (Côte d’Ivoire), representative of different sources,
example, during the dry season in Bamako (Mali) and Dakar i.e., ADF for Abidjan domestic fires, AWB for Abidjan waste
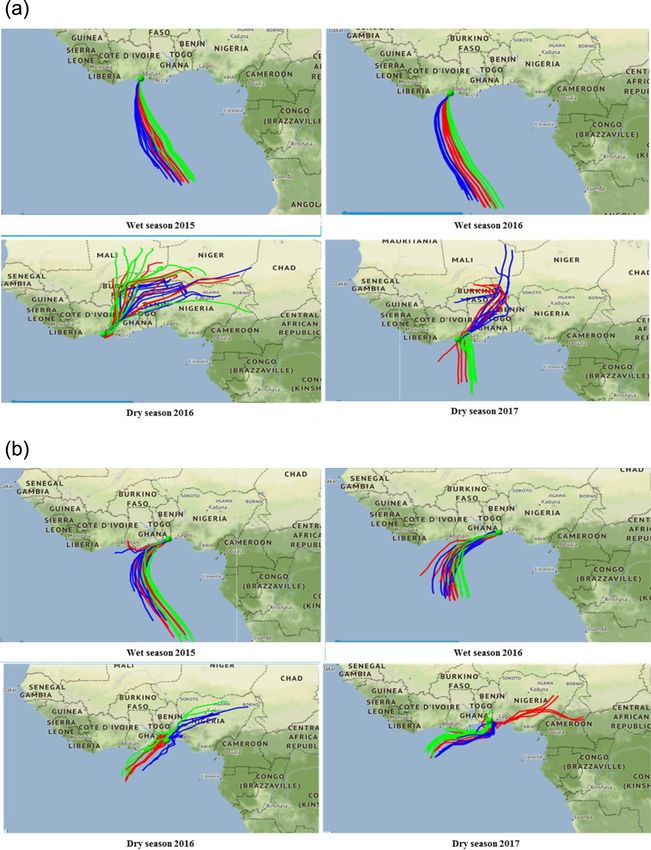
(Senegal), Val et al. (2013) showed that the inflammatory im- burning, and AT for Abidjan traffic (Fig. 1), and one traffic
pact of combustion aerosol depends on the type of emission site in Cotonou (Benin) (Fig. 2).
sources and determined the predominant role of particulate As shown in Fig. 3, which presents pictures of the differ-
organic matter. This is consistent with global findings show- ent sampling sites, the ADF site (5◦ 190 4400 N, 4◦ 060 2100 W) is
ing that fine and ultrafine aerosol fractions, as well as their situated on a platform, 5 m above ground level, in Yopougon
content in trace metals and organic compounds, induce bi- Bracody district near a market (Fig. 1). This geographical
ological effects due to their ability to reach the distal lung area is highly populated with various small commercial ac-
(Cassee et al., 2013). Such reasons highlight the need to bet- tivities such as fish and meat smoking by women. There are
ter understand the size-speciation of the aerosol chemical also many formal and informal settlements, which mainly
composition of the main West African anthropogenic sources use wood and charcoal as a source of fuel for private and
during the different seasons. Within this context, the DAC- professional combustion activities. Other sources of concern
Atmos. Chem. Phys., 20, 5327–5354, 2020 www.atmos-chem-phys.net/20/5327/2020/
A. J. Adon et al.: Physico-chemical characterization of urban aerosols                                                            5329

                                                                     Figure 3. Pictures of the different sampling sites: (a) traffic in
Figure 1. Map of the city of Abidjan reporting the geographical      Cotonou (Benin, CT station); (b) waste burning in Abidjan (Côte
location of DACCIWA urban sampling sites.                            d’Ivoire, AWB station); (c) domestic fire, showing smoking activity
                                                                     in Yopougon, Abidjan (Côte d’Ivoire, ADF station); and (d) “woro-
                                                                     woro and Gbaka” traffic in Abidjan (Côte d’Ivoire, AT station).

                                                                     in Cotonou, on the “Sogema” building roof, about 7 m above
                                                                     ground level. This site is close to the Dantokpa market and
                                                                     also to the biggest crossroad of Cotonou (intersection of four
                                                                     main roads). This site is highly influenced by intense traffic
                                                                     activities. As previously mentioned, such a site is interesting
                                                                     because the vehicle fleet and fuels are different in Cotonou
                                                                     compared to Abidjan in the following ways: (1) there are
                                                                     many two-wheel vehicles in Cotonou, while a few only in
                                                                     Abidjan; (2) in Cotonou, gasoline is of poor quality due to
                                                                     the illegal fuel transport from Nigeria, and (3) the roads are
                                                                     in worse conditions in Cotonou than in Abidjan.

                                                                     2.2   Measurements

                                                                     During each intensive campaign and on each site, two 3 h
Figure 2. Map of the city of Cotonou reporting the geographical      samples collected with cascade impactors operating in par-
location of DACCIWA urban sampling site.                             allel are obtained for 3 consecutive days (i.e., six size-
                                                                     resolved samples per site during each campaign), to allow
                                                                     size-speciated characterization of the aerosol chemical com-
contributing to the mix of pollutant emissions in the area           position. Note that the choice of the 3 h periods is linked to
include transportation-related emissions, biomass burning,           the period of maximum pollution for each site as shown by
garbage bins or small landfills, and various other fugitive          preliminary studies, e.g., morning at the ADF site (07:00–
sources. The AT site (5◦ 210 1400 N, 4◦ 010 0400 W) is located in    10:00 am), afternoon at the AT site (04:00–07:00 pm, and
Adjamé, on the roof of the “220 pharmacie logement” build-           morning at the CT site (07:00–10:00 am). There is no specific
ing, about 7 m above ground level and roughly 10 m away              period at AWB site since the activities are roughly the same
from the main road. This site, close to the Adjamé market and        during the day. The first impactor with four stages (PM>2.5 ,
to a bus station, is highly affected by traffic (Gbaka, bus, taxi,   PM2.5−1 , PM1−0.2 , PM2.5 ; PM2.5−1 ; PM1−0.1 ) is equipped with
level. This site, close to the big municipal landfill of Abid-       three Teflon filters (Zefluor, Pall Corporation® ), dedicated to
jan operational since 1965 and now covering an area of 153           water-soluble ions species and trace elements. Due to opera-
ha, is submitted to frequent waste burning pollution. The            tional problems in July 2016, this second three-stage cascade
Cotonou traffic (CT) (6◦ 220 1900 N, 2◦ 260 500 E) site is located   impactor is replaced by another three-stage cascade impactor

www.atmos-chem-phys.net/20/5327/2020/                                                  Atmos. Chem. Phys., 20, 5327–5354, 2020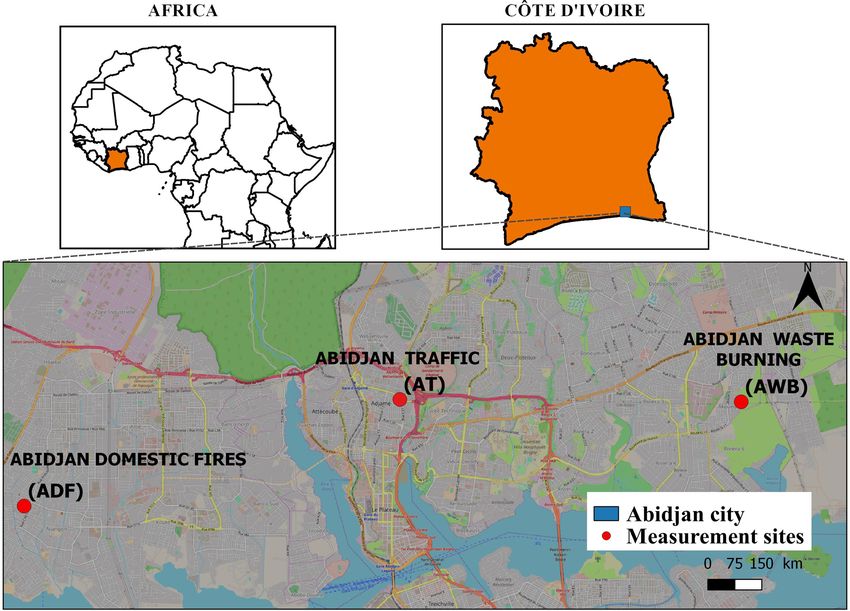
5330                                                  A. J. Adon et al.: Physico-chemical characterization of urban aerosols

with different size cuts (PM>10 , PM10−2.5 , PM2.5−1 ). For        the geometry of the spots at the surface of the filters, sam-
consistency, results will be presented as an ultrafine (UF),       ples are divided into equivalent parts (1/2 or 1/4 of 47 mm
fine (F), and coarse (C) classification. The two first stages      filters, the rest of the filters being used for carbonaceous anal-
(PM>2.5 and PM2.5−1 ) being considered as the coarse partic-       ysis). The extraction protocol consists of 16 h soaking under
ulate fraction, the PM1−0.1 or PM1−0.2 stage, the fine partic-     soft shaking in an Erlen–Meyer flask containing 20 mL of
ulate fraction and the PM
A. J. Adon et al.: Physico-chemical characterization of urban aerosols                                                             5331

consider 13 trace metals: Al, Ti, Cr, Mn, Fe, Ni, Cu, Zn, Ba,       Table 1. Comparison of dust concentrations obtained from different
La, Th, Pb, and Cd.                                                 methodologies, in micrograms per cubic meter.

2.3.6   Dust calculation                                              Dry 2017             Sciare et al.   Guinot et al.   Terzi et al.
                                                                                                (2005)          (2007)         (2010)
Many methods can be used to quantify dust concentrations.             ADF         C                18.5            11.2          86.9
We have selected three methods (Sciare et al., 2005; Guinot                       F                 9.3            29.7          22.2
et al., 2007; Terzi et al., 2010) to underline the uncertainties                  bulk             27.7            40.9         109.1
linked to dust estimates.
                                                                      AWB         C                12.3            48.5         126.4
   The Sciare et al. (2005) method consists of using soluble                      F                 5.2            39.7         106.4
calcium data obtained with ionic chromatography (IC), to                          bulk             17.6            88.2         232.8
estimate the dust concentrations following the relationship:
dust = 10.96 × nss-Ca2+ , where nss-Ca2+ (= 1.02 × Ca2+ –             AT          C                16.4            24.8          98.5
0.038 × Na+ ) refers to non-sea-salt calcium concentration.                       F                 4.3            13.4          34.2
                                                                                  bulk             20.7            38.2         132.7
   The Guinot et al. (2007) method is based on a chemical
closure where fine- and coarse-particle aerosols are sepa-            CT          C                37.9            70.0          98.4
rated into four components (EC, POM, WSI, and dust). EC,                          F                23.4            45.6          55.8
WSI, and total aerosol mass are directly experimentally de-                       bulk             61.3           115.6         154.2
termined (see paragraphs below). POM concentrations are               Wet 2016             Sciare et al.   Guinot et al.   Terzi et al.
obtained from OC concentrations that are experimentally de-                                     (2005)          (2007)         (2010)
termined and k, the OC / POM conversion factor. Dust con-
                                                                      ADF         C              35.34             21.5           27.9
centrations are obtained from measured Ca2+ concentrations
and f , the abundance of calcium in dust. The k and f val-            AWB         C              13.46              8.6           21.1
ues are obtained from a linear regression (L) between the
                                                                      AT          C              19.65             37.5           21.4
reconstructed and the weighed aerosol mass concentrations.
Briefly, first step consists of focusing on the aerosol coarse        CT          C              42.98             26.2           52.5
fraction. k is fixed to 1.8, and as a result of L just mentioned,                 Bulk           42.98             26.2           52.5
f is obtained to be in the range of 0.012 to 0.15, depend-
ing on our sites. The second step deals with the aerosol fine
fraction. The f values just obtained for the aerosol coarse         experimental problems, whereas Ca2+ concentrations mea-
fraction are applied to the fine fraction, and k ratios are esti-   sured by IC are available for all campaigns. As shown in Ta-
mated using (L) to be in the range of 1.2 to 2.1. Note that at      ble 1, the dust obtained from Ca2+ measured by IC (Sciare
all of our sites, the correlation between Ca2+ and the miss-        et al., 2005) and by the Guinot et al. (2007) method is lower
ing mass between the weighed and the reconstructed aerosol          than that obtained from trace elements (Terzi et al., 2010)
mass is sufficiently good (r 2 = 0.9) to support the consis-        for DS2017, whereas it is of the same order of magnitude in
tency of this simple approach for the evaluation of dust. Also,     WS2016. Such results are in agreement with methodological
f and k values are included in the range of values provided         aspects. Indeed, Al, Fe, Ca, etc. obtained by ICP-MS include
in the literature (He et al., 2001; Sun et al., 2004; Guinot et     both soluble and insoluble particles, whereas Ca2+ measured
al., 2007). However, it is important to mention that the ranges     by IC only includes soluble particles. During the dry season,
of f and k coefficients are large, which is due to the source       comparison of Ca measured by ICP-MS (not shown here) is
mixing observed in this study.                                      higher than that of the IC, by factors of 1.7, 1.8, 2.2, and 1.1,
   In the Terzi et al. (2010) method, dust is obtained with         at the ADF, AWB, AT, and CT sites, respectively. By con-
the following relationship: dust = 1.89[Al] + 1.21[K] +             trast, this factor is low and constant (1.3) in the wet season
1.95[Ca] + 1.66[Mg] + 1.7 [Ti] + 2.14[Si] + 1.42[Fe].               for all of the sites. In our study, due to the lack of trace el-
In our study, all of these elements are determined except           ement data for WS2015 and DS2016, dust estimations are
for silicon (Si). Consequently, we used mean Si values ob-          performed from the Guinot et al. (2007) method. This choice
tained from different relationships available in the literature     globally implies an underestimate of dust concentrations by
(SiO2 = 3 × Al2 O3 for Alastuey et al. 2005, Si = 4.0 × Al for      a factor of 1.5 to 3.5 in DS2017 as shown in Table 1.
Zhang et al., 2003; and Si = 2.03 × Al for Chiapello et al.,
1997).                                                              2.3.7   Aerosol chemical closure methodology
   The results of dust concentrations estimated from the three
methodologies above described are summarized in the Ta-             As previously mentioned and detailed, aerosol chemical clo-
ble 1 for the wet season (WS) 2016 and dry season (DS)              sure is performed following the Guinot et al. (2007) method-
2017. Indeed, Ca, Al, and Fe concentrations measured by             ology.
ICP-MS are only available in WS2016 and DS2017 due to

www.atmos-chem-phys.net/20/5327/2020/                                                 Atmos. Chem. Phys., 20, 5327–5354, 2020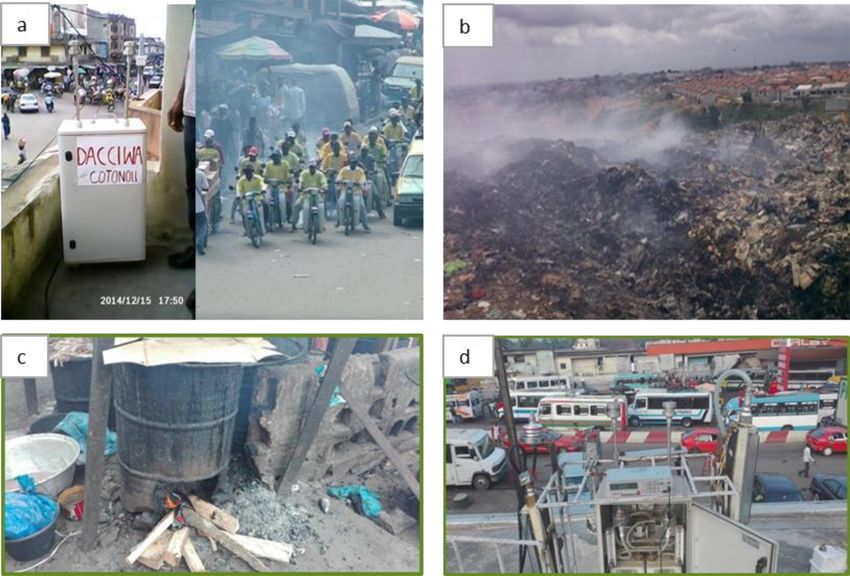
5332 A. J. Adon et al.: Physico-chemical characterization of urban aerosols
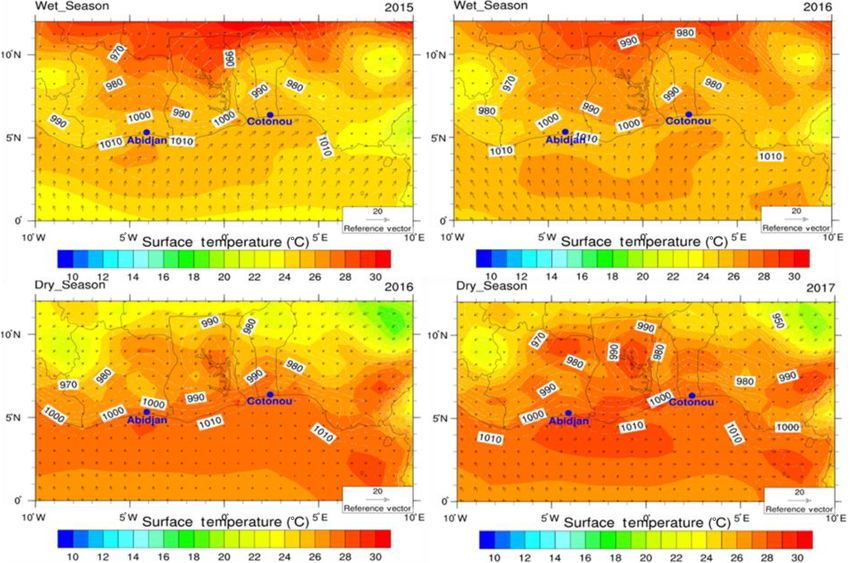
Figure 4. Wind, pressure, and temperature diagram at Abidjan and Cotonou during the different campaigns.
2.4 Meteorological conditions coast (Fig. 4, upper row). At this season, the humidity level
is high across the region. On the coast, rains may occur from
March to November.
In Fig. 4, meteorological data (surface temperature and wind During our campaigns (not shown here), temperatures are
directions and speed) issued from the NOAA Integrated Sur- roughly the same at Abidjan and Cotonou, reaching 28 and
face database (ISD; see https://www.ncdc.noaa.gov/isd, last 26 ◦ C in the dry and wet seasons, respectively. Gentle to
access: 20 November 2018) and the ASECNA (Agence pour moderate wind speeds are observed during the measure-
la Sécurité de la Navigation Aérienne en Afrique et à Mada- ment campaigns at the two cities, with average values of
gascar) are presented for the southwestern Africa region in- 15–20 and 15–22 km h−1 at Abidjan and Cotonou, respec-
cluding Abidjan and Cotonou. As expected, this area is un- tively. There is no precipitation at the CT site during the
der the influence of the convergence zone of two air masses studied periods. In Abidjan on the contrary, low rains oc-
of a different nature, i.e., Harmattan (hot and dry continen- cur both in wet and dry periods with cumulative precipi-
tal trade winds) from the north and monsoon (humid mar- tation higher in DS2017 (7 mm) than in WS2016 (4.7 mm)
itime trade winds) from the south (Fig. 4). Ground contact and WS2015 (2 mm). There is no rain in DS2016 (https:
between these two air masses constitutes the intertropical //www.historique-meteo.net/afrique/, last access: 20 Decem-
front (ITF) of which the fluctuations during the year deter- ber 2019).
mine the seasons in the Gulf of Guinea (Tapsoba, 1997).
During the dry season (from November to March), temper- 2.5 Backward trajectories
atures are relatively high with a maximum around 30 ◦ C on
the coast. The humidity is low, since the prevailing Harmat- The Hybrid Single-Particle Lagrangian Integrated Trajec-
tan wind blows from the desert, usually bringing dust (Fig. 4, tory (HYSPLIT) modeling system (Air resources laboratory,
lower row). The period from June to September, especially Draxler and Rolph, 2012) is used for the trajectory analysis.
in July is the wet season period when daytime temperatures The HYSPLIT model is run to compute 120 h back trajec-
are slightly lower, with a maximum around 26/28 ◦ C on the tories ending at Abidjan and Cotonou at 50 m a.g.l. (Fig. 5).
Atmos. Chem. Phys., 20, 5327–5354, 2020 www.atmos-chem-phys.net/20/5327/2020/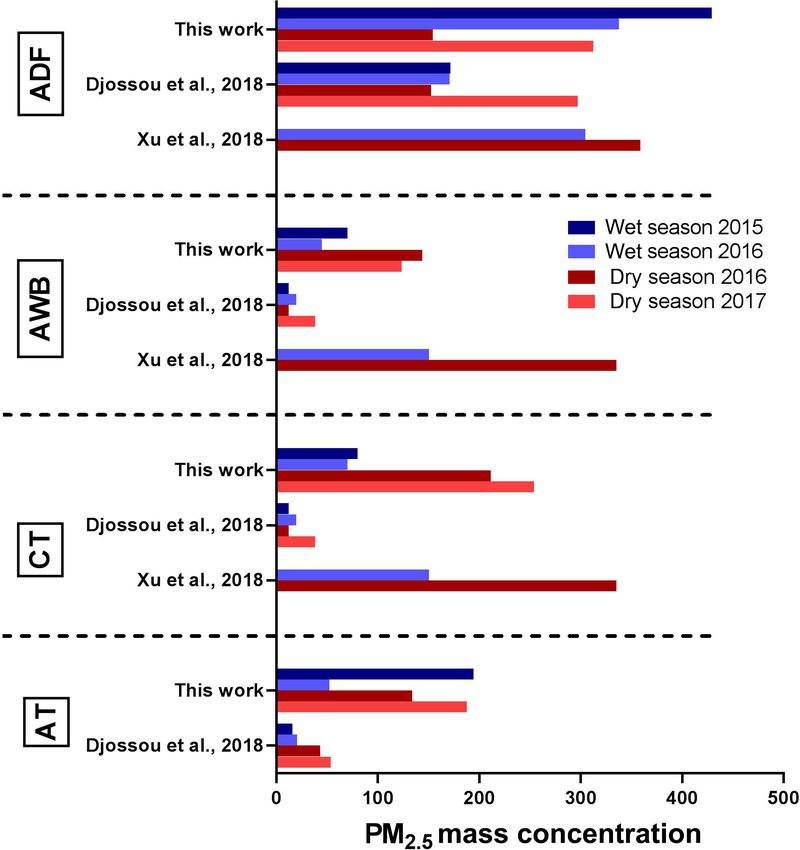
A. J. Adon et al.: Physico-chemical characterization of urban aerosols                                                         5333

The Global Data Assimilation System reanalysis database is         3.2     Carbonaceous aerosol
used as meteorological input, with a 0.25◦ ×0.25◦ horizontal
resolution. Results presented in Fig. 5 confirm that air masses    3.2.1    EC and OC concentrations
mainly come from the north with a few from the southwest in
the dry season (January), whereas they come from the south-        In Fig. 8, EC relative mass contributions are presented for
west and the south in the wet season (July). Therefore, in         each size, site, and campaign as follows: wet season 2015
January Abidjan and Cotonou are mainly impacted by pol-            (WS2015), wet season 2016 (WS2016), dry season 2016
luted air masses from surrounding areas and northern coun-         (DS2016), and dry season 2017 (DS2017). Mean EC bulk
tries with possible dust and West African biomass burning in-      mass concentrations are added in the black boxes for each
fluences, whereas in July the impact of oceanic sources pos-       size and for each campaign. The most striking feature is that
sibly polluted by long-range south African biomass burning         the ADF site concentrations are higher than at the other sites
aerosols may be observed.                                          in WS2016 and DS2017, while on the same order as CT site
                                                                   concentrations in the other seasons. Mean concentration at
                                                                   the CT site (16 µg m−3 ) is slightly higher than at the AT site
3     Results                                                      (10 µg m−3 ), whereas the lowest concentrations are found at
                                                                   the AWB site. Results of the EC size distribution are very
3.1    Aerosol size distribution and mass concentration
                                                                   consistent among the different sites (Fig. 8). Whatever the
In Fig. 6, the relative mass distribution of PM for coarse (C),    site and the season, higher EC concentrations are found in C
fine (F), and ultrafine (UF) particle sizes in percentages are     (42 %) and UF (43 %) particles compared to F particles.
presented with bulk mass concentration averages indicated             The same data are presented for OC concentrations in
in the black boxes for each site and for each campaign. As         Fig. 9. It may be underlined that ADF OC values are always
it may be seen, bulk concentrations vary widely from site to       higher than in the other sites by a factor ranging from 6 to
site and from campaign to campaign. During the wet season,         30, for all seasons and particle sizes, with highest and low-
the average total concentrations range from 82 to 676 µg m−3       est values, respectively, in DS2017 and DS 2016. In terms of
in 2015 and from 56 to 358 µg m−3 in 2016, with the maxi-          size distribution, maximum OC concentrations at the ADF
mum at the Abidjan domestic fire (ADF) site. While during          site may be found in UF (53 %), then F (29 %), and finally
the dry season, values range from 168 to 269 µg m−3 in 2016        C (18 %) particles. The same distribution is observed for the
and from 114 to 559 µg m−3 in 2017, with maximum concen-           traffic sites in DS2016; however, for the other campaigns, OC
tration obtained at the Cotonou traffic (CT) and ADF sites.        size distribution looks like the EC ones with higher concen-
In terms of size distribution, concentration peaks may be ob-      trations in UF and C particles than in F particles.
served for all aerosol size-fractions which are found to ex-          As shown in Fig. 10, the highest OC / EC ratios are always
hibit different seasonal patterns. UF particles (< 0.2 µm) rep-    obtained at the ADF site with a value as high as 25 for F
resent the highest contributor to the bulk mass at the ADF         particles in WS2016, whereas the lowest values are found
site, by up to 60 % (335.3 µg m−3 ) in DS2017. F particles         in DS2017. This is the same feature for the other sites with
(1–0.2 µm) are the second most important contributor, and          ratios lower than 2 in DS2017. OC / EC ratios at the AWB
both combined particle sizes account for more than 85 % of         site are higher than at the traffic sites. Note that values at the
the total mass at the ADF site. In this site, ultrafine and fine   AT site are higher than CT values in the wet season, while
fractions are also found to be maximal during WS2015 and           lower in the dry season. Finally, it is interesting to underline
WS2016 by up to 90 % and 83 %, respectively. Let us note           that linear correlations between EC and OC are obtained in
that C particle contribution in bulk is relatively higher in the   the ultrafine and fine modes in all campaigns, particularly
traffic and waste burning sites than at the ADF site (40 %),       in DS2017 (r 2 = 0.8, 0.8, 0.9, and 0.9) at the ADF, AWB,
whereas F and UF particle contributions are on the order of        AT, and CT sites, respectively. This suggests that different
60 %.                                                              studied sources can be assessed as significant sources of both
   In terms of PM2.5 , the results of this work are presented      EC and OC.
in Fig. 7. The mass concentrations of PM2.5 averaged over
DS2016 and DS2017 are 154 ± 74, 144 ± 42, 134 ± 7, and             3.2.2    Water-soluble organic carbon
211±51 µg m−3 at the ADF, AWB, AT, and CT sites, respec-
tively, and 338±24, 45±3, 52±4, and 70±1 µg m3 over the            Concentrations of WSOC and WSOC / OC ratios are pre-
wet seasons (2015–2016). The increase in PM2.5 is on the           sented in Table 2 for each size (UF, F, C, and PM2.5 ) and
order of 54 % at ADF from the dry to wet season, whereas           campaign. As seen, WSOC values are always higher at the
a sharp reduction (more than 60 %) is obtained at AWB, AT,         ADF site than in other sites, at least by a factor of 12.
and CT sites.                                                      Maximum values are obtained in WS2016 with an average
                                                                   of 16.47, 17.08, and 79.68 µg C m−3 for coarse, fine, and
                                                                   ultrafine fractions, respectively, followed by WS2015 and
                                                                   DS2017. WSOC concentrations are the lowest in DS2016,

www.atmos-chem-phys.net/20/5327/2020/                                               Atmos. Chem. Phys., 20, 5327–5354, 2020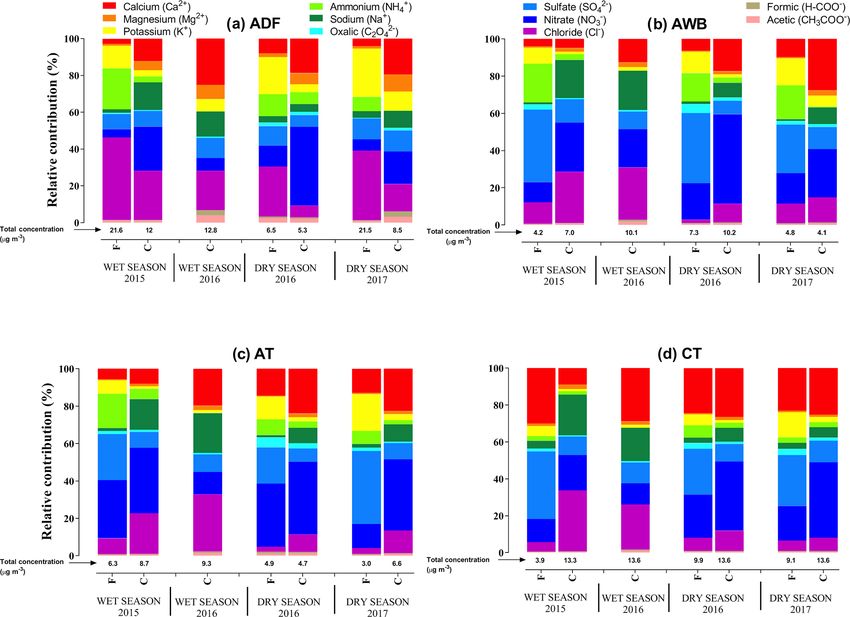
5334                                                  A. J. Adon et al.: Physico-chemical characterization of urban aerosols

Figure 5. Back trajectories arriving at Abidjan (a) and Cotonou (b) for each season (WS2015, WS2016, DS2016, and DS2017).

with an average of 4.14, 6.95, and 21.89 µg m−3 for coarse,         AWB sites. At the CT site, the highest values are found in the
fine, and ultrafine fractions, respectively. In terms of season-    coarse particulate fractions, except in DS2016.
ality, there is not a clear trend in WSOC values at the AWB            As expected, WSOC is strongly correlated with OC (r =
and AT sites, whereas at the CT and ADF sites, WSOC values          0.7 at the ADF site, 0.8 at the AT site, and 0.5 at the AWB
are found to be respectively higher and lower in dry seasons        site, and 0.7 at the CT site), whereas correlations with EC
compared to wet seasons. It is also interesting to note that        are weaker, especially at the AWB and CT sites with val-
WSOC values are maximal in UF sizes at the AT, ADF, and             ues ranging from 0.1 to 0.4, respectively. Finally, when look-

Atmos. Chem. Phys., 20, 5327–5354, 2020                                               www.atmos-chem-phys.net/20/5327/2020/
A. J. Adon et al.: Physico-chemical characterization of urban aerosols                                                                     5335

Figure 6. Aerosol mass concentrations at the different study sites for each campaign and for the different sizes (C in black, fine in light grey,
ultrafine in grey). Bulk aerosol mass is indicated in boxes.

                                                                           at ADF where maximum values occur during the wet season.
                                                                           Note, as for WSOC, that ratios are maximal in UF and F frac-
                                                                           tions for all sites except at the CT site where the ratio for the
                                                                           coarse fraction is the highest.

                                                                           3.3   Water-soluble ionic species

                                                                           Figure 11 shows the relative contribution of the major ions to
                                                                           the total concentration (also given) of the ions in the differ-
                                                                           ent particle modes (C and F) at the ADF, AWB, AT, and CT
                                                                           sites for the different measurement campaigns. Let us recall
                                                                           here that only C and F fractions may be documented due to
                                                                           the our experimental protocol. Total concentrations present
                                                                           maximum values at ADF and CT sites. Values at the AWB
                                                                           and AT sites are of the same order of magnitude and lower
                                                                           by a factor of 2 than at the ADF and CT sites. The contri-
                                                                           bution of different ions shows significant variations from site
                                                                           to site. The dominant ionic species at the ADF site over all
                                                                           campaigns is chloride (Cl− ), with a 26 % contribution, fol-
                                                                           lowed by nitrate (NO−                           2+
                                                                                                  3 ) (16 %), calcium (Ca ) (13 %), and
                                                                           potassium (K2+ ) (12 %). Sulfate (SO2− 4 ), ammonium (NH4 ),
                                                                                                                                        +
Figure 7. Comparison of PM2.5 mass concentrations in micrograms                         +
                                                                           sodium (Na ), and to a lesser extent magnesium (Mg )         2+
per cubic meter (µg m−3 ) at the four sites with those obtained by         contributions are lower, ranging from 4 % to 7 % of the to-
Djossou et al. (2018) and Xu et al. (2019) for the same sites and
                                                                           tal ion species. The lowest contribution is for organic acids
periods. Data for the following weeks were then selected in Djossou
et al. (2018): 20–27 July 2015 for WS15, 4–11 January 2016 for
                                                                           with their total value lower than 5 %. NO−  3 is the major ionic
DS16, 4–11 July 2016 for WS16, and 9–16 January 2017 for DS17.             component at the AWB and AT sites, representing 24 % and
                                                                           29 % of the total water-soluble inorganic concentration, re-
                                                                           spectively. The second major contributor at the AWB and
ing at WSOC / OC ratios (Table 2), maximum values are ob-                  AT sites is SO2−4 , accounting for 21 % and 17 % of the ion
tained at the ADF site with PM2.5 ratios as high as 43 %,                  mass, respectively followed by Ca2+ (12 % and 15 %) and
followed by the AT and AWB sites with 32 %. The lowest                     Cl− (15 % and 13 %). At the CT site, Ca2+ is predominant
value (23 %) is found at the CT site. Also, Table 2 shows that             with a relative abundance of 24 %, followed by NO−    3 (23 %),
there is no clear seasonality in WSOC / OC values, excepted                SO2−4   (19 %), and  Cl −
                                                                                                     (13 %).  Na + , NH+ , and K+ contri-
                                                                                                                        4

www.atmos-chem-phys.net/20/5327/2020/                                                         Atmos. Chem. Phys., 20, 5327–5354, 2020
5336 A. J. Adon et al.: Physico-chemical characterization of urban aerosols Figure 8. EC relative concentrations in each size classes (C in black, fine in light grey, ultrafine in grey) at the different study sites for each campaign. Bulk EC concentration for each site is indicated in boxes. Figure 9. OC relative concentrations in each size classes (C in black, fine in light grey, ultrafine in grey) at the different study sites for each campaign. Bulk OC concentration for each site is indicated in boxes. butions are lower and of the same order of magnitude at AT, other sites, Cl− is most likely dominated by coarse particles. AWB, and CT sites, ranging from 4 % to 9 % of the total ion Finally, SO2−4 is mainly found in the fine mode at the AT, species. Note that organic ion contributions at AT, CT, and AWB, and CT sites but in the coarse mode at the ADF site. AWB sites are of the same order as at the ADF site, with In terms of seasonal variations, it may be shown in Fig. 11 lower values at the CT site. It is interesting to underline in that higher Cl− values are found in wet seasons than in the Fig. 11 that NO− 3 contribution is always higher in the coarse dry seasons everywhere, except at the ADF site where there than in the fine size. Conversely, K+ is always higher in the is no marked difference between seasons. For example, the fine than in the coarse size. In CT, Ca2+ in the fine fraction mean relative total percentages of Cl− at the CT site are is as high as in the coarse fraction, whereas at AT, AWB, and 38 % and 24 % in WS2015 and WS2016, respectively, while ADF sites Ca2+ coarse fraction is predominant. Fine-particle these percentages decrease significantly to 18 % and 13 % in contribution may be noticed for Cl− at ADF, whereas at the DS2016 and DS2017, respectively. The Cl− /Na+ ratios are Atmos. Chem. Phys., 20, 5327–5354, 2020 www.atmos-chem-phys.net/20/5327/2020/
A. J. Adon et al.: Physico-chemical characterization of urban aerosols                                                                    5337

Figure 10. OC/EC ratio for the different campaigns and sites for each aerosol size (C in black, fine in light grey, ultrafine in grey). Each box
shows the median and the first and the third quartiles.

Figure 11. Water-soluble ionic species speciation for each site, each campaign, and each aerosol size.

www.atmos-chem-phys.net/20/5327/2020/                                                        Atmos. Chem. Phys., 20, 5327–5354, 2020
5338                                                  A. J. Adon et al.: Physico-chemical characterization of urban aerosols

Table 2. WSOC concentrations (µg m−3 ) and WSOC / OC ratios (%) for each site, each campaign and each aerosol size.

                                       Site               Abidjan waste burning     Abidjan domestic fire
                           Period             Size        WSOC      WSOC / OC      WSOC      WSOC / OC
                           Wet season 2015    Coarse          1.3           24,6       8.2           32.5
                                              Fine            0.7           19.9      12.8           22.7
                                              Ultrafine       4.1           43.6      51.3           72.5
                                              PM2.5           5.5           33.7      69.5           47.2
                           Dry season 2016    Coarse          0.4           12.3       4.4           18.8
                                              Fine            0.9           46.9       7.0           20.4
                                              Ultrafine       1.5           38.4      21.9           61.5
                                              PM2.5           2.7           32.7      31.0           32.0
                           Wet season 2016    Coarse          1.3           42.5      16.5           44.3
                                              Fine            0.8           26.3      17.1           33.0
                                              Ultrafine       2.0           41.2      79.7           84.5
                                              PM2.5           3.5           37.1     106.0           52.0
                           Dry season 2017    Coarse          1.9           32.9      12.1           36.0
                                              Fine            1.4           38.4      19.9           35.0
                                              Ultrafine       1.6           11.5      38.6           19.0
                                              PM2.5           4.0           30.0      65.8           29.0
                                       Site                   Abidjan traffic          Cotonou traffic
                           Period             Size        WSOC      WSOC / OC      WSOC      WSOC / OC
                           Wet season 2015    Coarse        2.4           39.6       1.1           23.3
                                              Fine          1.3           46.7       0.5           22.1
                                              Ultrafine     4.7           29.0       0.4           12.7
                                              PM2.5         6.9           34.0       2.2           18.0
                           Dry season 2016    Coarse          1.4           43.0       2.3           64.1
                                              Fine            1.9           59.0       0.6           10.5
                                              Ultrafine       4.9           62.0       6.3           42.9
                                              PM2.5           7.5           49.4       8.0           29.0
                           Wet season 2016    Coarse          1.1           23.1       1.2           34.7
                                              Fine            0.5           16.8       0.5           32.2
                                              Ultrafine       1.4           34.8       0.9           23.0
                                              PM2.5           2.4           26.0       1.9           28.0
                           Dry season 2017    Coarse          0.9           24.0       3.5           37.8
                                              Fine            0.3           24.3       2.4           39.6
                                              Ultrafine       1.8           14.8       1.9           10.4
                                              PM2.5           2.6           16.0       6.0           18.2

about 1.5 everywhere in both seasons, in agreement with the          3.4   Trace element concentrations
typical seawater ratio (1–1.2) (Hara et al., 2004), except at
the ADF site where these ratios increase to 4 and 5 in the wet
                                                                     Table 3 shows the mean values of the major trace elements
and dry season, respectively and at the AWB site in the dry
                                                                     in bulk aerosol at the different studied sites in WS2016 and
season (2). K+ and Ca2+ are always higher in the dry sea-
                                                                     DS2017, with their corresponding relative abundances in the
son than in the wet season except for Ca2+ in the ADF site
                                                                     total aerosol mass into brackets. Let us recall that data are
where values are of the same order. Finally, the same trend is
                           2−                                        not available in WS2015 and DS2016. The concentrations of
observed for NO− 3 and SO4 with higher values in dry than            trace elements span a wide range, from 0.2 to 25.2 µg m−3 .
in wet seasons at AWB and CT sites, whereas values at ADF
                                                                     Among the measured elements, Al, K, Na, and Ca are the
and AT sites are of the same order of magnitude for the two
                                                                     most abundant, followed by Fe and Mg. In DS2017, Al and
seasons.
                                                                     Na concentrations are higher at the AWB site than at the
                                                                     other sites. The minimum value for these species is found

Atmos. Chem. Phys., 20, 5327–5354, 2020                                               www.atmos-chem-phys.net/20/5327/2020/
A. J. Adon et al.: Physico-chemical characterization of urban aerosols 5339
Table 3. Trace element concentrations for bulk aerosol for each site and for DS2017 and WS2016.
Bulk in nanograms per cubic meter (%)
Dry 2017 Wet 2016
ADF AWB AT CT ADF AWB AT CT
Al 10 050.8 (1.8) 25 186.1 (13.7) 14 015.8 (12.26) 15 480.4 (5.7) 1370.5 (0.4) 1990.1 (3.5) 2191.4 (2.4) 4010.5 (4.4)
K 8634.3 (1.5) 6093.7 (3.3) 3677.7 (3.22) 5068.9 (1.9) 1105.0 (0.3) 472.0 (0.8) 275.9 (0.3) 1076.0 (1.2)
Na 6847.8 (1.2) 23 430.5 (12.8) 15 372.1 (13.44) 11 529.3 (4.3) 2070.6 (0.6) 3735.4 (6.6) 2861.5 (3.1) 5310.2 (5.8)
Ca 4321.2 (0.8) 2923.7 (1.6) 4117.6 (3.60) 6233.5 (2.3) 4124.7 (1.1) 447.5 (0.8) 374.7 (0.4) 4954.02 (5.4)
Mg 1940.6 (0.3) 384.0 (0.2) 410.3 (0.36) 823.2 (0.3) 1524.7 (0.4) 294.9 (0.5) 283.5 (0.3) 619.2 (0.7)
Fe 1709.9 (0.3) 3807.9 (2.1) 1628.1 (1.42) 3406.8 (1.3) 1314.0 (0.4) 709.3 (1.3) 987.3 (1.1) 1549.4 (1.7)
P 1521.9 (0.3) 696.0 (0.4) 147.8 (0.13) 207.4 (0.1) 605.4 (0.2) 8.6 13.2 81.4 (0.1)
Ti 488.9 (0.1) 2270.3 (1.2) 282.8 (0.25) 457.9 (0.17) 170.8 (0.05) 75.7 (0.13) 96.8 (0.11) 154.7 (0.17)
Zn 189.7 (0.03) 80.9 (0.04) 57.9 (0.05) 149.4 (0.06) 60.3 (0.02) 1.9 41.1 (0.04) 36.2 (0.04)
Zr 172.1 (0.03) 390.3 (0.21) 217.9 (0.19) 145.3 (0.05) – 22.4 (0.04) 36.7 (0.04) 31.2 (0.03)
Pb 87.1 (0.02) 11.0 (0.01) 4.8 11.5 8.3 2.1 2.3 9.3 (0.01)
Sn 79.7 (0.01) 38.4 (0.02) 21.6 (0.02) 37.4 (0.01) 0.77 0.09 0.0006 9.9 (0.01)
Mn 74.2 (0.01) 35.2 (0.02) 33.7 (0.03) 160.6 (0.06) 48.9 (0.01) 12.01 (0.02) 9.1 (0.01) 41.41 (0.05)
Rb 52.4 (0.01) 8.7 5.9 (0.01) 8.5 4.47 0.71 0.85 1.9
Sb 59.9 (0.01) 201.2 (0.11) 123.6 (0.11) 149.04 (0.06) 24.4 (0.01) 0 0.0006 2.9
Ba 37.3 (0.01) 53.3 (0.03) 47.4 (0.04) 65.8 (0.02) 18.5 8.02 (0.01) 9.9 (0.01) 32.0 (0.03)
Ni 36.5 (0.01) 34.5 (0.02) 27.9 (0.02) 50.2 (0.02) 18.00) 33.1 (0.06) 9.7 (0.01) 14.9 (0.02)
Cr 29.4 (0.01) 53.8 (0.03) 35.8 (0.03) 28.6 (0.01) 41.9 (0.01) 47.7 (0.08) 24.3 (0.03) 29.7 (0.03)
Sr 28.1 (0.01) 15.5 (0.01) 21.2 (0.02) 34.02 (0.01) 17.02 0 0.19 8.1 (0.01)
Cu 24.0 12.3 (0.01) 3.6 9.6 3.99 0.26 0.87 2.8)
Sr 12.6 – – – 17.1 – 0.22 8.9 (0.01)
Li 7.3 15.5 (0.01) 7.8 (0.01) 7.39 0.36 0.32 0.23 0.75
Cd 6.1 1.6 1.0 0.83 1.18 0.05 0.02 0.17
V 5.5 12.4 (0.01) 5.1 10.62 2.14 1.84 2.0 3.35
Mo 5.5 8.0 4.9 3.19 4.56 6.84 (0.01) 2.04 3.2
Cs 5.4 0.9 1.2 0.94 0.11 0.12 0.01 0.17
Hf 4.5 10.8 (0.01) 6.8 (0.01) 4.63 0 0.67 1.03 0.97
As 4.2 4.5 3.1 1.22 0 0 (0) 0.05 0.60
Li 4.0 9.8 5.9 (0.01) 5.82 0.27 0.37 0.16 0.93
Co 3.8 1.1 2.1 35.67 (0.01) 0.86 0.49 0.13 0.33
Ce 3.7 6.8 6.0 (0.01) 9.85 1.06 0.50 0.42 2.03
La 1.8 3.5 2.9 4.78 0.54 0.24 0.25 0.92
Nb 1.5 2.6) 1.4 2.48 0.98 0.46 0.5 0.63
Nd 1.5 2.5 2.4 4.15 0.05 0 (0) – 0.40
Sc 0.69 1.4 1.1) 1.31 0,00 0.02
Be 0.13 0.19 0.2 0.28 0.003 – – 0.03
Ga 0.61 1.15 0.8 0.98 0.2 0.11 0.12 0.37
Ge 0.42 1.02 0.8 0.68 0.01 0.07 0.02 0.11
Se 0.91 – – 0.02 0.59 – 0.20 0.18
Rh 0.02 0.02 0.00002 0.002 – 0.002 0.0002
Te 0.06 0.08 0.08 0.05 0.02 0.02 0.02 0,00
Pr 0.40 0.74 0.7 1.13 0.06 0.01 0.004 0.15
Sm 0.27 0.46 0.45 0.76 0.01 0,00 – 0.07
Eu 0.05 0.08 0.08 0.15 0.01 0.003 – 0.0
Gd 0.31 0.57 0.54 0.86 0.05 0.02 0.001 0.15
Tb 0.04 0.07 0.07 0.10 0.005 – – 0.02
Dy 0.24 0.42 0.40 0.57 0.001 – – 0.05
Ho 0.05 0.09 0.09 0.12 0.01 0.008 0.01 0.03
Er 0.16 0.31 0.28 0.35 0.02 0.03 0.02 0.09
Tm 0.02 0.05 0.05 0.05 0.002 0.003 0.001 0.01
Yb 0.18 0.38 0.32 0.34 0.01 0.02 0.03 0.09
Lu 0.03 0.06 0.08 0.06 0.003 0.005 0.005 0.02
Ta 0.07 0.14 0.09 0.16 0.06 0.02 0.02 0.03
W 0.80 1.63 0.69 0.54 0.26 0.41 0.4 0.3
Tl 0.22 0.01 0.03 0.06 – 0.009 – –
Bi 0.32 0.26 0.02 0.08 0.06 – – 0.08
Th 0.41 0.88 0.79 1.29 0.15 0.09 0.09 0.24
U 0.22 0.43 0.49 0.51 0.03 0.03 0.02 0.09
Total 36 459.9 65 817.6 40 312.2 44 159.2 12 562.9 7874.7 7227.2 18 001.1
Mass (µg m−3 ) 558.8 183.6 114.4 270.0 374.7 56.3 91.6 91.9
www.atmos-chem-phys.net/20/5327/2020/ Atmos. Chem. Phys., 20, 5327–5354, 20205340 A. J. Adon et al.: Physico-chemical characterization of urban aerosols
at the ADF site. Values in traffic sites are of the same order
of magnitude and higher than at the ADF site. The maxi-
mum of Ca and K values may be found at the CT and ADF
sites, respectively. It is interesting to note that Al, K, and Na
concentrations are higher in the dry season than in the wet
season. Such a feature is less clear for Ca, whose seasonal
variability is less marked except at AWB and AT sites. In
terms of Mg, maximum values are observed at the ADF site
and are of the same order of magnitude whatever the season.
Fe abundance is higher at AWB and CT sites than at ADF and
AT sites and higher in DS2017 than in WS2016 everywhere.
The other metals (Ti, P, Zr, Zn, Cr, Mn, Pb, and Ni) repre-
sent less than 0.5 % and 2 % of the total mass in WS2016
and DS2017, respectively, at all sites, with Cr, Mn, Pb, and
Ni exhibiting less seasonal variability compared to the rest of
the metal elements. Figure 12. Dust concentrations at the different study sites for each
To assess the relative contribution of crustal and non- campaign and for the different sizes (C in black, fine in light grey,
crustal origin of elemental aerosol loadings, source enrich- ultrafine in grey).
ment factor (EF) values of a trace element X have been first
calculated with the following formula using both literature
data of the typical elemental composition of the upper con- 3.5 Dust
tinental crust (Mason and Moore, 1982; Taylor, 1964), mea-
sured elemental composition from this study, and Al as a ref- Figure 12 shows dust concentrations calculated from the
erence element as follows: Guinot et al. (2007) methodology (see Sect. 2.3.6) for C and
F particle sizes at the different sites for each season. Note that
[X]atm as for WSI and trace elements and due to our sampling pro-
[Al]atm
EFX = , (1) cedure, there are values for fine and coarse particles for all
[X]soil /[Al]soil seasons except for WS2016 with values for coarse particles
only.
where [X]atm and [Al]atm are the concentrations of the chem- During the wet season, coarse dust concentrations range
ical element X and Al in the atmosphere, respectively, and from 5 to 25 µg m−3 in 2015 and 9 to 37 µg m−3 in 2016,
[X]soil and [Al]soil are the typical concentrations of the el- with higher values at the CT and ADF sites in 2015 and at AT,
ement X and Al in the earth’s crust, respectively. Al is fre- CT, and ADF sites in 2016. In WS2015, fine dust concentra-
quently used as a reference element, assuming that its an- tions range from 12 to 49 with maximum values at ADF and
thropogenic sources in the atmosphere are negligible (Gao CT sites also. During the dry season, values range from 38
et al., 2002; Cao et al., 2005; Xu et al., 2012). In all sam- to 156 µg m−3 in 2016 and from 41 to 116 µg m−3 in 2017,
pling sites, EF values typically lower than 5 are obtained for with maximum concentrations obtained at the CT site, fol-
several trace elements (Be, Sc, Ti, V, Fe, Ga, Sr, Nb, Rh, lowed by the AWB site. When considering mean values of
Ba, La, Ce, Pr, Nd, Sm, Eu, Gd, Tb, Dy, Ho, Er, Tm, Yb, the dry seasons, total dust at the CT site is 2.4 times the val-
Lu, Ta, Th, and U). This suggests a natural origin of these ues found at AT, 1.6 times the value at AWB, and 3.4 times
species (Freitas et al., 2007; Gao et al., 2002). The most en- the value at ADF. Seasonal comparison shows that total dust
riched elements (EF > 100) are Sb, Sn, Zn, Se, Te, Cd, Pb, concentration is higher in the dry seasons than in WS2015
Bi, and Mo at nearly all of the sites, indicating significant by a factor of 3 at the AT site, 2.6 at the CT site, and 4 at
anthropogenic origin (Wang et al., 2006). These elements the AWB site but of the same order of magnitude at the ADF
are mainly emitted into the atmosphere through fossil fuel site.
combustion, traffic emission, wear of brake lining materials,
and industrial processes (Watson and Chow, 2001; Samara 3.6 Aerosol chemical closure
and al., 2003). Secondly, source contributions have been es-
timated from these EF values following the method described The aerosol chemical closure obtained using the Guinot et
by Arditsoglou and Samara (2005). Note that this study refers al. (2007) method (see below) at the different sites for each
to ratios for a limited list of sources, perhaps not includ- season is presented in Fig. 13. Results show clear intra- and
ing the African source specificities. As a result, it may be interannual variations at all of the sites, as well as signifi-
seen that 30 % of trace element concentrations are of anthro- cant differences among the sites. In total, dust accounts for
pogenic origin at the ADF site, while they are about 17 % at 39 %–75 % of the bulk PM mass at both traffic sites, with
the other sites. no clear seasonal cycle and higher contributions in Cotonou
Atmos. Chem. Phys., 20, 5327–5354, 2020 www.atmos-chem-phys.net/20/5327/2020/A. J. Adon et al.: Physico-chemical characterization of urban aerosols 5341
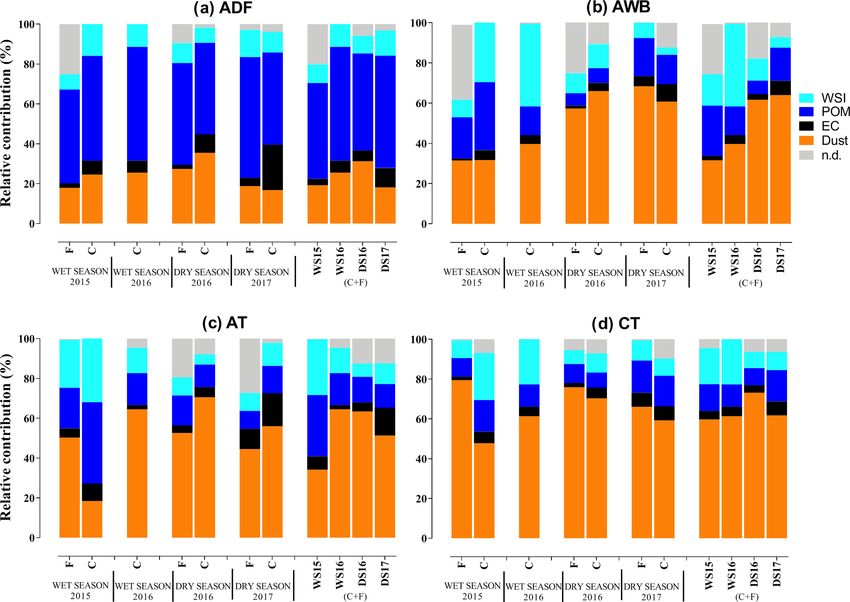
Figure 13. Size-speciated aerosol chemical composition for each site, for each campaign, and each aerosol size.
(Fig. 13c and d). These percentages vary from 32 % to 64 % 4 Discussion
at the AWB site and from 18 % to 35 % at the ADF site, with
percentages 1.8 times higher in the dry season than in the wet A discussion of the results site by site (Abidjan domestic fire
season at the AWB site and no clear seasonal difference at the site, traffic sites both together and waste burning site) will be
ADF site (Fig. 13a and b). Carbonaceous aerosol, the sum of first proposed. We will scrutinize (1) the proximity between
EC, and POM show large contributions at the ADF site (from the sites and the sources, (2) the source specificity with more
49 % to 69 % of the total PM mass), with relatively similar or less incomplete combustion (e.g., wood combustion and
proportions in each season (Fig. 13a). The absence of a clear two-wheel vehicle emission factors are higher than gasoline
seasonal pattern is also observed at the CT site, whereas car- emission factors; Keita et al., 2018), (3) the relative influence
bonaceous aerosol is slightly higher in WS than in DS at the of other local sources or transported sources on the studied
AWB site (23 % and 16 %, respectively) and at the AT site sites such as dust and biomass burning, (4) the occurrence of
(37 % and 21 %, respectively) (Fig. 13b–d). Carbonaceous continental air masses, (5) the variation in the boundary layer
aerosol contribution accounts for about 11 %–49 % of the to- height (as reported by Colette et al., 2007), and (6) the me-
tal mass at both traffic sites with higher values at the AT site teorological parameters (e.g., temperature, relative humidity,
(mean of 30 %) than at the CT site (13 %). The ion percent- and wet deposition) to explain the differences in pollutant
ages in PM fractions present the same pattern at AT, CT, and concentrations and their seasonal and interannual variabili-
AWB sites with higher values in wet than in dry seasons. In ties.
these sites, we may notice that mass concentration in coarse In a second part, we will present comparison of our values
particles is larger in the wet season, while of the same order with other DACCIWA values and also with literature values
of magnitude as the one in fine particles in the dry season. In for other intensive campaigns in Africa.
the ADF site, no marked difference may be found between
the seasons and the sizes (Fig. 13). 4.1 Abidjan domestic fires (ADF)
As shown in the above paragraphs, maximum values are ob-
tained at the ADF site for aerosol mass, EC, OC, WSOC,
water-soluble ionic species (e.g., Cl− , NO− 2+ +
3 , Ca , and K ),
www.atmos-chem-phys.net/20/5327/2020/ Atmos. Chem. Phys., 20, 5327–5354, 20205342 A. J. Adon et al.: Physico-chemical characterization of urban aerosols
and some trace elements such as Mg and K (whereas Al, Na, 1997) is obtained for the ADF site, indicating that this site is
and Fe are lower than in the other sites). Also, aerosol PM2.5 also impacted by traffic sources.
values are well above the annual and daily WHO guidelines High values of WSOC / OC ratios are expected to be
of 25 and 10 µg m−3 , respectively, whatever the season. harmful to health (Ramgolam et al., 2009; Val et al., 2013).
Such a pattern is due to the proximity of the ADF site to This effect is being enhanced by the particulate size mea-
the studied combustion source; in that area, the use of wood sured at this site (Kim et al., 2003; Wilson et al., 2002). In-
combustion is very active due to commercial activities of deed, the relative mass distribution of PM and OC particle
women drying fish and meat and domestic cooking. This is sizes shows a major contribution of particles less than 1 µm
also confirmed by the high relative importance of total car- (as high as 85 % of PM). This could be due to the fact that
bon in aerosol mass whatever the size (49 %–69 %) and by carbonaceous aerosols are formed near emission sources and
values of the source enrichment factor. Indeed, at least 30 % are mainly of submicron size (Boucher, 2012). Nevertheless,
of trace element concentrations are of anthropogenic origin note that EC also presents a large coarse-particle contribu-
at the ADF site. In addition, wood combustion is well known tion. This could be due to the importance of wood burning
to be highly polluting due to incomplete combustion; this is at this site with less efficient combustion and large particle
shown here by the measurements of very high OC / EC ratios emissions (Watson et al., 2011).
at ADF, on the order of the one measured at the source level In terms of seasonality, higher concentrations of aerosol
by Keita et al. (2018). This is also shown by WSOC relative mass, OC, WSOC, EC, and total water-soluble ionic species
importance, which is expected for wood burning following (SO2− + −
4 , NH4 , and NO3 ) are observed in WS2015 and
Yu et al. (2020), Tang et al. (2016), Feng (2006), and Sax- WS2016 than in DS2016. This may be explained by a more
ena and Hildemann (1996), and by the strong correlation of incomplete combustion in the wet seasons than in DS2016
WSOC with biomass burning K+ tracer. due to the use of moist wood for cooking and smoking fish,
Chloride is most likely associated with the sea salt ori- which leads to large amount of smoke and higher particulate
gin (normal chloride concentrations represent at least 55 % emission factor values. Note that DS2017 values are as im-
of marine aerosols following Goldberg, 1963) or secondary portant as the ones of wet seasons, which will be explained
aerosol production (Li et al., 2016). Since chloride relative later in the text. With regard to WSOC, their variabilities may
concentration at the ADF site remains lower than the that of be also linked to meteorological factors, such as solar radi-
sea salt aerosols, the secondary production source would be ation (Tang et al., 2016; Favez et al., 2008) and relative hu-
the better explanation for high chloride concentrations ob- midity (Liang et al., 2016). At the ADF site, temperatures
served at ADF. The size distributions of Cl− , K+ , NH+ 4 , and are roughly similar in both seasons. However, RH variability
2− may play a role since it is higher in the wet season than in
SO4 support this conclusion; the predominance of these el-
ements in fine-particle mode at the ADF site would be as- the dry season. Finally, our results indicate no clear seasonal
sociated with anthropogenic emissions, particularly biomass cycle for Cl− , which confirms its anthropogenic origin, as
combustion and domestic fires, or with secondary inorganic previously shown.
aerosol origin. This is confirmed by Cl− /Na+ ratio values
as shown earlier. Contrarily, Ca2+ and NO− 3 contributions to
4.2 Traffic sites (Abidjan traffic and Cotonou traffic
the total ions at the ADF site peak mainly in the large par- sites)
ticle fraction and may be attributed to quasi-natural origin,
primarily to dust emissions and nitrate formation by reaction Let us recall first that the two traffic sites have been chosen
processes, respectively. In addition, Na+ and Mg2+ display since they are representative of the traffic diversity in West
similar size distributions at the ADF site, with the major con- Africa. At the CT site, both personal cars, taxis, and an im-
tribution in the coarse particle fraction, suggesting the com- portant two-wheel fleet may be found, whereas at the AT site,
mon sea salt origin of these two elements (Belis et al., 2013). there are buses, taxis, and personal cars. Also, the distance
As we have shown above, the lower proportion of metal between the site and the traffic sources is the same for the
elements at the ADF site (6.5 % of the bulk concentration) two traffic sites, slightly larger than the distance between the
can be explained by the less dominant influence of resus- site and the wood burning sources at the ADF site.
pended dust particles compared to traffic sources. Elements In these two sites, concentrations are high with PM2.5 val-
such as Cr, Mn, Pb, and Ni have less seasonal variability than ues well above the WHO guidelines. Average aerosol mass,
other metallic elements. These small proportions of these EC, OC, dust, and water-soluble ionic concentrations (with
non-crust elements suggest a low contribution of elements NO− 3 and Ca
2+
maximal at AT and CT sites, respectively)
emitted mainly by anthropogenic activities such as industrial are higher at the CT than at the AT site by a factor of 1.5 to
processes (Viana et al., 2007, 2008; Minguillón et al., 2014). 2. Note that this poor air quality found in Cotonou has been
Finally, the Zn/Cd ratio has been also examined. A value of reported by Cachon et al. (2014). The higher values found in
29 close to ratio reported for gasoline vehicle (27, Qin et al., Cotonou could be due to more intense traffic in Cotonou than
in Abidjan. Also in Cotonou, this traffic is associated with the
lack of public transportation and the use of highly polluted
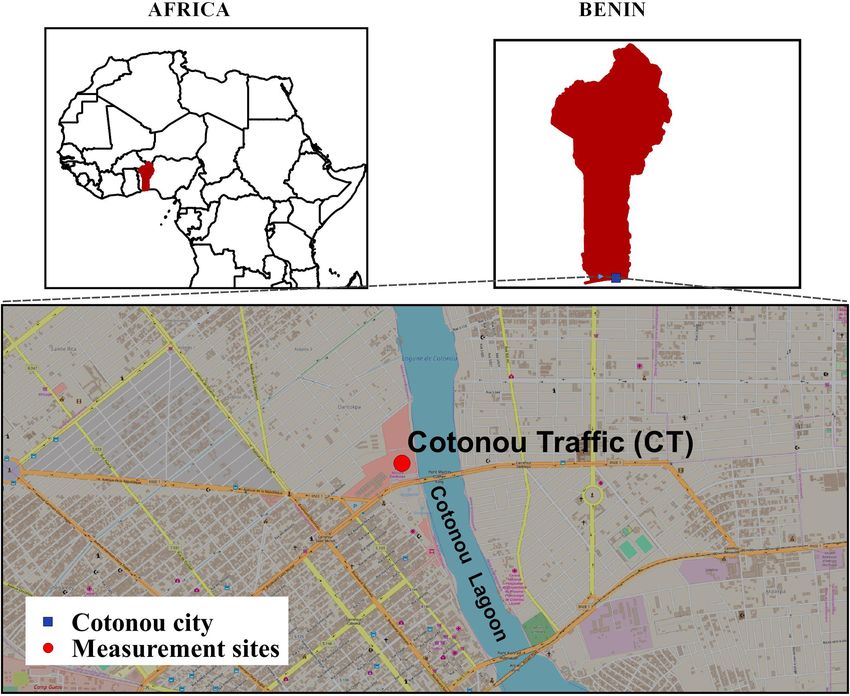
Atmos. Chem. Phys., 20, 5327–5354, 2020 www.atmos-chem-phys.net/20/5327/2020/A. J. Adon et al.: Physico-chemical characterization of urban aerosols 5343 Figure 14. MODIS Aerosol optical depth regional distribution over West Africa. Data are for 2017, focusing on our campaign date at Abidjan (a–c 11–12 January, left part) and Cotonou (b–d 6–7 January, right part). mopeds (aged over 15 years) (Gounougbe, 1999; Avogbe et cles, and anthropogenic aerosols from the surrounding coun- al., 2011), despite the effort in the last 10 years to restrict tries (Fig. 5). Note also that source enrichment factor values their use. Several studies such as MMEH (2002) have shown show that about 17 % of trace element concentrations are of that more than 94 000 mopeds and 350 000 secondhand ve- anthropogenic origin at both traffic sites and that the relative hicles are in circulation in Cotonou. Other factors contribut- importance of total carbon in mass is higher at the AT than at ing to the local pollution include outdoor restaurants using the CT site. charcoal and motorcycle garages, which are more present Aerosol mass, composition, and size depend on the sea- around the Cotonou traffic site compared to the Abidjan site. son, and the two traffic sites are differently affected. The EC It also includes anthropogenic dust. Indeed, at Cotonou, the and OC concentrations measured in both traffic sites and av- lack of road infrastructure favors the resuspension of dust eraged per season are higher in dry than in wet season. Such particles. Finally, other sources may potentially influence variations may be explained by several factors: particulate aerosol seasonal composition in these two sites, including wet deposition occurring during the wet season, reduction in marine aerosols, transported dust and biomass burning parti- traffic flow due to school vacations, and meteorological in- www.atmos-chem-phys.net/20/5327/2020/ Atmos. Chem. Phys., 20, 5327–5354, 2020
5344                                                  A. J. Adon et al.: Physico-chemical characterization of urban aerosols

fluence. Higher EC and OC concentrations are obtained at           ratio increases in the fine particles (5.07 during the wet sea-
the CT rather than at the AT site in dry seasons, whereas no       son and 2.53 during the dry season), while that of NO−    3 /Ca
                                                                                                                                   2+

statistical difference may been found between the two sites        remains almost constant (2.86 during the wet season and 1.65
in wet seasons. Such a result is mainly explained by Fig. 5.       during the dry season). This implies that the atmosphere at
In wet seasons, similar a back-trajectory pattern may be ob-       AT and CT sites is enriched by SO2−        4 formed as anthro-
served for both sites, whereas in dry seasons, the CT traf-        pogenic secondary particles, possibly from sulfur-containing
fic site only would be influenced by Nigerian anthropogenic        pollution sources (Seinfield and Pandis, 1998), particularly
sources.                                                           in fine-particle mode, and by NO−       3 mostly coming from
   In terms of WSOC concentrations, concentrations at the          nitrogen-containing sources in all particle sizes. The higher
AT site are on average higher than those recorded at the CT        contributions of these elements during the dry season could
site in the wet season but lower in the dry season. The pres-      result from a combination of several factors: (1) an atmo-
ence of dust can produce semivolatile organic gas scaveng-         sphere loaded with dust favoring heterogeneous chemistry
ing and therefore WSOC and OC enhancement. Such a phe-             to obtain secondary aerosol and the rise of biomass burn-
nomenon can explain the highest WSOC concentrations ob-            ing emissions; (2) the increase in photochemical activity and
served in the dry season at the CT site where dust concen-         higher concentrations of hydroxyl radicals in the dry season,
trations are highest (see dust paragraph). Moreover, this can      which can oxidize SO2 from combustion (Arndt et al., 1997)
also explain why the maximum WSOC values are in coarse             to SO2−4 (Li et al., 2014); and (3) the wind transport of an-
particles at the CT site, while at the AT site maximum values      thropogenic secondary particles from the industrial zone lo-
are in ultrafine particles.                                        cated upstream from our sites. Finally, the proportion of Cl−
   Total WSI concentrations are larger at the AT site in the       relative to the total mass of ions is highest for coarse particles
wet than in the dry season with higher values in coarse parti-     at both traffic sites especially during the wet season, suggest-
cles. At the CT site, total WSI concentrations in fine particles   ing that Cl− at AT and CT sites has a natural origin and is
are higher in the dry than in the wet season, whereas the same     probably from sea salt emissions.
values are obtained in coarse particles for both seasons. Note        If we focus now on dust during the two wet seasons, con-
that CT values are generally higher than AT values with a          centrations are higher in 2016 than in 2015 at CT and AT
more important contribution of fine particles in the dry sea-      sites for coarse particles (no data of fine particles are avail-
son. These WSI variations can be explained by the relative         able in WS2016). This is consistent with observed aerosol
importance of Ca2+ , SO2−              −
                            4 , and NO3 at both sites.             optical depth (AOD) values at the CT site, which increased
   First, the Ca2+ contribution to total WSI is higher at the      by a factor of 2 between 2015 and 2016. No AOD value is
CT site than at the AT site, with no clear seasonal variation      given by Léon et al. (2019) at Abidjan in WS2015 to allow
at the CT site and higher values in the dry season than in         such a comparison in Abidjan. Moreover, during the wet sea-
the wet season at the AT site. Also at the CT site, fine, and      son, an Angström coefficient (AE) on the order of 1 has been
coarse Ca2+ particles are in the same range, whereas coarse        found at the CT site, indicating smaller particles that could be
Ca2+ particles are predominant at the AT site. Such a feature      due to road resuspension. It is interesting to note that during
may be explained by the impact of dust sources including           WS2016, AOD and AE are, respectively, higher and lower at
long-range dust transport at Abidjan and a combination of          Abidjan than at Cotonou. Again, this is consistent with our
long-range dust transport and road resuspension at Cotonou.        dust concentrations at the CT site. In Abidjan, we could as-
   Second, the relative contribution of SO2−       +
                                            4 , NH4 , and NO3
                                                              −
                                                                   sume that another source of Ca2+ , which is not taken into ac-
as a percentage of total WSI in the different particle modes is    count in our dust calculations, may explain our dust concen-
reduced in the wet season. During the wet season, the clean        tration data. That may be the result of anthropogenic Ca2+
winds surrounding the ocean before reaching the measure-           emissions from residential combustion, more important in
ment sites could contribute to lower the proportion of these       2016 than in 2015 as shown earlier (http://naei.beis.gov.uk/
species, in addition to the scavenging processes during the        overview/pollutants?pollutant_id=84, last access: 3- Decem-
rainy days. Unlike the wet season, a relatively good corre-        ber 2019).
lation with r 2 of 0.87 (SO2−               +            −
                               4 versus NH4 ), 0.73 (NO3 ver-         The relative contribution of dust generally peaks in the
                             2−
sus NH+                                   −
         4 ), and 0.87 (SO4 versus NO3 ) has been found in
                                                                   coarse mode and, to a lesser extent, in the fine mode, reflect-
coarse particles, indicating similar sources for these three       ing a natural origin. It is interesting to note that the dust con-
species during the dry season. In order to try to identify         tribution observed in this study for the year 2016 at the Abid-
these sources, the ratios of SO2−4 /Ca
                                       2+
                                          and NO− 3 /Ca
                                                        2+
                                                           have    jan site is in agreement with the results of Xu et al. (2019)
                                      2−
been determined. The average SO4 /Ca and NO3 /Ca2+
                                            2+                     which show a PM2.5 dust contribution of 35 %–50 % com-
ratios in combined coarse particles (1.07 and 2.58 during          pared to our values of 18 %–52 %.
the wet season and 0.33 and 1.60 during the dry season) are
higher than the corresponding ratios for typical soil (0.026
and 0.003, respectively). On the other hand, the SO2−  4 /Ca
                                                             2+

Atmos. Chem. Phys., 20, 5327–5354, 2020                                              www.atmos-chem-phys.net/20/5327/2020/
You can also read