Network Options Assessment Report Methodology - National Grid ESO
←
→
Page content transcription
If your browser does not render page correctly, please read the page content below

Network Options
Assessment Report ;
Methodology

System Operator

April 2018

 Version                    DRAFT 4.0
 Date                       9 April 2018

 About this document

 This document contains National Grid’s Network Options Assessment (NOA) report
 methodology established under NGET Licence, Licence Condition C27 in respect of the
 financial year 2018/19. It covers the methodology on which NGET, in its role as SO, will
 base the NOA which will be published by 31 January 2019. As the methodology evolves due
 to experience and stakeholder feedback, the methodology statement will be revised for
 subsequent NOAs as required by Licence Condition C27

National Grid System Operator                                                                                               April 2018

Network Options Assessment Report Methodology

Table of Contents

Section 1: Introduction ............................................................................................................ 4
   Purpose ............................................................................................................................... 4
   Key changes for 2018/19 .................................................................................................... 4
   Key similarities to 2016/17 .................................................................................................. 5
   Background ......................................................................................................................... 6
   Differences between NOA and ETYS ................................................................................. 6
   The methodology ................................................................................................................. 7
      Major National Electricity Transmission System Reinforcements .................................... 8
      Eligibility criteria for projects for inclusion / exclusion ...................................................... 9
      Roles and responsibilities of SO and TOs ....................................................................... 9
   Stakeholder consultation ................................................................................................... 10
      Methodology review ....................................................................................................... 10
      Report output ................................................................................................................. 10
   Provision of Information ..................................................................................................... 11
      Engagement with interested parties to share relevant information and how that
      information will be used to review and revise the NOA methodology ............................ 11
      Future developments ..................................................................................................... 11
Section 2: The NOA report process ...................................................................................... 12
   Overview of the NOA report process ................................................................................. 12
   Collect Input ...................................................................................................................... 12
      Updated Future Energy Scenarios ................................................................................ 12
      Sensitivities .................................................................................................................... 13
      Interconnectors .............................................................................................................. 14
      Offshore Wider Works (OWW) ...................................................................................... 14
      Latest version of National Electricity Transmission System Security and Quality of
      Supply Standard (NETS SQSS) .................................................................................... 15
   Identify future transmission boundary capability requirements ......................................... 15
      National generation and demand scenarios .................................................................. 15
   Identify NOA options ......................................................................................................... 16
      Basis for the cost estimate provided for each option ..................................................... 19

NOA Report Methodology – DRAFT 4.0 – 09/04/18                                                                           Page 1 of 99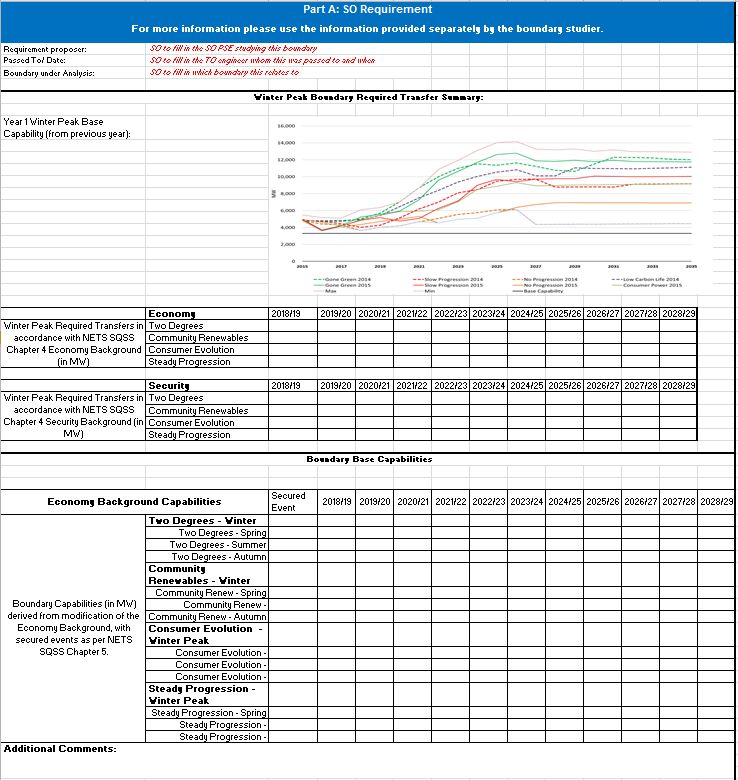
National Grid System Operator                                                                                            April 2018

     Environmental impacts and risks of options .................................................................. 20
     Checks of the costs that the TOs submit ....................................................................... 20
  Build GB model ................................................................................................................. 20
  Boundary capability assessment for options ..................................................................... 21
  Cost-benefit analysis ......................................................................................................... 23
     Introduction .................................................................................................................... 23
     Cost-benefit analysis methodology ................................................................................ 24
     Constraint cost modelling tool ........................................................................................ 26
  Selection of recommended option ..................................................................................... 26
     Single year least regret decision making ....................................................................... 27
     Process output ............................................................................................................... 30
     Cost bands..................................................................................................................... 31
  Report drafting ................................................................................................................... 31
  Report publication ............................................................................................................. 32
Section 3: Network Options Assessment for Interconnectors ............................................... 34
  Overview ........................................................................................................................... 34
     Structure of this section ................................................................................................. 35
  Key changes for 2018/19 methodology ............................................................................. 35
  Key similarities to 2017/18 methodology ........................................................................... 36
  Factors for the assessment of future interconnection ....................................................... 36
     Costs included within the methodology scope ............................................................... 36
     Costs outside the methodology scope ........................................................................... 38
  Cost estimation for interconnection capacity ..................................................................... 38
  Cost estimation for network reinforcements ...................................................................... 40
  Components of welfare benefits of Interconnectors .......................................................... 41
     Introduction .................................................................................................................... 41
     Social and Economic Welfare ........................................................................................ 41
     Effects on Interconnected markets ................................................................................ 41
  Constraint cost implications of interconnection ................................................................. 43
  Ancillary services ............................................................................................................... 43
  BID3 model ........................................................................................................................ 45
  Options included in the assessment .................................................................................. 46
  Interconnection Assessment Methodology ........................................................................ 47
     Optimisation of GB-Europe Interconnection Process .................................................... 47
     Modelling inputs ............................................................................................................. 48
     Market modelling ........................................................................................................... 48

NOA Report Methodology – DRAFT 4.0 – 09/04/18                                                                         Page 2 of 99
National Grid System Operator                                                                                                April 2018

   Further Output ................................................................................................................... 51
   Process Output .................................................................................................................. 51
Section 4: Suitability for third party delivery and tendering assessment ............................... 52
   Overview ........................................................................................................................... 52
      Connections ................................................................................................................... 53
      Bundling/splitting of work packages ............................................................................... 53
      Bundling ......................................................................................................................... 53
      Splitting .......................................................................................................................... 54
      Competition criteria ........................................................................................................ 54
Section 5: SO process for Offshore Wider Works ................................................................. 59
   Foreword ........................................................................................................................... 59
   Offshore Wider Works – developer associated overview .................................................. 60
   Offshore Wider Works – developer associated: the SO’s role .......................................... 61
      Offshore Wider Works – developer associated process flow diagram........................... 67
   Offshore Wider Works – non developer associated overview ........................................... 68
   Offshore Wider Works – non developer associated process ............................................ 70
      Offshore Wider Works – non developer associated process flow diagram.................... 75
Appendix A: NOA study matrix ............................................................................................. 76
Appendix B: Validation checks of seasonal scaling factors .................................................. 77
Appendix C: NOA process flow diagram ............................................................................... 79
Appendix D: System requirements form template ................................................................ 80
Appendix E: Process for checking NOA option cost reasonableness ................................... 90
Appendix F: Form of the report ............................................................................................. 95
Appendix G: Summary of stakeholder feedback ................................................................... 98

NOA Report Methodology – DRAFT 4.0 – 09/04/18                                                                            Page 3 of 99
National Grid System Operator April 2018
Section 1: Introduction
Purpose
1.1 The purpose of the Network Options Assessment (NOA) is to facilitate the
development of an efficient, coordinated and economical system of electricity
transmission consistent with the National Electricity Transmission System Security
and Quality of Supply Standard and the development of efficient interconnection
capacity.
1.2 This document provides an overview of the aims of the NOA and details the
methodology which describes how the System Operator (SO) assesses the required
levels of network transfer requirement, the options available to meet this requirement
and the SO’s recommended options for further development. It is important to note
that whilst the SO recommends progressing options in order to meet system needs,
any investment decisions remain with the Transmission Owners (TOs) or other
relevant parties as appropriate.
1.3 This methodology document describes the end to end process for the analysis and
publishing of the NOA report and identifies the roles and responsibilities of the SO
and TOs.
1.4 Where this methodology refers to ‘TOs’, it means onshore TOs.
Key changes for 2018/19
1.5 We are extending the process to assess eligibility for competition to new connections
for the first time. It builds on the existing process that we have used for wider works.
The process uses the same criteria of high value, new and separable, which are
detailed further in Ofgem’s latest publications1.
1.6 To ensure that the NOA is making the right decisions to maximise consumer value
we are expanding the needs that the process covers in addition to the range of
options we assess. This year we are undertaking pathfinding projects trialling
analysis of additional system needs and including options from non-TO sources.
Where relevant we intend to include any applicable options in the 2018/19 economic
analysis. We will report the pathfinding projects separately on our NOA webpage.
The pathfinding projects being considered are as follows:
i. Regional Development Programme (RDP) learnings – Taking the learnings to
develop processes and requirements for data exchange with a DNO in order to
be able to submit and assess distribution options (at appropriate voltage tiers)
to meet transmission system needs for cost-benefit assessment. This is aimed
for early summer.
1
https://www.ofgem.gov.uk/electricity/transmission-networks/competition-onshore-transmission
NOA Report Methodology – DRAFT 4.0 – 09/04/18 Page 4 of 99National Grid System Operator April 2018
ii. High Volts - Assessment of high volt needs on the system, including
assessment of options from both transmission and distribution networks and
cost-benefit on non-MW system requirements. This is aimed for late summer.
We are also developing the process to facilitate the inclusion of market participants in
the provision of options associated with bulk power transfer. To this end, it is crucial
for us to work closely with other affected parties through the ENA Open Networks
Projects2. This is aimed for late summer / early autumn, with results published with
the 2018/19 NOA.
1.7 We are also enhancing and evolving the way we undertake our analysis. We
recognise that the most challenging system needs are no longer just at winter peak,
but that other periods such as at low demand in the summer also give rise to
demanding network conditions. As such we are conducting a case study of the use of
probabilistic analysis to identify year round thermal requirements for a portion of the
network, providing a comparison of this against our current approach. We aim to
publish this case study in early autumn.
1.8 Following major changes to the SRF template in 2017/18, and subsequent feedback
following use in the 2017/18 process we have refined the template. This takes into
account the feedback received and aims to deliver a smoother handover process of
information for this cycle.
1.9 We have consolidated the other NOA area methodologies as sections in the overall
NOA methodology. These are:
NOA for interconnection (NOA IC)
SO process for Offshore Wider Works
1.10 Building on improvements to last year’s NOA IC, this year the methodology is
expanded to reflect the inclusion of the NOA results in the base network for analysis
and also to include investigation of the benefit that interconnectors provide to GB
consumers.
Key similarities to 2016/17
1.11 The overall NOA process and philosophy are the same as used last year. Our NOA
Methodology Review that we submitted to Ofgem in March 2017 concluded that
single year regret analysis is the best way to evaluate the needs of the national
electricity transmission system. You can find the review document at
https://www.nationalgrid.com/sites/default/files/documents/NOA%20Methodology%2
0Review%202017.pdf.
1.12 For NOA 2017/18 we successfully brought in the NOA Committee, implied
probabilities and cost checking. These improvements delivered additional scrutiny to
the inputs and output of the cost-benefit assessment ensuring that the
recommendations we make are in the best interest of consumers. We will continue to
2
http://www.energynetworks.org/electricity/futures/open-networks-project/open-networks-project-overview/
NOA Report Methodology – DRAFT 4.0 – 09/04/18 Page 5 of 99National Grid System Operator April 2018
refine and build on these areas during 2018/19. You can find the minutes of the NOA
Committee meetings on the NOA webpage at www.nationalgrid.com/NOA.
Background
1.13 In order to recommend options, the SO uses the established investment
recommendation process. This ultimately leads to the selection of recommended
options based upon their capital investment and constraint savings across a range of
scenarios. Constraint costs are a factor of bid/offer prices and the amount of
generation constrained. Both factors vary across the scenarios resulting in no one
scenario necessarily seeing higher constraint costs than another.
1.14 The SO performed seasonal validation checks for boundaries assessed in the first
NOA report. The constraint cost modelling tool (ELSI at that time) used assumptions
to scale the boundary capabilities across seasons. It scaled the capabilities from the
winter reference values to values for other seasons and also for outages. The
purpose of the seasonal validation checks was to see how the scaled values
compared with the values from technical studies of the same boundaries. The
validation checks showed that the assumptions were broadly correct and needed
only slight adjustment. Appendix B gives a more detailed review of the seasonal
validation checks.
1.15 The NOA report process was built on the Network Development Policy (NDP)
process and extended its use to the whole Great Britain (GB) transmission system.
The NDP is part of the evaluation of National Grid TO investment under its volume-
driver (Incremental Wider Works (IWW)) framework). As such, the NDP is a National
Grid TO document and the TO produces the NDP’s necessary outputs.
1.16 This methodology describes the process and the headers used follow the flow
diagram in Appendix C for clarity. Appendix D contains the SRF template; Appendix
E is the cost checking process; and Appendix F is the form of the NOA report.
1.17 In accordance with Standard Licence Condition C27, the SO has sought the input of
stakeholders. Appendix G includes a summary of any views that the SO has not
accommodated in producing this NOA report methodology.
Differences between NOA and ETYS
1.18 The NOA process is an obligation under NGET Licence, Standard Licence Condition
C27 (The Network Options Assessment process and reporting requirements).
Specifically, paragraph 15 defines the required contents of the NOA report, which are
the SO’s best view of options for reinforcements for the national electricity
transmission system together with alternatives and recommended options.
1.19 The Electricity Ten Year Statement (ETYS) is an obligation under NGET Licence,
Standard Licence Condition C11 (Production of information about the national
electricity transmission system). Paragraph 3 defines ETYS’s required contents
which are the SO’s best view of the design and technical characteristics of the
development of the national electricity transmission system and the system boundary
transfer requirements.
NOA Report Methodology – DRAFT 4.0 – 09/04/18 Page 6 of 99National Grid System Operator April 2018
1.20 In summary, ETYS describes technical aspects of the system and the system’s
development while NOA describes options for reinforcement to meet system needs.
The methodology
1.21 The Network Options Assessment (NOA) process set out in Standard Licence
Condition C27 of the NGET Licence facilitates the development of an efficient,
coordinated and economical system of electricity transmission and the development
of efficient interconnection capacity. This NOA report methodology has been
developed in accordance with Standard Licence Condition C27 of the NGET licence.
1.22 This document defines the process by which the NOA is applied to the onshore and
offshore electricity transmission system in GB. The process runs from identifying a
future reinforcement need, to assessing available options to meet this need, to
recommending and documenting the option(s) for further development. It also defines
the process of assessing the suitability of recommended options for competition in
onshore electricity transmission. This assessment is against criteria defined by
Ofgem in their document Guidance on the Criteria for Competition3. The SO identifies
and evaluates alternative options such as those based around commercial
arrangements or reduced-build options in addition to those provided by the TOs.
Error! Reference source not found. on page 18 covers these alternative options in
more detail.
1.23 The SO has engaged with the TOs to develop this methodology statement. Following
publication of the NOA report, further stakeholder engagement is undertaken to
inform the methodology statement for supporting subsequent NOA reports.
1.24 As background information changes and new data is gained, for example in response
to changing customer requirements, both the recommended options and their timing
will be updated, driving timely progression of investment in the electricity
transmission system.
1.25 The SO engages stakeholders on the annual updates to the key forecast data used
in this recommendation process, and shares the outputs from this process through
the publication of the NOA report.
1.26 Transmission Licence Standard Condition C27 Paragraph 15 sets out the contents of
the NOA report. The licence condition is undergoing consultation and review 4 but this
process will finish after the NOA methodology is submitted to Ofgem. We will take a
view on reviewing the NOA methodology once the revised licence condition is
published.
Each NOA report (including the initial NOA report) must, in respect of the current
financial year and each of the nine succeeding financial years:
(a) set out:
(i) the licensee’s best view of the options for Major National Electricity Transmission
3
https://www.ofgem.gov.uk/system/files/docs/2018/01/draft_criteria_guidance.pdf
4
https://www.ofgem.gov.uk/publications-and-updates/consultation-changes-standard-licence-condition-c27
NOA Report Methodology – DRAFT 4.0 – 09/04/18 Page 7 of 99National Grid System Operator April 2018
System Reinforcements (including any Non Developer-Associated Offshore Wider Works
that the licensee is undertaking early development work for under Part D), and additional
interconnector capacity that could meet the needs identified in the electricity ten year
statement (ETYS) and facilitate the development of an efficient, co-ordinated and
economical system of electricity transmission;
(ii) the licensee’s best view of alternative options, where these exist, for meeting the
identified system need. This should include options that do not involve, or involve
minimal, construction of new transmission capacity; options based on commercial
arrangements with users to provide transmission services and balancing services; and,
where appropriate, liaison with distribution licensees on possible distribution system
solutions;
(iii) the licensee’s best view of the relative suitability of each option, or combination of
options, identified in accordance with paragraph 15(a)(i) or (ii), for facilitating the
development of an efficient, co-ordinated and economical system of electricity
transmission. This must be based on the latest available data, and must include, but
need not be limited to, the licensee’s assessment of the impact of different options on the
national electricity transmission system and the licensee’s ability to co-ordinate and
direct the flow of electricity onto and over the national electricity transmission system in
an efficient, economic and co-ordinated manner; and
(iv) the licensee’s recommendations on which option(s) should be developed further to
facilitate the development of an efficient, co-ordinated and economical system of
electricity transmission;
(b) be consistent with the ETYS and where possible align with the Ten Year Network
Development Plan as defined in standard condition C11 (Production of information about
the national electricity transmission system), in the event of any material differences
between the Ten Year Network Development plan and the NOA report an explanation of
the difference and any associated implications must be provided; and
(c) have regard to interactions with existing agreements with parties in respect of
developing the national electricity transmission system and changes in system
requirements.
1.27 References to ‘weeks’ in the NOA report methodology are to calendar weeks as
defined in ISO 8601. Week 1 is at the start of January and is the same as the system
used the Grid Code OC2.
Major National Electricity Transmission System Reinforcements
1.28 Standard Licence Condition C27 Section C refers to the term Major National
Electricity System Reinforcements for the purpose of this NOA report methodology
statement. The definition has been agreed from consultation with the onshore TOs
and the Authority (Ofgem) as:
Major National Electricity Transmission System Reinforcements are defined by the
SO to consist of a project or projects in development to deliver additional boundary
capacity or alternative system benefits as identified in the Electricity Ten Year
Statement or equivalent document.
1.29 The intention of this definition is to maximise transparency in the investment
decisions affecting the National Electricity Transmission System while omitting
schemes that do not provide wider system benefits. Such system benefits might be a
user connection or improved system reliability.
NOA Report Methodology – DRAFT 4.0 – 09/04/18 Page 8 of 99National Grid System Operator April 2018
Eligibility criteria for projects for inclusion / exclusion
1.30 The NOA report presents projects as options to reinforce the wider network that are
defined by Major National Electricity System Reinforcements (see definition above).
1.31 The SO provides a summary justification for any projects that are excluded from
detailed NOA analysis.
1.32 Once a Strategic Wider Work’s (SWW) needs case has been approved by Ofgem,
the option is excluded from the NOA analysis although the report refers to it and it is
included in the baseline. This is due to it being managed through the separate SWW
process. Ofgem have agreed the approach of excluding options where they have
already agreed the SWW needs case. The NOA report will include analysis of
options under construction that are funded through the IWW mechanism.
Roles and responsibilities of SO and TOs
1.33 The SO role and responsibilities are based around its overview of the network
requirements. Specific role areas are as follows:
analysis of UK FES data
joint technical analysis of boundary capabilities of the base network and uplifts
from reinforcement options for England and Wales in conjunction with NGET
TO
devising and developing alternative options including operational options,
commercial agreements and OWW
identifying boundary transfer requirements and issuing SRF to TOs
verification studies of some boundary analysis performed by the TOs to
corroborate the TOs’ analysis
review of reinforcement options and their cost estimates that the TOs propose
assessment of outages and other system access availability that might affect
the options’ Earliest in Service Dates (EISD)
running cost-benefit analysis studies
recommending options for further development
assessing eligibility for competition
advice on the performance of boundary reinforcement proposals in the cost-
benefit analysis to facilitate further option development by the TOs
provision of an explanation of the NOA Committee recommendations
production and publication of the NOA report.
1.34 The TOs’ roles and responsibilities include:
technical analysis of boundary capabilities of the base network and uplifts from
reinforcement options
proposing and developing reinforcement options and reduced-build options and
providing their technical information to the SO
cost information for options
outage and system access requirements for options
environmental information for options
NOA Report Methodology – DRAFT 4.0 – 09/04/18 Page 9 of 99National Grid System Operator April 2018
consents and deliverability information for options
EISD of options
stakeholder engagement (following review of draft outputs)
community engagement
review of the draft NOA report and appendices relating to TO options.
Stakeholder consultation
1.35 The SO has consulted with the TOs and Ofgem whilst preparing this NOA report
methodology.
1.36 The key consultation areas are the NOA methodology, form of the NOA report and
the NOA report outputs and contents.
1.37 This section shows the timescales for the SO’s consultation of stakeholders during
the period of writing the NOA report.
Methodology review
1.38 The SO seeks stakeholder views annually for consideration and where appropriate
implementation before the NOA process starts its annual cycle.
1.39 Following the final publication of the NOA report, the SO undertakes an internal
review of the NOA process. This is completed within 18 weeks of the publication of
the NOA report with the publication of an updated NOA methodology. This is then
open for stakeholders’ consultation where comments/feedback are invited. The
consultation will close six weeks after the methodology is published for consultation.
The SO considers these comments for a revised NOA methodology and submits the
methodology to Ofgem by 1 August 2018.
Report output
1.40 The SO makes available selected parts of the pre-release NOA report to key
stakeholders, particularly the relevant TOs, on a bilateral discussion basis to ensure
confidentiality obligations. This is as the NOA report is being written based on
assessment data, particularly economic data, becoming available. These discussions
will occur as results become available and the report is being drafted.
1.41 Further key stakeholder engagement occurs with release of drafts of the NOA report,
three weeks ahead of publication. This provides a final opportunity for stakeholders
to comment on the NOA report and raise any significant concerns. When a
stakeholder expresses concern with the conclusions of the report, a comment is
incorporated in the relevant section(s).
1.42 The SO seeks approval from the Authority (Ofgem) on the NOA report methodology
and form of the NOA report as part of the annual stakeholder engagement process.
NOA Report Methodology – DRAFT 4.0 – 09/04/18 Page 10 of 99National Grid System Operator April 2018
Provision of Information
Engagement with interested parties to share relevant information and how that
information will be used to review and revise the NOA methodology
1.43 The NOA methodology and NOA report adequately protects any confidential
information provided by stakeholders or service providers, for example, balancing
services contracts. For this reason, this methodology seeks to be as open and
transparent as possible to withstand scrutiny and provide confidence in its outcomes,
while maintaining confidentiality where necessary.
1.44 In accordance with Licence Condition C27 Part C, the SO provides information to
electricity transmission licensees, interconnector developers and to the Authority
(Ofgem) if requested to do so. The SO will assist TOs with cost-benefit analysis for
SWW needs cases.
Future developments
1.45 The SO expects the following changes and developments in the NOA report
methodology and process as it evolves:
Building on the pathfinding projects to test distribution solutions as NOA options
including identifying non-MW requirements and the necessary cost-benefit
analysis methodology.
Further refinement of the process for SO-led options building on our
experience.
Modification of the process for assessing eligibility for competition taking into
account developments in the legislative framework and our experience with
assessments to date.
Probabilistic tools that would need a high level of automation and facilitate:
a) Year round (24/7/365) consideration of a wide range of possible
outturns for demand and generation to ensure that potential operational
issues are discovered and also understood on the basis of the likelihood
of that condition occurring (such as varying mixes of renewable
generators, for example, wind and solar PV on a regional basis)
b) Automation of study set-up and contingency analysis
c) Automated result handling and filtering.
Our current work is related to a thermal probabilistic case study to investigate the
concept that aims to assess the viability of using probabilistic tools for thermal studies
in the year 2019. Having gained experience with thermal studies that includes
performance levels and validation, we envisage voltage and any other elements
would follow in the subsequent two years.
NOA Report Methodology – DRAFT 4.0 – 09/04/18 Page 11 of 99National Grid System Operator April 2018
Section 2: The NOA report process
Overview of the NOA report process
2.1. Figure 2.1 gives an overview of the NOA report process. This methodology describes
how the SO, working with the TOs, carries out these activities. The process diagram
in Appendix C gives more details. The headers in this methodology follow the stage
names in the process diagram in Appendix C.
Figure 2.1 Overview of the NOA report process
Conduct Select
Identify future recommended
Identify future technical
Collect input transmission options and Publish the
transmission studies and
from FES capability assess for NOA report
options cost-benefit
requirements competition
analysis
Collect Input
Updated Future Energy Scenarios
2.2. The relevant set of scenarios as required by NGET Licence Condition C11, is used
as the basis for each annual round of analysis. These provide self-consistent
generation and demand scenarios which extend to 2050. The FES document is
consulted upon widely and published each year as part of a parallel process.
2.3. The NOA process utilises the scenarios as well as the contracted position to form the
background for which studies and analysis is carried out. The total number of
scenarios is subject to change depending on stakeholder feedback received through
the FES consultation process. In the event of any change, the rationale is described
and presented within the FES consultation report that is published each year.
2.4. FES 2018 will see some progressive rather than radical enhancements to the
scenarios to address stakeholder feedback while still allowing some consistency with
previous years’ analysis5. The main points to note are that:
There will be a continuation of four scenarios structured in a 2x2 matrix but new
axes of “speed of decarbonisation” and “level of decentralisation” replace the
“Green Ambition” and “Prosperity” axes applied in FES 2017.
Two of the scenarios will meet the 2050 carbon reduction target (instead of one
in FES 2017), but via different routes.
5
See http://fes.nationalgrid.com/media/1346/future-energy-scenarios-2018-stakeholder-feedback-document-
published-feb-2018.pdf for more details on the FES Scenario changes and, for more general FES information, on
our website http://fes.nationalgrid.com/.
NOA Report Methodology – DRAFT 4.0 – 09/04/18 Page 12 of 99National Grid System Operator April 2018
As in previous years, security of supply for both gas and electricity is achieved
across all four.
2.5. The FES Scenarios are created by using a mix of data sources, including feedback
from the FES consultation process. The scenario demands are then adjusted to
match the metered average cold spell (ACS)6 corrected actual outturns against which
generation is applied to ensure security of supply can be met.
2.6. Using regionally metered data, the “ACS adjusted scenario demands” are split
proportionally around GB.
Sensitivities
2.7. Sensitivities are used to enrich the analysis for particular boundaries to ensure that
issues, such as the sensitivity of boundary capability to the connection of particular
generation projects, are adequately addressed. The SO and TOs use a Joint
Planning Committee subgroup as appropriate to coordinate sensitivities. This allows
regional variations in generation connections and anticipated demand levels that still
meet the scenario objectives to be appropriately considered.
2.8. For example, the contracted generation background on a national basis far exceeds
the boundary requirements under the four main scenarios, but on a local basis, the
possibility of the contracted generation occurring is credible and there is a need to
ensure that we are able to meet customer requirements. A “one in, one out” rule is
applied: any generation added in a region of concern is counter-balanced by the
removal of a generation project of similar fuel type elsewhere to ensure that the
scenario is kept whole in terms of the proportion of each generation type. This
effectively creates sensitivities that still meet the underlying assumptions of the main
scenarios but accounts for local sensitivities to the location of generation.
2.9. The inclusion of a local contracted scenario generally forms a high local generation
case and allows the maximum regret associated with inefficient congestion costs to
be assessed. In order to ensure that the maximum regret associated with inefficient
financing costs and increased risk of asset stranding is assessed; a low generation
scenario where no new local generation connects is also considered. This is
particularly important where the breadth of scenarios considered do not include a low
generation case.
2.10. Interconnectors to Europe give rise to significant swings of power flows on the
network due to their size and because they can act as both a generator (when
importing energy into GB) and demand (when exporting energy out of GB). For
example, when interconnectors in the South East are exporting to mainland Europe,
this changes the loading on the transmission circuits in and around London and
hence creates different boundary capabilities.
6
The average cold spell (ACS) is defined as a particular combination of weather elements which give rise to a
level of peak demand within a financial year (1 April to 31 March) which has a 50% chance of being exceeded as
a result of weather variation alone.
NOA Report Methodology – DRAFT 4.0 – 09/04/18 Page 13 of 99National Grid System Operator April 2018
2.11. The SO models interconnector power flows from economic simulation using a market
model of forecast energy prices for GB and European markets. The interconnector
market model was improved for 2016 and now covers full-year European market
operation. The results of the market model are then used to inform which sensitivities
are required for boundary capability modelling. Sensitivities may be eliminated for
unlikely interconnector flow scenarios.
2.12. The SO and TOs extend sensitivities studies further to test import or security
constraints. FES data tends to produce export type flows such as north to south. In
some circumstances, flows may be reversed. The SO develops these sensitivities in
consultation with stakeholders to produce boundary requirements for import cases.
Interconnectors
2.13. For the NOA for Interconnectors (NOA IC), the SO undertakes analysis to assess
and provide a view on the optimum level of interconnection to other European
markets. The markets considered are Belgium, Denmark, France, Germany, Iceland,
Ireland (the combined market of Northern Ireland and the Republic of Ireland), The
Netherlands, Norway and Spain. The NOA IC process will use the output from the
2018/19 NOA as the baseline network reinforcement assumptions. The proposed
NOA IC approach for 2018/19 is presented in the NOA IC methodology which can be
found in Section 3 of this document.
2.14. The main benefits of the potential further interconnection analysed will be consumer,
producer and interconnector welfare benefit for GB and Europe, while costs captured
will include locational impacts on the GB transmission system and capital
expenditure of interconnectors and associated network reinforcements. The SO will
develop the methodology to include consideration of potential operability challenges
and solutions interconnectors can offer. The SO anticipates the market will respond
to this intelligence with potential projects aligned with the optimum level of
interconnection recommended by the SO.
2.15. The output from the NOA IC process will be presented as a chapter in the NOA
report and hence be published in late January 2019.
Offshore Wider Works (OWW)
2.16. The SO has written the NOA report methodology so that it treats all options for
system reinforcement fairly. These options can include OWW and alternative options.
2.17. The licence condition gives the SO the duty to devise and develop OWW. The SO
has written a methodology to explain how it develops OWW up to the point that it can
use the options in its economic analysis. It has been published for consultation in
April 2017. This methodology is the SO Process for OWW and covers both
developer-associated and non developer-associated works and can be found in
Section 5 of this document.
NOA Report Methodology – DRAFT 4.0 – 09/04/18 Page 14 of 99National Grid System Operator April 2018
Latest version of National Electricity Transmission System Security and
Quality of Supply Standard (NETS SQSS)
2.18. The existing version of the National Electricity Transmission System Security and
Quality of Supply Standard (NETS SQSS) is used for each annual update. If
amendments are active, the potential impacts of these amendments are also
considered as part of this process.
Identify future transmission boundary capability requirements
National generation and demand scenarios
2.19. For every boundary, the future capability required under each scenario and sensitivity
is calculated by the application of the NETS SQSS. The network at peak system
demand and other seasonal demands (spring/autumn and summer) is used to outline
the minimum required transmission capability for both the Security and Economy
criteria set out in the NETS SQSS.
2.20. The Security criterion is intended to ensure that demand can be supplied securely,
without reliance on intermittent generators or imports from interconnectors in
accordance with NETS SQSS section C.3.2. The level of contribution from the
remaining generators is established in accordance with the NETS SQSS for
assessing the ACS peak demand7. Further explanation can be found in appendices
C and D of the NETS SQSS. To investigate the system against the Security criterion,
the SO and TOs identify key network contingencies (system faults) that test the
system’s robustness. The SO and TOs do this by using operational experience from
the current year and interpreting this in terms of network contingencies. These are
not only used directly in studies but also used to identify trends or common factors
and applied in the NOA report analysis to ensure that TO options do not exacerbate
these operational issues. This may lead to investment recommendations.
2.21. The Economy criterion is a pseudo cost-benefit study and ensures sufficient
capability is built to allow the transmission of intermittent generation to main load
centres. Generation is scaled to meet the required demand level. Further details can
be found in appendices E and F of the NETS SQSS.
2.22. The NETS SQSS also includes a number of other areas which have to be considered
to ensure the development of an economic and efficient transmission system.
Beyond the criteria above, it is necessary to:
Ensure adequate voltage and stability margins for year-round operation.
7
Average Cold Spell Peak Demand is defined as unrestricted transmission peak demand including losses,
excluding station demand and exports. No pumping demand at pumped storage stations is assumed to occur at
peak times. Please note that other related documents may have different definitions of peak demand, e.g.
National Grid’s ‘Winter Outlook Report’ quotes restricted demands and ‘Future Energy Scenarios’ quotes GB
peak demand (end-users) demands.
NOA Report Methodology – DRAFT 4.0 – 09/04/18 Page 15 of 99National Grid System Operator April 2018
Ensure reasonable access to the transmission system for essential
maintenance outages.
2.23. The SO uses the scenarios and the criteria stated in the NETS SQSS to produce the
future transmission capability requirements by using an in-house tool called ‘Peak Y’.
The SO then passes these capability requirements to the TOs to identify future
transmission options which are described in the following section.
Identify NOA options
2.24. At this stage all the high level transmission options which may provide additional
capability across a system boundary requiring reinforcement are identified (against
economic and security criteria), including a review of any options considered in
previous years. The NOA report presents a high level view of these options, with key
choices to be taken for further evaluation as outlined on a non-exhaustive basis
below. The NOA options are based around choices for example:
an onshore route of conventional AC overhead line (OHL) or cable
an onshore route of (High Voltage Direct Current) HVDC
OWW options, such as integration between offshore generation stations.
2.25. Variations on each of these choices may be presented where there are significant
differences in options, for instance between different OHL routes where they could
provide very different risks and costs.
2.26. In response to the data on boundary capabilities and requirements, TOs identify and
develop multiple credible options that deliver the potentially required boundary
capabilities. The SO produces and circulates the SRF Part A to the TOs. In response
to Part A, TOs provide high level details of credible reinforcement options that are
expected to satisfy the requirement. These options could be subsea links as well as
onshore. Appendix D of this document provides detailed information about the SRF
template. As illustrated in Table 2.1, the SRF is split into six parts with a guideline on
when the TO is required to complete and return each part.
Table 2.1 Description of the parts of the SRF template and when the TOs return them
SRF When NGET TO When Scottish TO
Description
Part returns SRF part returns SRF part
Boundary
Mid-September for Mid-August (draft)
A requirement and
relevant boundaries Mid-September (final)
capability
TO proposed Between early June Mid-August (draft)
B
options and late August Mid-September (final)
Outages Mid-August (draft) Mid-August (draft)
C
requirements Mid-September (final) Mid-September (final)
Studied option
D Mid-September Mid-September
combinations
E Options’ costs Mid-September Mid-September
F Publication Late October Late October
NOA Report Methodology – DRAFT 4.0 – 09/04/18 Page 16 of 99National Grid System Operator April 2018
information
The SO has the opportunity to suggest concepts to the TOs for options to achieve
the boundary requirements.
2.27. The SO considers options for Non Developer-Associated Offshore Wider Works
(NDAOWW) which would deliver offshore reinforcements capable of providing the
desired improvement in a boundary capability. The SO continues with the early
development of NDAOWW in accordance with NGET Standard Licence Condition
C27 Part D. This is to provide high level initial inputs to the cost-benefit analysis. To
achieve this, the SO forms a view on the technical outline and estimates the capital
costs of the NDAOWW. As it is an initial and desk top exercise the capital cost
estimates are likely to change significantly as the option starts to mature with further
evaluation. The SO liaises with the relevant TOs in the development of NDAOWW
options.
2.28. The options that the TOs provide are listed and described in the NOA report along
with SO alternative options such as operational options. The SO alternative options
might include liaison with TOs, distribution licensees or third parties. Each option's
description includes the boundary that the option relieves, categorising the option into
‘build’, ‘reduced-build’ or ‘operational’ and a technical outline. The option description
includes any associated aspects such as the nature of the area affected, related
network changes etc. The SO is undertaking pathfinding projects in 2018/19 to trial
analysis of additional system needs and to include options from non-TO sources.
Where relevant the SO will include any applicable options in the 2018/19 economic
analysis.
2.29. It is recognised that as options develop, their level of detail increases. Options at a
very early development stage might lack detail due to uncertainty in detailed project
design such as land and consents requirements.
2.30. During 2018, the England and Wales TO and the SO carry out joint technical analysis
which means that there is a staged return for Parts A and B up to September and
August respectively. The Scottish TOs return the draft SRF Parts A and B in mid-
August and the final version in mid-September. The timing is to support the SO’s
verification studies and cost checking process. All TOs provide draft Part C in mid-
August and final Parts C to E in mid-September. These form the key inputs to the
cost-benefit analysis process. Part F is the means for the TOs to advise the SO of
the descriptions of the options to be published in the NOA report. The exact date is
agreed between the SO and the TOs for the year’s programme for the ETYS and
NOA.
2.31. Where an option affects an adjacent TO, the TOs and SO coordinate their views on
the reinforcement options and produce an agreed set of options by Week 32. The SO
uses the agreed set of options in its economic analysis and might use the options in
its verification studies. If there is no agreement, the SO forms a view on which
options it assesses.
NOA Report Methodology – DRAFT 4.0 – 09/04/18 Page 17 of 99National Grid System Operator April 2018
2.32. Once the TOs have returned the SRFs, the SO reviews the data and understands the
costs by discussing them with the TOs. Through engagement, the SO presents the
data that it plans to use in the economic studies.
2.33. The SO and TOs agree the combinations of options that the SO will use in the cost-
benefit analysis.
2.34. A non-exhaustive list of potential transmission solutions are presented in Table 2.2. A
wide range of options is encouraged including, where relevant, any innovative
solutions.
Table 2.2 Potential transmission solutions
Nature of constraint
Thermal
Stability
Voltage
Levels
Category NOA option
Fault
Availability contract (contract to make generation available,
capped, more flexible and so on to suit constraint management)
Intertrip (normally to trip generation for selected events but could
Operational Options
be used for demand side services)
Reactive demand reduction (this could ease voltage
constraints)
Generation advanced control systems (such as faster exciters
which improves transient stability)
Enhanced generator reactive range through reactive
markets (generators contracted to provide reactive capability
beyond the range obliged under the codes)
Demand side services which could involve storage
(contracted for certain boundary transfers and faults). These
allow peak profiling which can be used to ease boundary flows
Alternative Options
Co-ordinated Quadrature Booster (QB) Schemes (automatic
schemes to optimise existing QBs)
Automatic switching schemes for alternative running
arrangements (automatic schemes that open or close selected
circuit breakers to reconfigure substations on a planned basis for
recognised faults)
Reduced-build Options
Dynamic ratings (circuits monitored automatically for their
thermal and hence rating capability)
Addition to existing assets of fast switching equipment for
reactive compensation (a scheme that switches in/out
compensation in response to voltage levels which are likely to
change post-fault)
Protection changes (faster protection can help stability limits
while thermal capabilities might be raised by replacing protection
apparatus such as current transformers (CTs))
HVDC de-load Scheme (reduces the transfer of an HVDC
Intralink either automatically following trips or as per control room
instruction)
‘Hot-wiring’ overhead lines (re-tensioning OHLs so that they
sag less, insulator adjustment and ground works to allow greater
loading which in effect increases their ratings)
NOA Report Methodology – DRAFT 4.0 – 09/04/18 Page 18 of 99National Grid System Operator April 2018
Overhead line re-conductoring or cable replacement
(replacing the conductors on existing routes with ones with a
higher rating)
Reactive compensation in shunt or series arrangements
Build Options
(MSC, SVC, reactors). Shunt compensation improves voltage
performance and relieves that type of constraint. Series
compensation lowers series impedance which improves stability
and reduces voltage drop.
Switchgear replacement (to improve thermal capability or fault
level rating which in turn provides more flexibility in system
operation and configuration. This would be used to optimise flows
and hence boundary transfer capability).
New build (HVAC / HVDC) – new plant on existing or new
routes.
2.35. It is intended that the range of options identified has some breadth and includes both
small-scale reinforcements with short lead-times as well as larger-scale alternative
reinforcements which are likely to have longer lead-times. The SO applies a sense
check in conjunction with the TOs and builds an understanding of the options and
their practicalities. In this way, the SO narrows down the options whilst allowing
assessment of the most beneficial solution for customers. Other than the application
of economic tools and techniques, to refine a shortlist of options or identify a potential
recommended option, the SO relies on the TO for deliverability, planning and
environmental factors. The SO leads on operability and offshore integration matters
ahead of the cost-benefit analysis.
2.36. In checking for the suitability of an option, the SO reviews options for their operability
and their effect on the wider system. As a result the SO checks for system access,
ease of operation and the ability to adhere to operational policy and national
standards. For system access, this means delivery of the option and the ability to
manage outages to deliver future capital works and maintenance activities. In and
affecting their areas, SPT and SHE Transmission undertake part of this review of
options in conjunction with the SO. Because of their scale and complexity, some
options may need more in-depth study work and involve an iterative approach with
increasing detail added between NOA reports.
Basis for the cost estimate provided for each option
2.37. The forecast cost is a central best view. By Week 30, the TOs and SO agree each
year the cost basis to be used for NOA analysis. The information that will have to be
agreed includes but is not limited to:
price base, that is the financial year of the prices and should be current year
prices.
annual expenditure profile reflecting the options’ earliest in service dates.
any major risks for options costed appropriately.
delay costs.
the TO’s Weighted Average Cost of Capital (WACC).
NOA Report Methodology – DRAFT 4.0 – 09/04/18 Page 19 of 99You can also read