TECHNOLOGY READINESS AND COSTS OF CCS - MARCH 2021 DR DAVID KEARNS DR HARRY LIU
←
→
Page content transcription
If your browser does not render page correctly, please read the page content below
MARCH 2021

TECHNOLOGY READINESS
AND COSTS OF CCS

                  DR DAVID KEARNS
                  Senior Consultant, CCS Technology

                  DR HARRY LIU
                  Consultant, CCS Projects

                  DR CHRIS CONSOLI
                  Senior Consultant, Storage
Acknowledgements
    This research was overseen by an Advisory Committee of eminent individuals from government, academia and
    industry with deep expertise across technology, policy, economics and finance relevant to climate change. The
    guidance of the Advisory Committee has been invaluable in developing this work.

    Thanks are also due to the Center for Global Energy Policy at Columbia University SIPA for their review and input to
    this report.

    Advisory Committee for the Circular Carbon Economy: Keystone to Global Sustainability Series

    • Mr. Brad Page, CEO, Global Carbon Capture & Storage Institute (Co-Chair)
    • Mr. Ahmad Al-Khowaiter, CTO, Saudi Aramco (Co-Chair)
    • Dr. Stephen Bohlen, Acting State Geologist, California Department of Conservation
    • Ms. Heidi Heitkamp, Former Senator from North Dakota, U.S. Senate, United States of America
    • Mr. Richard Kaufmann, Chairman, New York State Energy Research and Development Authority (NYSERDA)
    • Ms. Maria Jelescu Dreyfus, CEO, Ardinall Investment Management
    • Dr. Arun Majumdar, Director, Precourt Institute for Energy and Stanford University
    • Dr. Nebojsa Nakicenovic, Former Deputy Director General/CEO of International Institute for Applied Systems
      Analysis (IIASA)
    • Mr. Adam Siemenski, President, King Abdullah Petroleum Studies and Research Center (KAPSARC)
    • Prof. Nobuo Tanaka, Former Executive Director, International Energy Agency (IEA) and Distinguished Fellow,
      Institute of Energy Economics Japan

                                                   THE CIRCULAR CARBON ECONOMY: KEYSTONE
                                                   TO GLOBAL SUSTAINABILITY SERIES assesses the
                                                   opportunities and limits associated with transition toward
                                                   more resilient, sustainable energy systems that address
                                                   climate change, increase access to energy, and spark
                                                   innovation for a thriving global economy.

2   TECHNOLOGY READINESS AND COSTS OF CCS
CONTENTS
    INTRODUCTION                                                                  4
    1.0 EXECUTIVE SUMMARY                                                         5
    2.0 ABOUT CARBON CAPTURE AND STORAGE (CCS)                                    6
    3.0 TECHNOLOGY AS A DRIVER OF COST REDUCTION AND ENABLER OF CCS DEPLOYMENT    8
    4.0 TECHNOLOGY READINESS OF CO2 CAPTURE TECHNOLOGIES                          9
    5.0 TECHNOLOGY READINESS OF CO2 TRANSPORT TECHNOLOGIES                       20
    6.0 TECHNOLOGY READINESS OF CO2 STORAGE                                      22
    7.0 THE COST OF CO2 CAPTURE AND STORAGE                                      24
    8.0 COST OF CO2 CAPTURE                                                      25
    9.0 COST REDUCTION OPPORTUNITIES IN CARBON CAPTURE                           30
    10.0 COST OF TRANSPORT AND STORAGE                                           38
    11.0 CONCLUSION                                                              43
    12.0 APPENDIX                                                                44
    13.0 REFERENCES                                                              48

3   TECHNOLOGY READINESS AND COSTS OF CCS
INTRODUCTION

    Stopping global warming requires net greenhouse gas                                        This is because it does not explicitly make provision
    emissions to fall to zero and remain at zero thereafter. Put                               for the removal of carbon dioxide from the atmosphere
    simply, all emissions must either cease, or be completely                                  (Carbon Direct Removal or CDR) or the prevention
    offset by the permanent removal of greenhouse gases                                        of carbon dioxide, once produced, from entering the
    (particularly carbon dioxide - CO2) from the atmosphere.                                   atmosphere using carbon capture and storage (CCS).
    The time taken to reduce net emissions to zero, and thus                                   Rigorous analysis by the Intergovernmental Panel on
    the total mass of greenhouse gases in the atmosphere,                                      Climate Change, the International Energy Agency, and
    will determine the final equilibrium temperature of                                        many others all conclude that CCS and CDR, along side
    the Earth. Almost all analysis concludes that reducing                                     all other mitigation measures, are essential to achieve
    emissions rapidly enough to remain within a 1.5°Celsius                                    climate targets.
    carbon budget is practically impossible. Consequently,
                                                                                               The Circular Carbon Economy adds a fourth “R” to the
    to limit global warming to 1.5°Celsius above pre-industrial
                                                                                               “three Rs” of the Circular Economy; Remove. Remove
    times, greenhouse gas emissions must be reduced to
                                                                                               includes measures which remove CO2 from atmosphere
    net-zero as soon as possible, and then CO2 must be
                                                                                               or prevent it from entering the atmosphere after it has
    permanently removed from the atmosphere to bring
                                                                                               been produced such as carbon capture and storage
    the total mass of greenhouse gases in the atmosphere
                                                                                               (CCS) at industrial and energy facilities, bio-energy with
    below the 1.5° Celsius carbon budget.
                                                                                               CCS (BECCS), Direct Air Capture (DAC) with geological
    This task is as immense as it is urgent. A conclusion that                                 storage, and afforestation.
    may be drawn from credible analysis and modelling
                                                                                               This report examines CCS technology from two
    of pathways to achieve net-zero emissions is that
                                                                                               perspectives. First, an examination of the technology
    the lowest cost and risk approach will embrace the
                                                                                               readiness of each component of the CCS value chain
    broadest portfolio of technologies and strategies,
                                                                                               is explored. Second, a review of the factors that
    sometimes colloquially referred to as an “all of the
                                                                                               influence the current and future costs of carbon capture,
    above” approach. The King Abdullah Petroleum Studies
                                                                                               compression, transport and storage is presented.
    and Research Center (KAPSARC) in the Kingdom of
    Saudi Arabia developed the Circular Carbon Economy
    (CCE) framework to more precisely describe this
    approach. This framework recognizes and values all
    emission reduction options.1 The CCE builds upon the
    well-established Circular Economy concept, which
    consists of the “three Rs” which are Reduce, Reuse and
    Recycle. The Circular Economy is effective in describing
    an approach to sustainability considering the efficient
    utilization of resources and wastes however it is not
    sufficient to describe a wholistic approach to mitigating
    greenhouse gas emissions.

    1
        KAPSARC (2019). Instant Insight, November 06, 2019. Achieving Climate Goals by Closing the Loop in a Circular Carbon Economy.

4   TECHNOLOGY READINESS AND COSTS OF CCS
1.0 EXECUTIVE
    SUMMARY
    Carbon Capture and Storage are essential technologies      The lessons learned from early deployments of CCS are
    to help achieve the ambition of net zero anthropogenic     shown to play an essential role in reducing CCS project
    greenhouse gas emissions by 2050.                          costs for subsequent developments.
    As with all solutions, the cost of deployment of           The strong importance of capital cost on overall CCS
    CO2 capture, transport and storage systems is of           costs means that there are financial and policy levers
    vital economic and environmental importance. This          available to make capital more available and lower cost
    importance will continue to increase as the scale and      for large-scale CCS projects. Tax policies also play a vital
    breadth of CCS deployment grows around the world.          role in the incentivisation of CCS projects.
    The Global CCS Institute has developed this report to      This report also surveys the technology readiness of
    describe the factors that drive current and future costs   mature and emerging technologies in the capture,
    of the technology. Key drivers of CCS cost include         transport and storage of carbon dioxide. Technological
    economies of scale (which incentivises the development     development will be a key element of driving future cost
    of CCS hubs to build scale); partial pressure of CO2       reductions in CCS, and indeed making CCS possible for
    in the source gas (lower partial pressures are more        some hard-to-abate sectors such as cement, steel, and
    challenging), which mean there is variation in CCS costs   direct air CO2 capture.
    from industry to industry; energy costs (in the forms of
    heat and electricity); and technological innovation.

5   TECHNOLOGY READINESS AND COSTS OF CCS
2.0 ABOUT CARBON
    CAPTURE AND
    STORAGE (CCS)
    CCS is a proven and safe technology that prevents              CCS is an essential technology for the world effort to
    carbon dioxide (CO2) from being released from point            achieve net-zero greenhouse gas emissions by 2050.
    sources into the atmosphere or removes it directly from        CCS can reduce emissions across most industry
    the atmosphere. The technology involves capturing              sectors directly, both as a retrofit technology for existing
    (purifying) CO2 produced by industrial plants (such as         industrial and energy facilities, as well as incorporated
    steel mills, chemicals plants and cement plants), coal         into new developments. It can also remove CO2 from
    and natural gas-fired power plants, and oil refineries,        the atmosphere (through bioenergy with CCS, as well
    compressing it for transportation and then injecting           as Direct Air Capture of CO2 from the atmosphere),
    it deep underground – at least 800 meters below the            providing the possibility of deep removal of CO2 from
    surface – into a carefully selected and safe geological        the climate system at scale (International Energy Agency
    storage site, where it is trapped and permanently stored       2020a).
    in porous rock – see Figure 1.

    Figure 1 - Carbon capture and storage – a conceptual diagram

          CAPTURE                                    TRANSPORT                                                STORAGE

                                                        TRUCKS                                                    CO2
          INDUSTRY

                              CO2
                                                                                                               EOR / EGR

                               PURIFICATION
                                                                                   CO2
                               & CONDITIONING                                       INJECTION

                                                         SHIPS
      GAS PROCESSING

                                                                                                                  CO2

                                                                                                           STORAGE IN SALINE
       POWER PLANTS                                    PIPELINES                                              AQUIFIERS

                                                  TECHNICAL AND LEGAL CO2 REQUIREMENTS

6   TECHNOLOGY READINESS AND COSTS OF CCS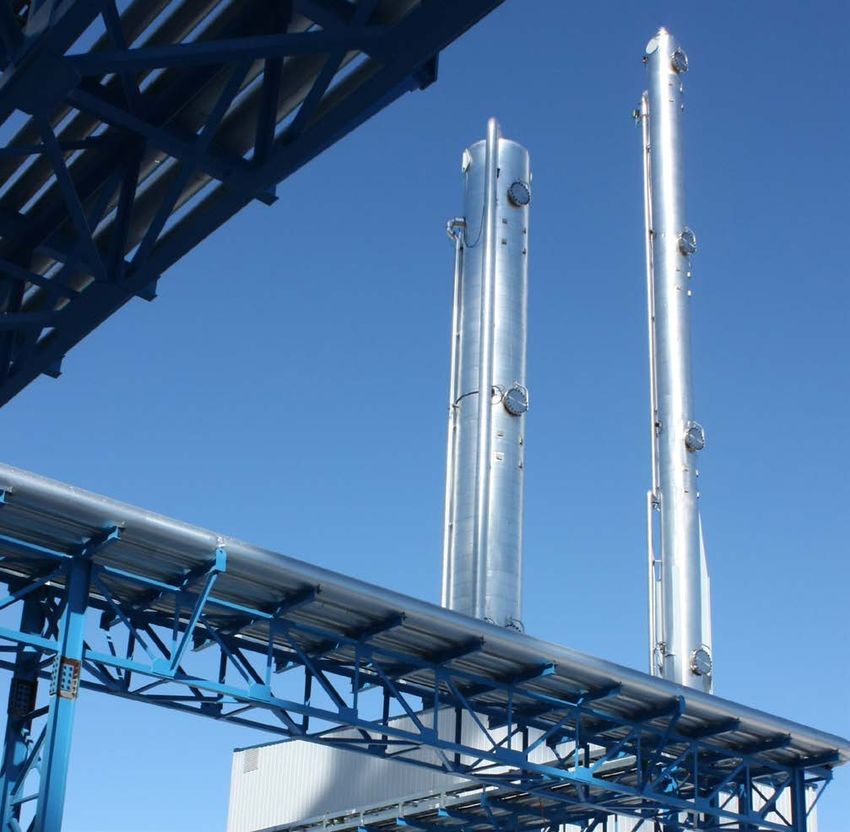
Due to the need for broad and deep deployment of          This report outlines key factors that influence the cost
    CCS around the world over the next 30 years, a clear      of carbon capture and storage today. It also summarises
    understanding of its costs and economics is important.    key drivers that will drive the cost of future deployments
    The costs of CCS can vary widely depending on the         of CCS. Finally, as technology is one of those key drivers,
    application, location, and scale of each source of CO2.   it outlines the technology readiness of a range of CO2
    Technology development is also playing a key role, as     CCS technologies at varying stages of development
    is the operating experience gleaned from CCS facilities   – from early research through to full-scale commercial
    that are operating today.                                 availability.

7   TECHNOLOGY READINESS AND COSTS OF CCS
3.0 TECHNOLOGY
    AS A DRIVER OF
    COST REDUCTION
    AND ENABLER OF
    CCS DEPLOYMENT
    The technologies that enable CO2 capture, transport         Incremental improvements tend to be lower risk
    and storage are not static. As the world moves towards      and more predictable. In CCS this is observed in the
    higher ambition for emissions reductions and CO2            development of new CO2 capture solvents, improved
    removal from the atmosphere, there is a relentless          adsorbents, enhanced or more robust membranes,
    focus on driving down the costs of all parts of the CCS     and through the use of engineering techniques like
    value chain. This is driving considerable research and      modularisation.
    development across the world into better and more
                                                                Breakthroughs can enable CCS to be deployed in new
    cost-effective CCS technologies.
                                                                applications outside of industries where it has previously
    As described earlier in this report, technology will play   been rolled out, or to achieve step-change cost
    an important role in reducing the costs of CCS. We are      improvements over existing technologies. Examples
    observing improvements in technology that are both          include direct air capture (DAC) and inherent CO2
    incremental (improvements of existing technologies)         capture technologies.
    and breakthrough (new developments in form and/or
    function).

8   TECHNOLOGY READINESS AND COSTS OF CCS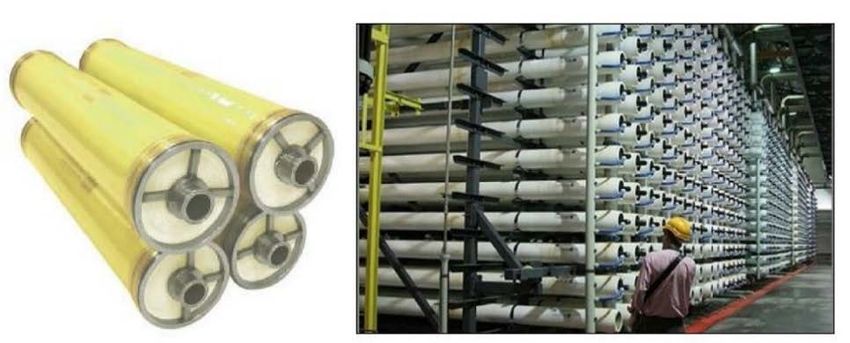
4.0 TECHNOLOGY
    READINESS OF
    CO2 CAPTURE
    TECHNOLOGIES
    Technologies develop from initial observations and              Lower TRL levels are typically concerned with the
    concepts, through laboratory studies and bench scale            possibility that a technology might work, whereas
    equipment, all the way through to pilot-scale and               higher levels are more concerned with commercial
    eventually full-scale commercial service.                       viability. The following sections of this report provide a
                                                                    high level summary of categories of CCS technologies
    A qualitative scale known as the Technology Readiness
                                                                    and ascribes a TRL score to each. In summary, CCS
    Level (TRL) defines the maturity of technologies within
                                                                    technologies span the full range of TRL, from new
    an increasing scale of commercial deployment; see
                                                                    technologies in fundamental research and development
    Table 1.
                                                                    through to mature systems that have been in commercial
                                                                    operation for decades.

    Table 1 - Simplified definitions of Technology Readiness Level (TRL) (IEAGHG 2014) for CCS technologies.

    CATEGORY                     TRL        DESCRIPTION

                                 9          Normal commercial service

    Demonstration                8          Commercial demonstration, full-scale deployment in final form

                                 7          Sub-scale demonstration, fully functional prototype

                                 6          Fully integrated pilot tested in a relevant environment

    Development                  5          Sub-system validation in a relevant environment

                                 4          System validation in a laboratory environment

                                 3          Proof-of-concept tests, component level

    Research                     2          Formulation of the application

                                 1          Basic principles, observed, initial concept

9   TECHNOLOGY READINESS AND COSTS OF CCS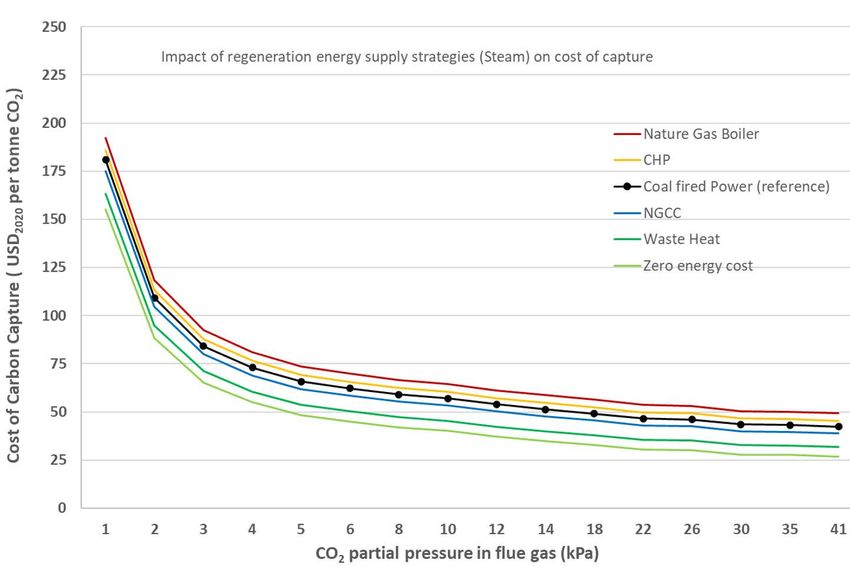
Figure 2 - Development of carbon captures technologies (Global CCS Institute 2016).

                                                                       GAS SEPARATION               CARBON DIOXIDE
                                                                        MEMBRANES                   • NATURAL GAS
                                                                                                      PROCESSING

                                                                             HYDROGEN
                                                                             • AMMONIA
                                                                             • HYDROCARBON
                                                                               REFINING
                                              GAS ABSORPTION                 • CHEMICAL SYNTHESIS
                                                                                                         NITROGEN
                                                                       DEHYDRATION                       • AIR
                                                                       • GAS PROCESSING                    SEPARATION
                                                                       • AIR SEPARATION                  • CHEMICAL
                                                                                                           PLANTS

                                      GAS ABSORPTION                                                      GASIFIERS
                                     PHYSICAL SOLVENTS                                                    • COAL-FIRED
                                                                                                            BOILERS
              GAS ABSORPTION
             CHEMICAL SOLVENTS                  NATURAL GAS SWEETENING

     YEAR         1930             1940       1950       1960         1970          1980          1990          2000

     The deployment of carbon capture in industrial             is more costly due to the laws of thermodynamics.
     processes dates back to the 1930s, when carbon             Consequently, the US Department of Energy (DOE)
     dioxide (CO2) absorption with chemical solvents, such as   has set targets to improve state-of-the-art capture
     amines in aqueous solutions, were used in the natural      technologies to reduce the cost of capture from dilute
     gas industry to separate CO2 from methane (Figure 2)       gas streams. (Miller et al. 2016). Second-generation
     (Global CCS Institute 2016).                               technologies, yet to be deployed commercially, are
                                                                targeted to reduce costs by 20 per cent from current
     Starting in the 1940s, processes using physical solvents
                                                                state-of-the-art technologies. Second generation
     emerged for CO2 capture from process gas streams that
                                                                capture technologies are expected to be available for
     contained higher CO2 concentrations (25 to 70 per cent)
                                                                demonstration by 2025. Transformational technologies
     and under higher-pressure conditions (approximately
                                                                are targeted to reduce costs by 30 per cent from the first
     100 bar). Two commercial examples of physical solvents
                                                                of a kind technology and be available for demonstration
     are Selexol™ and Rectisol®. These solvents are used
                                                                in the 2030 timeframe.
     at gasification plants using coal, petroleum coke, and
     biomass feedstocks.                                        Other innovative technologies with inherent CO2
                                                                capture process have also emerged, for example, 8
     In the 1950s and 1960s, adsorption processes using
                                                                Rivers Capital’s Allam-Fetvedt Cycle, Calix’s Advanced
     solid sorbents, such as pressure swing adsorption
                                                                Calciner. These unique systems require minimal capture
     (PSA), enabled gas separation in hydrogen production
                                                                process to produce pure CO2 ready for transport/use.
     (refineries), nitrogen production, and dehydration
     applications (Siqueira et al. 2017). In the 1970s and      Capture technologies in this report are categorized by
     1980s, membranes were developed to capture CO2 for         the media used to separate CO2 from a gas stream.
     use in natural gas processing.                             For each sub-section, an analysis of each class of
                                                                separation media is provided, including an assessment
     However, carbon capture is increasingly being applied
                                                                of the existing and emerging capture technologies. The
     to decarbonize the power sector and other industries
                                                                overview of capture technologies TRL including how
     with low-concentration dilute gas streams. The
                                                                they have advanced between 2014 and 2020 is shown
     application of carbon capture to gas streams with dilute
                                                                in Table 2.
     CO2 concentrations, such as from power generation

10   TECHNOLOGY READINESS AND COSTS OF CCS
Capture technologies in this report are categorized by the media used to separate CO2 from a gas stream. For each
sub-section, an analysis of each class of separation media is provided, including an assessment of the existing and
emerging capture technologies. The capture technologies described in the following sections are selected based on
their suitability and readiness level. Hence some technologies, especially those in the early research phase (TRL less
than 5), may not have been included.
Table 2 - TRL assessment and key technology vendors of the CO2 capture technologies. Global CCS Institute
analysis in comparison to (IEAGHG 2014).
TRL TRL
TECHNOLOGY KEY VENDORS PROJECTS
2014 2020
Fluor, Shell, Dow, Kerr- Widely used in fertilizer, soda ash, natural gas
Traditional amine
McGee, Aker Solutions, 9 9 processing plants, e.g. Sleipner, Snøhvit, and
solvents
etc used in Boundary Dam since 2014
Widely used in natural gas processing, coal
gasification plants, e.g. Val Verde, Shute
Physical solvent UOP, Linde and Air
9 9 Creek, Century Plant, Coffeyville Gasification,
(Selexol, Rectisol) Liquide
Great Plains Synfuels Plant, Lost Cabin Gas
plant
Benfield process
UOP -* 9 Fertiliser plants, e.g. Enid Fertiliser
and variants*
Demonstration to commercial plants
Sterically hindered
MHI, Toshiba, CSIRO, etc 6-8 6-9 depending on technology providers, e.g.
amine
Petra Nova carbon capture
Chilled ammonia Pilot tests to demonstration plant feasibility
Liquid GE 6* 6-7
process* studies
Solvent
Pilot test and commercial scale FEED studies:
Ion Clean Energy, CHN Ion Clean Energy’s Gerald Gentleman station
Water-Lean solvent 4-5 4-7
Energy, RTI carbon capture, CHN Energy’s Jinjie pilot
plant
Phase change
IFPEN/Axens 4 5-6 DMX™ Demonstration
solvents
Amino acid-
based solvent*/
Siemens, GE 4-5 4-5 Lab test to conceptual studies
Precipitating
solvents
Encapsulated
R&D only 1 2-3 Lab tests
solvents
Ionic liquids R&D only 1 2-3 Lab tests
Pressure Swing
Air Liquide, Air Products,
Adsorption/Vacuum 3 9 Air Products Port Arthur SMR CCS
UOP
Swing Adsorption
Temperature Swing Large pilot tests to FEED studies for
Svante 1 5-7
Adsorption (TSA) commercial plants
Enzyme Catalysed
Solid Adsorption
CO2 solutions 1 6 Pilot demonstrations
adsorbent
Sorbent-Enhanced
Water Gas Shift ECN 5 5 Pilot tests, e.g. STEPWISE
(SEWGS)
Electrochemically
Mediated R&D only 1 1 Lab test
Adsorption
11 TECHNOLOGY READINESS AND COSTS OF CCSTRL TRL
TECHNOLOGY KEY VENDORS PROJECTS
2014 2020
Gas separation
membranes
UOP, Air Liquide -* 9 Petrobras Santos Basin Pre-Salt Oil Field CCS
for natural gas
processing
Polymeric
MTR 6 7 FEED studies for large pilots
Membranes
Electrochemical
membrane
FuelCell Energy -* 7 Large pilots at Plant Barry
integrated with
MCFCs
Membrane
Polymeric
Membranes Air Liquide, Linde
6 6 Pilot studies
/ Cryogenic Engineering, MTR
Separation Hybrid
Polymeric
Membranes/ MTR/ University of Texas -* 4 Conceptual studies
Solvent Hybrid
Room Temperature
Ionic Liquid (RTIL) R&D only 2 2 Lab tests
Membranes
Calcium Looping
Carbon Engineering 6 6-7 Feasibility/cost studies for commercial scale
Solid- (CaL)
looping Chemical Looping
Alstom 2 5-6 Pilot tests
Combustion
Inherent Allam-Fetvedt Cycle 8 Rivers Capital 2 6-7 50 MW Demonstration Plant in La Porte
CO2
capture Calix Advanced
Calix - 5-6 Large pilot LEILAC
Calciner*
* not assessed in IEAGHG 2014/TR4 report.
4.1. Liquid solvents In the solvent regeneration process, chemical solvents
are usually regenerated by raising the temperature
to release CO2. For physical solvents, the pressure is
Absorption employing chemical solvents (which use reduced.
chemical bonds to capture CO2) or physical solvents
The most widely used physical solvent-based
(which use only intermolecular Van der Waals force to
technologies are the glycol-based Selexol™ and
capture CO2) is the most common technology used for
methanol-based Rectisol® systems (Mohammed et al.
gas separation. In an absorption process, a gaseous
2014). The Selexol process operates at around ambient
component dissolves into a liquid solvent forming a
temperature, whereas the Rectisol process operates
solution (Global CCS Institute 2016). Due to the different
at a temperature as low as -60°C. These solvents are
solubilities of the gas components in a particular solvent,
operating at large-scale facilities separating up to 4,000
the solvent can be used for selective separation. At lower
tonnes per day (tpd) of CO2 in synthetic gas (syngas)
CO2 partial pressure, chemical solvents have a higher
purification and natural gas processing.
absorption capacity, which makes them more attractive
for use under low partial pressure gas conditions. At Chemical solvent-based systems available commercially
higher partial pressure, the relationship between solvent or near commercialization commonly use amine-based
capacity and partial pressure follows Henry’s Law (linear solvents. There have been concerted efforts to drive
relation), so physical solvents are preferred. down the cost and energy requirement of chemical
solvent technologies.
12 TECHNOLOGY READINESS AND COSTS OF CCSFigure 3 - Illustration of process schematic in Ion Clean Energy’s Water-Lean solvent capture. Source: (Ion
Engineering 2019).
Ion Clean Energy’s water-lean solvent carbon capture CO2 Solutions have added a proprietary biologically-
system (see Figure 3) is an example of a next-generation derived enzyme, known as 1T1, to the potassium
solvent. Ion Clean Energy’s initial feasibility study at the carbonate solution. This enzyme acts as a catalyst,
Nebraska Public Power District’s Gerald Gentleman speeding up the conversion of dissolved CO2 in the
Station Unit 2, a coal fired generator, estimated capture solvent. This enzyme transforms a relatively slow
costs of US$39 – 44 per tonne of CO2. This is a 25 - absorption technology into a much faster one.
33% cost reduction in comparison to the cost of current
This increased capture rate means a given CO2 capture
industry-standard amine solvents used for coal-fired
duty can be achieved with a much smaller absorber and
power plants.
stripper, making potassium carbonate solvents more
CO2 Solutions, now owned by Italian-based energy cost-effective for post-combustion and other low partial-
company Saipem, has developed a novel absorption pressure applications.
technology based on mature potassium carbonate
The process is also competitive from an energy
solvents. Conventional potassium carbonate solvents,
perspective – using hot water rather than steam as a
used for decades in chemicals and natural gas
heat source, with a claimed reboiler heat rate of 2.4
processing, are an effective carbon capture solvent.
GJ/tonne of CO2 captured (Saipem CO2 Solutions
However, they have the disadvantage of slow rates of
n.d.). The hot water is a distinct advantage – it means
absorption of CO2, which has made them suitable only
lower temperature waste heat can be used to partially
for high CO2 partial pressures.
or fully supply the process with energy for the reboiler.
Most absorption-based technologies require higher
temperature steam, which requires additional heat.
13 TECHNOLOGY READINESS AND COSTS OF CCSSaipem has published a claimed total capture cost of USD 28 / tonne of CO2 for a specific case where waste heat
is available at zero cost (Fradette, Lefebvre & Carley 2017, p.1108). This is for a case operating at 0.45 Mtpa of CO2. If
waste heat is not available, the cost will be higher. If the scale were greater, there is additional scope to reduce the
total capture cost.
A pilot plant operates with CO2 Solutions technology at the Resolute pulp mill in Québec, Canada (Figure 4). This
plant is capturing 30 tonnes/day of CO2 at high purity.
Figure 4 – Saipem CO2 Solutions’ Pilot Plant in Québec, Canada (Source: Saipem)
14 TECHNOLOGY READINESS AND COSTS OF CCS4.2. Solid adsorbents In PSA, the gas mixture containing CO2 flows through a
packed bed of adsorbent at elevated pressures until the
adsorption of the desired gas approaches equilibrium
Different molecules have different affinities to the surface with the solid. The bed is then regenerated by stopping
of a solid sorbent, which allows for the separation of a the feed mixture and reducing the pressure (Global CCS
specific gas component from a mixture. Based on the Institute 2016) to liberate the CO2.
interaction between gas molecules and the sorbent
A typical emerging adsorption technology is the Svante
surface, adsorption can be characterized as chemical
(formerly Inventys) VeloxoTherm™ system in Figure
adsorption or physical adsorption (Global CCS Institute
5. It is based on a rapid-cycle temperature swing
2016).
adsorption (TSA) process. This technology uses a
Chemical adsorption - via chemical bonding - results patented adsorbent architecture arranged in a circular
in a strong interaction between the gas molecule structure to simultaneously expose different sectors of
and sorbent, and is an appropriate choice for low- the structure to each step in the process, as shown in
concentration gas streams. Regeneration is typically Figure 5. VeloxoTherm™ is claimed to be 40 to 100 times
accomplished using a thermal swing adsorption (TSA) faster than conventional TSA processes, due to its use
process - the adsorbent is regenerated by raising its of innovative adsorbent materials which enable rapid
temperature (Hedin et al. 2013) to liberate the CO2. temperature swings from 40 to 110°C (NETL 2018a).
Physical adsorption — via van der Waals forces — has
a weaker interaction between the gas molecule and
sorbent and is typically applied to high CO2 concentration
feed streams. Regeneration is generally based on a
pressure swing adsorption (PSA) mechanism.
Figure 5 - Svante VeloxoTherm™ rotary adsorption machine concept. Source: (bctechnology 2017; Paul, Ranjeet
& Penny 2017).
15 TECHNOLOGY READINESS AND COSTS OF CCS4.3. Membranes Process innovations such as the incorporation of
countercurrent sweep2 in Membrane Technology and
Research’s (MTR) Polaris™ process, and the integration
A membrane is a barrier or medium that can separate of molten carbonate fuel cells (MCFCs)3 in capture
chemical constituents of a gas mixture based on systems have enabled the use of membranes in low-
permeation of the constituents through the membrane concentration CO2 applications.
at different rates (i.e. particular components of a
Figure 6 shows MTR’s modular membrane system. It
mixture pass through the barrier faster than the other
consists of banks of pressure vessels that are combined
components) (Drioli, Barbieri & Brunetti 2018; Global
to form a single “mega-module”. For a 240 MWe
CCS Institute 2016).
coal-fired power plant (e.g. the flue gas stream from
Generally, gas separation is accomplished by some Petra Nova unit 8), around 60 mega-modules with a
physical or chemical interaction between the membrane membrane area of approximately 0.2 to 0.4 million m2
and the gas being separated. Membrane separation would be required to capture 1.4 Mtpa CO2.
uses partial pressure as the driving force and is usually
more favourable when the feed gas stream is at high
pressure.
Figure 6 - Photos of spiral-wound membrane vessels (left) used in a commercial scale membrane system (right).
Source: (NETL 2018).
2
The countercurrent sweep process means flowing in the opposite direction with respect to the flow in the other process side.
3
MCFCs are high-temperature fuel cells operating approximately 650 oC. MCFCs use a mixture of molten potassium and lithium carbonate as an electrolyte.
16 TECHNOLOGY READINESS AND COSTS OF CCS4.4. Solid-looping
Calcium and chemical looping technologies (solid looping) involve the use of metal oxides (MeOx) or other compounds,
as regenerable sorbents to transfer either CO2 or oxygen from one reactor to another as shown in Figure 7 (Global
CCS Institute 2016). Circulating fluidized beds (CFBs), which are in commercial use now in other applications, can be
used as one or both of the reactors. Both technologies have emerged in recent years as second-generation CO2
capture technologies utilizing high-temperature streams to significantly reduce the energy penalty associated with
CO2 capture.
The use of calcium looping in Carbon Engineering’s direct air capture technology is discussed in detail in the case
studies in the next chapter.
Figure 7 - Process schematic of chemical looping
4.5. Inherent CO2 capture The Allam-Fetvedt Cycle is an innovative natural
gas (or syngas from gasification of coal) fired power
generation technology. The technology produces
There are breakthrough technologies which are pipeline-ready CO2 without the need for add-on carbon
enabling inherent CO2 capture in, which require no capture equipment. It involves oxy-fuel combustion
additional work or energy to separate CO2. These offer and the use of the produced CO2 as the working fluid
considerable promise for a step change reduction to drive a turbine which enables inherent CO2 capture,
in capture costs, but are not able to be retrofitted to compression, and dehydration as well as the elimination
existing plants as they incorporate CO2 capture into their of NOx / SOx (Allam et al. 2017; Lu et al. 2017), shown in
fundamental process design. Figure 8.
Typical examples are the Allam-Fetvedt power This technology can produce electricity with >97% CO2
generation cycle and the Calix Advanced Calciner for capture at a levelised power price approximately 22%
lime and cement manufacturing. higher than conventional natural gas combined cycle
17 TECHNOLOGY READINESS AND COSTS OF CCSFigure 8 - The Allam-Fetvedt Cycle process flow. Source: 8 Rivers Capital (supplied)
The Allam-Fetvedt Cycle
VERY HOT WATER HOT WATER COOL WATER
OXYGEN 4.75% OF MASS
2.75% OF MASS 2.75% OF MASS 2.75% OF MASS
NATURAL GAS 1.25% OF MASS
HOT CO₂
HOT CO₂ VERY HOT CO₂ COOL CO₂
97.25%
94% OF MASS 97.25% OF MASS 97.25% OF MASS
OF MASS
COMPRESSOR
AND PUMP
CLEAN WATER
2.75% OF MASS
PIPELINE READY CO₂
LINE WIDTH PROPORTIONAL TO MASS 3.25% OF MASS
today. It can also be integrated with hydrogen production Calix has developed a new type of calciner to replace
and other processes to create a plant that can efficiently the traditional rotary kiln designs found in conventional
produce power, hydrogen, ammonia and urea. cement and lime plants. Its advanced calciner employs a
“reversed” application of the calcium looping technology,
The cost premium above unabated natural gas combined
where calcination is carried out at a lower temperature
cycle power generation is projected to reduce to less
(650 – 760 oC) than the carbonation (760-850 oC). This
than 10% by 2050. CO2 transport and storage costs are
together with the inherent CO2 capture eliminates some
additional. An integrated power and hydrogen plant with
of the key technological challenges of calcium looping
100% capture of CO2 could produce clean hydrogen
processes, i.e., decay in CO2 capture capacity through
at costs which are competitive with conventional
multiple cycles, process heat integration, etc. Figure 9
production from steam methane reformation.
show the configuration of Calix Advanced Calciner with
inherent CO2 capture.
18 TECHNOLOGY READINESS AND COSTS OF CCSFigure 9 - Calix advanced calcination reactor detailed view. Source: Calix (supplied) 19 TECHNOLOGY READINESS AND COSTS OF CCS
5.0 TECHNOLOGY
     READINESS OF
     CO2 TRANSPORT
     TECHNOLOGIES
     The transport of CO2 is an essential part of the CCS       Of all CO2 transport modes, only pipelines are
     chain, connecting CO2 source(s) to CO2 storage sites.      transporting CO2 at significant scale. Over 8,000
     Today, CO2 is compressed and transported primarily         kilometres (5,000 miles) of pipelines stretch across the
     through pipelines and by ships. CO2 is also transported    United States. The United States comprises 85% of all
     by truck and rail. Fundamentally, the transportation of    CO2 pipelines, with a mix of anthropogenic and natural
     gasses and liquids via any of these methods is mature      CO2 moving approximately 70 Mtpa (National Petroleum
     (i.e. TRL 9). However, transportation of CO2 at the very   Council 2019). These pipelines have been operated with
     large scale associated with CCS has not yet been           an excellent safety record since the first CO2 pipeline
     achieved using ships or rail (Figure 10).                  for a large-scale CCS facility was commissioned in the
                                                                early 1970s.

     Figure 10 - Technical Readiness Level of CO2 Transport.

                                                                                                                  TRL 9

                                                                                                                  TRL 8

                                                                                                                  TRL 7

                                                                                                                  TRL 6

                                                                                                                  TRL 5

                                                                                                                  TRL 4

                                                                                                                  TRL 3

                                                                                                                  TRL 2

                                                                                                                  TRL 1

       COMPRESSION             PIPELINE      TRUCK              RAIL         SHIP DESIGN           SHIP
                                                                                             INFRASTRUCTURE

20   TECHNOLOGY READINESS AND COSTS OF CCS
Outside the US, CO2 pipelines are also operating in Today, CO2 is transported by small scale ships of 800–
Brazil, China, Canada, the Netherlands and Norway. 1,800 m3 from production sites to distribution terminals
Norway hosts an offshore CO2 pipeline (153-kilometre and distributed via train or truck to end-users. According
offshore pipeline for the Snøhvit CO2 storage facility). It is to the IEAGHG (IEAGHG 2020a), the maximum load size
this widespread and long-term experience of pipelines in terms of techno-economic value would be 10,000
that ultimately gives CO2 pipelines a mature rating (TRL tonnes of CO2.
8-9).
Although CO2 shipping experience is relatively limited,
In contrast to pipelines, shipping is only now being the gas industry has more than 80 years of commercial
considered for large-scale transport of CO2. Small-scale experience shipping various pressurized gases. CO2
food-grade CO2 shipping has been common practice transport by ships and the required port infrastructure
for more than three decades but has not yet been are very similar to those for Liquified Natural Gas (LNG)
implemented at scales suitable for CCS. and Liquified Petroleum Gas (LPG). It is, therefore,
reasonable to assume that the technical scale-up of CO2
The technical feasibility and the cost of CO2 shipping are
shipping to the scale required for CCS is achievable
well understood through decades of research, primarily
without major technical challenges.
in Europe, with additional studies from Korea and Japan.
The following section presents the latest developments The TRL for CO2 shipping ranges from 3 to 9. The lowest
in CO2 shipping for CCS, providing an overview of TRL-3 relates to offshore injection into a geological
technical requirements, maturity, cost, safety, regulations storage site from a ship. The TRL-9 rating refers to
and the main differences compared to pipelines. conventional onshore CO₂ injection from onshore
facilities (which can be delivered to the injection site by
The shipping of CO2 has been practised for over 30
ship).
years, but the size of the industry is small, with only
approximately 3 Mtpa of CO2 being transported by ship
in total (IEA GHG 2009). The shipping experience to
date is entirely connected with the food and beverage
sector.
21 TECHNOLOGY READINESS AND COSTS OF CCS6.0 TECHNOLOGY
READINESS OF CO2
STORAGE
The geological storage of CO2 (herein storage) is the Three forms of geological storage are technically mature:
final step in the CCS value chain. Geological storage storage through CO2-enhanced oil recovery (CO2-EOR),
permanently isolates CO₂ from the atmosphere. storage in saline formations, and storage in depleted oil
and gas fields.
Storage requires CO₂ to be compressed to very high
pressures (above 74 bar as an absolute minimum, the
critical pressure of CO₂ and typically 100 bar or more
to provide a suitable safety margin and account for 6.1. Storage through CO2-EOR
pressure drop in pipelines). The storage formation
must be at a depth of at least 800m to ensure that this
CO2-EOR has been in operation for nearly 50 years (TRL
pressure is maintained. At these high pressures CO₂ is
9) (National Petroleum Council 2019). Currently, there are
in its dense phase – a density similar to water but with
over 40 CO2-EOR operations, the vast majority hosted in
properties somewhere between a liquid and a gas.
the USA (Bui et al. 2018). The primary aim of CO2-EOR
Dense phase CO2 maximizes the mass of CO₂ that is to maximize oil recovery, not store CO2. However,
can be stored in a fixed volume, ensuring the efficient CO2 is permanently stored in the course of EOR,
use of the target geological storage volume and CO2 becoming trapped in the pore space that previously
movement is easier to predict and monitor. held hydrocarbons. Additional CO2-specific monitoring
The CO2 is stored in geological formations comparable to verify the permanent storage of the injected CO2
to those which naturally contain water, oil or gas. The is required if CO2-EOR is to be used as an emissions
injection, storage and monitoring of CO2 in those reduction option (International Energy Agency 2015).
geological formations uses essentially the same
technologies developed over nearly 50 years for
enhanced oil recovery (EOR).
Table 3 - CO2 storage options of commercial and pilot/demonstration CCS facilities. Notes: DGOF: Depleted gas
and oil field, SF: saline formation, EOR: CO2- enhanced oil recovery (Global CCS Institute 2020).
SCENARIO DEVELOPMENT CONSTRUCTION OPERATION COMPLETED
COMMERCIAL FACILITIES
DGOF 1
Onshore SF 12 3 1
EOR 9 3 21
DGOF 6
Offshore SF 9 2
EOR 1
PILOT & DEMONSTRATION PROJECTS
DGOF 1 1 4
Onshore SF 3 1 3 10
EOR 1 8 4
Offshore DGOF 1
22 TECHNOLOGY READINESS AND COSTS OF CCS6.2. Storage in Saline 6.4. Unconventional Storage
Formations
There are two leading unconventional options for the
storage of CO2; storage in Basalt and ultramafic rocks
Storage of CO2 storage in saline formations has a TRL
and storage in coal seams through Enhanced Coal Bed
of nine. Storing CO2 in saline formations has been
Methane (ECBM) production.
occurring in the North Sea since 1996. The Sleipner CCS
facility has injected over 20 Mt of CO2 into a deep saline
formation. This facility is the first use of CCS as a climate 6.4.1. Basalt and ultra-mafic rocks
mitigation tool within a commercial operation. Critically, (TRL 2-6)
the operation showed that:
Storage of CO2 in basalts and ultra-mafics depends
• CO2 could be injected at a significant rate (1Mtpa)
on mineral carbonation. The mineralogy of those rock
into saline formations
types means CO2 reacts very rapidly to form carbonate
• CO2 can be monitored minerals. Ninety percent of injected CO2 is predicted
• Storage is permanent to be mineralized within a period of a few months to
decades (Kelemen et al. 2019) in these rock formations.
Basalts are a common rock type, particularly in India, and
Since Sleipner, four commercial operations storing CO2 in in nearshore oceanic crust worldwide. The estimated
saline formations and numerous demonstration projects storage potential of mineral carbonation is 60,000,000
(Table 3) have commenced. The rapid advancement of GtCO2 (Kelemen et al. 2019).
the technology and knowledge developed from these Basaltic rock has very low permeability, hence
facilities is significant for saline formation storage. hydrologically fractured basalt or permeable zones
CO2 is being stored in different geographies, terrains, between basalt flows is targeted for CO2 injection.
and geological conditions. Geological storage always
requires site-specific analysis, modelling and monitoring. Two pilot projects have injected and stored CO2 into
This includes storage capacity prediction, injection basalts for mineralization (Global CCS Institute 2021a).
optimization and CO2 verification and quantification The pilot-scale Wallula Project (USA) injected around
through monitoring. The technology and tools required 970 t of CO2. The CarbFix Project in Iceland is injecting
to identify, appraise, utilize, monitor and close a a mix of water, 5000 tCO2 and 3500 tH2S per year. The
geological storage resource are all well established and gases are separated from the geothermal steam from
mature. the Hellisheiði geothermal power plant.
Overall, basalt is not a naturally permeable rock and
permeability is difficult to predict. Even within permeable
6.3. Storage in Depleted Oil zones, injection rates are low. The majority of tools for
conventional CCS cannot be applied to monitor a
and Gas Fields CO2 plume in a basalt. Monitoring tools for CO2 plume
verification and quantification in basaltic formations are
Geological storage in depleted oil and gas fields is still in the research phase.
technically mature (i.e. substantively no different to
storage in saline aquifers) but has a lower TRL of 5-8 as
it has only been applied in demonstration projects (Bui
et al. 2018). Twelve pilot or demonstration projects have
utilised depleted oil and gas fields (Table 3). Commercial
maturity is imminent with at least eight projects in the
CCS pipeline actively pursuing storage in depleted oil
and gas fields especially in the North Sea (Global CCS
Institute 2021a).
23 TECHNOLOGY READINESS AND COSTS OF CCS6.4.2. Enhanced coal bed methane ECBM is a viable technology and can increase methane
(ECBM; TRL 2-3) production (compared to standard coal drainage) by 90%
(Benson et al. 2005). The produced methane provides
revenue to the operation while storing the CO2. The
Coal seams naturally incorporate fractures known as major difficulty associated with ECBM is that injection of
cleats which allow gases to permeate through the coal CO2 significantly reduces the permeability of coal due to
and are essential to the operation of an ECBM storage ‘plasterisation’ and swelling of the coal (reducing the size
system. Between these fractures, the coal has abundant and connectivity of the fractures). Reduced permeability
micropores that can hold many gases, predominantly requires additional wells incurring additional costs and
methane. Coal has a higher affinity to gaseous CO2 increasing operational complexity. Moreover, ECBM can
than methane. For ECBM, CO2 is injected into the coal only be applied to coal seams which will never be mined,
seam where it is diffuses into these micropores and is otherwise the CO2 stored in them would be released to
adsorbed, displacing the methane. The methane is then the atmosphere. For that reason, deep un-mineable coal
produced for sale. seams are potential targets for ECBM operations.
Four pilot ECBM operations have been completed, one
in China and three in the USA. The San Juan ECBM
project in the USA was the largest pilot, injecting 18,000
t of CO2. There are no active ECBM projects (Global CCS
Institute 2021b).
7.0 THE COST OF
CO2 CAPTURE AND
STORAGE
The total cost of CCS consists of the costs of:
• CO2 capture at the emission source – purifying CO2 from a gas stream up to over 95% purity by volume.
• CO2 dehydration and compression/liquefaction, depending on the transport method.
• CO2 transport by pipeline, ship or mobile vehicle.
• CO2 injection, and monitoring and verification of stored CO2.
The cost of each CCS component varies from project to project, primarily due to differences in the size and location
of the CCS facility and the characteristics of the CO2 source.
Technology is a vital consideration in CCS, but it is not the only factor. A range of other factors feed into costs across
the CCS value chain.
24 TECHNOLOGY READINESS AND COSTS OF CCS8.0 COST OF CO2
CAPTURE
A key factor in CO2 capture cost is the properties of the source gas.
Table 4 summarises the CO2 characteristics of various power and industrial flue gas streams.
Table 4 - CO2 characteristics in typical industrial flue gas streams (Bains, Psarras & Wilcox 2017; Global CCS
Institute 2015; IEAGHG 1999; Grantham Institute 2014)
CO2 PARTIAL GAS STREAM INHERENT
INDUSTRY POINT SOURCE PRESSURE (WET) PRESSURE CO2
(KPA) (KPA) CAPTURE
Natural gas combined cycle (NGCC) power plant 3.8 – 4.6 Atmospheric*** No
Power Coal fired-power plant 12.2 – 14.2 Atmospheric*** No
Biomass/waste-fired power plant 10.1 – 12.2 Atmospheric*** No
Power/ Natural gas-fired power and/or heat plant
4.1 – 8.1 Atmospheric*** No
Industrial Heat (Open Cycle)
fluid catalytic cracking 10.1 - 14.2 Atmospheric*** No
Process heater 8.1 - 10.1 Atmospheric*** No
Petroleum
Refining / Ethylene production steam cracking 7.1 - 12.2 Atmospheric*** No
Petrochemicals
Steam methane reforming hydrogen production 300 – 480 2000 – 3000 No
Ethylene oxide production > 92 Atmospheric*** Yes
Kiln flue gas ~ 18 Atmospheric*** No
Cement
Pre-calciner 20 - 30 Atmospheric*** No
Pulp and paper Lime kiln ~ 16 Atmospheric*** No
COREX smelting reduction process 32 - 35 Atmospheric*** No
Hot Stove 24 - 28 Atmospheric*** No
Iron & Steel
Lime calcining 7.1 – 8.1 Atmospheric*** No
Sinter plant 3.7 – 4.2 Atmospheric*** No
Aluminium Aluminium smelter 0.8 – 1.1 Atmospheric*** No
Coal gasification syngas 750 - 2500 3000 – 6000 Yes*
Fertiliser
Natural gas reforming syngas 300 - 1200 2000 – 3000 Yes*
Natural gas Yes, acid gas
Natural gas processing Varies, up to 5000 900 – 8200+
processing removal
Bioethanol Ethanol fermentation > 85 Atmospheric*** **
* CO2 from syngas stream is captured for downstream urea production
** Only dehydration and compression required
*** Standard atmospheric pressure is 101.3 kPa, which is close to the average air pressure at sea level. However, atmospheric pressure does
vary by location and altitude.
25 TECHNOLOGY READINESS AND COSTS OF CCSFlue gas streams in most industries are produced at gas is at quite high pressure – many times atmospheric
close to atmospheric pressure (~100 kPa) with CO2 pressure. This can make CO2 partial pressures higher
concentrations between 1 vol% (aluminium smelter) than those in the captured CO2 stream.
to 35 vol% (Corex smelting reduction process in steel
CO2 capture in the power generation and industrial
plant). This makes their CO2 partial pressures quite low
sectors usually accounts for the majority of the cost in
– below 40 kPa (for a description of Partial Pressure, see
the full CCS chain.
breakout).
All else being equal, CO2 capture costs are inversely
In certain sectors, such as natural gas processing,
related to the partial pressure of CO2 in the gas stream.
fertiliser production and hydrogen production, the source
PARTIAL PRESSURE
Dalton's Law is an empirical observation of how The partial pressure of CO2 reflects the relative ease
mixtures of gases behave. It states that in a mixture with which CO2 can be captured from a gas mixture.
of gases, the total pressure of the mixture is equal to Higher partial pressures are easier and cheaper to
the sum of the partial pressures of each individual gas capture than lower pressures because less external
species in the mixture. energy is required to increase the CO2's partial
pressure to that in the final captured CO2 stream.
Each gas species in a mixture contributes to the total
pressure independently of all the others. Higher CO2 partial pressures are observed when the
fraction of CO2 is higher, the overall gas pressure is
In an ideal gas, the partial pressure of a gas in a
higher, or both.
mixture is equal to the volume fraction of that gas in
that mixture, multiplied by the total pressure.
E.g., If a gas consists of a mixture of 15 vol% CO2 and
85 vol% nitrogen, and the total pressure is 4 bar:
Partial pressure of CO2 is 0.15 x 4 = 0.60 bar
Partial pressure of nitrogen is 0.85 x 4 = 3.4 bar
8.1. How does CO2 partial capture and then recover the CO2 from the source gas.
Lower energy consumption means lower operating
pressure influence cost? costs (all else being equal).
CO2 partial pressure can also influence the cost of
The partial pressure of CO2 affects the size of process capture through the capture technologies available. For
equipment, capture plant energy requirements, and example, solvent-based capture technologies fall into
applicable capture technologies. These all contribute to two general types: chemical and physical.
the cost of capturing CO2.
Higher partial pressures enable "physical" solvents to be
Higher CO2 partial pressures mean that CO2 will used. They are generally slower than chemical solvents,
transfer more rapidly from the source gas to the solvent, but this is less of a concern at high CO2 partial pressures.
adsorbent or other media used to capture the CO2. This They also hold CO2 in solution through physical
higher speed translates into physically smaller capture mechanisms rather than chemical reactions – as such,
equipment, reducing its capital cost. Higher total gas the solution of CO2 is weaker and easier to break by
pressures also reduce the gas volume per tonne. This heating. These processes have the advantage that the
also reduces equipment size, and therefore capital cost. energy requirements for the regeneration of the capture
media (i.e. stripping the CO2 from the capture media so
High CO2 partial pressures make the task of capture
that it may be reused) are relatively low compared to
easier by reducing the input of energy needed to
other capture technologies, lowering operating costs.
26 TECHNOLOGY READINESS AND COSTS OF CCSAt low CO2 partial pressures, typically selective
"chemical" solvents are required to capture the CO2
8.3. Quantifying the impact of
stream. Chemical solvents undergo chemical reactions partial pressure and scale on
with CO2 to secure it into the solvent. These are effective
but can require large amounts of energy to subsequently
the Current Cost of Carbon
separate the captured CO2 from the solvent, increasing Capture
operating costs.
The Institute undertook process modelling of CO2
capture plants to quantify expected overall costs of CO2
8.2. How does scale affect capture across a range of applications and scales.
capture cost? A specific capture process was used for the study - a
solvent-based capture process using an aqueous solution
containing 30% by weight of MEA (monoethanolamine)
The other main factor that drives the cost of capture is
as the capture media. MEA is a chemical solvent, which
economies of scale. In most industrial processes, higher
means it is suitable for lower partial pressures of CO2 –
rates of production typically drive lower unit costs.
unlike physical solvents.
Carbon capture is no exception.
This process was chosen due to its commercial
Capital costs of process plants (including CO2 capture
availability and its capture performance over a range
plants) tend to rise non-linearly with scale – typically
of CO2 partial pressures (IEAGHG 2019; Rochelle 2009;
with the capital cost being proportional to scale to the
Bains, Psarras & Wilcox 2017). 30% MEA is well explored
power of n (where n ranges from 0.6 (single train) to 0.8
and has been deployed in capture applications in natural
(multiple trains in parallel)). The exponents can vary from
gas processing and power generation.
plant to plant – these are simply typical values (Tribe &
Alpine 1986). Although costs of other technologies will be different,
how the costs of capture vary with scale and with the
application can be interpreted as applicable for other
capture processes as well.
For a single train capture plant, a doubling of capture Capture cost was estimated as the combination of
capacity can be expected to deliver an increase in capital and operating cost for the plant, assuming an 8%
capital cost in the order of 50%. This means the capital cost of capital over 30 years, expressed in US Dollars per
cost per unit of production (i.e. cost divided by capacity) tonne of CO2 captured. This is a form of levelised cost
would be expected to fall by approximately 25%. for CO2 capture and is a consistent basis for comparison
between capture plants operating at different scales
The effect is even more pronounced for larger increases.
across different applications.
A 10 times increase in scale yields a cost saving of
approximately 60% per unit of production for a single Other assumptions in the modelling are included in the
train plant. appendices.
The effect of scale on capture cost can see significant Figure 11 shows the cost results of carbon capture from
capture plant cost savings (per tonne of CO2 captured) flue gas streams with various source gas CO2 partial
when moving from small scale (e.g. pilot plant) to full- pressures over a range of scales for each application.
scale installations capturing millions of tonnes of CO2
per year.
These scale effects are general and vary significantly
between process plants of different types. To
demonstrate the effect of scale on carbon capture, it
was investigated in an Institute modelling study.
27 TECHNOLOGY READINESS AND COSTS OF CCSFigure 11 - Impact of CO2 partial pressure and scale on the cost of carbon capture. Studied flue gas streams are
at atmospheric pressure. The circle marker indicates the cost at the maximum studied size of a single carbon
capture plant. Each grey bar indicates the capture cost ranges from 10% to 100% of the scales shown in the
callouts for that particular application.
300
COST DIFFERENCE AT VARIOUS SCALE OF PLANT
COST AT MAXIMUM STUDIED SIZE OF CAPTURE PLANT
250
200
150
100
50
0
1 2 3 4 5 6 8 10 12 14 18 22 26 30 35 41
Aluminium Smelting: Petroleum Coke / Cement Kiln Plant:
0.02 to 0.2 Mtpa CO₂ Natural Gas Power 0.18 to 1.8 Mtpa CO₂
Captured Plant: 0.12 to 1.2 Mtpa Captured
CO₂ Captured
Steel Plant Dedusting NGCC / Steel Sinter Biomass Power Plant: Coal Power Plant: Steel Hot Stove Plant: Steel COREX Plant:
Chimney: 0.04 to 0.4 Plant: 0.07 to 0.66 0.13 to 1.3 Mtpa CO₂ 0.15 to 1.5 Mtpa CO₂ 0.2 to 2.0 Mtpa CO₂ 0.2 to 2.0 Mtpa CO₂
Mtpa CO₂ Captured Mtpa CO₂ Captured Captured Captured Captured Captured
Two general trends are observed in Figure 11. However, for a given CO2 source, it is unusual to have
control over CO2 partial pressure or the scale of the
The first is that capture cost is very high (over USD 180 /
stream from which capture will occur. If multiple CO2
tonne CO2) when CO2 partial pressure is very low (1 kPa)
sources are physically close, they can be aggregated to
and falls significantly for higher partial pressures.
form a larger source gas stream. It is also possible (albeit
The second is that economies of scale become expensive) to compress the source gas to increase the
increasingly important as partial pressures get smaller. CO2 partial pressure. But more typically, the scale and
Although the percentage savings from a 10-times CO2 partial pressure will need to be taken as given.
increase in scale are similar (from top of each bar to the
The following section outlines additional ways to reduce
bottom), the much higher absolute cost numbers make
the cost of CO2 capture for specific source gas streams.
scale a more vital contributor to cost savings at lower
partial pressures.
Understanding how cost varies between industries is
useful at the macro scale when deciding where to make
CCS investments.
28 TECHNOLOGY READINESS AND COSTS OF CCSFigure 12 - Cost of carbon capture in various types of power and industrial processes, excluding downstream CO2
compression.4
300
250
200
150
100
50
0
REFINERY CEMENT IRON & STEEL
POWER GENERATION INDUSTRY SECTORS
4
For industrial processes with high concentration CO2/inherent CO2 capture process, e.g., natural gas processing, fertiliser, bioethanol, ethylene oxidation production, a cost range
of $0 – 10 per tonne of CO2 captured is assumed for CO2 conditioning. The cost is adjusted according to the prices of feedstock in the United States, e.g., $2.11 per GJ coal and $4.19
per GJ natural gas prices (James et al. 2019), as well as $8.8 per GJ wood pellets biomass (Canadian Biomass Magazine 2020).
29 TECHNOLOGY READINESS AND COSTS OF CCS9.0 COST
REDUCTION
OPPORTUNITIES IN
CARBON CAPTURE
9.1. Economies of scale and modularisation
The impact of economies of scale was further investigated over a range of flue gas volumes in two power generation
applications: Natural gas combined cycle (NGCC) and Supercritical Pulverised Coal (SCPC) (Figure 13). This was to
further examine the cost trends when the flue gas CO2 partial pressure is set, but the scale is not.
Figure 13 - Impact of plant scale on the cost of carbon capture in NGCC and SCPC. The coal and natural gas
reference prices (United States) applied are $2.11 per GJ and $4.19 per GJ (HHV) respectively (James et al. 2019).
A construction lead time of 3 years for all cases is assumed.
30 TECHNOLOGY READINESS AND COSTS OF CCSAs scale increases, capture cost declines considerably The reduced construction time, enabled by
as the capture plant scales up. The cost reductions modularisation, yields additional project financial
diminish above around 0.3 Mtpa of CO2 captured, benefits. Shorter construction periods require shorter
eventually levelling off by 0.5-0.6 Mtpa. periods of insurance, lower costs associated with
accessing or acquiring land, shorter deployment of
These findings are useful when specifying future
temporary site construction facilities or worker facilities,
power generation units with CCS or retrofit of CCS to
less time spent in the management of community and
existing units. To minimise capture costs, the capacity
compliance matters related to construction, and a
of CO2 capture units should be at least 0.4-0.45 Mtpa.
reduced requirement for the use of project management
There are certainly other advantages of scale not
staff.
considered here, such as building generation facilities
with more competitive electricity production costs – but A shorter construction period also brings forward
these factors are normally considered during the usual operational commencement and thus the benefits of
development of new power generation facilities. operation. Delays in revenue generation for any project
can significantly impact the net present value of the
The key finding is that it is essential not to make future
project as future revenues (and costs) are discounted.
generation units too small. The CCS costs become
much higher at small scales and should be avoided if By using modularisation to shorten construction times,
possible. significant savings in the above areas can be made.
Acting together, these factors may make the difference
The fact that the costs of capture level off above a
between a project meeting financial hurdles and
certain scale provides an excellent opportunity to further
proceeding to investment or failing.
reduce costs through modularisation – the standardised
production of carbon capture plants. By specifying
standard units at a sufficiently large scale (say ~0.5
Mtpa), the full economies of scale can be exploited. 9.3. Utilising low-cost energy
For applications requiring larger capture rates, multiple
capture units can simply be deployed in parallel.
supply strategies
A significant contributor to the cost of carbon capture
9.2. Modularisation is the cost of energy. For solvent-based capture plants,
that energy is mostly provided in the form of steam.
The Institute undertook a study on the cost of capture
Modular carbon capture plants are those built in a
using different regeneration heat supply strategies,
standardised way under mass production techniques.
as summarised in Figure 5. The solvent-based carbon
Typically, they are manufactured offsite in purpose-built
capture technology requires low-pressure steam for
facilities and delivered in discrete, modular components
solvent regeneration. In modern power plants and well-
(often in shipping containers). For example, Aker Carbon
heat-integrated industrial plants, the energy penalty for
Capture presently markets its modular carbon capture
carbon capture is generally reflected as either a loss of
plant under the "Just Catch" brand.
electricity generation or the investment and operation
Modular systems can reduce plant capital costs through cost of a new boiler.
increased economies of plant manufacturing scale.
In large industrial plants, such as steel, pulp and paper,
Modular carbon capture plants also help reduce costs
and waste to energy plants, the heat supply from the
through (Global CCS Institute 2020):
combined heat and power (CHP) plants can be used.
• Standardised plant foundations This heat, in turn, supports the efficient carbon capture
process integration without building a new boiler. CHP
• Standardised plant designs, including all
plants can be deployed rapidly and cost-effectively
engineering drawings
with little geographical limitation. CHP plants can use a
• Remote or automated operation variety of fuels, both fossil and renewable-based.
• Modular packaging, which greatly reduces on-site In cement, iron and steel production, there are also
construction time and costs. ample opportunities to use waste heat from the
production processes to bring the capture cost down.
31 TECHNOLOGY READINESS AND COSTS OF CCSYou can also read