Canada: A World-leader in Environmental Performance - Women and Progress Canadian Health Care - Fraser Institute
←
→
Page content transcription
If your browser does not render page correctly, please read the page content below
SUMMER 2018
                                                                     Winter 2015

                                                                                 Canada: A World-leader
                                                                             in Environmental Performance
CANADIAN PUBLICATION MAIL SALES PRODUCT AGREEMENT NUMBER 40069269

                                                                                   BC's Carbon Tax Not School Choice in
                                                                    ALSO INSIDE    Revenue   Neutral
                                                                                   Electricity in Ontario Sweden
                                                                                                          Women and
                                                                                                                 and Australia
                                                                                                                     Progress    Canadian Health Care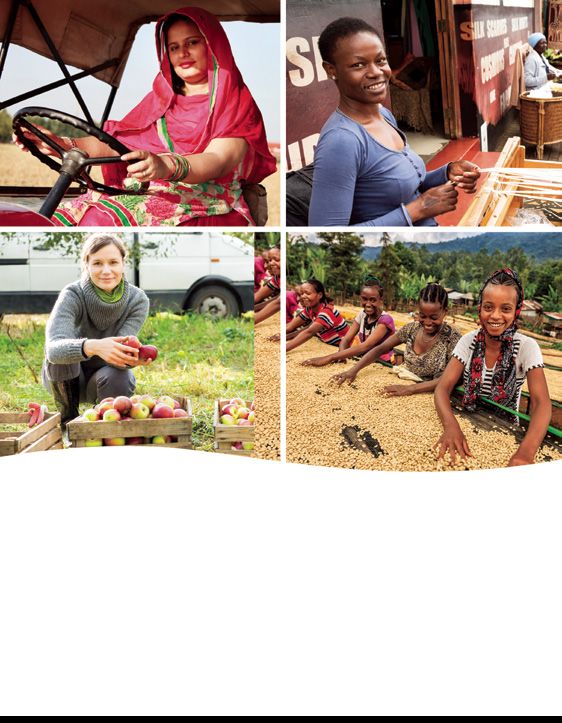
FRASER
INSTITUTE MESSAGE FROM THE INSTITUTE'S PRESIDENT
Dear Fraser Institute Friends and Supporters,
Canadians are bombarded with negative news about our
environmental record from activists and others opposed to the
development of Canada’s natural resources. It’s why we recently
released a major new study, Environmental Ranking for Canada and
the OECD (see page 12).
This peer-reviewed study ranks 33 high-income countries on a wide
range of environmental indicators that relate both to the protection
of human health, such as air pollution, and the preservation of
Canada’s ecosystems, such as water quality.
The study’s main finding is that Canada is a world leader in
environmental performance! Canada’s overall environmental record
ranks in the top ten among comparable high-income countries and
more specifically, we rank 9th in air quality and 3rd in water quality.
Given that Canada is much larger and colder than the other
comparator countries and has a large natural resource industry,
these results are even more impressive. Rather than be shamed by
rhetoric unsupported by facts, Canadians should be proud of their
Niels Veldhuis environmental record.
President, Fraser Institute This is just one of the 35 studies we published in the first five months
of 2018.
Several other important studies and commentaries are highlighted in
this issue of The Quarterly.
This includes Time for Tax Reform in Ontario (page 4) which
provides a detailed proposal to replace Ontario’s overly complex
personal income tax rate system with a simple and fair single rate
personal income tax of 8 percent. It also proposes to reduce the
corporate income tax rate to match the personal 8 percent rate—
which would make Ontario one of the most competitive pro-growth
tax jurisdictions and help the province compete for business
investment and skilled labour with neighbouring US jurisdictions.
If Ontarians again want their province to be one of the most
attractive jurisdictions on the continent, big ideas like this
are needed.
I would also recommend "Canadian Health Care—Big Bills, Terrible
System" on page 18, which highlights the findings of a recent Fraser
Institute study comparing Canada to other developed countries with
more successful universal health-care systems.
I unfortunately cannot highlight all of the important work contained
in this issue, but I would encourage you to read it all. After you are
finished doing so, please pass this issue on to your friends, family
and/or colleagues.
As always, thank you for your ongoing support.
Best,
Niels
THE
      Quarterly
      New Research
                         Understanding the Changes in Ontario’s Electricity Markets                      2
                         Policymakers Should Consider Transformative Tax Reform for Ontario                        4
                         CPP Expansion Will Shrink Available Pool of Investment Capital in Canada                      6
                         Pipeline Obstructionism Costing Canada Billions                   8
                         Greater Economic Freedom— The Key to
                         Better Lives for Women in the Middle East and Beyond                       10
                         Canada is an Environmental Leader, Not a Laggard                      12

      Recent Columns
                         Canadian Health Care—Big Bills, Terrible System                   16
                         Alberta Can Learn Big Lessons from Small First Nation                      18
                         BC Government Sending All the Wrong Signals to Investors                        20
                         In Florida, They’re Snowbirds—in BC, They’re “Speculators”                      22
                         Grits and Tories Both Wrong on Ontario Minimum Wage Policy                       24
                         The Last Straw for Entrepreneurs and Businesses in Canada?                      26
                         Alberta’s NDP Buys Another Ticket
                         for the Resource Revenue Roller-Coaster                28

      Education Programs
                         A Review of Education Programs Across the Country                          30

      Staff Profiles
                         Josef Filipowicz       32

RETURN UNDELIVERABLE CANADIAN ADDRESSES TO:
The Fraser Institute, 4th Floor, 1770 Burrard Street, Vancouver, British Columbia Canada V6J 3G7             Summer 2018   | 1
FRASER
 INSTITUTE    NEW RESEARCH

Understanding the Changes
in Ontario’s Electricity
Markets
Elmira Aliakbari, Kenneth Green, Ross McKitrick, and Ashley Stedman

Energy consumption is a driv-                                                     phasing out coal. The next major
er of economic growth. Poli-                                                      step occurred in 2009 when
cymakers in Ontario have                                                          the government launched its
made poor policy decisions,                                                       Green Energy Act (GEA). The
resulting in rising electricity                                                   centerpiece of the GEA was a
                                                                                  Feed-In-Tariff program, which
costs, lower employment, and
                                                                                  provides long-term guaranteed
lower competitiveness, while
                                                                                  contracts to generators with
achieving minimal environ-
                                                                                  renewable sources (wind, solar,
mental benefits. A recent col-                                                    etc.) at a fixed price above
lection of essays published by                                                    market rates. In order to fund
the Fraser Institute, Understanding the Changes        these commitments, as well as the cost of conservation
in Ontario’s Electricity Markets and Their Effects,    programs, Ontario levied a non-market surcharge on
critiques the reasoning behind Ontario’s electric-     electricity called the Global Adjustment (GA). Between
ity policy changes and spells out the long term        2008 and 2016, the GA grew more than 70 percent,
consequences of those changes.                         causing a drastic increase in electricity prices. The high
                                                       cost associated with aggressively promoting renewable

O    ntario’s main policy shift began around 2005
     when the government made a decision to begin
                                                       sources is particularly troubling given the relatively small
                                                       amount of electricity generated by these sources. In

2 |    The Quarterly: News and information for supporters and friends of the Fraser Institute
2016, renewable sources generated less than 7 percent            Vancouver. Some select large industrial consumers
of electricity in Ontario while accounting for almost 30         were granted rate reductions but still paid higher rates
percent of the GA.                                               compared to large electricity users in Quebec, Alberta,
                                                                 and British Columbia.
Ontario’s decision to phase out coal contributed to rising
electricity costs in the province, a decision justified at the   Soaring electricity costs in Ontario have placed a signifi-
time with claims that it would yield large environmental         cant financial burden on the manufacturing sector and
and health benefits. The subsequent research showed              hampered its competitiveness. Compared to multiple
that shuttering these power plants had very little effect        comparable American and Canadian jurisdictions,
on air pollution. Had the province simply continued with         Ontario has exhibited the most substantial decline in
retrofits to the coal plants then underway, the environ-         its manufacturing sector over the past decade. Overall,
mental benefits of the shift to renewables could have            Ontario’s high electricity prices are responsible for
been achieved at one-tenth the cost.                             approximately 75,000 job losses in the manufacturing
                                                                 sector from 2008 to 2015.
The issue of rising electricity costs in Ontario can be
partly attributed to the imbalances between supply               Given the critically important role that affordable energy
and demand of electricity. Between 2005 and 2015, the            plays in economic growth and prosperity, the Ontario
province decided to increase its renewable capacity to           government needs to pursue meaningful policy reforms
facilitate the coal phase-out. However, since renewable          aimed at lowering electricity costs for all Ontarians.
sources are not as reliable as traditional sources, the
government contracted for more natural gas capacity
as a back-up. Meanwhile, the demand for electricity
declined, partly due to rising electricity costs. The
increase in the total installed capacity, coupled with
lower electricity demand, has resulted in excess
production being exported to other jurisdiction at a
significant loss.

As a result of these structural shifts and poor gover-
nance, electricity costs have risen substantially in
Ontario. Ontario now has the fastest growing electricity
                                                                     ELMIRA ALIAKBARI       KENNETH P. GREEN
costs in the country and among the highest in North
America. Between 2008 and 2016, Ontario’s residential
electricity costs increased by 71 percent, far outpacing
the 34 percent average growth in electricity prices
across Canada. In 2016, Toronto residents paid $60 more
per month than the average Canadian for electricity.

Ontario’s skyrocketing electricity rates also apply to
the province’s industrial sector. Between 2010 and                    ROSS McKITRICK       ASHLEY STEDMAN

2016, large industrial users in Toronto and Ottawa
                                                                    Elmira Aliakbari is associate director, Natural Resource
experienced cost spikes of 53 percent and 46 percent,               Studies, Kenneth Green is senior director, Natural
respectively, while the average increase in electric                Resource Studies, Ross McKitrick is a senior fellow,
costs for the rest of Canada was only 14 percent. In                and Ashley Stedman is a senior policy analyst at the
                                                                    Fraser Institute. They are contributing editors to the
2016, large industrial users paid almost three times                publication Understanding the Changes in Ontario’s
more than consumers in Montreal and Calgary and                     Electricity Markets and Their Effects.
almost twice the prices paid by large consumers in

                                                                                                       Summer 2018       | 3
FRASER
 INSTITUTE      NEW RESEARCH
                INFOGRAPHIC

Policymakers Should
Consider Transformative
Tax Reform for Ontario
Ben Eisen, Steve Lafleur, and Joel Emes

It’s hard to think of a juris-                                                    Comparing Ontario’s top PIT
diction in North America                                                          rate to other jurisdictions under-
more desperate for serious                                                        scores the province’s competi-
discussion about innovative                                                       tiveness     problem.       Again,
pro-growth public policy                                                          the top marginal rate is criti-
than Ontario.                                                                     cally important because that’s
                                                                                  what influences the economic

W       hen it comes to economic                                                  decision-making of doctors,
        growth, government debt,                                                  lawyers, professionals, entre-
private-sector job creation, or                                                   preneurs, and other highly
median       household     income                                                 skilled professionals.
growth, Ontario’s performance
over the past decade has been                                                     At 53.53 percent, Ontar-
the worst, or among the worst, in Canada. Given this        io’s is the second highest top combined federal/
record, it’s high time that public discourse in Ontario     provincial (or federal/state) marginal income tax
include important policy issues and big ideas for change.   rate in Canada and the United States. Nearby states
                                                            with whom Ontario competes, including Michigan,
Perhaps the best place to start is a fundamental
                                                            Pennsylvania, and Indiana, all have top marginal
re-examination of Ontario’s approach to personal
                                                            rates that are lower by more than 10 percentage
income taxation. Ontario’s uncompetitive personal
                                                            points. Clearly, Ontario is uncompetitive in the
income tax (PIT) system (with seven brackets and a
                                                            PIT arena.
top combined federal/provincial marginal rate of 53.53
percent), can discourage higher-skilled Ontarians           Another tax measure that a competitiveness-oriented
from engaging in productive activity such as work and       provincial government could take to boost growth
entrepreneurship, through which they would create           prospects would be to reduce Ontario’s general corpo-
opportunities for other Ontarians.                          rate income tax (CIT) rate.

4 |     The Quarterly: News and information for supporters and friends of the Fraser Institute
Recent federal corporate tax reform in the United States
has wiped away Ontario’s former business tax advantage
over all US states, harming the province’s overall ability to   The Ontario government could tax
attract entrepreneurs and investment. Although Ontario          all taxable income—personal income
is not as uncompetitive on business taxes as it is for the
                                                                and general business income—at the
PIT, these recent changes in the states represent a real
new source of competitive pressure.                             same single rate of 8 percent. This
To address both challenges, the Ontario government              reform… would transform Ontario
could tax all taxable income—personal income and                into one of the most attractive tax
general business income—at the same single rate of 8
                                                                jurisdictions in North America for
percent. This reform, detailed in a recent Fraser Institute
study, Time for Tax Reform in Ontario, would transform          investment and talent.
Ontario into one of the most attractive tax jurisdictions
in North America for investment and talent.

On the PIT, this reform would leave Ontario with a top
combined rate of 41 percent. Instead of the second              Specifically, holding nominal spending for this fiscal year
highest marginal PIT rate in Canada and the US, Ontario         at 2017-18 levels (instead of proceeding with a planned
would have the 12th lowest.                                     6 percent spending increase) would “pay for” more
                                                                than half the fiscal cost of this proposed reform. One
                                                                more year of frozen nominal spending would cover the
                                                                remainder, and then some. And importantly, this conser-
When it comes to economic growth,                               vative calculation doesn’t account for the increased
government debt, private-sector job                             economic growth and resulting increases in government
                                                                revenue that such pro-growth tax reduction would likely
creation, or median household income                            generate. Clearly, pro-growth tax reform is possible if
growth, Ontario’s performance over                              it’s a priority.

the past decade has been the worst—
or among the worst—in Canada.

On the corporate income tax, a 3.5-point reduction from
11.5 percent to 8 percent would leave Ontario with one
of the lowest combined federal/provincial statutory
general corporate tax rates in the two countries, higher
only than a handful of US states.
                                                                      BEN EISEN        STEVE LAFLEUR         JOEL EMES
Some may object that such tax reductions, which would
cost the province approximately $11 billion in 2018/19            Ben Eisen is director of Provincial Prosperity Studies,
(including provisions to ensure lower and middle-income           Steve Lafleur is a senior policy analyst, and Joel Emes
                                                                  is a senior fellow with the Fraser Institute. They are
families are not made worse off by the changes), are not          co-authors of the recently published study, Time for
fiscally prudent. But they are affordable if the govern-          Tax Reform in Ontario.
ment is willing to exercise spending restraint.

                                                                                                     Summer 2018         | 5
FRASER
 INSTITUTE     NEW RESEARCH

CPP Expansion Will Shrink
Available Pool of Investment
Capital in Canada
Charles Lammam, Taylor Jackson, and Joel Emes

                                       Expansion of the Canada Pension Plan
                                       and the Unintended Effect on Domestic
                                       Investment

                                       Charles Lammam, Taylor Jackson, and Joel Emes

Canada has a growing invest-                                                                    sion of existing operations, and
ment problem.                                                                                   investments in new machines
                                                                                                and technology—all of which
Business investment (exclud-                                                                    are critical for improving the
ing residential structures—                                                                     economy and living standards
houses, condos, etc.) has                                                                       of Canadian workers.
dropped nearly 20 per cent
                                                                                                 Starting in 2019, Ottawa and the
since 2014, and the level
                                                                                                 provinces will force Canadian
of business investment (as                                                                       workers to increase their CPP
a share of the economy) in                                                          2018
                                                                                                 contributions, with increases
Canada is now second lowest                                                                      phased in over seven years.
among 17 advanced coun-                                                                          However, in the past (between
tries. Meanwhile, foreign direct investment into                         1996 and 2004) when Canadian households were forced
Canada has plummeted, and the ongoing saga of                            to increase their CPP contributions, they reduced the
the Trans Mountain pipeline raises serious ques-                         amount they saved in private vehicles such as RRSPs,
                                                                         mutual funds and TFSAs. In fact, research found that
tions about Canada’s ability to attract capital for
                                                                         for every one dollar increase in CPP contributions, the
major resource projects.
                                                                         average Canadian household reduced its private savings

U
                                                                         by approximately 90 cents.
     nfortunately, expansion of the Canada Pension Plan
     (CPP), which begins next year, will make the                        As the CPP expands, and more and more money shifts
investment problem even worse by reducing the                            from private saving vehicles to the CPP, there will be a
money available for domestic investment. This matters,                   decline in domestic investment. Why?
because a shrinking pool of domestic investment could
leave less money available in Canada to finance innova-                  Because the private savings of Canadian households are
tive startup businesses, the maintenance and expan-                      predominantly invested in Canada, due to a phenomenon

6 |     The Quarterly: News and information for supporters and friends of the Fraser Institute
PERCENTAGE OF ASSETS INVESTED IN FOREIGN MARKETS

                100
                                                                                                     84%
                80
   PERCENTAGE

                60

                40

                             18%                                22%
                20

                 0
                      Household Financial               Household Equity and                         CPP Fund
                            Assets                     Investment Fund Assets
                                                                                      .

known as “home bias,” where private investors prefer            The solution to the potential decline in domestic invest-
investing in their home country over foreign countries.         ment is not to impose foreign investment restrictions
For example, in 2016/17, Canadian households kept 82.2          on the CPPIB. This is a bad idea—the CPPIB (and Cana-
per cent of their financial investments in Canada, with         dians more broadly) should be free to invest broadly in
only 17.8 per cent invested in other countries.                 assets that will generate the highest risk-adjusted rate
But the opposite is true for the Canada Pension Plan            of return, regardless of location.
Investment Board, which manages the invested portion
                                                                But at a time when investment in Canada is declining,
of CPP contributions. In 2016/17, 83.5 per cent of CPPIB’s
                                                                expanding the CPP will only add to the country’s invest-
holdings were invested outside Canada—only 16.5 per
                                                                ment woes. In response, Canadian governments should
cent in Canadian investments.
                                                                pursue policies to help spur investment, and in many
To recap, as governments force Canadian households to           cases this means a complete U-turn on the policy
increase their CPP contributions, they will reduce their        approach taken over the past three years.
private savings, which would have mostly been invested
within Canada. So, the amount of money available for
investment in Canada will decline compared to the
amount available if the CPP was not expanded.

Crucially, as noted in a recent Fraser Institute study, if
Canadians respond to the upcoming CPP expansion
like they did during the last CPP expansion—that is, by
reducing their private savings by roughly 90 per cent for
each additional dollar contributed to the CPP—we esti-
mate that in 2019 domestic investment would be approx-
imately $1.1 billion lower. By 2030, five years after the CPP      CHARLES LAMMAM     TAYLOR JACKSON            JOEL EMES
expansion is fully implemented, the annual reduction in
financial assets invested by Canadian households in the            Charles Lammam, Taylor Jackson, and Joel Emes are
                                                                   the co-authors of the Fraser Institute study Expansion
domestic market will be $14.8 billion. Cumulatively, CPP
                                                                   of the Canada Pension Plan and the Unintended Effect
expansion could result in a reduction in domestic invest-          on Domestic Investment.
ment up to $114 billion from 2019 to 2030.

                                                                                                      Summer 2018           | 7
FRASER
 INSTITUTE      NEW RESEARCH

Pipeline Obstructionism
Costing Canada Billions
Elmira Aliakbari and Ashley Stedman

                                          FRASER
                                          RESEARCH              BULLETIN
                                          FROM THE CENTRE FOR NATURAL RESOURCE STUDIES                                          May 2018

                                          The Cost of Pipeline
                                          Constraints in Canada
                                          by Elmira Aliakbari and Ashley Stedman

                                          Main Conclusions

                                           Despite the steady growth in crude oil
                                                                                           From 2013 to 2017, after accounting for

The recent decision by Kinder                  available for export, new pipeline proj-
                                               ects in Canada continue to face delays
                                                                                               quality differences and transportation
                                                                                               costs, the depressed price for Canadian
                                                                                                                                           to oppose the project, despite
                                               related to environmental and regula-            heavy crude oil has resulted in CA$20.7

Morgan, one of the largest                     tory impediments as well as political
                                               opposition.
                                                                                               billion in foregone revenues for the Ca-
                                                                                               nadian energy industry. This significant
                                                                                                                                           regulatory approval, and is
                                                                                               loss is equivalent to almost 1 percent of

energy infrastructure compa-
                                           Canada’s lack of adequate pipeline ca-

                                               pacity has imposed a number of costly
                                                                                               Canada’s national GDP.
                                                                                                                                           pursuing legal means to regu-
                                               constraints on the nation’s energy sec-       In 2018, the average price differen-


nies in North America, to halt
                                               tor including an overdependence on
                                               the US market and reliance on more
                                                                                               tial (based on the first quarter) was
                                                                                               US$26.30 per barrel. If the price differ-   late the movement of diluted
                                               costly modes of energy transportation.          ential remains at the current level, we

all “non-essential spending”
                                               These and other factors have resulted
                                               in depressed prices for Canadian heavy
                                                                                               estimate that Canada’s pipeline con-
                                                                                               straints will reduce revenues for Cana-     bitumen through its territory.
                                               crude (Western Canada Select) relative          dian energy firms by roughly CA$15.8

on the Trans Mountain
                                               to US crude (West Texas Intermediate)
                                               and other international benchmarks.
                                                                                               billion in 2018, which is approximately
                                                                                               0.7 percent of Canada’s national GDP.       Such political opposition raises
                                                                                                                                           serious concerns about whether
                                           Between 2009 and 2012, the average
                                                                                           Insufficient pipeline capacity has re-

pipeline expansion—which
                                               price differential between Western              sulted in substantial lost revenue for
                                               Canada Select (WCS) and West Texas              the energy industry and thus imposed

                                                                                                                                           the pipeline will actually
                                               Intermediate (WTI) was about 13 per-            significant costs on the economy as a

would run from Alberta,
                                               cent of the WTI price. In 2018 (based on        whole, and will continue to do so. This
                                               the first quarter data), the price differ-      reaffirms Canada’s critical need for ad-

                                                                                                                                           be built.
                                               ential surged to 42 percent of the WTI          ditional pipeline capacity.
                                               price.

through British Columbia, to
the coast—made headlines                  fraserinstitute.org                                             FRASER RESEARCH BULLETIN 1       So what are the consequences
across the country.                                                                                                                        of all these delays? How is pipe-
                                                                                                                                           line obstructionism affecting

S    tories have focused on inter-provincial rivalries
     and trade wars. But an often ignored or misunder-
stood aspect of the pipeline debate is how much Cana-
                                                                                            our energy industry?

                                                                                            Consequences include an overdependence on the US
dians lose by not having sufficient pipeline capacity to                                    market, increased reliance on more costly modes of
deliver our oil to market. According to a recent Fraser                                     energy transportation, and rising oil inventories in
Institute study, The Cost of Pipeline Constraints in                                        Western Canada. Because of Canada’s lack of pipe-
Canada, Canadian oil producers will lose $15.8 billion in                                   line capacity, oil producers have been shipping their
revenue this year. More on that in a moment.                                                crude by rail, a higher-cost mode of transportation.
Despite increased oil production in recent years,                                           Higher rates for crude by rail mean that Canadian
Canada has been unable to build any new major pipe-                                         oil producers absorb higher transportation costs,
lines due to the cancellation of the Northern Gateway                                       leading to lower prices for Canadian crude and a wider
and Energy East projects, and ongoing delays in the                                         price differential.
Trans Mountain expansion, Enbridge’s Line 3 replace-                                        Moreover, rail transport is less safe than pipelines, which
ment project, and Keystone XL.                                                              is bad news for people and the environment. In fact, as
Take the Trans Mountain pipeline expansion, for                                             shown in another Fraser Institute study, Safety First:
example. The government of British Columbia continues                                       Intermodal Safety for Oil and Gas Transportation, pipe-

8 |     The Quarterly: News and information for supporters and friends of the Fraser Institute
lines are 2.5 times safer (i.e., less likely to experience an
oil spill) than rail transport.
Inadequate pipelines has increased the price differential
Consider this. There’s always been a price difference between Canadian and US oil resulting in
between Western Canada Select (WCS) and US crude
a loss of $15.8 billion for the energy sector this year
(West Texas Intermediate) due to transportation costs
and the difference in quality between the two prod-
ucts. Between 2009 and 2012, the price difference was
13%*
roughly 13 percent (of the US crude price). And that
difference was seen by producers as one of the costs of 42%*
doing business in Canada.
Because of Canada’s lack of pipeline
capacity, oil producers have been 2009-2012 2018
shipping their crude by rail, a higher-
cost mode of transportation. Higher * Western Canadian Select (WCS) and West Texas Intermediate (WTI)
rates for crude by rail mean that
Canadian oil producers absorb answer to that question may seem self-evident to many
higher transportation costs, leading Canadians, as obstructionism is now a constant feature
on Canada’s energy scene.
to lower prices for Canadian crude
Because pipelines take time to plan and construct, these
and a wider price differential.
losses will continue for the foreseeable future. In other
words, there’s almost no way to stem these losses in
the short term. Unless Canadians are willing to continue
to incur large losses and less investment, policymakers
But recently, this price difference has skyrocketed. In
must ensure pipelines get built over the next two or
2018, the average price difference between Canadian oil
three years.
(WCS) and US oil (WTI)—based on first quarter data—
was US$26.30 per barrel, which represents a discount Simply put, pipeline obstructionism is hurting the
of 42 percent. country. Canada’s need for new pipelines is critical.
Consequently, Canadian heavy oil producers will lose
$15.8 billion this year in revenues compared to what
other producers of similar products are receiving.
That’s roughly 0.7 percent of our national economy lost
because we can’t deliver our product to international
markets to secure better prices.
Finally, this loss of revenue has far-reaching effects.
It means less investment in Canada, less job-creation
for Canadian employers and workers, and less overall ELMIRA ALIAKBARI ASHLEY STEDMAN
prosperity. Indeed, investment in Canada’s energy
industry, particularly foreign investment, is collapsing. Elmira Aliakbari is associate director, Natural Resource
Studies, and Ashley Stedman is a senior policy analyst
The Trudeau government admitted as much by recently at the Fraser Institute. They are co-authors of The Cost
funding a study to find out why Canada’s industry, once of Pipeline Constraints in Canada.
a global leader, is now hemorrhaging investment. The
Summer 2018 | 9FRASER
INSTITUTE NEW RESEARCH
Greater Economic Freedom—
The Key to Better Lives for
Women in the Middle East
and Beyond
Rosemarie Fike
Recently, the Bill & Melinda For example, millions of women
Gates Foundation pledged are barred from moving freely
$170 million to advance within their countries or travel-
women’s economic empow- ling abroad. They face barriers to
erment worldwide. This owning and inheriting property.
pledge, made just prior to They can’t register a business
International Women’s Day, or enter into contracts the same
way as men can. And they’re
is wonderful news as new
unable to open bank accounts
research shows that increased
or obtain loans. Moreover, their
economic freedom—the abil-
testimony in court does not
ity of individuals to make
Impact of Economic Freedom carry the same weight. They
their own decisions about
and Women’s Well-Being face restrictions on the number
what to buy, where to work, ROSEMARIE FIKE
of hours they can work and type
whether to start a business
of profession they pursue. In
or engage in trade—dramati-
19 countries, women need the
cally improves women’s lives around the world.
permission of their husbands to simply obtain a job.
E conomic freedom has been widely shown to pro-
mote more robust economies, higher levels of
income, greater protection of civil liberties, reductions
A 2016 study, Gender Disparity in Legal Rights and Its
Effect on Economic Freedom, introduced a Gender
Disparity Index, which uses several measures to capture
in poverty, and improvements in health and educa- gender disparity worldwide including freedom of move-
tional outcomes. Yet in many countries, particularly in ment, property rights, financial rights, freedom to work
the Middle East and Africa, the institutions that protect and legal status.
economic freedom are not equally shared between men
and women so it’s more difficult (or sometimes impos- Which countries rank near the bottom in rights for
sible) for women to share those benefits. women relative to men?
10 | The Quarterly: News and information for supporters and friends of the Fraser InstitutePERCENTAGE OF WOMEN IN WORKFORCE, 2015 ways when they are afforded higher levels of economic
freedom (adjusted for gender disparities).
50
40
30 In countries with higher levels of
50
20 44.6
economic freedom for women,
40
10 23.5
30
0
women live more than 15 years
44.6
20 Countries with high levels of Countries with low levels of longer (on average), are nearly twice
economic freedom economic freedom
10 23.5 as likely to have a job, and have
0
Countries with high levels of Countries with low levels of
higher literacy rates.
40
PERCENT OF FEMALES
economic freedomEMPLOYED IN VULNERABLE
economic freedom
OCCUPATIONS, 2015
30
40 For example, in countries with higher levels of economic
20 37.8
freedom for women, women live more than 15 years
30
10 longer (on average), are nearly twice as likely to have a
13.3 job, and have higher literacy rates. Crucially, in economi-
20
0 37.8 cally free countries, more than 80 percent of women
Countries with high levels of Countries with low levels of have bank accounts compared to just 25 percent in
10 economic freedom economic freedom
13.3 countries with low levels of economic freedom. And
0 when women are more economically independent—that
100Countries with high levels of Countries with low levels of is, when they are not solely reliant on men for their well-
economic freedom economic freedom being—their life options increase 84%
significantly.
80
And so, in Canada and beyond, let’s truly help improve
100 not surprisingly, low-ranking countries include
Perhaps the lives of women and girls everywhere by encour-
PERCENTAGE PERCENTAGE
60 84%
Saudi Arabia, Jordan, the United Arab Emirates, Oman, aging equal access to economic institutions that help
and 80
Qatar. Yet many of these countries have typically protect economic freedom and allow women worldwide
40
ranked high in measurements of economic freedom. For the ability to make their own economic decisions. Only
60
example, Saudi Arabia ranked 64th out of 180 countries
18% 22%
when women are free to make these decisions will they
20
in economic freedom by the Heritage Foundation in 2017. live truly better, more prosperous, and healthier lives.
40
However, the Fraser Institute, which publishes the annual
0
Economic Freedom of 18%
the World report, has incorpo- 22%
20 Household Financial Household Equity and CPP Fund
rated gender disparityAssets
in its 2017 rankings. And tellingly,
Investment Fund Assets
Saudi Arabia falls from 99th to 122nd (out of 159 coun- .
tries)0in economic freedom. Indeed, when women’s lack Rosemarie Fike teaches economics
Household
of access to institutions Financial
that Household Equity and
protect economic freedom CPP FundUniversity and
at Texas Christian
Assets Investment Fund Assets is a Fraser Institute senior fellow.
is properly accounted for, Saudi Arabia ranks among the . She is the author of Women and
world’s least-free countries. Progress: Impact of Economic
Freedom and Women’s Well-Being.
And as my recent study, Women and Progress: Impact
To learn more visit:
of Economic Freedom and Women’s Well-Being, finds, ROSMARIE FIKE womenandprogress.org
women’s lives markedly improve in several important
Summer 2018 | 11FRASER
INSTITUTE NEW RESEARCH
Canada is an
Environmental Leader,
Not a Laggard
Ross McKitrick, Elmira Aliakbari, and Ashley Stedman
According to a new Fraser Canada near the bottom of OECD
Institute study, Environ- countries in terms of environ-
mental Ranking for Canada mental performance, unfairly
and the OECD, despite casting Canada in a negative light.
misguided claims to the For example, many of these
contrary, Canada has an studies failed to connect envi-
excellent environmental rec- ronmental measures to things
ord when compared to most people value. For instance, a
of the world’s wealthiest— study by the Conference Board
and cleanest—countries. of Canada used air emissions per
person to measure air quality,
T he study compares and but ignored the fact that a few
ranks 33 high-income coun- large industrial operations in
tries in the Organization for some Canadian provinces (the
Economic Co-operation and oilsands, for example) can skew
Development (OECD) on a wide range of measures this measure, painting a distorted picture about the air
including air and water quality, greenhouse gases, and quality changes in urban areas where most people live.
biodiversity. The study provides an aggregate score
The Conference Board report also looked at waste
(zero to 100.0) across 17 indicators to provide an easy
generation—without accounting for disposal methods.
way to understand Canada’s performance compared to
Subsequently, the report equally ranked two countries
that of other wealthy countries.
that produced the same amount of waste, regardless
Overall, Canada ranks 10th with a score of 68.5 (out of of where the garbage wound up. The way waste is
100)—well above the OECD average (62.9) and only five handled—not necessarily how much is produced—is a
points behind third place New Zealand. Sweden ranks better measure of environmental protection.
first overall with a score of 78.9.
For our study, we started from scratch, using a compre-
Unfortunately, previous studies by other organizations hensive and transparent methodology based on an envi-
used narrow and often mistaken methods, which placed ronmental index developed by academics at Yale and
12 | The Quarterly: News and information for supporters and friends of the Fraser InstituteColumbia universities, allowing us to compare Canada’s over a decade, Canada ranks 17th with a score of 82—
environmental performance with that of other OECD but 7th place Italy is not much higher, with a score of 92.
countries on measures that matter most to the health of
Overall, the evidence is clear. Canadians enjoy high
people and the ecosystem.
levels of environmental quality relative to other high-
income countries. And in areas where Canada’s ranking
is low, it’s sometimes unavoidable due to our geography
or climate, or because we compare ourselves against a
What would be the result if other
peer group where everyone is doing well.
countries had to contend with
typical Canadian distances? If one
adjusts for land mass, Canada’s On a number of measures in our
ranking would rise from 31st to study, almost all OECD countries do
2nd place on the greenhouse gas well. So even if Canada ranks lower
intensity measure. on any particular measure, there’s
often little difference between us
and the top performers.
Again, our analysis ranks Canada among the cleanest of
the clean.
For example, Canada’s performance on greenhouse gases The reality is that most wealthy developed countries
is a much misunderstood topic. Using the methodology
have established sound environmental protection
developed by academics, Canada ranks 31st out of 33 on
regimes, and Canada—despite what some critics claim—
carbon intensity, which measures CO2 emissions relative
fares well when compared to the best performers in the
to the size of the economy. Given Canada’s cold climate,
world. That’s something all Canadians can celebrate.
large natural resource sector, and long transportation
distances, this result may not be surprising for many.
But most of the other OECD countries have milder
climates and higher population densities, which result
in lower daily energy needs. Clearly, the size of a coun-
try’s land mass drives some of its need for energy and
subsequent greenhouse gas emissions. So what would
be the result if other countries had to contend with
typical Canadian distances? If one adjusts for land mass,
Canada’s ranking would rise from 31st to 2nd place on
the greenhouse gas intensity measure.
Finally, it’s important to note that on a number of
ROSS McKITRICK ELMIRA ALIAKBARI ASHLEY STEDMAN
measures in our study, almost all OECD countries do
well. So even if Canada ranks lower on any particular Ross McKitrick is a senior fellow, Elmira Aliakbari is
measure, there’s often little difference between us and associate director, Natural Resource Studies, and
Ashley Stedman is a senior policy analyst at the
the top performers. For example, on reduced sulphur Fraser Institute. They are co-authors of Environmental
emission intensity, which assesses each country’s prog- Ranking for Canada and the OECD.
ress on lowering emissions per unit of economic activity
Summer 2018 | 13Feature Infographic
Canada is in the top 10 among high-income countries
for overall environmental performance
CANADA
#10 out of
33 OECD countries
United Kingdom
Slovak Republic
New Zealand
Luxembourg
Switzerland
CANADA
Denamrk
Australia
Slovenia
Sweden
Norway
Finland
Iceland
Austria
Greece
France
Latvia
Spain
14 | The Quarterly: News and information for supporters and friends of the Fraser InstituteOECD AVERAGE 62.9
Italy
Portugal
Estonia
Germnay
United States
Hungary
Belgium
Czech Republic
Chile
Nehterlands
Ireland
Poland
Japan
Israel
SK
South
Korea
Summer 2018
| 15FRASER
INSTITUTE RECENT COLUMNS APPEARED IN
THE LONDON FREE PRESS
Canadian Health Care—
Big Bills, Terrible System
Nadeem Esmail and Bacchus Barua
Canadians are getting a raw deal when it comes In a recent Fraser Institute study, Is the Canada Health
to health care. Compared to other countries that Act a Barrier to Reform? we looked at health care
share the noble goal of access to care regardless in Australia, France, Germany, the Netherlands, New
of ability to pay, we have significantly fewer physi- Zealand, Sweden, Switzerland, and the United Kingdom.
cians, acute care beds, and important medical All of these countries maintain universal access health
care systems that cost about the same as—or less than—
technologies such as MRIs and CT scanners.
ours (per capita, or as a share of the economy). And
A nd of course, our long wait times—the defining all of these countries generally outperform Canada in
feature of Canadian health care—represent the access to health care, health care outcomes, or both.
most spectacular failure of our system. Crucially, none of these countries—not one—follows the
None of this is due to a lack of funding. In fact, the Cana- Canadian model for health care.
dian system is world class in one aspect—the amount of For starters, they all rely to a far greater extent on the
money Canadians spend on it. private sector for the delivery of hospital and surgical
And yet, our health care system lacks many of the things care. For example, private for-profit hospitals comprise
that a high level of spending should provide. Why? 39 percent of hospitals in Australia and 43 percent in
Because of restrictive provincial policies, which contrast Germany. In Canada they account for just one percent—
sharply with countries that do a better job than we do the private sector is essentially shut out of delivering
of providing universal health care. medically necessary services in this country.
16 | The Quarterly: News and information for supporters and friends of the Fraser Institute6 • Is the Canada Health Act a Barrier •to
Esmail
Reform?
and Barua
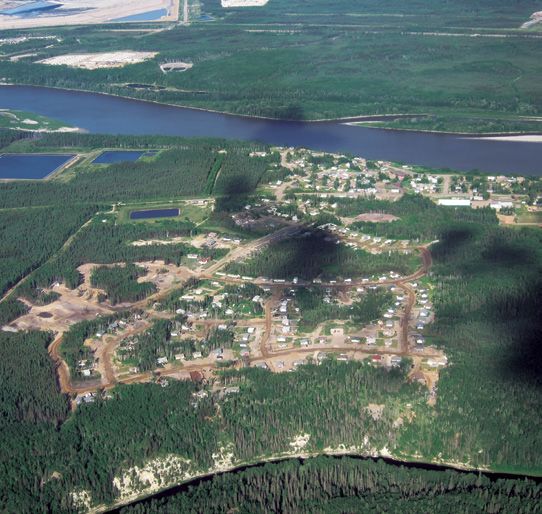
Health care insurance in Canada and eight other OECD countries
HEALTH CARE INSURANCE IN CANADA AND EIGHT OTHER OECD COUNTRIES
Primary Insurance System Primary Private Secondary Private Insurance
Insurance
Can cover Expanded Expanded Quicker Choice of
core services coverage choice of access doctor
(non-medical) provider
Australia Tax-Funded National Health System ✗ ✔ ✔ ✔ ✔ ✔
Canada Tax-Funded National Health System ✘ ✘ – – – –
France Tax-Funded National Health System ✗ ✔ ✔ ✗ ✗ ✔
Germany Multiple insurers, with choice of insurer ✔ – ✔ ✔ ✔ ✔
Netherlands Multiple insurers, with choice of insurer ✔ – – – – –
New Tax-Funded National Health System ✗ ✔ ✔ ✔ ✔ ✔
Zealand
Sweden Tax-Funded National Health System ✗ ✔ – ✔ ✔ –
Switzerland Multiple insurers, with choice of insurer ✔ – ✔ ✔ ✔ ✔
United Tax-Funded National Health System ✗ ✔ ✔ – ✔ –
Kingdom
Canada is also alone in forbidding private financing for hospitals to treat more patients. According to research
medically necessary services. In the other countries we and experience, activity-based payment results in more
studied, patients may seek care on their own terms, with efficient hospital care and a higher volume of services
their own resources, or choose to receive care from the for the dollar.
universal health care system. In fact, every developed
Clearly, Canada’s unique approach to health care is not
country with universal health care, save one, offers this
working for Canadians. It’s not a question of whether
option. Only in Canada is the government system the
Canada should have universal health care, but rather
only option for patients.
how Canada can have the best universal system in the
Cost-sharing by patients in the form of user fees or world. Other countries with universal health care have
deductibles (with reasonable exemptions for those found ways to improve their systems for the benefit of
with lower incomes and the very ill) are also commonly patients and taxpayers. Canadian policymakers should
found in higher-performing health care systems. Only in learn from their progress.
Canada and the UK do patients not share directly in the
costs of treatment. The cost-sharing concept is simple:
people use their own money more wisely than when
they use someone else’s, and cost-sharing encourages
people to make more informed decisions about when
and where to use the health care system.
Sources: Barua and
Finally, Canada relies almost exclusively on prospective
Note: budgets
global Data presented haveofbeen
(a big bag cash,simplified
annually)for
to the purposes of presentation based on the authors' interpretation. D
fund
NADEEM ESMAIL BACCHUS BARUA
hospitals. This funding method encourages hospitals
to view patients as a “cost,” eating into their pre-deter- Nadeem Esmail is a Fraser Institute senior fellow and
Bacchus Barua is associate director of the Institute’s
mined
fraser budgets.
.orgOther countries are increasingly moving
institute Centre for Health Policy Studies. They are co-authors of
towards payment based on some measure of activity the study Is the Canada Health Act a Barrier to Reform?
(by procedure or on a per-case basis), which encourages
Summer 2018 | 17FRASER
INSTITUTE RECENT COLUMNS APPEARED IN
THE GLOBE AND MAIL
Alberta Can Learn Big
Lessons from Small First
Nation
Tom Flanagan
Fort McKay on the Athabaska River. Wikipedia photo.
One of the greatest First Nation success stories a few. Now, only about five percent of its income
is the Fort McKay First Nation, situated in the comes from government transfers—the other 95
heart of the oilsands. It has never produced a percent is derived from business ventures.
drop of oil or earned a dollar in royalties, but it
has achieved a standard of living comparable to
other Canadian communities by selling services
L ike the rest of Alberta, Fort McKay was rocked by
the oil price drop—from a high of US$109.89 per
barrel (West Texas Intermediate) in June 2014 to
to oilsands companies—janitorial care, earth- US$29.67 in January 2016. After years of running a
moving, trucking, and workforce lodging, to name healthy surplus, Fort McKay’s revenue plunged by 37
18 | The Quarterly: News and information for supporters and friends of the Fraser Institutepercent in one year, and the budget went into the red. it only postpones the day of reckoning and makes it
But the deficit lasted only one year. Fort McKay reduced more painful when it comes.
discretionary spending, liquidated unprofitable invest-
Simply put, a huge dose of humility is in order for Alber-
ments, and reoriented its business strategy toward
ta’s politicians. For the last 10 years, their fiscal manage-
income stability. Soon it was back in the black.
ment has been outclassed by a small, remote First Nation
whose people a generation ago were hunters and trap-
pers in the wilderness. And it’s not just the politicians—
the people of Alberta should learn these lessons. Late
Politicians from all parties in Alberta former premier Jim Prentice was right when he said
should take a trip to Fort McKay that if you want to understand Alberta’s fiscal problems,
“look in the mirror.” That he lost the 2015 election only
to learn the simple but profound shows how right he was. (Mr. Prentice was, by the way, a
lessons of good fiscal management. great friend of Fort McKay.)
Like Alberta, Fort McKay has an elected government.
Its leaders have exercised prudent management only
because its voters have supported fiscal discipline.
Compare this to what has happened in Alberta. Where were Alberta’s voters when the provincial
government was—and still is—recklessly piling up debt?
Under the Progressive Conservative governments of Why have they voted for parties who tried to escape
Ed Stelmach and Alison Redford, the province ran large from fiscal challenges by borrowing money? Look in the
deficits since 2008, even though oil prices averaged mirror to see what went wrong. And look at Fort McKay
about US$90 a barrel in that period. Alberta was by far to see how to set things right.
the wealthiest and most prosperous province in Canada,
yet the government could not live within its means. It
used up the “rainy day” fund established in Ralph Klein’s
administration, squandering the surplus that might have
cushioned the province against the fiscal shock of 2015.
Then, instead of adjusting to the new and less favour-
able environment, the Notley NDP government drove
spending even higher while continuing to borrow more
than $10 billion a year. Alberta’s government is now
deeply in debt with no realistic plan for getting back to
budget balance.
Instead of sitting in Edmonton, politicians from all
parties in Alberta should take a trip to Fort McKay to
learn the simple but profound lessons of good fiscal
management. Run a surplus when times are good. Tom Flanagan is professor
emeritus of political science at
Don’t build up spending commitments that are unsus- the University of Calgary, senior
tainable in less prosperous times. React quickly when fellow at the Fraser Institute, and
things do go badly (as they always do, sooner or later). author of the Fraser Institute
study The Community Capitalism
Cut discretionary spending to restore a balanced of the Fort McKay First Nation:
budget within a reasonable time span. Above all, don’t TOM FLANAGAN A Case Study.
start borrowing to fund ongoing operating expenses;
Summer 2018 | 19FRASER
INSTITUTE RECENT COLUMNS APPEARED IN
THE VANCOUVER PROVINCE
BC Government
Sending all the Wrong
Signals to Investors
Charles Lammam, Hugh MacIntyre, and Ashley Stedman
Consumer spending and a hot real estate market latest technologies and production techniques, and
have helped buoy British Columbia’s economy expand their operations, it spurs economic growth and
raises living standards for workers because it makes
in recent years. But they have also helped mask
them more productive, which allows them to command
deep-rooted economic problems including BC’s higher incomes.
dismal level of business investment.
Yet BC struggles to attract such investment. Consider
U nfortunately, an onslaught of recent policies from
Premier John Horgan’s government has weakened
that from 2014 to 2016 (the latest year of available
data), the level of non-residential business investment
declined by nearly a fifth (after accounting for infla-
BC’s investment climate, sending all the wrong signals
to investors. If the housing boom cools, BC could be in tion). Moreover, the level of investment per worker in BC
for a rude economic awakening. is 19 percent below the national average, meaning BC
workers have significantly less capital (machines, equip-
Business investment is critical for sustaining long-term ment, and technology) available to do their job than
economic well-being. When businesses invest in the their counterparts in other provinces.
20 | The Quarterly: News and information for supporters and friends of the Fraser InstituteOne reason for the dearth of investment is BC’s uncom- payroll tax to replace the MSP. Troublingly, the govern-
petitive business tax regime. While the province’s statu- ment’s own taskforce warned against replacing the
tory corporate income tax rate, when combined with MSP with a payroll tax. In its interim report, the task-
the federal rate, is middling when compared to other force put it succinctly:
jurisdictions, corporate taxes are not the only taxes that A payroll tax would reduce the competiveness
affect investment. When all the taxes are accounted for— of BC businesses at a time when they are facing
including sales taxes on business inputs—BC’s overall several competiveness challenges including
business tax regime ranks poorly compared to competing expected increases to the minimum wage, CPP
jurisdictions across the country and worldwide. [tax] increases, and recent tax reform in the US
which improve the competitive position of many
US businesses.
When businesses invest in the But this warning fell on deaf ears.
latest technologies and production And it’s not just tax changes that are harming investment
prospects in the province. The government’s anti-devel-
techniques, and expand their opment rhetoric and commitment to block pipelines
operations, it spurs economic signal that BC is unwelcoming to resource development.
growth and raises living standards In fact, a survey of upstream oil and gas executives rank
for workers because it makes them BC dead last among Canadian provinces for investment
attractiveness. The province in 2017 also saw its global
more productive, which allows ranking in the survey drop from the top half of jurisdic-
them to command higher incomes. tions to the bottom quarter. Finally, the government’s
cold stance on resource development comes at a time
when disputed land claims are hurting BC’s resource
sector—especially mining.
For example, according to the latest estimates from
University of Calgary economists, BC’s overall tax rate If the Horgan government wants to foster sustained
on new investment is 27.7 percent—the highest rate in long-term economic growth, it’s time to put away the
Canada and one of the highest among industrialized closed-for-business sign and start sending positive
countries. Moreover, sweeping tax reform in the United signals to investors and entrepreneurs.
States will only magnify BC’s competitiveness problem,
as the national average tax rate on new investment in
the US now sits at 18.8 percent.
Rather than improve the province’s investment climate,
the Horgan government has signalled to investors and
entrepreneurs that BC is not hospitable to invest-
ment. For instance, shortly after assuming office, his
government made BC’s tax regime less competitive by
raising the general corporate income tax rate, creating
a new top personal income tax rate, and increasing the
carbon tax. HUGH MACINTYRE
CHARLES LAMMAM ASHLEY STEDMAN
Making matters worse, last month’s provincial budget
Charles Lammam is director of Fiscal Studies, and
contained new tax policies that reinforce an anti- Hugh MacIntyre and Ashley Stedman are senior policy
investment sentiment, ranging from higher taxes on analysts with the Fraser Institute.
high-value homes and cars, to a new employer-based
Summer 2018 | 21FRASER
INSTITUTE RECENT COLUMNS APPEARED IN
THE EDMONTON SUN
In Florida, They’re
Snowbirds—in BC, They’re
“Speculators”
Josef Filipowicz and Steve Lafleur
Florida remains a popular destination for
Canadian retirees and vacationers. Not surpris- B y contrast, in Canada’s hottest housing markets—
Vancouver and Toronto—outsiders buying prop-
erty are typically called less endearing names, including
ingly, many people from colder northern states
“non-resident speculators.” They are often portrayed as
and Canada either rent or own property in Florida
a major cause of rapid housing price growth, spurring
to escape harsh winters. In fact, temporary resi- impassioned political rhetoric accompanied by targeted
dents in Florida (also known as snowbirds) number taxes on their properties. A recent example is British
more than one million by some estimates, making Columbia’s “speculation tax,” which despite recent
significant contributions to local businesses, exemptions still targets many vacation homeowners.
not to mention property and sales tax revenues. Here’s the reality. In Florida, BC, and (to a lesser extent)
Simply put, in Florida, outside money is welcome. Ontario, some non-locals want to purchase or lease
22 | The Quarterly: News and information for supporters and friends of the Fraser Instituteproperty without staying in that property year-round. ping) and despite their contribution to BC’s economy
Again, Florida appears to welcome this inflow of invest- in many varied ways. Ironically, rather than increasing
ment while BC and Ontario appear eager to chase it affordability, taxing such properties may disqualify
away. Why the different attitudes? many (except those wealthy enough to pay these puni-
tive taxes) from buying in the province’s most desir-
able locations.
At the same time, housing affordability remains a major
Between 1995 and 2016, on average,
concern for many Canadians, and they want govern-
local governments in Florida issued ments to act. But rather than penalizing vacationers,
building permits for the construction snowbirds, or temporary residents (a consequence that
the recent exemptions will ease, but not erase), provin-
of roughly 15 percent more housing
cial and (especially) municipal governments should help
units (per capita) annually than BC correct the balance between demand and supply—by
municipalities, and a staggering 37 encouraging more supply.
percent more than Ontario’s. To start, governments can streamline the approval
process for the construction of new homes. According
to Fraser Institute research published in 2016 and 2017,
it takes between one-and-a-half and two years, on
Consider this. Between 1995 and 2016, on average, local average, for homebuilders to obtain building permits in
governments in Florida issued building permits for the Toronto and Vancouver. Homebuilders also face tens of
construction of roughly 15 percent more housing units thousands of dollars in regulatory compliance costs and
(per capita) annually than BC municipalities, and a fees, increasing home prices or limiting the number of
staggering 37 percent more than Ontario’s. As a result, homes built including much-needed rental units.
would-be buyers have far more options in Florida, with
homes staying on the market for 45 days, on average. Enabling a more flexible, responsive housing supply
Prices are also far lower in Florida, at a median listing is probably not as politically expedient as singling out
price of US$285,000, according to the real estate groups of people for scapegoating. But if policymakers
website Zillow. Florida is a buyer’s market. want to actually address the root causes of unafford-
ability, they should focus on the core problems with the
By comparison, Vancouver and Toronto are seller’s
housing market. And a good place to start would be the
markets—homes spend only 15 to 17 days on the market
construction of more homes.
(on average), and are far more expensive. Clearly, a lot
more people are looking to buy than there are places to
buy in Canada’s most in-demand cities.
As such, heavy-handed policies such as BC’s so-called
“speculation” tax target symptoms (high demand for
housing) rather than causes (a lagging housing supply),
and create unnecessary divisions among Canadians.
For example, retirees or vacationers with summer
homes, cabins, or short-term rental units in parts of
JOSEF FILIPOWICZ STEVE LAFLEUR
BC’s Okanagan Valley or Vancouver Island are still
implicitly portrayed by these policies as “speculators,” Josef Filipowicz and Steve Lafleur are senior policy
despite intentions of long-term ownership (rather analysts at the Fraser Institute.
than speculative activity such as pre-construction flip-
Summer 2018 | 23You can also read