INTRODUCTION - Section 27
←
→
Page content transcription
If your browser does not render page correctly, please read the page content below
Joint Submission to the Committee on Economic, Social and Cultural Rights
                 on the occasion of the review of South Africa’s first period report
                                at the 64th Session, October 2018

                                                 Submitted by

                                 Center for Economic and Social Rights
                                     Institute for Economic Justice
                                                SECTION27

INTRODUCTION

1. This submission outlines the key concerns and recommendations of the organizations listed above
on the occasion of South Africa’s review before the United Nations Committee on Economic, Social and
Cultural Rights at its 64th session in October 2018. It makes particular reference to issues insufficiently
addressed or omitted from the State party’s first Periodic Report of April 2017 and seeks to respond to
the questions put forth in the List of Issues adopted by the Committee’s Pre-sessional Working Group in
November 2017.

2. Specifically, it explores in detail the State party’s obligation under Article 2(1) of the
International Covenant on Economic, Social and Cultural Rights to take steps making use of “maximum
available resources.” First, it argues that the austerity measures the South African government is
undertaking present a threat to economic, social and cultural rights. Second, it demonstrates that to
negate the need for austerity, South Africa must maximize the availability of resources; this can be done
by developing a more equitable tax policy that contributes to the redistribution of income and wealth and
by intensifying efforts to tackle corruption and state capture. Finally, it illustrates how avoidable resource
shortfalls are leading to violations of Covenant rights, by analyzing the effects of inadequate and
inefficient resourcing on the rights to health (Article 12) and education (Article 13).

3. 1994 marked the collapse of the apartheid regime and the dawn of democracy in South Africa. In
its wake, a new Constitution was adopted that enshrined a rights-based transformative agenda that
obligated the government to allocate resources towards the progressive realization of economic, social
and cultural rights.1 Amidst a myriad of challenges presented by the transition, the government managed
to establish a robust set of democratic institutions and began to transform public services.

4. This has yielded important progress. Between 1996 and 2011, access to electricity rose from 45%
to 75%, and access to clean water improved from 57% to 75%.2 More students are attending university
than ever before—with 807,000 students enrolled in 2015, versus 385,200 in 1994.3 National household

1 Constitution of the Republic of South Africa, 1996. Chapter Two: Bill of Rights.
2 Burger, R, van der Berg, S, van der Walt, S, and Yu, D, 2015. “The Long Walk: Considering the special and racial
dimensions of deprivation two decades after the fall of apartheid,” Stellenbosch working papers 17/15.
3 South African Institute of Race Relations, 2016. “Life in South Africa: Reasons for Hope Report.”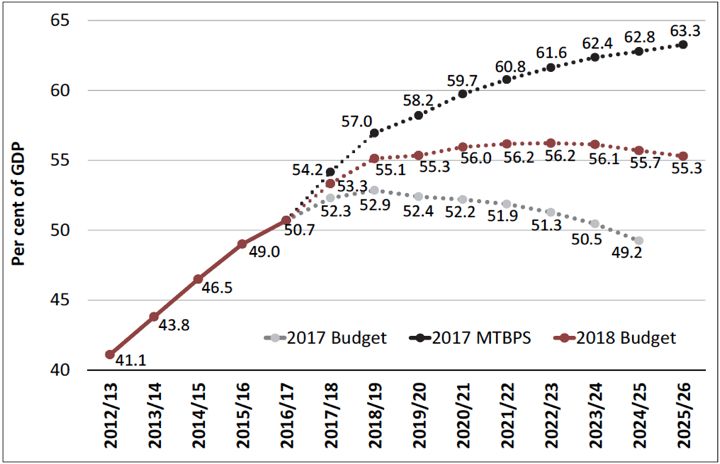
surveys estimated infant mortality ranged from 40 to 71 deaths per 1,000 births in the early 1990s,
compared to 34 in 2015.4

5. Despite the more inclusive agenda initiated in 1994, economic and fiscal policies have not always
been shaped by Constitutional obligations. Systemic inequality continues to be ingrained in the
country’s economic and social structures as a result. Poverty and unemployment are experienced by
broad swathes of society and intersect with stark disparities in access to health, education, housing and
even food. Corruption thrives under such conditions of inequality, diminishing available resources and
eroding trust in public administration and private enterprise alike. For these reasons, apartheid’s legacy
continues to have an outsized impact on people’s economic, social and cultural rights.

6. These challenges are compounded by austerity policies that have been introduced in the form
of cuts in expenditures and regressive tax changes in recent years. These measures do not meet the
Committee’s criteria for justifying retrogressive measures, namely that they be: temporary,
remaining in place only insofar as they are necessary; legitimate, with the ultimate aim of protecting the
totality of human rights; reasonable, with the means chosen being the most capable of achieving the
legitimate aim; necessary, with all alternative financing measures comprehensively exhausted;
proportionate, in that their human rights benefits outweigh their costs; not directly nor indirectly
discriminatory, according priority attention to disadvantaged groups; protective of the minimum core
content of rights; based on transparency and genuine participation of affected groups and subject to
meaningful review and accountability procedures.5

7. This submission is divided into three sections. The first examines the general framework for the
protection of economic, social and cultural rights in South Africa, illustrating the context in which austerity
is being introduced through an analysis of a broad set of economic, social and cultural indicators. The
second addresses Article 2(1), focusing on specific issues related to the generation and expenditure of
resources. The third focuses on the impacts of budgetary trends on service delivery and rights outcomes,
which are illustrated by examining the rights to health (Article 12) and education (Article 13). The
submission concludes with proposed recommendations for the State party.

        I.    GENERAL FRAMEWORK FOR THE PROTECTION AND PROMOTION OF
                       ECONOMIC, SOCIAL AND CULTURAL RIGHTS

8. Focusing on economic and social conditions in South Africa, this section demonstrates that the State
party is introducing austerity measures, for an indefinite period, due in large part to exaggerated concerns
of a growing public debt crisis. Further, it shows these austerity measures are being introduced in a
context of extreme inequality, deeply rooted poverty, and growing unemployment, which makes them an
unreasonable method of tackling the country’s fiscal issues. To address the underlying causes of these
issues, a more inclusive model of economic development is needed: one that prioritizes rights realization.

1.1      South Africa is introducing retrogressive austerity measures

9. In 2018, the National Treasury acknowledged that “since 2012, successive budgets have reduced
the rate of expenditure growth and raised taxes,” but nevertheless “debt continued to rise as a share of

4 U.S. National Library of Medicine National Institutes of Health, 1998. “What is the infant mortality rate in South Africa?
The need for improved data,” at https://www.ncbi.nlm.nih.gov/pubmed/9930256; See also, Statistics South Africa, 2015.
“Mid-year population estimates,” Statistical Release P0302.
5 See Committee on Economic, Social and Cultural Rights, 2016. “Public debt, austerity measures and the International

Covenant on Economic, Social and Cultural Rights,” Statement by the Committee.
                                                                                                                          2
GDP as economic growth declined and new spending pressures emerged”.6 Treasury is committed to
continuing this path, stating in its 2019 Medium-Term Expenditure Framework that:

           There are NO additional resources available for allocation over the 2019 Medium Term
           Expenditure Framework (MTEF) period within the expenditure ceiling set in the 2018 Budget.
           This means that additional allocations to a programme will need to be funded by reductions in
           funding for another programme, either within the department’s budget, or from another
           department’s budget. This may involve the scaling down of non-priority programmes and
           projects, changing service delivery models, using technology more effectively etc.7

The “expenditure ceilings” established by the Treasury cap payments by departments, often at arbitrary
levels, despite the possibilities of increasing taxes and borrowing, as discussed below. The expenditure
ceilings apply to all government departments, including health and education.

10. Table 1 highlights austerity in practice. Since 2016/17, the rate of growth of non-interest budget
expenditure—essentially expenditure on social and economic programs—has been lower than
population and GDP growth. Over the three-year period non-interest budget expenditure averaged 0.3%
growth compared with population growth of 1.6%. Government expenditure per person has declined
for three years in a row. Moreover, in the current year, 2018/19, government plans to raise more
revenue than it will spend on programmes, illustrating the prioritization of deficit reduction over social
spending.

Table 1: Consolidated revenue, expenditure, GDP and the budget deficit, 2016/17 – 2018/198

                                      Audited Outcome   Revised Estimate    Estimate             Average
    R’000 (2018/19 Rands)                                                                        growth
                                      2016/17           2017/18             2018/19

    Revenue                           R1,435,005        R1,419,957          R1,490,716           1.5%

    % of GDP                          29.2%             28.8%               29.7%

    Non-interest expenditure          R1,441,874        R1,455,589          R1,475,396           0.3%

    % of GDP                          29.3%             29.5%               29.4%

    Consolidated budget deficit       -R178,039         -R214,342           -R180,484            -1.3%

    % of GDP                          -3.6%             -4.3%               -3.6%

    Non-interest expenditure growth   -1.4%             1.0%                1.4%                 0.3%

    GDP growth                        0.7%              1.3%                1.5%                 1.2%

    Population growth                 1.6%              1.6%                1.6%                 1.6%

11. As well as being much lower than population growth, the small aggregate growth in non-interest
expenditure of 0.3% over the past three years masks significant cuts and re-prioritizations that have
taken place within the budget. What is less clear when reading the budget is on what basis cuts are
justified, what has motivated key re-prioritizations within the budget, and what impact these are having
on the realization of economic, social and cultural rights. These cuts and their impact on Covenant rights
will be detailed in Part III.

6 National Treasury of the Republic of South Africa, 2018. “Budget Review.”
7 National Treasury of the Republic of South Africa, 2018. “2019 MTEF Technical Guidelines” pg. 1.2 (original emphasis).
8 National Treasury of the Republic of South Africa, 2018. “Budget Review,” Tables 1.2, 3.2 and 4.2 and StatsSA, 2018.

“2018 Mid-Year Population Estimates,” and own calculations.
                                                                                                                      3
12. This fiscal consolidation represents unnecessary self-imposed austerity that is compounding
stagnant median wages,9 and falling disposable incomes. Since a large share of public expenditure is
geared towards lower-income groups, this is having retrogressive and discriminatory impacts.
1.2 Exaggerated concerns about debt levels are being used to justify austerity
13. South Africa’s austerity measures lack legitimacy. They are designed to appease international
finance and its credit agencies by making steep debt reductions, rather than to protect human rights.10
As the Committee on the Elimination of all forms of Discrimination Against Women has emphasized,
tackling debt is not, in and of itself, a sufficient justification for implementing austerity measures
having retrogressive rights impacts.11
14. In the words of the National Treasury, the 2018/19 budget “accelerates government’s efforts to
narrow the budget deficit and stabilize debt”.12 Table 1 above shows a planned deficit tightening from -
4.3% in 2017/18 to -3.6% in 2018/19. Figure 1 shows that such measures are not intended to be
temporary. The debt-to-GDP ratio is projected to peak at 56.2% during 2021/22 and 2022/23, with
reduction targets continuing through to 2025/26. The idea that South Africa is facing a debt “crisis” has
been fueled by statements by international credit ratings agencies justifying their downgrades of
government debt.
Figure 1: Debt-to-GDP levels (2012/13 - 2025/26)
15. However, South African debt is
moderate by international standards.
According to the International Monetary
Fund (IMF), emerging market and
middle-income country debt levels are
projected to reach, on average, 57.6% in
2023, while advanced country debt
averaged at 105.4% of GDP in 2017.
Further, a comparative study shows that
South Africa’s debt is below the levels at
which comparator countries lost and
regained their investment-grade rating.13
16. The debt risks that are present in
South Africa do not stem from
“excessive” social spending. Rather, debt guarantees held by state-owned enterprises (SOEs), in
particular the electricity parastatal, Eskom, pose a threat to debt sustainability, not unrelated to alleged
mismanagement and corruption. Accordingly, the solution is not widespread austerity and severe debt
reduction targets, but a comprehensive plan agreed by all social partners to turn the financial health of
Eskom (and other state-owned enterprises) around.
1.3 Austerity is unreasonable in a context of extreme inequality, persistent poverty, and
high unemployment
9 McLaren, D, 2017. “Indicators to Monitor the Progressive Realization of the Right to Decent Work in South Africa,” SPII
Working Paper 15 pg. 109-110.
10 South African Institute of International Affairs, 2015. “2015 Budget: Too Little Too Late for South Africa’s Public Debt?”
11 Committee on the Elimination of All forms of Discrimination Against Women (CEDAW), 2017. Concluding Observations:
Barbados, CEDAW/C/ERB/CO/5-8.
12 National Treasury of the Republic of South Africa, 2018. “Budget Review.”
13 CSID, 2017. “Mitigating the Impact of South Africa’s Debt Downgrades: International Experiences.”
417. In 2015, over half (55.5%) of the population—30.4 million people—lived below the official national
upper bound poverty line (UBPL) of R992 per person per month (2015 prices). Notably, this increased
from 53.2% in 2011, meaning approximately 2.9 million people were pushed into poverty over this period.
A quarter—13.8 million people—lived in “extreme poverty” in 2015, unable to afford enough food to meet
their basic physical needs.14
18. The overwhelming majority of poor people continue to be black Africans, while women tend to be
the most affected. The proportion of female-headed households living below the UBPL was 49.9% in
2015, compared to 33% for male-headed households. Disparities are particularly striking when looking
at child poverty; poverty among black African children was 73.6% in 2015, compared to 1.4% for
white children. South Africa’s Multidimensional Poverty Index (SAMPI) also illustrates apartheid’s
legacy of spatial inequality. Multidimensional poverty is highest in the Eastern Cape, KwaZulu-Natal, and
Limpopo— provinces that had high concentrations of “homelands” (areas set aside for black Africans
under the apartheid regime) where public service delivery and infrastructure was poor.15
19. In South Africa, high levels of poverty go hand in hand with high levels of economic inequality. In
2015, South Africa’s Gini Coefficient and Palma Ratio were at 0.63 and 7.1 respectively, among the
highest in the world.16 In 2014, two thirds of personal income was captured by the richest 10% of
households. The income share of the top 1% of earners was 20%, an increase of 11 percentage points
since 1994.17
20. There are also notable variations in income inequality among different racial groups.18 The Living
Conditions Survey showed that white-headed households, on average, earned the highest income at
R444,446 per annum, while black African-headed households earned the least, at R92,983 (2015 prices).
White-headed households had an income roughly four and a half times larger than black African-
headed households and three times larger than the average income.19
21. Wealth inequality is also staggering. Academic studies estimate that the wealthiest 1% of the
population own half of all wealth, while the top decile owns at least 90–95%.20 Richer households have,
on average, nearly 10 times more wealth than poor households, according to wealth surveys carried out
by the University of South Africa (UNISA) between 2008 and 2015. A prominent factor influencing wealth
inequality is ownership of financial assets, which represent 36% of total assets for the poor, compared
to 75% for the rich.21
22. The functioning of the labor market is a key driver of inequality. Large numbers of young people,
black Africans, and women are unemployed or underemployed; if employed, they earn low wages
14 Statistics South Africa, 2018. “Men, Women and Children: Findings of the Living Conditions Survey, 2015.” It should be
noted that academics have proposed alternative, more accurate, methodologies for calculating the national poverty line
which result in an UBPL headcount of 62.76%. See Budlender, J, Leibbrandt, M & Woolard, I, 2015. “South African poverty
lines: a review and two new money-metric thresholds,” Southern Africa Labor and Development Research Unit Working
Paper Number 151.
15 Sulla, V and Zikhali, P, 2018. “Overcoming Poverty and Inequality in South Africa: An Assessment of Drivers, Constraints
and Opportunities,” World Bank Group at https://bit.ly/2HMyBMO
16 United Nations Development Programme, 2016. 2016 Human Development Reports - Table 3 Inequality Adjusted
Human Development Index.
17 Alvaredo, F et al, 2018. World Inequality Report, 2018 at https://bit.ly/2N5WNzG
18 The apartheid state of South Africa in 1950 passed the Population Registration Act which declared that South Africans
are to be classified into one of three races: 1) White, 2) “Native” (black African), or 3) Colored (neither white nor native).
19 Statistics South Africa, 2017. “Poverty Trends in South Africa: An examination of absolute poverty between 2006 and
2015.”
20 REDI3x3, 2016. “Wealth inequality on South Africa: Evidence from survey and tax data.”
21 Sulla, V and Zikhali, P, 2018. “Overcoming Poverty and Inequality in South Africa: An Assessment of Drivers, Constraints
and Opportunities,” World Bank Group.
5that are not keeping pace with living costs. The most recent data shows the limited unemployment rate
sitting at 27% for the second quarter of 2018, with the youth unemployment rate at 39%, whereas for the
expanded definition (which includes those discouraged from seeking employment and is thus more
appropriate) the rates are 37% and 67% respectively.22 High-skilled workers, which make up less than
20% of the working population, earn nearly five times the average wage for low-skill workers. Along with
this, higher wages are growing at a faster rate than low and middle wages, increasing further wage
inequality.23 South Africa’s dependency ratio (non-working age population to the working age population)
is high, at 52% in 2015.24 This means small amounts of money from employment must be shared among
several household members.
23. In this context, austerity has the potential to further undermine livelihoods while also weakening
the South African economy. Although South Africa’s economy accounts for almost a quarter of all of
Africa’s GDP and is ranked as an upper-middle income economy by the World Bank, economic growth
has slowed significantly since 2011 and in the first quarter of 2018, GDP fell by 2.2%.25 In fact, as shown
in Table 1, GDP has grown at a slower pace than the population for the last three years, and is forecast
to do the same in the current year, resulting in a consistent drop in per capita GDP.26
1.4 Development policies pursued since 1994 have failed to address the underlying
causes of socioeconomic inequality
24. Despite having some of the world’s most robust constitutional obligations concerning economic,
social and cultural rights, economic policy in South Africa has not been sufficiently and consistently rights-
based and has entrenched structural inequalities. Although a detailed examination of economic policy is
beyond the scope of this submission, it is worth commenting on how Treasury’s overarching approach
to economic development has influenced the fiscal policies that determine resource generation,
allocation and expenditure.
25. Since the 1990s, economic policy has been market-centric. The government has made
“macroeconomic stability” the “overriding objective of economic policy”27 and narrowly prioritized GDP
growth over other social goals such as redistribution. In pursuing this course, far too little attention has
been paid to the nature of this growth or to who is benefiting from it. As the Committee has emphasized,
economic growth does not necessarily translate into the progressive realization of rights. State parties
must take steps to channel such economic dividends into poverty reduction programs, additional
employment opportunities, and increased financing for public services.
26. Such market-centric approaches, in particular the conception of the State as a market enabler,
has also permeated social policy. This can be seen strongly in housing policy, for example.28 This is a
critical reason why, despite significant increases in social spending in the 2000s, the state has been
unable to progressively realize economic, social and cultural rights. It has also led the government to
22 Statistics South Africa, 2018. Quarterly Labor Force Survey, 2nd Quarter 2018. July 2018, P0211.
23 Sulla, V and Zikhali, P, 2018. “Overcoming Poverty and Inequality in South Africa: An Assessment of Drivers, Constraints
and Opportunities,” World Bank Group.
24 World Data Atlas, 2018. South Africa - Ratio of population aged 0-14 and 65+ per 100 population 15-64 years at
https://bit.ly/2C5Hx1r
25 Statistics South Africa, 2018. Gross Domestic Product First Quarter 2018 at https://bit.ly/2l0Qm0X
26 National Treasury of the Republic of South Africa, 2018. “Budget Review,” Table 3.2 at www.treasury.gov.za; StatsSA,
2018. 2018 Mid-Year Population Estimates at https://bit.ly/2N3MI6c2
27 Macroeconomic stability is defined as stable prices, stable interest rates, predictable economic costs such as tax policies
and regulatory regimes and predictability about future tax and interest rates. See Faulkner, D and Leowald, C, 2008.
“Policy change and Economic Growth: A Case Study of South Africa,” at https://bit.ly/2MFKKtl, pg. 12.
28 This approach was most forcefully captured in the 1996 Growth, Employment and Redistribution (GEAR) programme,
whose framework, despite some variations, has continued to dominate economic policy making. Isaacs, G, 2016. “The
Commodification and Financialization of Low-Cost Housing in South Africa,” Working Paper Series: Fessud.
6avoid strongly interventionist policies that would ensure the restructuring of the economy to
better serve the needs of the majority.
27. These policy choices have meant that the capital-intensive, monopolistic and mining-centered
development path, with a strong reliance on cheap, predominantly black African labor, that emerged
before and under apartheid, has not been undone. The financialization of the economy has occurred on
top of this, with large growth in service sectors of the economy. Active and interventionist industrial policy
to stimulate growth in labor absorbing industries that offer the opportunity for decent work, was absent
until the mid- 2000s and inadequate thereafter. Policies to raise wages and increase domestic demand
have been inert.
28. Such inadequacies appear in the 2011 National Development Plan (NDP). Although it pre-dates
the adoption of the Sustainable Development Goals, the NDP is the primary vehicle for their
implementation. The NDP provides a broad and ambitious framework that aims to eliminate poverty and
reduce inequality and unemployment by 2030. Various substantive goals are also articulated for the
provision of social services. From a human rights perspective, the inclusion of inequality as a priority
development issue is welcome. However, the measures to ensure the realization of these priorities have
come under significant criticism. A key critique is that the NDP lacks coherence and that its
conservative approach to macroeconomic policy fails to ensure effective economic intervention
by the State. Instead, it is vague when it comes to achieving employment-centered development,29 and
advances a problematic jobs plan based on low-quality precarious jobs that undermine worker rights.30
II. ISSUES RELATED TO GENERAL PROVISIONS OF THE COVENANT
ARTICLE 2(1) – RESOURCE OBLIGATIONS
29. This section shows that the State party is not dedicating the maximum of available resources in
line with its obligations under Article 2(1). It could generate additional resources by enacting more
progressive tax policies, which, as the Committee has consistently emphasized, is essential in ensuring
the availability of resources for rights realization. It could also intensify efforts to strengthen administrative
capacity and meaningfully tackle corruption and state capture. This would help avoid resource diversion
caused by tax evasion and avoidance, as well as by inefficient and wasteful expenditure. Not only would
pursuing these alternatives negate the need for austerity, they would contribute to the redistribution of
income and wealth necessary for tackling inequality and advancing the realization of economic, social
and cultural rights.
2.1 South Africa has failed to mobilize sufficient resources for realizing Covenant rights
30. In recent years, South Africa has failed to raise sufficient tax revenue. South Africa has maintained
a tax-to-GDP ratio of around 25% over the last decade. By international standards this is above
average. But, given the scale of socioeconomic challenges and extreme levels of inequality, the tax mix
must be evaluated holistically and on a more granular level. The R48.2 billion shortfall in the 2018/19
National Budget illustrates that current revenue raising approaches are unable to generate the necessary
tax income.31 In the 2017 Medium Term Budget Policy Statement (MTBPS) the Minister of Finance
highlighted a forecasted R209 billion shortfall in the following three years.
29 Public Affairs Research Institute, 2017. “Plundering the state in the name of change will only perpetuate inequality,” at
https://bit.ly/2LLChiQ
30 COSATU, 2013. “Summary of Critique of the National Development Plan”, at: https://bit.ly/2wzXIOl
31 National Treasury of the Republic of South Africa, 2018. “Budget Review.”
731. This shortfall comes off the back of the South African Revenue Service (SARS) consistently
missing its revenue targets. Between 2010/11 and 2015/16 South Africa’s tax buoyancy—a measure of
the relationship between tax revenue growth and economic growth—was greater than 1, indicating that
tax revenue grew at a faster rate than economic growth. Despite tax rate increases in 2016/17 and
2017/18, tax buoyancy fell below 1. National Treasury lists “weak economic growth, administrative
challenges at SARS, and increased tax avoidance and evasion” as reasons for these shortfalls.32
32. Administrative challenges at SARS are indeed concerning. Under President Jacob Zuma, SARS
has been plagued by mismanagement and allegations of corruption.33 It has been purged of high-
level officials and investigators and has seen the closure of the Special Projects Unit tasked with tackling
high-profile, potentially dangerous, cases of tax avoidance and evasion.34
33. Strengthening SARS is critical for combating tax avoidance and evasion, which remains a major
concern. Global Financial Integrity (GFI) estimates South Africa lost USD 107 billion to illicit financial
flows between 2005 and 2014.35 Trade mispricing (misrepresenting the value of an international
transaction), a tactic for avoiding or evading taxation, accounts for over 80% of illicit outflows from South
Africa, according to GFI.36 South Africa’s large extractive industry is one factor that makes it vulnerable
to illicit financial flows. The United Nations Conference on Trade and Development (UNCTAD) estimates
that trade misinvoicing (misrepresenting the value or volume of an international transaction) of gold
exports to South Africa’s leading trading partners totaled USD 113.6 billion between 2000 and 2014,37
although there is some debate about how to interpret this figure.38
34. South Africa’s resource generation is further constrained by mediocre wage growth for the
majority, as explained above. Detailed statistical modelling, as well as a wealth of international evidence,
shows wage policy measures can increase taxable incomes, without negative economic impacts.39 So
measures to ensure meaningful wage growth for lower-income households can contribute to resource
mobilization. The most important recent policy measure in this regard is the implementation of a national
minimum wage (to take effect in late 2018 or early 2019).
2.2 Failure to generate sufficient resources results from long-term regressive changes to the
tax mix
35. While South Africa’s tax structure is progressive overall, meaning richer households generally
contribute a higher percentage of their income in tax than poorer ones, regressive trends have
contributed towards a failure to generate sufficient resources. These include:
! Personal income tax (PIT) rates have fallen since 1997. For example, someone earning R1
million annually (in 2018 prices), approximately $75,000 USD, paid an effective tax rate of 41%
in that year. By 2018, this had fallen to 31%. The progressivity of personal income tax rates in
South Africa is the lowest of comparable peer countries Brazil, Peru, Mexico, Ethiopia, Uruguay
and Armenia.40
32 National Treasury of the Republic of South Africa, 2018. “Budget Review,” pg. 39.
33 See e.g. Corruption Watch, 2018. “All of our correspondence in the SARS matter,” at https://bit.ly/2wuZjWr
34 Public Affairs Research Institute, 2017. “Plundering the state in the name of change will only perpetuate inequality.”
35 Global Financial Integrity, 2017. “Illicit Financial Flows to and from Developing Countries: 2005-2014,” pg. 35.
36 African Monitor, 2016. “State of Illicit Financial Flows in South Africa: a scoping exercise,” pg. 5.
37 UNCTAD, 2016. “Trade misinvoicing in Primary Commodities in Developing Countries” pg. 28.
38 Forstater, M, 2017. “Illicit Financial Flow and Trade Misinvoicing: Time to Reassess,” at https://bit.ly/2Nw1646
39 Isaacs, G, 2016. “A National Minimum Wage for South Africa,” Summary Report, National Minimum Wage Research
Initiative.
40 Inchauste, G et al., 2015. “The Distributional Impact of Fiscal Policy in South Africa,” World Bank Group Policy Research
working paper, pg.17.
8! Corporate income tax (CIT) rates have also fallen dramatically, from 50% in 1990 to 28% in
2018. According to the World Bank and Price Waterhouse Cooper Paying Taxes measure—
which takes account of all taxes facing an average middle-sized firm as a percentage of profits—
South Africa ranks 172 out of 213 countries, where 1 has the highest company tax and 213 the
lowest. By this measure, South Africa also has the lowest corporate tax rate in Africa and is in
the bottom quarter of emerging markets.
! Wealth, and income derived therefrom, is under-taxed. For example:
○ Capital gains tax is comparatively low. In 2016/17 it raised only R17 billion, a mere 1.5% of
tax revenue. Because not all capital gains are taxed, in 2017, individuals only paid a rate of
16% on capital gains, and companies 22%.41 This is below the OECD and BRICS norm.
○ Tax on inheritance—estate duty—is levied at only 20% and raises revenue worth 0.05% of
GDP compared with the OECD average of 0.2%.42
○ The securities transaction tax (STT) (a tax on sale of shares) raises a small share of income;
bonds are excluded and there is no transaction tax on derivatives and other forms of financial
transactions. Despite South Africa’s market capitalization to GDP ratio being almost triple
the OECD average, revenue from STT lags behind the OECD average.
○ Taxes on immovable property (such as houses and offices) is levied at the municipal level,
allowing wealthier areas to generate greater income than poorer areas; there is no national
land tax despite the very unequal distribution of land.
○ South Africa has no annual “net wealth tax” that would tax the total value of wealth held in a
given year.
36. South Africa also offers a number of PIT tax breaks that only benefit higher-income households.
In 2015/16 government expenditure on tax breaks for pension and retirement funds and private medical
insurance amounted to approximately R52 billion.43 Accounting for inflation, this amount would sit well
above the 2018/19 projected shortfall.44 These tax breaks only benefit the top three deciles (virtually no
one in deciles 1-7 pays PIT) and are concentrated amongst the highest-earning 10% of the population.
2.3 Recent changes to the tax mix place a disproportionate burden on poorer South
Africans
37. The increase in the VAT rate from 14 to 15% as of April 2018 represents a clearly
retrogressive austerity measure. This increase is projected to raise the share of VAT in the overall tax
mix from 24.6% in 2017/2018 to 26.3% in 2020/2021.45 As expected, this VAT change increases the
taxes paid by poor and low-income households, reducing their ability to afford foodstuffs and other
essential goods and services necessary for rights realization through lowering disposable incomes.
38. Exempting certain essential goods from VAT (“zero-rating”) makes VAT less regressive. A recent
report by the IEJ identifies 23 additional categories of goods and services that could be zero-rated,
financially benefiting low-income households and advancing the realization of rights. For example,
greater access to school uniforms would support the right to education, cheaper sanitary pads would
enhance gender equality and girls’ rights to dignity and education, and making various food stuffs and
medicines more affordable would have significant health implications, including for children.46
Nevertheless, an Expert Panel established by the National Treasury found only eight items potentially
41 South African Revenue Service, 2018. “Capital Gains Tax (CGT)” at https://bit.ly/2NiodyK
42 SACTWU and COSATU, 2017. “Submission to the Davis Tax Committee on Possible Wealth Taxation in South Africa.”
43 National Treasury of the Republic of South Africa, 2018. “Budget Review.”
44 National Treasury of the Republic of South Africa, 2018. “Budget Review.”
45 National Treasury of the Republic of South Africa, 2018. “Budget Review.”
46 Institute for Economic Justice, 2018. “Mitigating the impact of the VAT increase: can zero-rating help?”
9suitable for zero-rating and only managed to agree on six of them.47 While these exemptions will offer
some relief to poor and low-income households, the measures are grossly insufficient.
39. Annual increases in the fuel levy (a tax paid on petrol and diesel that are otherwise VAT
exempt) places additional burdens on poor and low-income households. Transport costs for these
households are particularly onerous given South Africa’s history of apartheid spatial planning, in which
poor communities were located on the periphery of cities with inadequate public transportation.48 In real
terms, increases to the fuel levy have well outstripped increases to the most important social grants over
the previous eight years.49
2.4 Other more equitable financing alternatives have not been considered
40. The National Treasury claims to have considered other options and found raising VAT to be “less
harmful to growth than raising other taxes.” However, no evidence of serious consideration of other
options has been made public. The claim indicates that the models used by the National Treasury,
assume, by design, that all tax increases are harmful. This is incongruous with a wealth of international
evidence that indicates that raising tax, if levied progressively and appropriately spent, can spur growth
and reduce inequality, furthering rights enjoyment.50 It shows National Treasury’s position is ideological
and premised on faulty economic theory.
41. Alternative financing mechanisms are available to the State Party that would maximize available
resources, improve equity and negate the need for austerity measures. Additional revenue can be raised
by modestly increasing PIT on top earners and CIT and raising or instituting new taxes on wealth, as
projections show.51 A range of other proposals have been advanced on how a fiscal stimulus can
be financed, which the Government has failed to address. These include: drawing on excess from
the over-capitalized Public Investment Fund, raising debt, ensuring domestic private savings flow into
government bonds, monetizing debt via the South African Reserve Bank (SARB) or direct transfers
undertaken by the SARB.52
2.5 Corruption and mismanagement are leading to extreme levels of unauthorized,
irregular and fruitless and wasteful expenditure
42. Corruption continues to be a major problem affecting the government’s ability to make use of the
maximum of its available resources for rights realization. According to the Department of Economic
Development, corruption costs South Africa no less than R27 billion per year, while 76,000 jobs which
could have been created are being lost through corruption.53 In 2017, South Africa was ranked 71 out
of 180 countries in the Corruption Perception Index (CPI), with a score of 43 out of 100.54 The 2013
CPI showed that South Africa dropped 34 places since 2001, with the decline of 17 places occurring in
just five years of President Jacob Zuma’s presidential administration.55
47 National Treasury of the Republic of South Africa, “Terms of Reference for the Independent Panel of Experts for the
Review of List of VAT Zero Rated Food Items.”
48 Goderhart, S & Pernegger, L, 2017. “Townships in the South African Geographic Landscape – Physical and Social
Legacies and Challenges.”
49 National Treasury of the Republic of South Africa, 2018. “Budget Review;” See also South African Reserve Bank, 2017.
“Tax Chronology of South Africa 1979-2016.”
50 SACTWU and COSATU, 2017. “‘Submission to the Davis Tax Committee on Possible Wealth Taxation in South Africa.”
51 Budget Justice Coalition, 2018. “Submission to the Standing Committee and Select Committee on Finance with respect
to the proposed 2018 National Budget.”
52 Institute for Economic Justice, 2018. “Policy Brief 2.4 Macroeconomy.”
53 BusinessTech, 2017. “Corruption costs SA GDP at least R27 billion annually, and 76 000 jobs,” BusinessTech,
September 1, 2017.
54 Transparency International, 2018. “Corruption Perceptions Index 2017.”
55 Corruption Watch, 2014. “Why is corruption getting worse in South Africa” at https://bit.ly/2gbAl5A
1043. Qualified and adverse audits against government departments, as well as public entities such as
state-owned enterprises (SOEs), are also rising. The most recent Auditor General’s report found that
nationally in 2016/17:56
! Unauthorized expenditure (not in accordance with the purpose for which funds were budgeted)
amounted to R1.5 billion, more than double 2015/16. Ten national and provincial departments,
mostly education and health, contributed to 93% of unauthorized expenditure.
! Irregular expenditure (not in accordance with procurement laws) reached R45.6 billion in 2016/17,
a 55% increase from the previous year. The sectors with the highest irregular expenditure were
health (R11.8 billion), transport (R6.4 billion) and education (R6.1 billion).
! Fruitless and wasteful expenditure (expenditure that could have been avoided) totaled more than
R1 billion in 2016/17, a very slight decrease from the previous year.
! A total of 28 public entities were identified as requiring intervention to avoid financial collapse, the
highest number on record.
44. Government bailouts for mismanaged and corrupt SOEs are also diverting funds from
social spending. In 2017/18, government authorized a R10 billion bailout of South African Airways and
a R3.7 billion bailout of the South African Post Office.57 That same year, capital (infrastructure)
expenditure by government was cut by R16.8 billion and spending on housing and community services
was cut by R3.3 billion, to give only two examples of cuts that were made. Corruption and
mismanagement at Eskom, the national power utility, has been the subject of inquiries by both National
Treasury and Parliament. Eskom’s total irregular expenditure now stands at more than R20 billion and it
is more than R600 billion in debt, with this debt burden (as noted above) being a primary justification for
austerity measures.58
45. Public sector corruption is impossible without corruption in the private sector, which is
also widespread. High profile law firms, public relations agencies, and auditors, have all been implicated
in the country’s biggest corruption scandals, the most notorious recent examples involving the Gupta
family. The consolidation of political power among a network of economic elites, commonly referred to
as “state capture,” has allowed for the “repurposing” of state institutions at all levels—central, provincial
and municipal—to become vehicles of enrichment rather than service delivery. 59
46. Public procurement has been grossly abused with the government having been described as
“a massive, tender-generating machine,” with its core functions almost completely outsourced.60
Procurement has become increasingly politicized, leading to illegal rent-seeking that undermines the
ability of South Africa’s public administration to deliver the services that are essential for the realization
of Constitutional rights.
47. While there has been notable progress in increasing transparency in the form of “opening up”
financial statements and annual reports, significant challenges remain in monitoring and
56 Auditor General of South Africa, 2017. “Consolidated General Report on National and Provincial Audit Outcomes
2016/17.”
57 National Treasury of the Republic of South Africa, 2018. “Budget Review,” pg. 90.
58 De Villers, J., 2018. “Eskom's debt is now more than SA's total budget for health and education - here are 4 things you
should know about its shocking numbers,” Business Insider SA, July 23, 2018.
59 Public Affairs Research Institute, 2017. “Betrayal of the Promise: how South Africa is being stolen;” See also, Office of
the Public Protector, 2016. “The State of Capture: a report of the Public Protector.”
60 Over the past 20 years, the value of goods and services the government purchases, largely from the private sector, has
reached between R400 billion and R500 billion per year. Public Affairs Research Institute, 2017. “Plundering the state in
the name of change will only perpetuate inequality.”
11prosecuting corruption. There is particular concern about how state capture has undermined the state
institutions and economic agencies tasked with combating corruption, including the South African
Revenue Service, Financial Intelligence Center, the National Prosecuting Authority and the Competition
Commission of South Africa, as well as the South African Police Service and its investigative units. There
are recent signs of progress, however.61
2.6 Increased public participation in budgetary processes is needed
48. South Africa and New Zealand were ranked by the Open Budget Survey 2017 as having the most
transparent budgetary process in the world. However, in terms of transparency of information, actual use
of information, and participation in the budget process by members of the public, South Africa ranks very
poorly.62 Budgets pass through Parliament at great speed with few members of the public able to attend
hearings or grapple with the details. In addition, Parliament has proved reluctant to challenge the National
Treasury, consistently failing to reject any measures proposed in the fiscal frameworks. Civil society
organizations are partnering with National Treasury to develop an Open Budget Data Portal for South
Africa, Vulekamali.gov.za, which a unique project that presents an opportunity to improve public access
to and use of budget information.
49. Transparency and participation are particularly weak in regards to decisions on revenue
generation. The decision to raise VAT was made without any public engagement and put forward in the
2018/19 National Budget as a fait accompli and none of the evidence National Treasury relied on has
been made public. Civil society concerns presented during public hearings on the 2018/19 National
Budget include: the failure to widely advertise the opportunity for public input; the lack of comprehensive
information available to the public; and the short timeframes for public input. The cumulative effect of this
is that the majority of people affected by the budget, as well as the organizations representing their
interests, do not have time to comprehend, communicate, consult and develop positions on the
proposals. This undermines their ability to meaningfully participate and reduces accountability.63
III. ISSUES RELATED TO SPECIFIC PROVISIONS OF THE COVENANT
50. This section details the impact that insufficient and inefficient resourcing is having on the delivery
of the infrastructure, goods and services necessary for the realization of rights. It illustrates how
retrogressive austerity measures have a disproportionate and discriminatory impact on the enjoyment of
these rights, affecting the minimum core content of rights for disadvantaged and marginalized individuals
and groups. It focuses on the rights to health and education, two areas where the effects of austerity are
already being felt and are likely to worsen significantly.
51. It shows how, within the context of highly unequal health and educational outcomes, diminishing
funding is severely affecting the quality of public healthcare and basic education, in a discriminatory
manner. In particular, human resource shortages and infrastructure backlogs are worsening. In the health
sector this is negatively impacting the transition to universal health care through National Health
Insurance (NHI) and causing an exponential rise in medical negligence claims. Funding cuts are having
61 In December 2017, for example, the National Prosecuting Authority’s Asset Forfeiture Unit (AFU) obtained preservation
orders worth R1.6 billion against global consultancy firm McKinsey and Gupta-linked Trillian, for illegally gained payments
that the companies received from Eskom. According to the acting head of the AFU, the NPA is pursuing 17 such matters,
to the estimated value of around R50 billion. Cowan, K, 2018. “R50-billion: The price state capture crooks will have to
pay,” Times Live, January 16, 2018. The Nugent Commission of Inquiry has been established to investigate the issues
which led to the undermining of the revenue services (SARS), while a Commission of Inquiry into State Capture is
underway, headed by Deputy-Chief Justice Raymond Zondo.
62 Kruuse, J, 2017. “South Africa leads on budget transparency but disappoints in fostering public participation in the
budget process,” Public Service Accountability Monitor (PSAM) editorial at https://bit.ly/2C4Lqn1
63 Parliament Watch, 2018 “Submission presented to the 2018/19 Budget Public Hearings” at https://bit.ly/2MHroUQ
12a similar impact on basic education, causing violations of minimum core obligations that risk being further
exacerbated by discriminatory shifts in spending from basic to tertiary education.
3.1 The gains of expanded social spending since 1994 are being eroded as a result of
austerity induced budget cuts and re-prioritizations
52. Since 1994, large amounts of public money have been directed towards economic, social and
cultural rights; building millions of houses, investing in public health care and education, and establishing
a social security net that now covers more than 17 million people.
53. However, annual spending began to stagnate around 2012, and since at least 2016, government
has undertaken austerity measures that prioritize reigning in public debt and narrowing the budget deficit.
Part II above showed that for the past three years, non-interest expenditure has failed to keep up with
population growth, resulting in declining per capita expenditure. The government is well aware that this
will lead to rights deprivations, stating in the 2018 Budget Review that “The reductions discussed above
[to housing, education and health budgets] will affect service delivery by delaying the rollout of some
housing, school and health infrastructure projects. And reducing the provincial equitable share will make
it difficult for provinces to continue to maintain education and health priorities”.64
3.2 ARTICLE 12 | THE RIGHT TO HEALTH
54. Unequal access to health care in South Africa reflects the socioeconomic inequalities discussed
above. For example, a third of the poorest 10% of South Africans live at least 20 kilometers away from a
hospital, while this is only true of a tenth of the richest 10%.65 Health outcomes also diverge along these
lines. For example, life expectancy in the Western Cape (a wealthier province) is over 10 years longer
than in Free State (a poorer province).66 Inequities in health outcomes such as these are maintained by
highly unequal expenditure per person on private and public health, and illustrate the need for increased
investment to strengthen the public health system.
55. Consolidated (national and provincial) spending on health care was cut by -0.1% in real terms in
2018/19.67 This reduced the percentage of GDP that the government spends on public health from 4.1%
in 2017/18 to 4.0% in 2018/19.68 This cut in overall funding, coupled with an estimated 740,000 additional
uninsured people entering the public health system (through births and migration) meant that health
expenditure per uninsured person has decreased.69 Within the health budget, R820 million was cut
from the Health Facility Revitalization Grant (which pays for upgrades and maintenance of health facilities
such as clinics and hospitals),70 while extreme pressure has been placed on departmental budgets for
wages and goods and services.
56. These cuts are made in the context of an already overburdened public health system that is
struggling to deal with a rising burden of disease and high medical price inflation. An exodus of skilled
health professionals to the private sector due to poor working conditions and unpaid benefits is adding
64 National Treasury of the Republic of South Africa, February 2018. “Budget Review” pg. 75.
65 Sulla, V, and Zikhali, P, 2018. “Overcoming Poverty and Inequality in South Africa: An Assessment of Drivers,
Constraints and Opportunities.” World Bank Group. pg. 23.
66 Weyss, B, Webster, D and Selebalo, H, Monitoring the right of access to healthcare in South Africa: An Analysis of
Health Budgets and Indicators, (2017) Working Paper 17, Studies in Poverty and Inequality Institute, pg. 65.
67 National Treasury of the Republic of South Africa, February 2018. “Budget Review,” Table 8, and own calculations.
68 National Treasury of the Republic of South Africa, February 2018. “Budget Review,” Table 3.2 and Table 8, and own
calculations.
69 National Treasury of the Republic of South Africa, February 2018. “Budget Review.” From R4 355 in 2017/18 to R4 284
in 2018/19 (in constant 2018/19 Rands).
70 National Treasury of the Republic of South Africa, February 2018. “Budget Review,” pg. 60.
13to woes and causing retrogression of services in many provincial health departments.71 The Minister of
Health has acknowledged that the health system suffers from widespread “overcrowding, long waiting
lists for treatment, irregular buying of goods, poor financial management and a chronic shortage of human
resources.”72
Arbitrary ceilings for wage expenditure exacerbate existing staff shortages
57. Reducing the public sector wage bill is a central tenet of austerity. This policy is particularly
targeted at provinces; the number of government employees has been reduced from 923,646 in 2013 to
888,204 in 2017.73 Government argues that despite these headcount reductions, spending on
government employees has continued to increase over the past three years. However, this increase has
been minimal, at 1-2% above inflation,74 illustrating that the government’s claim that growth of wage-
related expenditures requires it to introduce cuts is exaggerated at best.
58. Yet, in its 2019 Guidelines for Costing and Budgeting for Compensation of Employees, the
Treasury states that despite “compensation baseline reductions of R10 billion in 2017/18 and R15 billion
in 2018/19” … “No additional funding will be made available to directly fund the costs associated with the
[new 3-year public sector] wage agreement.75 The Treasury Guidelines state further that “Departments
are expected to thoroughly explore strategies available for headcount management.”76 Treasury even
commits to assisting departments to get rid of staff by providing additional funding where necessary to
help departments to pay for severance packages and early retirement packages.77
59. This policy is resulting in critical staff shortages and hampering the expansion of health
professionals necessary to improve levels of care and prepare the country for the transition to NHI. The
fact that the capacity of departments is being eroded in order to save immediate in-year costs to reduce
the budget deficit, is having deleterious consequences in many government departments and resulting
in retrogressive health outcomes and rights deprivations.
THE IMPACTS OF AUSTERITY ON THE RIGHT TO HEALTH: THE ILLUSTRATIVE CASE OF THE GAUTENG
DEPARTMENT OF HEALTH
Evidence of “a system on the verge of collapse”, as the nation's Health Ombud recently described South
Africa’s public health system, abounds.78 The North West Department of Health was placed under national
government administration in April 2018.79 An Intervention Task Team was established in late 2017 to
develop a strategy for turning around the cash-strapped and crisis-ridden Gauteng Department of Health
(GDoH), in the country’s richest province.80
In early 2018, senior clinicians from the GDoH approached SECTION27, determined to avert a large-scale
crisis in the department. They provided first-hand evidence of how an unofficial and unplanned hiring freeze
71 Chambers, D, 2017. “This is why doctors quit public healthcare - or leave SA altogether,”
Business Day, July 3, 2017 at https://bit.ly/2wvDKnY
72 Mkize V, 2018. “Health minister outlines plan of action,” News24, June 10, 2018 at https://bit.ly/2MHXYWk
73 National Treasury of the Republic of South Africa, 2018. “Budget Review,” pg. 75.
74 National Treasury of the Republic of South Africa, 2018. “Budget Review,” and own calculations.
75 National Treasury of the Republic of South Africa, 2018. “Guidelines for Costing and Budgeting for Compensation of
Employees,” at https://bit.ly/2ynxnY8, guidelines 1.1. and 3.1.
76 National Treasury of the Republic of South Africa, 2018. “Guidelines for Costing and Budgeting for Compensation of
Employees,” guideline 3.2.
77 National Treasury of the Republic of South Africa, 2018. “Guidelines for Costing and Budgeting for Compensation of
Employees”, guideline 3.2.
78 ENCA, 2018. “SA healthcare system on verge of collapse: Health Ombudsman”, at https://bit.ly/2MFqEPL
79 Gerber, J, 2018. “Cabinet places North West health dept under administration”, News24, April 26 2018.
80 Nicolson, G, 2017. “Gauteng Health: Team to save provincial department announced”, Daily Maverick, November 27,
2017.
14was being implemented in a desperate attempt to cut the wage bill, with disastrous consequences both for
the overworked staff that remained and for the service being provided to patients.
The hiring freeze was negatively impacting accessibility of basic health services, including:
• An increase in the neonatal (newborn) mortality rate to 30% at a large district hospital, well above
the national average of 3%.
• A scaling back of cardiology services at a number of health facilities
• Downscaling the availability of out-patient services by 10%.
• Increasing waiting times for women to see a gynecologist.
• Some hospitals, including Helen Joseph, a tertiary hospital with a catchment population of one
million people, frequently closing their accident and emergency wards to walk-ins.
Further, the deteriorating quality of care was resulting in a significant rise in financially damaging medico-
legal claims, the liabilities from which have now reached more than half of the department’s annual budget.81
Despite their commitment to improving public health, the doctors described how medical professionals of
all kinds were defecting to the private sector in return for better working conditions. Strikes have become a
regular occurrence in the province and in some cases have resulted in health facilities, including
Johannesburg General Hospital, being effectively shut down, with patients denied access to treatment.82
60. Departments of health in other provinces are also suffering under the burden of harsh and arbitrary
expenditure ceilings that are causing similar, though less well documented, challenges.83 The Minister of
Health himself acknowledges the “chronic shortage of human resources”.84 The application of austerity
to health budgets, including wages, is certain to make the situation worse and is directly contributing to
widespread violations of the right of access to health care services.
Cuts to goods and services budgets are forcing departments deeper into arrears, compounding
already difficult conditions for businesses that contract with government
61. Austerity measures have also contributed to a rapid growth of unfunded commitments or accruals
(costs incurred, but in the absence of sufficient funding, rolled over to the following financial year). To
meet those financial obligations which are hardest to avoid, such as wages, operational health budgets
are cut or invoices simply unpaid. This affects everything from the procurement of medicine to the
disbursement of bursaries to medical students. The more this happens the more it has a cumulative
knock-on effect on budgets, as commitments from a previous year are then paid from the next year's
budget.
! The Mpumalanga Department of Health accumulated accruals of R1.3 billion in 2017/18.85
! The Gauteng Department of Health owed 1,576 suppliers R3 billion at December 2017.86
! A joint sitting of the Portfolio Committees on Health and Finance found unfunded commitments in
the Eastern Cape, KwaZulu-Natal and Limpopo health departments were in excess of R20 billion
and growing.87
81 Gauteng Department of Health, 2017. “2016/17 Annual Report.”
82 Nicolson, G and Nthatep, A 2018. “Charlotte MAxeke hospital protests could have been avoided had government acted,”
Daily Maverick, June 01, 2018.
83 Dhai A and Mahomed S, 2018. “Healthcare in crisis: A shameful disrespect of our Constitution,” South African Journal
of Bioethics Law, 2018;11(1):8-10. DOI:10.7196/SAJBL.2018.v11i1.649, pg. 8.
84 Mkize V, 2018, “Health minister outlines plan of action.” News24, June 10, 2018.
85 Parliament of the Republic of South Africa, 2-18. “Select Committee Raises Serious Concerns with Performance in
Provincial Education and Health Departments.”
86 Mkize, V, 2017. “Gauteng health department is steeped in debt,” City Press, December 17, 2017.
87 National Treasury of the Republic of South Africa, 2017. “Presentation to the Joint Sitting of Portfolio Committees on
Finance and Health” at https://bit.ly/2MFqKa5
15You can also read